Aquaporin-4-dependent glymphatic solute transport in the rodent brain
- Humberto Mestre

- Weixi Feng
- Wenyan Zou
- Giridhar Murlidharan
- Virginia Plá
- Ting Du
- Xiaowen Wang
- Iben Lundgaard
- Yoichiro Abe
- Masato Yasui
- Ming Xiao
- Hajime Hirase
- Aravind Asokan
- Jeffrey J Iliff
- Maiken Nedergaard
- University of Rochester Medical Center, United States
- University of Copenhagen, Denmark
- Nanjing Medical University, China
- RIKEN Center for Brain Science, Japan
- Ochanomizu University, Japan
- The University of North Carolina, United States
- Oregon Health and Science University, United States
- Haukeland University Hospital, Norway
- Lund University, Sweden
- Keio University, Japan
- University of Rochester, United States
- Saitama University, Japan
- Duke University School of Medicine, United States
Figures
Figure 1
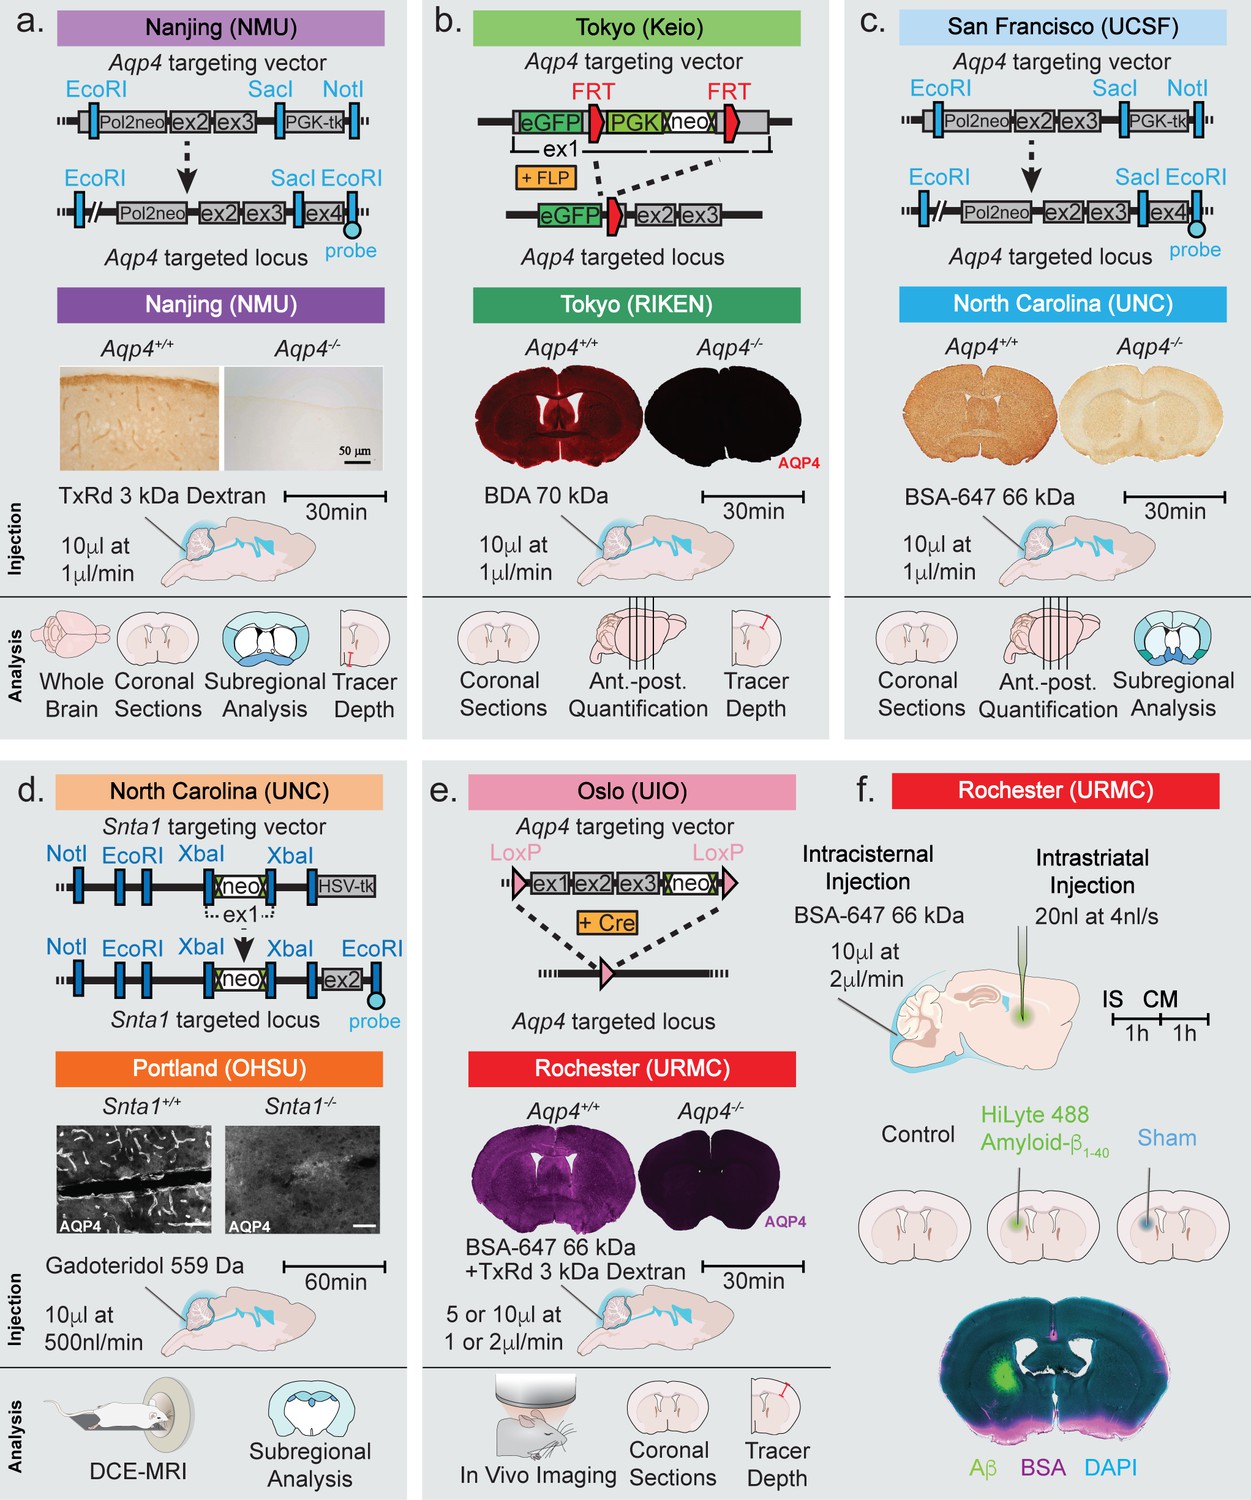
Strategy used for generation of KO mice and the experimental design of the study.
Top row of each panel represents the institution where the line originated from and the strategy used to generate the four global Aqp4 KO mice and the Snta1 KO mice. Second row of each panel shows the five labs that collected data on glymphatic system function in the five transgenic mouse lines: (a) Nanjing Medical University (NMU), (b) RIKEN Center for Brain Science (RIKEN), (c) University of North Carolina (UNC), (d) Oregon Health and Science University (OHSU), (e) University of Rochester Medical Center (URMC). (a-e) Immunohistochemical analysis showing the lack of AQP4 expression in the global KOs and (d) lack of perivascular AQP4 localization in Snta1 KO compared to WT mice. Scale bar: 50 µm. (a-e) Third row displays the volume and rate used for the intracisterna magna (CM) injections for each experiment, the tracer used, and the experiment duration. Note that URMC collected two full data sets using an injection rate of either 1 or 2 µl/min. (a-e) The last row display the analyses strategy employed by each of the five research group in Figures 2–6. (f) Additional experiments performed in Figure 7 tested the effect of intrastriatal (IS) injection on global glymphatic function. TxRd, Texas Red; BDA, biotinylated dextran amine; BSA-647, bovine serum albumin-Alexa Fluor 647; DCE-MRI, dynamic contrast-enhanced magnetic resonance imaging.
Figure 2
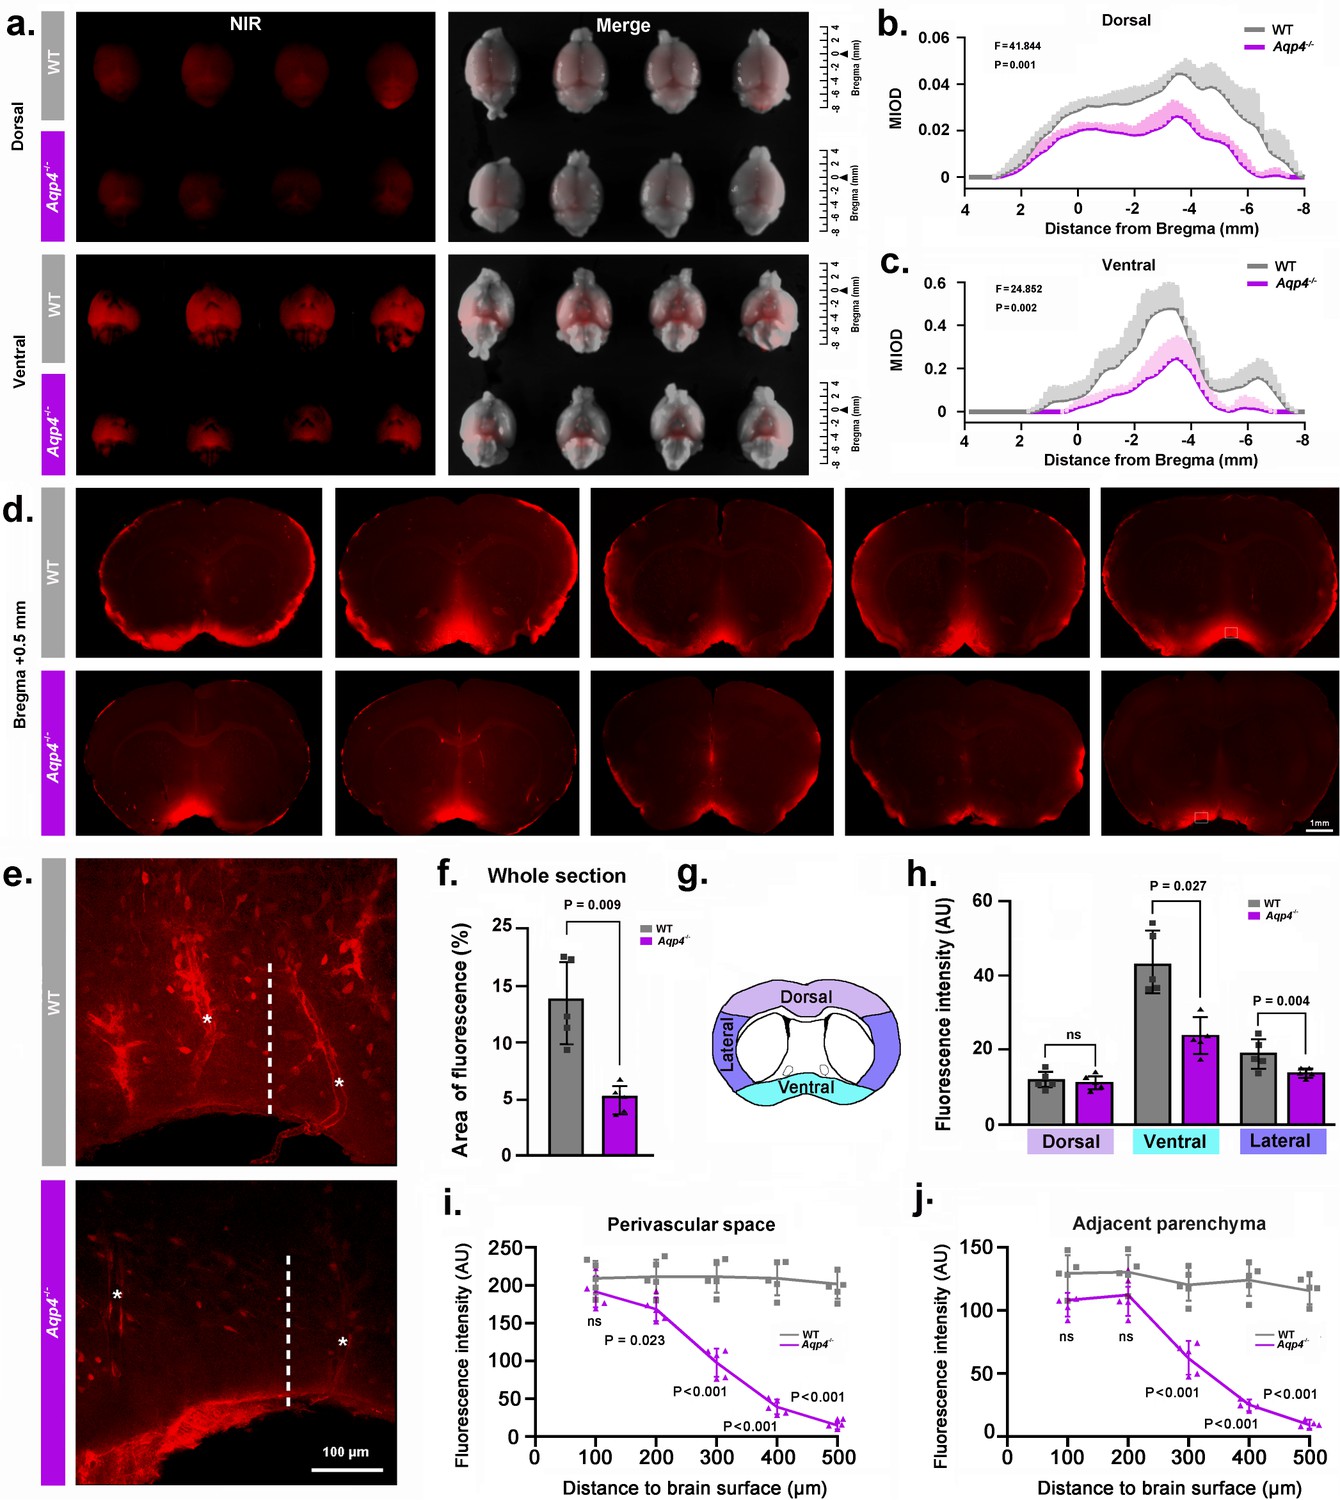
NMU: Aqp4 gene deletion reduced the penetration of intracisternally injected tracer into the brain parenchyma.
Texas Red-conjugated dextran (TRd3, 3kD) was injected intracisternally into WT and Aqp4 KO mice. Thirty minutes after injection, the anesthetized animals were perfusion fixed, and the fluorescence was evaluated ex vivo. (a) Representative near infrared (NIR) fluorescence images of the dorsal and ventral whole-brains of four mice per genotype. (b-c) Quantification of the mean integrated optical density (MIOD) of TRd3 on the dorsal (b) and ventral (c) brain surface of WT (grey) and Aqp4 KO (purple) mice from 4.0 mm anterior to 8.0 mm posterior to bregma. (d) Representative images of coronal brain sections at +0.5 mm from bregma from five pairs of WT and Aqp4 KO mice showing TRd3 distribution within the brain. (e) High magnification micrographs of the hypothalamus (lined area in d) showing the fluorescence intensity of TRd3 within the perivascular space (star) and adjacent brain parenchyma (dotted line) of WT mice and Aqp4 KO mice, respectively. (f) Quantification of the percentage area of whole-slice fluorescence of the both genotypes for 6–8 forebrain sections (+1.7 to −0.7 mm from bregma) of each mouse. (g) Diagram showing the subregional analysis of brain sections at the level of 0.5 mm anterior to bregma. (h) Quantification of the mean fluorescence intensity (AU, arbitrary units) of TRd3 of the dorsal, ventral and lateral brain regions, respectively. (i-j) Quantification of the mean fluorescence intensity of TRd3 along the perivascular space and the interstitium adjacent to the vessels under the ventral surface of the hypothalamus of the both genotypes. Shades and error bars represent standard deviation. Data in Figure 2b and c were analyzed by repeated-measures ANOVA, N = 4 per group. Data in Figure 2f,h,i and j were analyzed by Student’s t-test. p-Values shown are comparisons between WT and Aqp4-/-. ns: not significant (Figure 2—source data 1).
-
Figure 2—source data 1
Source data for Figure 2.
- https://doi.org/10.7554/eLife.40070.004
Figure 3
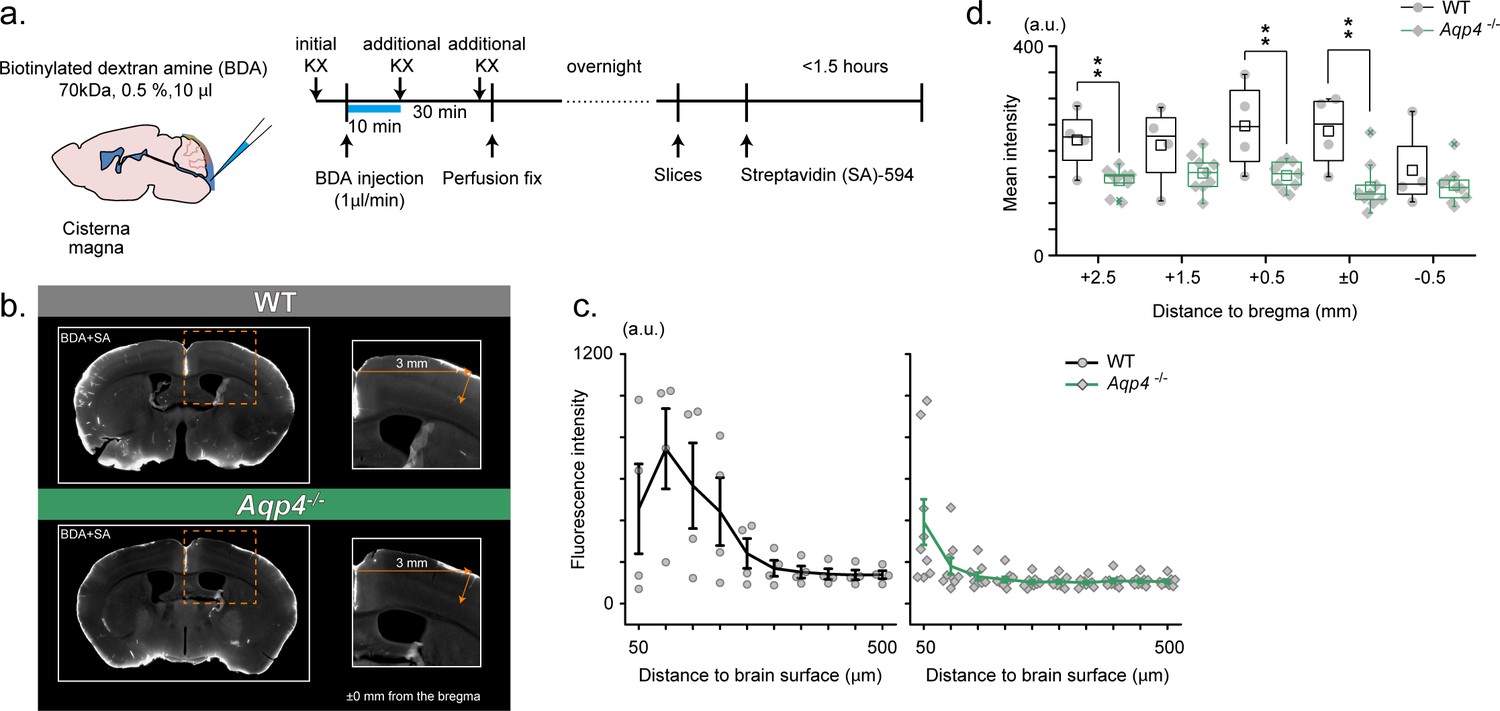
RIKEN: Aqp4 -/- mice display compromised CSF tracer infiltration under ketamine-xylazine anesthesia.
(a) Schematic diagram for CM injection of BDA tracer (left) and experiment schedule (right). (b) Examples of SA-enhanced BDA distribution 30 min after CM injection. Slices at an anterior-posterior position of bregma are presented for WT (upper) and Aqp4-/- (lower) mice. Depth profile is calculated for the cortical position 3 mm lateral to the midline. (c) Mean depth profiles of SA-enhanced BDA signals for WT (black, N = 4) and Aqp4-/- (green, N = 9) mice. (d) Mean SA-enhanced BDA signal intensities (3 mm lateral to the midline, depths 0–800 µm) along anterior-posterior positions for WT (black) and Aqp4-/- (green) mice. Shades and error bars represent SEM. *p < 0.05, **p < 0.01, t-test (Figure 3—source data 1).
-
Figure 3—source data 1
Source data for Figure 3.
- https://doi.org/10.7554/eLife.40070.006
Figure 4

UNC: CSF tracer influx is decreased in Aqp4 KO mice.
(a) Coronal sections from a C57BL/6 wild-type mouse (WT), CD1 background strain control (Aqp4+/+), and Aqp4 KO mice (Aqp4-/-) showing a fluorescent CSF tracer, BSA-647 and co-labeling with DAPI. Scale bar: 1 mm (b) Mean pixel intensity in arbitrary units (A.U.) for six brain sections of each mouse for all three groups. n = 3 (WT), 7 (Aqp4+/+), 6 (Aqp4-/-). One-way ANOVA Tukey’s multiple comparisons test, Interaction term: p = 0.0110, F = 6.512, ns: not significant. (c) Diagram showing the anterior-posterior range of the quantified coronal sections relative to bregma from (b). (d) Quantification of the slices shown in (c) + 1.2 to −1.8 mm from bregma. Repeated measures two-way ANOVA with Tukey’s multiple comparisons test, Interaction term: p = 0.038, F = 2.085, p values shown are comparisons of WT and Aqp4+/+ vs. Aqp4-/-. (e) Diagram depicting the ROIs included in the regional analysis of brain slices at +0.6 mm from bregma. CPu: caudoputamen; HT: hypothalamus; BF: basal forebrain; DC: dorsal cortex; LC: lateral cortex; VC: ventral cortex. (f) Mean pixel intensity of brain regions shown in (e) for coronal sections + 0.6 mm from bregma. Repeated measures two-way ANOVA Tukey’s multiple comparisons test, Interaction term: p < 0.0001, F = 8.109. Data is presented as mean ±SEM (Figure 4—source data 1).
-
Figure 4—source data 1
Source data for Figure 4.
- https://doi.org/10.7554/eLife.40070.008
Figure 5
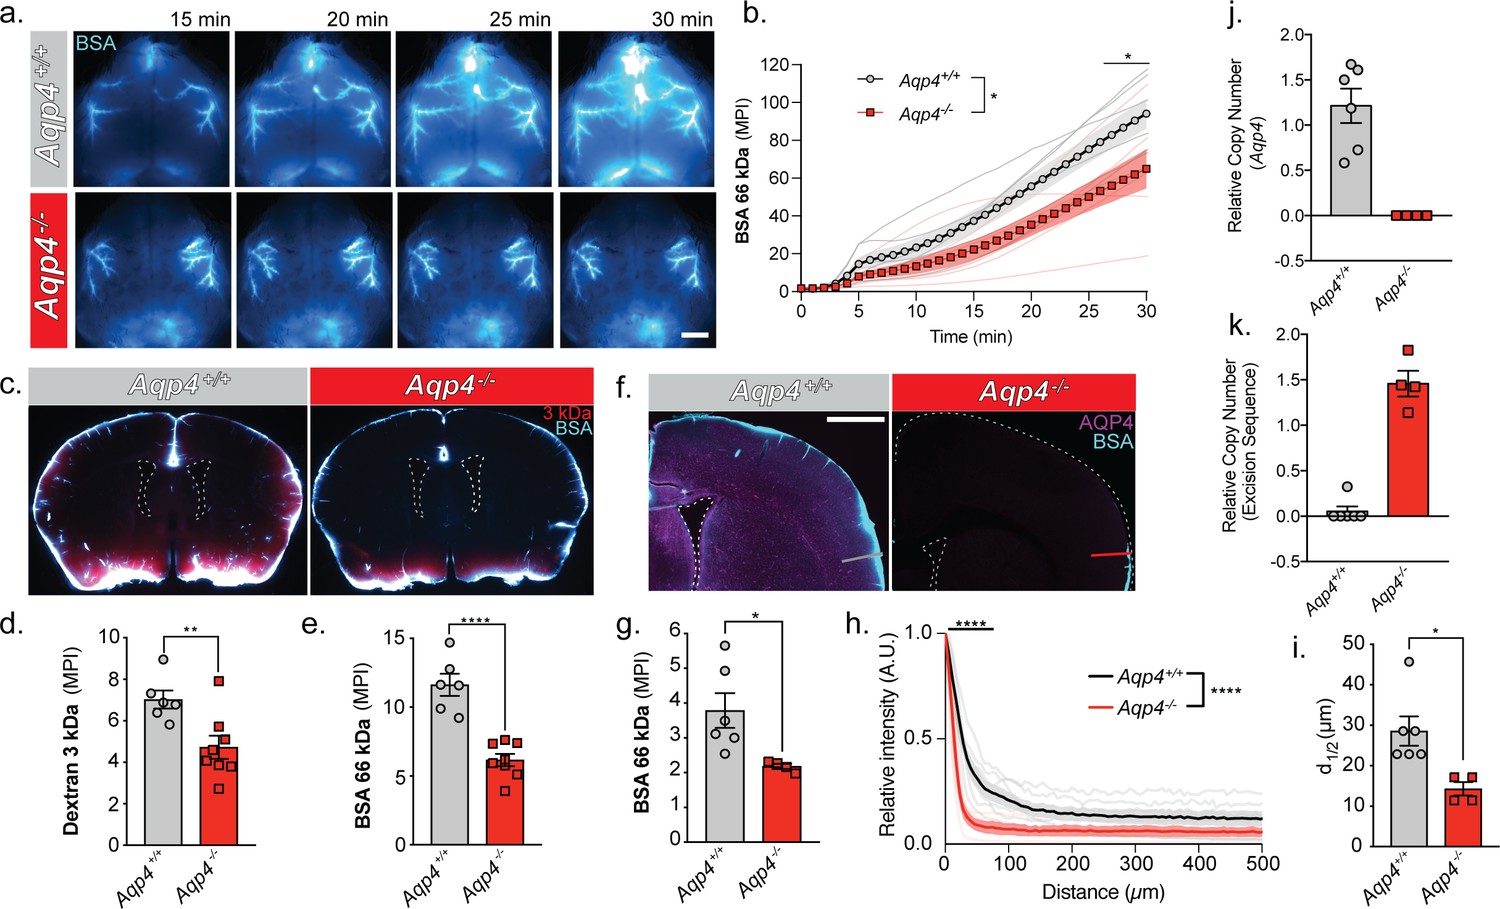
URMC: Glymphatic influx of CSF tracer is facilitated by AQP4.
(a) Representative images from an in vivo transcranial optical imaging experiment of a WT control mice (Aqp4+/+) and Aqp4 KO (Aqp4-/-) mice starting at 15 min after intracisternal delivery of 10 µl (2 µl/min) of a 66 kDa fluorescent tracer, BSA-647. Scale bar: 2 mm. (b) Mean pixel intensity (MPI) of BSA-647 over a 30 min experiment, imaging was started at the beginning of the injection. Two-way repeated measures ANOVA with Sidak’s multiple comparisons test, overall model *p = 0.0329, multiple comparisons *p < 0.05; n = 6–7/group. (c) Coronal sections collected 30 min after intracisternal injection of two varying molecular size tracers, 3 kDa Texas Red dextran and BSA-647. Mean pixel intensity for a (d) 3 kDa dextran and (e) BSA from six coronal sections between +1.2 and −1.8 mm from bregma for each animal. Two-tailed unpaired t-test, **p = 0.0097, ****p < 0.0001; n = 6–8/group. (f) Coronal section from an Aqp4+/+ mouse stained and imaged for AQP4 (magenta) and BSA-647 tracer (cyan). (g) Mean pixel intensity from a replicate experiment quantified the same as (e). Two-tailed unpaired t-test, *p = 0.0335, n = 4–6/group. (h) Mean tracer penetration depth profiles normalized to the fluorescence at the pial surface of a coronal section at bregma from the set of experiments displayed in (g). The line was placed orthogonal to the cortical surface at the most dorsal position where tracer could be found at the pial surface (f). Tracer depth in the WT mice was measured at the same position as the KO mouse. Two-way repeated measures ANOVA with Sidak’s multiple comparisons test, overall model ****p < 0.0001, multiple comparisons ****p < 0.0001, n = 4–6/group. (i) Cortical depth at which the fluorescence at the surface decreases by half for the profiles in (h). Two-tailed unpaired t-test, *p = 0.0161, n = 4–6/group. (j) Relative copy numbers (RCN) of the Aqp4 gene locus and the excision sequence (k) showing successful deletion of Aqp4 exon 1–3. RCN was quantified by qPCR for mice used in the experiment in (g). Data expressed as mean ±SEM (Figure 5—source data 1).
-
Figure 5—source data 1
Source data for Figure 5.
- https://doi.org/10.7554/eLife.40070.010
Figure 6

Deletion of the adapter protein α-syntrophin impairs AQP4 perivascular localization, and CSF influx into the brain parenchyma.
Dynamic contrast enhanced magnetic resonance imaging (DCE-MRI) was acquired on a 11.75 preclinical MRI scanner, and was used to characterize the effect of α-syntrophin deletion on gaditeridol influx into the brain. Representative images of AQP4 perivascular localization in wild-type mice (a), and the loss of perivascular localization of AQP4 seen in the Snta1-/- mice (b). Scale bar: 50 µm, inset scale bar: 10 µm. (c-h) Coronal slice of T1-weighted images acquired by DCE-MRI demonstrate the reduced influx of gaditeridol contrast agent into the parenchyma in Snta1-/- mice relative to wild-type mice at 30 and 60 min. Scale bar: 1 mm. (i-n) Quantification of T1 weighted signal in various brain subregions normalized to baseline at each time point. Traces for each individual animal are presented (lines) along with the summary statistics (mean ±SEM, two-way ANOVA). WT n = 5, ASYNKO n = 7. CTx = cortex (p = 0.0035) Hip = hippocampus (p = 0.0003) Subcortical = subcortical regions (p = 0.0185) 3V = 3rd Ventricle (p = 0.0284) Total (p = 0.0085) (Figure 6—source data 1).
-
Figure 6—source data 1
Source data for Figure 6.
- https://doi.org/10.7554/eLife.40070.012
Figure 7
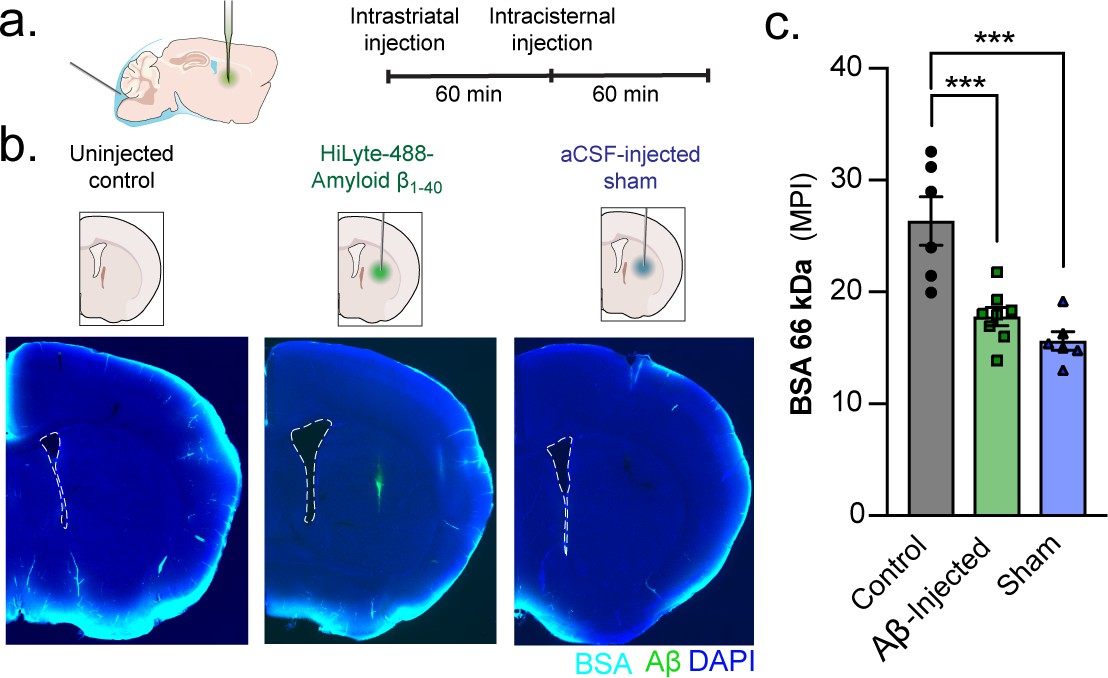
A unilateral intrastriatal injection reduces global glymphatic function.
(a) KX-anesthesized mice received an injection into striatum. After injection, the glass capillary was slowly removed and the skull sealed with silicone elastomer. One hour later, mice received an intracisternal injection of a 66 kDa BSA-647 tracer and brains were removed and drop fixed 60 min later. (b) Control mice only received the intracisternal injection but not the intrastriatal injection. Mice that received an intrastriatal injection were injected with either HiLyte 488-amyloid-β1-40 or an aCSF sham. (c) Global glymphatic tracer influx was quantified from a total of six coronal sections between +1.2 and −1.8 mm from bregma for each animal. Ordinary one-way ANOVA posthoc Tukey’s multiple comparisons test, Control vs. Aβ-injected: ***p = 0.0006; Control vs. Sham: ***p = 0.0001; n = 6–8/group (Figure 7—source data 1).
-
Figure 7—source data 1
Source data for Figure 7.
- https://doi.org/10.7554/eLife.40070.014
Figure 8
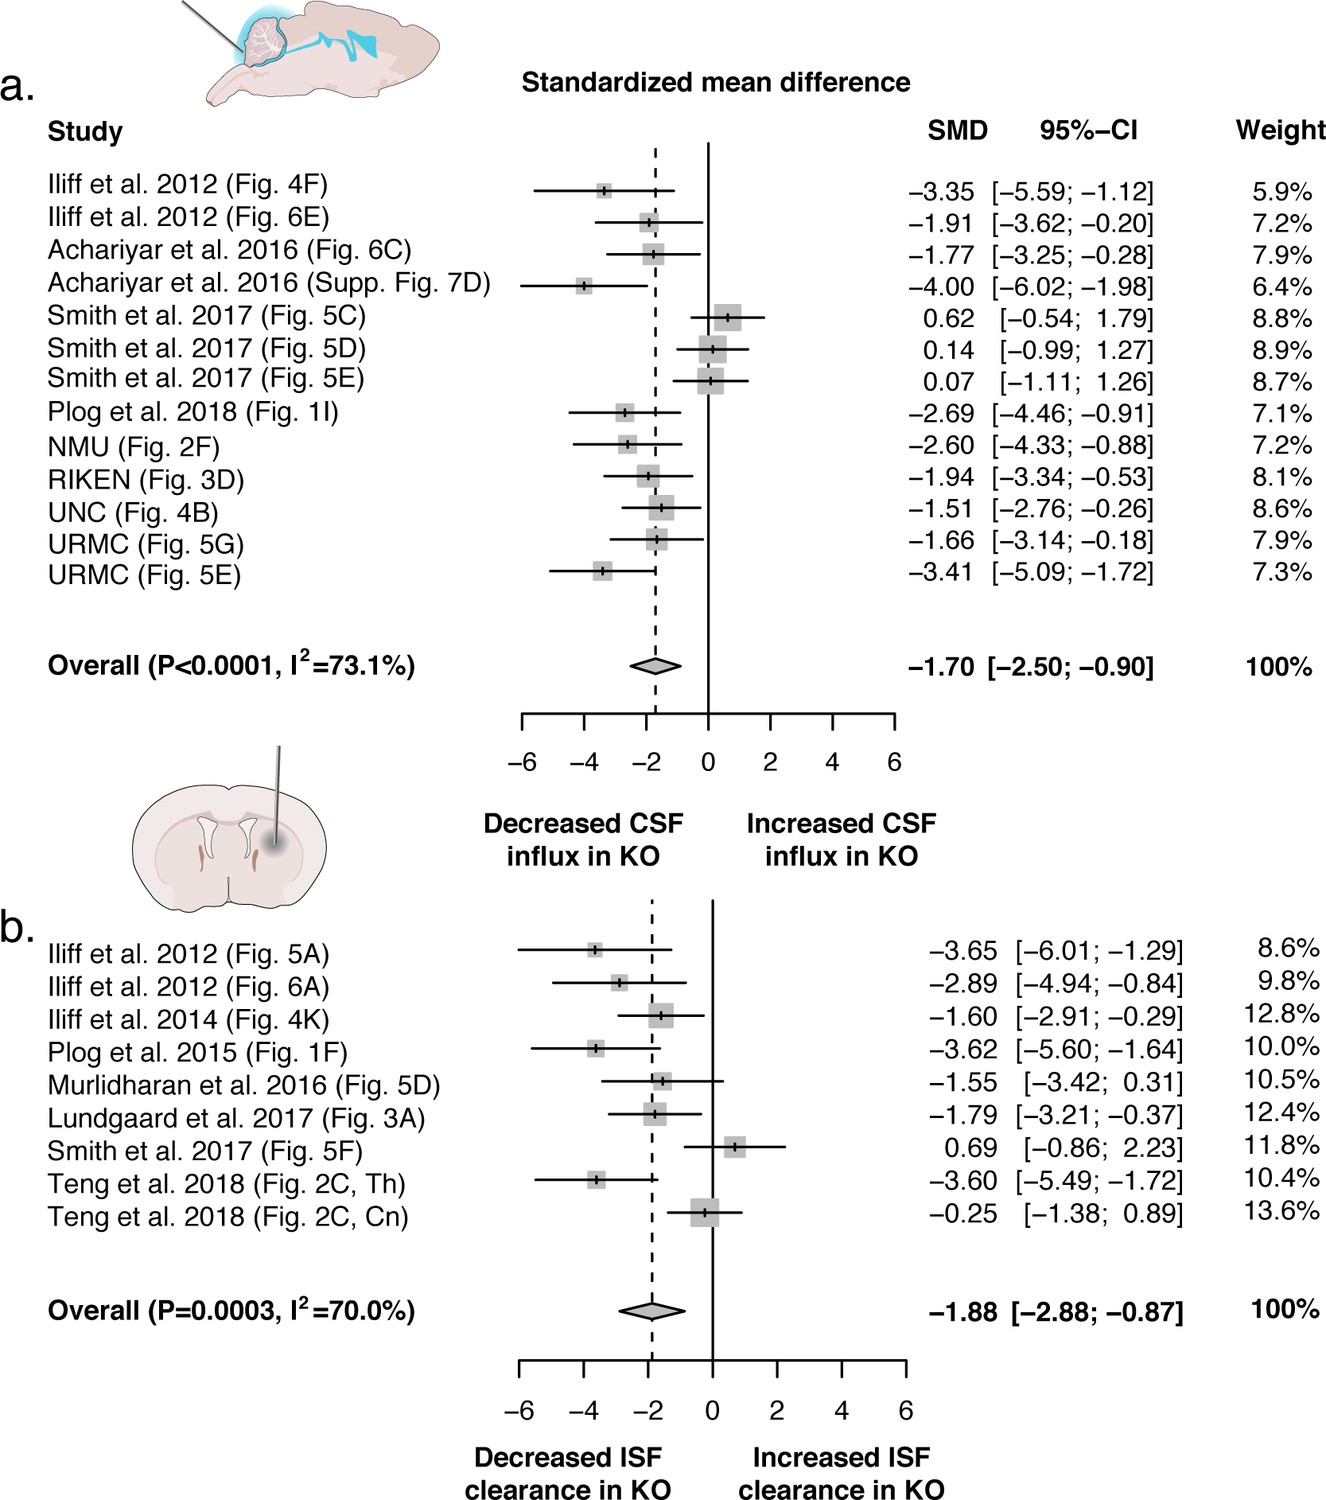
Evidence evaluating the role of AQP4 in CSF influx and ISF efflux.
(a) Meta-analysis from experiments that delivered either fluorescence- or radio-labeled tracers into the cisterna magna of both Aqp4 KO and wild-type rodents. (b) Meta-analysis from studies that delivered intracerebral tracers to evaluate clearance or transport of tracers out of the brain. p-Value is from the overall random effects model. Data in forest plots presented as standardized mean difference (SMD) with a 95% confidence interval (CI). Th: thalamus; Cn: caudate nucleus.
Tables
Key resources table
| Reagent type (species) or resource | Designation | Source or reference | Identifiers | Additional information |
|---|---|---|---|---|
| Gene (Mus musculus) | Aqp4 | MGI:107387 | ||
| Gene (Mus musculus) | Snta1 | NCBI_gene: 20648, MGI:101772 | ||
| Strain, strain background (Mus musculus) | Aqp4 null/eGFP knock-in mice | RIKEN BRC | RBRC06500; SJL.Cg-Aqp4<tm1.1(GFP) Mysi>/MysiRbrc; CDB0758K-1 | |
| Strain, strain background (Mus musculus) | Aqp4 knockout mice | PNAS 108, 846–851 (2011). PMID: 21187412 | OIU | |
| Strain, strain background (Mus musculus) | C57BL/6N | Beijing Vital River Laboratory Animal Technology Co., Ltd. | 213 | |
| Strain, strain background (Mus musculus, C57Bl/6J) | male wild type (WT) | Jackson Laboratories, 000664 | RRID:IMSR_JAX:000664 | |
| Strain, strain background (Mus musculus, C57BL/6NCrl) | male wild type (WT) | Charles River, 027 | RRID:IMSR_CRL:27 | |
| Strain, strain background (Mus musculus, C57Bl/6J) | male Snta1-/- | Jackson Laboratories, 012940, PMID:10995443 | RRID:MGI:2181419 | |
| Cell line (Mus musculus) | E14K ES | J Neurosci Res. 2005 Nov 15;82 (4): 458–64. PMID: 16237719 | 129P2/OlaHsd | |
| Transfected construct (Mus musculus) | AQP4 replacement targeting vector | J Neurosci Res. 2005 Nov 15;82(4): 458–64. PMID: 16237719 | Constructed using the positive– negative selection cassettes derived from the vectors pPolII long neo bpA and pXhoMC1TK, containing the neoR and HSVtk genes, respectively. | |
| Biological sample (Mus musculus) | CD1 blastocysts | Beijing Vital River Laboratory Animal Technology Co., Ltd. | 201 | |
| Antibody | anti-Aqp4 (rabbit polyclonal) | Sigma | A5971, RRID:AB_258270 | (1:1000) |
| Antibody | biotinylated- conjugated goat anti-rabbit IgG (polyclonal) | Vector Laboratories | BA-1000, RRID:AB_2313606 | (1:200) |
| Antibody | AQP4 (rabbit primary Ab) (polyclonal) | Millipore | AB3594, RRID:AB_91530 | (1:400–500) |
| Antibody | Alexa Fluor 594 (donkey anti-rabbit secondary Ab) (polyclonal) | ThermoFisher | A21207, RRID:AB_141637 | (1:500) |
| Antibody | Cy3-conjugated donkey anti-rabbit (polyclonal) | Jackson Immuno Research | 711-165-152, RRID:AB_2307443 | (1:500) |
| Sequence- based reagent | oligonucleotide primers of Aqp4 and excision sequence | Transnetyx | Probe ID: Aqp4-2 WT and Aqp4-2 KO | |
| Sequence- based reagent | oligonucleotide primers of Aqp4 and Neo | J Neurosci Res. 2005 Nov 15;82 (4) :458–64. PMID: 16237719 | AQP4 forward primer, ACC ATA AAC TGG GGT GGC TCA G; WT AQP4 reverse primer, TAG AGG ATG CCG GCT CCA ATG A; and Neo, CAC CGC TGA ATA TGC ATA AGG CA. | |
| Peptide, recombinant protein | Beta - Amyloid (1 - 40), HiLyte Fluor 488 - labeled, Human | Anaspec | AS-60491–01 | 0.5% in aCSF |
| Commercial assay or kit | Kwik-Cast | World Precision Instruments | KWIK-CAST | |
| Commercial assay or kit | Elite ABC Kit | Vector Laboratories | PK-7200 | |
| Chemical compound, drug | BDA | Molecular Probes/Thermo Fisher | D1957; BDA-70,000 | |
| Chemical compound, drug | Alexa-594-conjugated streptavidin (SA) | Molecular Probes/Thermo Fisher | S11227 | (1:1000) |
| Chemical compound, drug | Alexa Fluor 647 conjugated bovine serum albumin | Molecular Probes/Thermo Fisher | A34785 | 0.5–1% in aCSF |
| Chemical compound, drug | Texas Red conjugated dextran, 3000 MW, paraformaldehyde, chloral hydrate | Invitrogen, Sigma-Aldrich, Sigma-Aldrich | D3328, 158127, 47335 U | |
| Software, algorithm | ImageJ software | https://imagej.nih.gov/ij/index.html | RRID:SCR_003070 | |
| Software, algorithm | FIJI | RRID:SCR_002285 | ||
| Software, algorithm | MetaMorph Basic | Molecular Devices | RRID:SCR_002368 | |
| Software, algorithm | Matlab | Mathworks | RRID:SCR_001622 | |
| Software, algorithm | cellSens | Olympus | RRID:SCR_016238 | |
| Other | artificial CSF | Sigma-Aldrich | All componets in ACSF (concentrations in mM): 126.0 NaCl, 3 KCl, 2 MgSO4, 10.0 dextrose, 26.0 NaHCO3, 1.25 NaH2PO4, 2 CaCl2 are purchased from Sigma- Aldrich |
Additional files
-
Supplementary file 1
Dataset characteristics from the analysis in Figure 8a.
All experiments that delivered either fluorescence- or radiolabeled tracers into the cisterna magna of both Aqp4 KO and wild-type rodents used in the meta-analysis and meta-regression. SD: standard deviation; n: sample size; KO: knockout; KX: ketamine/xylazine; OA: ovalbumin; BDA: biotinylated dextran amine; BSA: bovine serum albumin; N/A: not reported.
- https://doi.org/10.7554/eLife.40070.016
-
Supplementary file 2
Dataset characteristics from the analysis in Figure 8b.
All studies that delivered intracerebral tracers to evaluate clearance or transport of tracers within or out of the brain. SD: standard deviation; n: sample size; KO: knockout; KX: ketamine/xylazine; N/A: not reported; Th: thalamus; Cn: caudate nucleus/striatum; *: value inferred from the text.
- https://doi.org/10.7554/eLife.40070.017
-
Supplementary file 3
Imaging parameters.
- https://doi.org/10.7554/eLife.40070.018
-
Transparent reporting form
- https://doi.org/10.7554/eLife.40070.019
Download links
A two-part list of links to download the article, or parts of the article, in various formats.
Downloads (link to download the article as PDF)
Open citations (links to open the citations from this article in various online reference manager services)
Cite this article (links to download the citations from this article in formats compatible with various reference manager tools)
Aquaporin-4-dependent glymphatic solute transport in the rodent brain
eLife 7:e40070.
https://doi.org/10.7554/eLife.40070


