Determining cellular CTCF and cohesin abundances to constrain 3D genome models
- University of California, Berkeley, United States
- Howard Hughes Medical Institute, United States
- European Molecular Biology Laboratory (EMBL), Germany
Figures
Figure 1 with 3 supplements
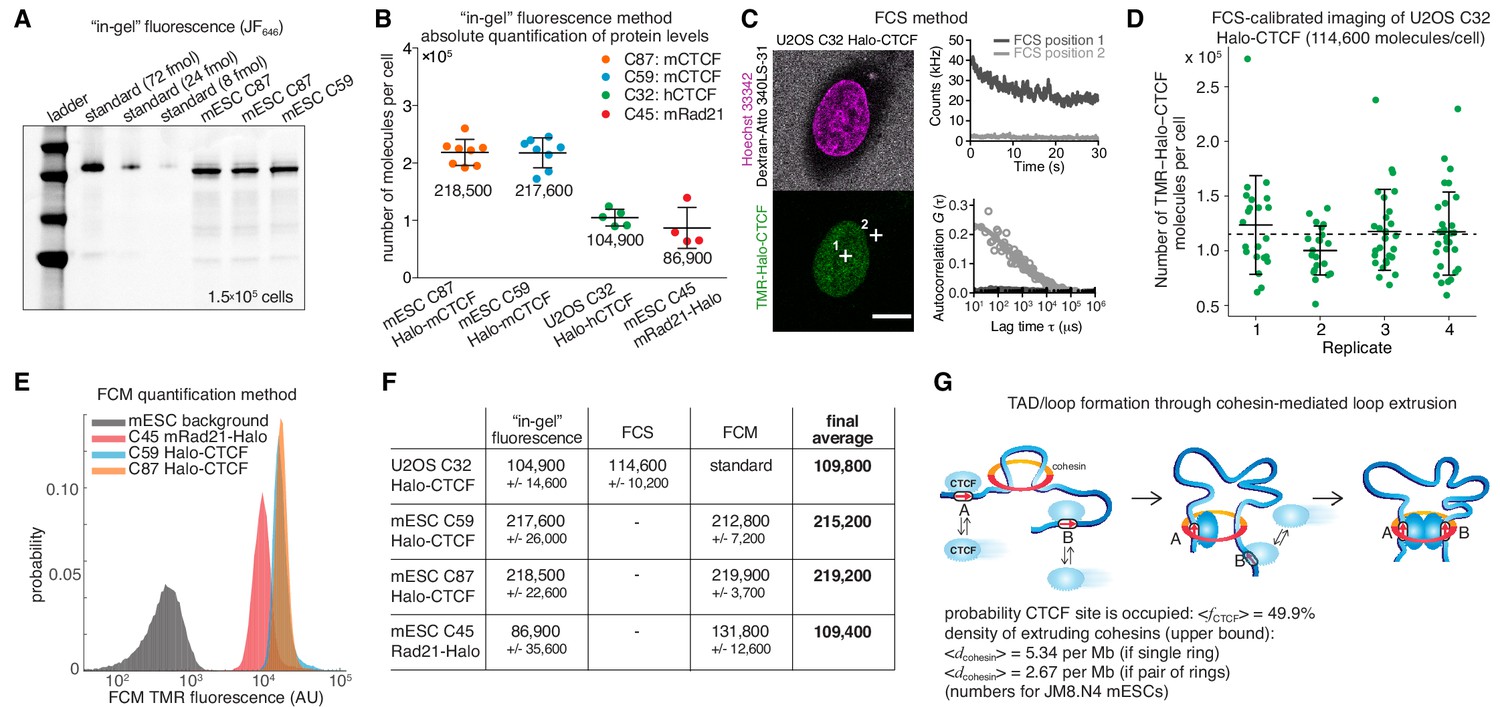
Absolute cellular CTCF and cohesin quantification.
(A) Representative SDS-PAGE gel showing a titration of purified and labeled JF646-3xFLAG-Halo-CTCF protein as a standard (first three lanes) side-by-side with JF646-Halo-CTCF from lysed mESCs (3 replicates of 150,000 cells each from two different clones and different replicates). (B) Absolute quantification as shown in (A) of mESC Halo-CTCF abundance (in two independent clones, (C87 and C59), of human U2OS Halo-CTCF (clone C32) and of mESC Rad21-Halo (C45). CTCF and Rad21 were homozygously tagged in all cell lines and by western blotting the expression levels were shown to be equivalent to the untagged protein levels in wild-type cells (Hansen et al., 2017). Each dot represents an independent biological replicate and error bars show standard deviation. (C) Representative FCS measurements at points (white crosses) in the nucleus (position 1) and cytoplasm (position 2) of a U2OS Halo-CTCF C32 cell labeled with TMR HaloTag ligand. Hoechst 33342 (DNA; magenta) and Atto 340LS-31 (labeled 500 kD dextran; cell boundary marker; gray) as well as TMR (Halo-CTCF; green) channels are shown. Scale bar: 10 µm (left panel). During FCS measurements photon counts at the indicated positions (position 1, nucleus, dark gray; position 2, cytoplasm, light gray) were recorded (upper right panel) and autocorrelation curves (circles) were computed and fitted to a two-component diffusion model (lines; lower right panel; see Materials and methods for details). These FCS measurements were the basis for FCS-calibrated imaging experiments to determine the number of Halo-CTCF molecules in U2OS C32 cells as plotted in (D). See Figure 1—figure supplement 2 and Materials and methods for details. (D) Four independent FCS-calibrated imaging experiments of randomly sampled interphase U2OS Halo-CTCF C32 cells labeled with TMR HaloTag ligand were performed. TMR-Halo-CTCF protein numbers were calculated for each cell (green dots; replicate 1: n = 22; replicate 2: n = 21; replicate 3: n = 29; replicate 4: n = 29). For each replicate, the mean number of TMR-Halo-CTCF molecules per cell as well as the standard deviation (error bars) are indicated. The mean calculated from the means of the four replicates is indicated as dashed line. The single-cell measurements revealed a broad distribution of Halo-CTCF abundance reflecting, amongst others, biological cell-to-cell heterogeneity of interphase cells. (E) Flow cytometry (FCM) quantification method. Representative replicate showing FCM-estimated TMR fluorescence of mESC lines: C45 Rad21-Halo, C59 Halo-CTCF, C87 Halo-CTCF as well as mESC background (without TMR labeling). (F) Table of average protein numbers per cell determined by different methods. The table provides mean ±standard deviation (std is calculated over each replicate) for each cell line and for each method. The ‘final average’ in bold is from averaging the different methods. (G) Sketch of hypothetical loop extrusion model, wherein cohesin extrudes chromatin loops until it is blocked by chromatin-bound CTCF. Below, calculation of fractional CTCF occupancy and density of extruding cohesin molecules. See Materials and methods for calculation details.
Figure 1—figure supplement 1
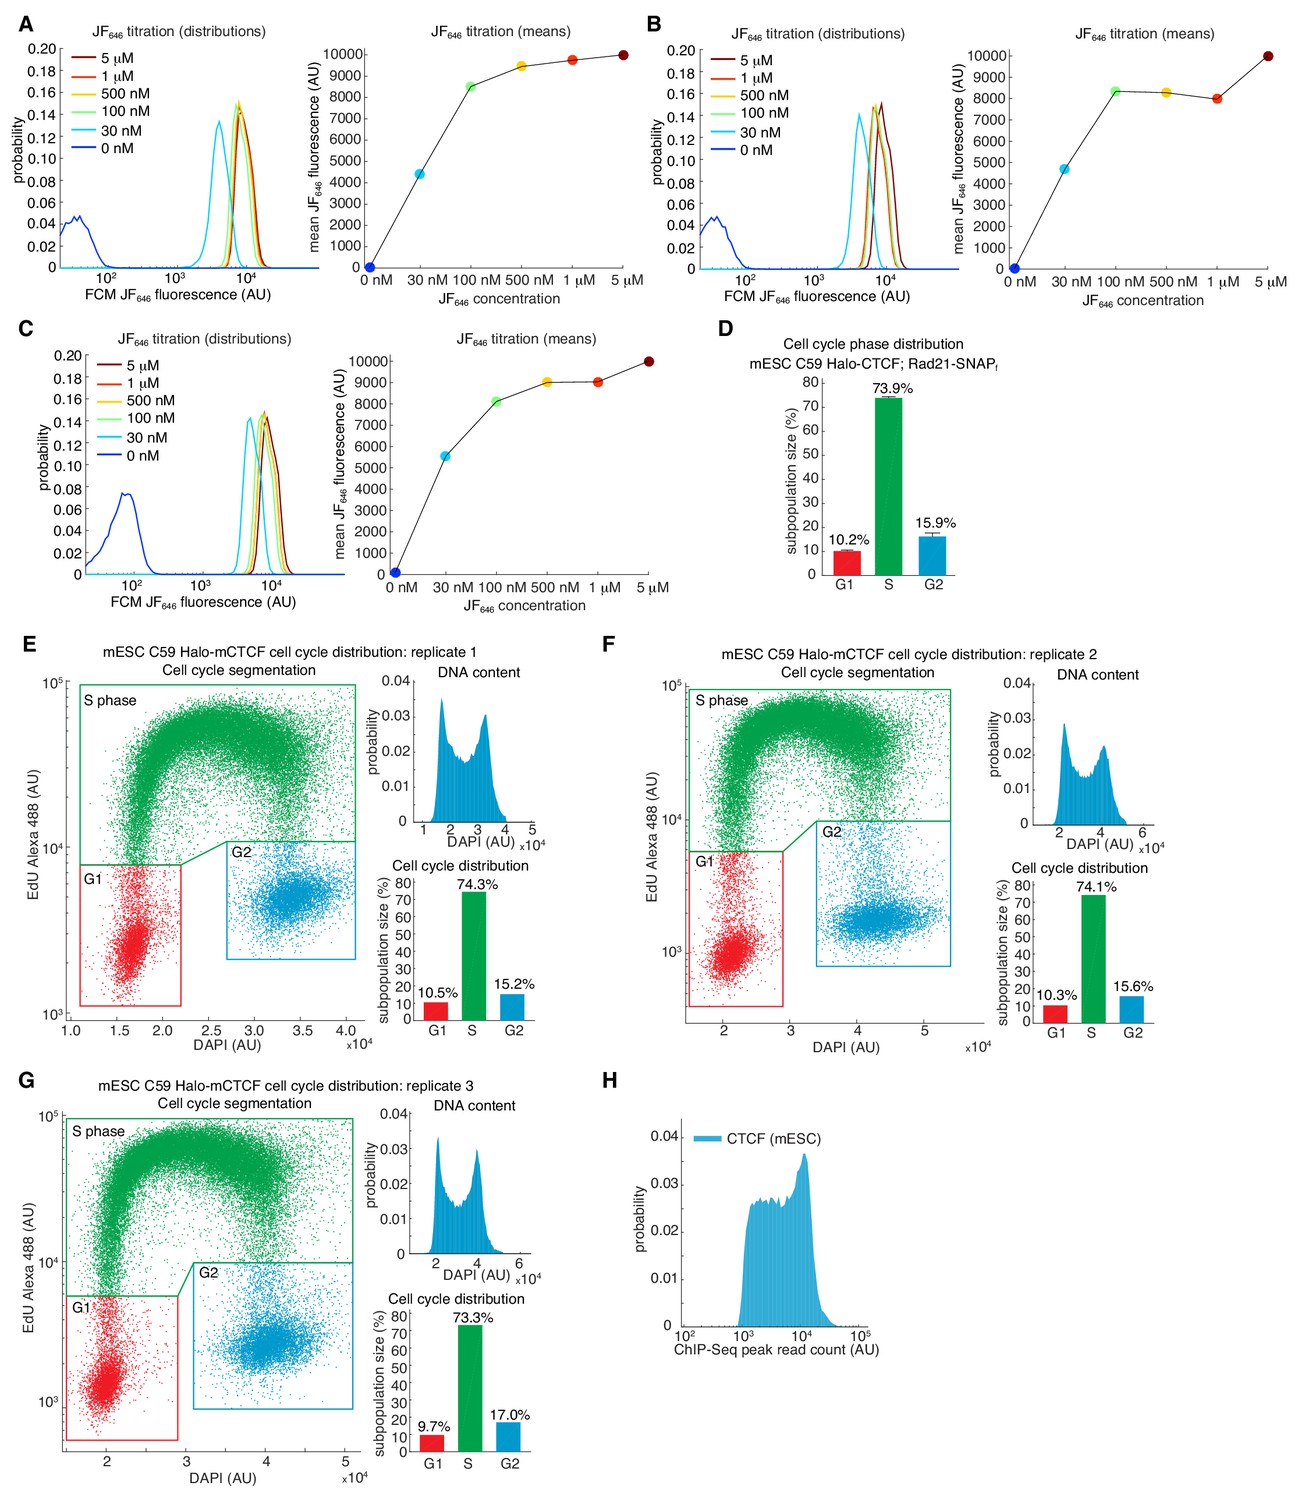
Estimating labeling efficiency and cell cycle phase distribution.
(A–C) Halo-JF646 titration. The labeling efficiency using Halo-JF646 dye and mESC C59 Halo-CTCF was estimated using flow cytometry (FCM) for the indicated dye concentrations. For full experimental details, please see Materials and methods. (A–C) shows three biological replicates. (D) Cell cycle phase distribution for mESC C59 Halo-CTCF cell line. Shows mean and standard deviation across the three biological replicates shown in (E–G). (E–G) Cell cycle phase distribution measured using flow cytometry using the Click-iT EdU Alexa Fluor 488 Flow Cytometry Assay Kit (ThermoFisher Scientific Cat. # C10425). Three biological replicates are shown and the DNA content was measured using DAPI staining. For full experimental details, please see Materials and methods. (H) Histogram of read counts at MACS2-called CTCF ChIP-Seq peaks using data for wild-type CTCF described in Hansen et al. (2017).
Figure 1—figure supplement 2
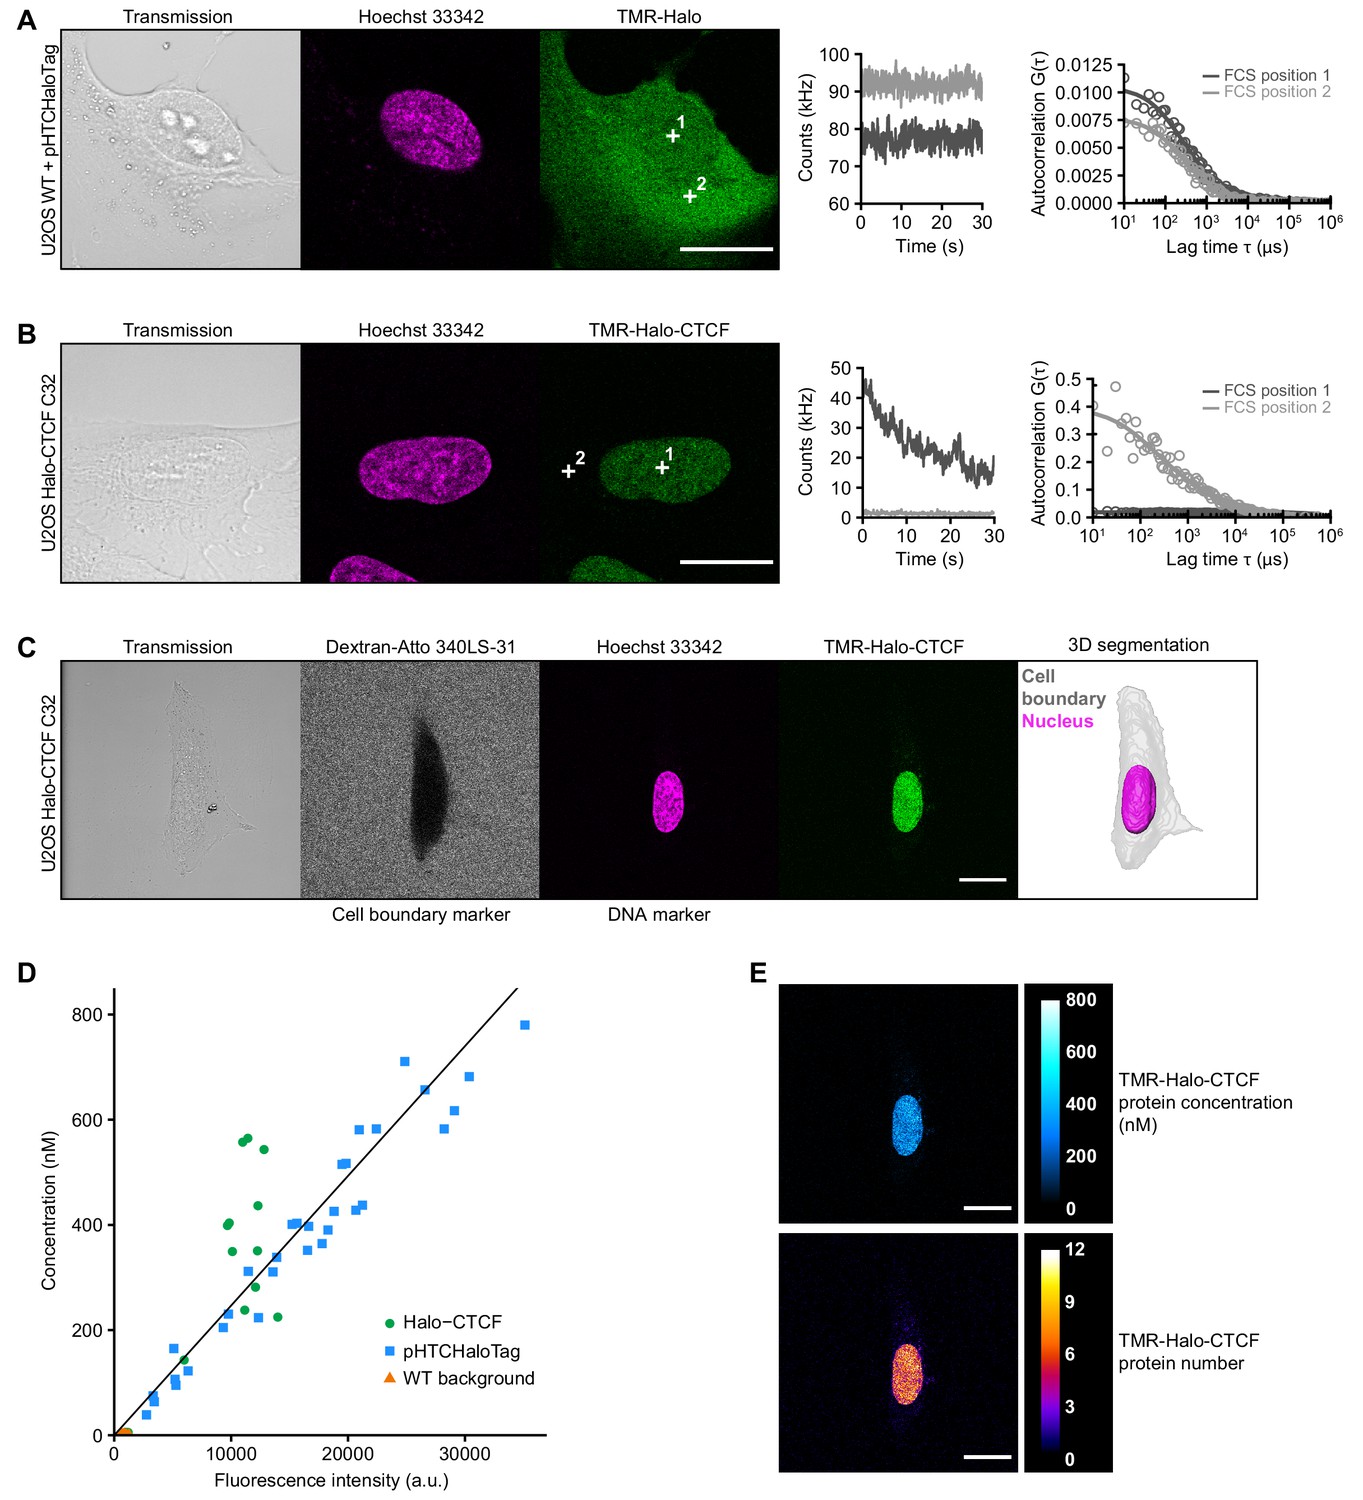
Determination of CTCF protein numbers in interphase U2OS C32 Halo-CTCF cells by FCS-calibrated-imaging.
(A–B) Representative FCS measurements at points (white crosses) in the nucleus (position 1) and cytoplasm (position 2) of U2OS WT cells expressing free HaloTag (A) or U2OS C32 Halo-CTCF cells (B), both labeled with TMR HaloTag ligand. Transmission, Hoechst 33342 (DNA) and TMR (HaloTag) channels are shown. Scale bars: 20 µm (left panel). During FCS measurements photon counts at the indicated positions (position 1, nucleus, dark gray; position 2, cytoplasm, light gray) were recorded for 30 s (middle panel). Autocorrelation curves (circles) were computed from the recorded photon counts and fitted to a two-component diffusion model (lines) to estimate the number of molecules in the focal volume of the microscope (right panel; see Materials and methods for details). For Halo-CTCF (B), photon counts recorded in the cytoplasm were close to background. (C) Image acquisition and segmentation of a representative interphase U2OS C32 Halo-CTCF cell labeled with TMR HaloTag ligand. Shown is a central slice of the acquired z-stack in the transmission, Atto 340LS-31 (labeled 500 kD dextran; cell boundary marker), Hoechst 33342 (DNA) and TMR (Halo-CTCF) channels. 3D segmentation of the same cell (gray) and its nucleus (magenta) was performed based on the extracellular fluorescently labeled dextran as negative cell marker and the Hoechst 33342 staining as DNA marker, respectively. Scale bar: 20 µm. (D) To convert fluorescence intensities of the TMR-labeled HaloTag into protein concentrations, a calibration curve was computed for each FCS-calibrated imaging experiment and fitted to a linear function (black straight line). The calibration curve was generated from images and FCS measurements in U2OS WT cells expressing different levels of free HaloTag (cells transfected with plasmid pHTCHaloTag; blue squares; n = 32 measurements; see (A)) and U2OS C32 Halo-CTCF cells (Halo-CTCF; green circles; n = 27 measurements; see (B) and Figure 1C), both labeled with TMR HaloTag ligand. FCS measurements in U2OS WT cells stained with TMR HaloTag ligand (WT background; orange triangles; n = 22 measurements) were used for background correction of fluorescence intensities and photon counts. Representative data from replicate 3 (see Figure 1D) is shown. (E) TMR-Halo-CTCF fluorescence intensities of the cell shown in (C) were converted into protein concentrations (upper panel) and protein numbers (lower panel) by applying the calibration factor (slope) from the calibration curve in (D). See Materials and methods for details. Shown is the same central slice of an acquired z-stack as in (C). Scale bars: 20 µm.
Figure 1—figure supplement 3
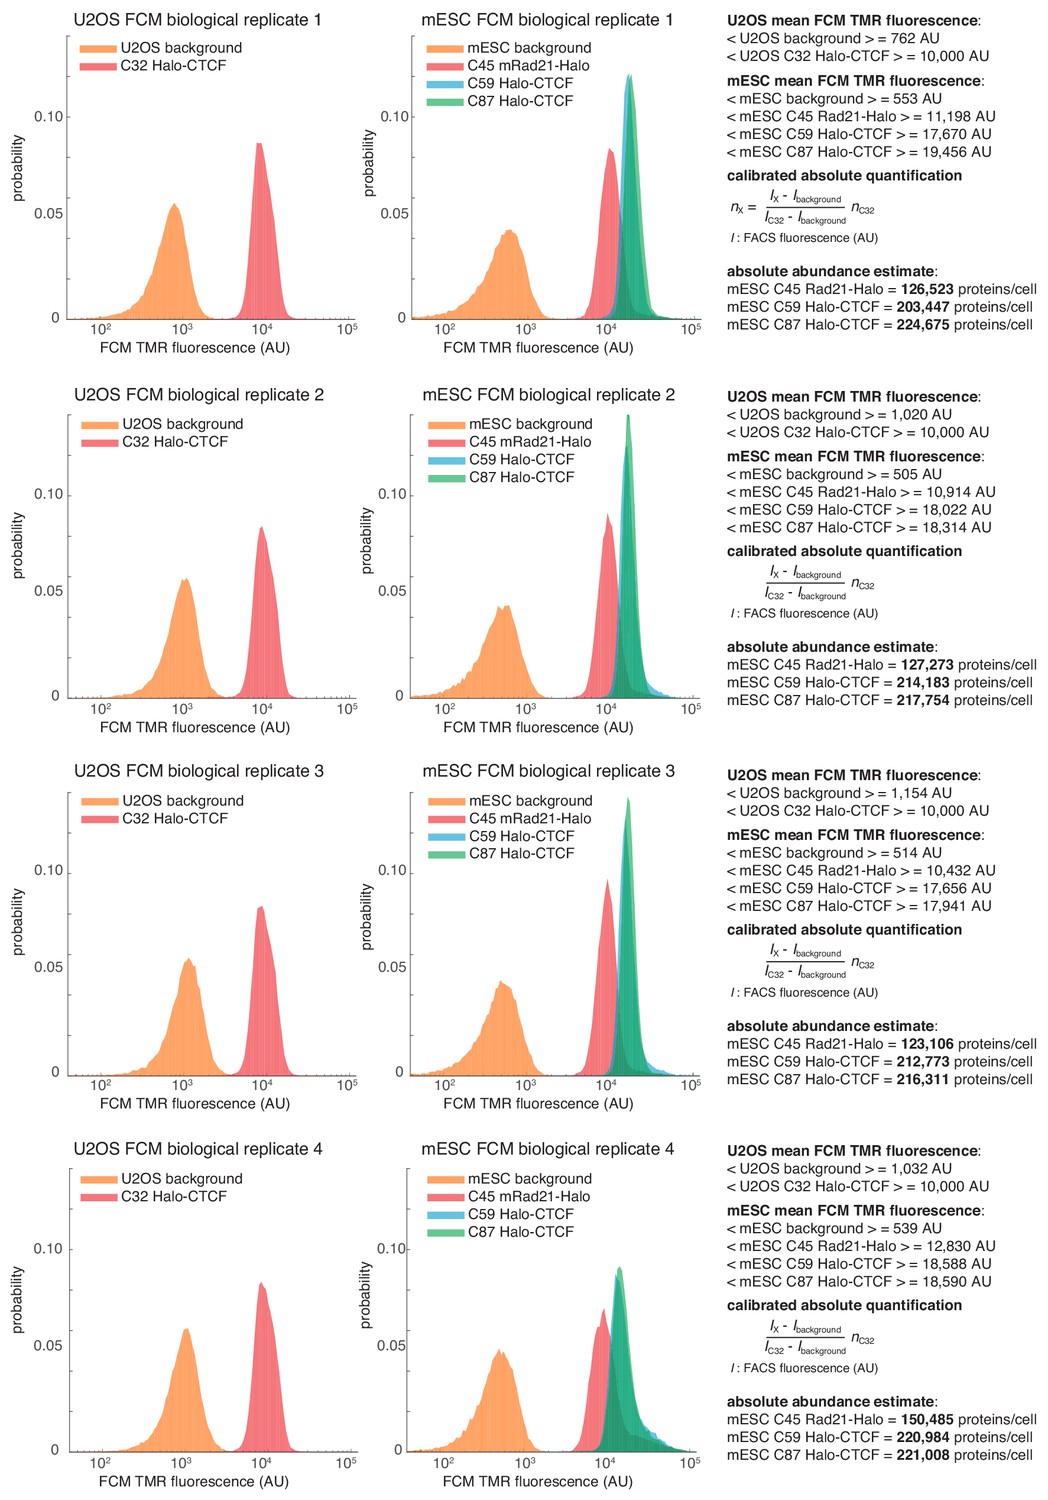
Flow cytometry (FCM)-based quantification of mESC protein abundances.
Raw fluorescence histograms for U2OS (background = unlabeled), C32 Halo-CTCF and mESCs (background = unlabeled), C45 Rad21-Halo, C59 Halo-CTCF and C87 Halo-CTCF after forward and side-scattering gating for live cells. All four biological replicates are shown and the abundances are reported as the mean ± standard deviation from these replicates in the main text. Calculations for converting to absolute abundances using the U2OS C32 Halo-CTCF standard are shown on the right. For full details on how the measurements were performed, please see the Materials and methods section.
Figure 2 with 1 supplement

Cohesin subunit Rad21 self-interacts in a protein-dependent manner.
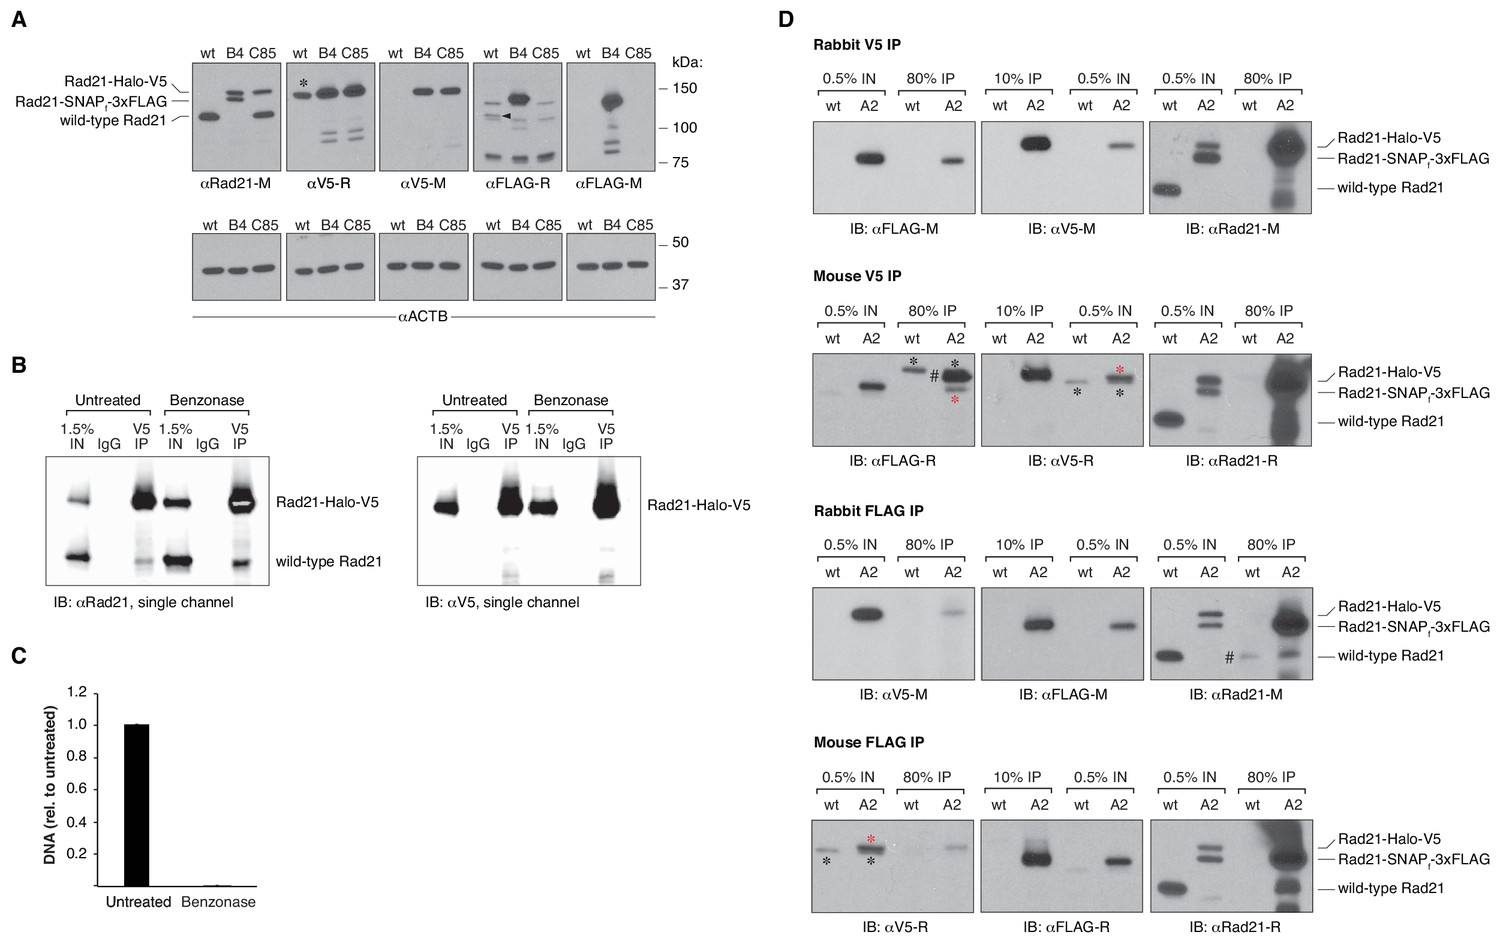
(A) Sketches of hypothetical single-ring, dimer and oligomer models of cohesin. The core single-ring cohesin complex consists of Smc1, Smc3, Rad21 and SA1/2 subunits. (B) Schematic of Cas9-mediated, genome-edited Rad21 alleles in diploid mESCs. Clone C85 expresses Rad21-Halo-V5 from one allele and near wild-type (wt) Rad21 from the other allele (see Materials and methods for details). Clone B4 expresses Rad21-Halo-V5 from one allele and Rad21-SNAP-3xFLAG from the other. (C) Western Blot of wild-type mESCs and endogenously Rad21-tagged mESC clones shown in (B). (D) Representative CoIP experiment in mESC clone C85 indicating protein-mediated Rad21 self-interaction. V5 IP followed by two-color western blot detection with Rad21 (green) and V5 (red) antibodies shows no effect of nuclease treatment on IP and self-CoIP efficiencies. The Rad21-Halo-V5 protein reacts with both antibodies and thus appears as yellow. See also Figure 2—figure supplement 1 for single-color blots. (E) Representative CoIP experiment in the doubly tagged B4 mESC clone. V5 IP followed by FLAG and V5 immunoblotting measures self-CoIP and IP efficiencies in the presence or absence of benzonase nuclease (90% of the IP sample loaded). (F) Reciprocal FLAG IP and quantification of benzonase DNA degradation similar to (E).
Figure 2—figure supplement 1
Additional blots and DNA quantification upon benzonase treatment.
(A) Western blot of wild-type mESCs and endogenously Rad21-tagged mESC clones shown in Figure 2B, probing the specificity of the antibodies used to either pull down or detect V5- and FLAG-tagged Rad21 proteins. The rabbit anti-V5 antibody does, in fact, detect an unrelated protein of approximately the same size of Rad21-Halo-V5 in wild-type (wt), untagged mESCs (*). However, as shown in the top panel of (D), such a non-specific interaction does not pull down cohesin in untagged cells. On the other hand, the rabbit anti-FLAG antibody weakly immunoreacts with an unrelated protein specifically in wt, untagged cells (black arrow). Pull-down experiments in (D) show that such protein might indeed be untagged Rad21. To avoid erroneous data interpretation due to cross-reactivity, the rabbit anti-FLAG antibody was not used for further experiments. Corresponding beta actin blots are included below each blot to show equal protein load. Antibodies used were as follows: anti Rad21 raised in mouse (M) from Millipore (05–908); anti-V5 raised in rabbit (R) from abcam (ab9116); anti-V5-M from invitrogen (R960-25); anti-FLAG-R and M from Sigma (F7425 and F3165); anti-ACTB from Sigma (A2228). (B) Single-color blots corresponding to the dual-color and overlaid blots shown in Figure 2D. (C) Effective nucleic acid digestion by benzonase nuclease in Rad21 CoIP experiments. Nucleic acids were phenol/chloroform extracted from CoIP lysates and quantified by qPCR using primers specific to the Actb gene. Error bars are SD, n = 3. (D) Rad21 co-immunoprecipitation (CoIP) experiments in wt, untagged mESCs and in another doubly tagged mESC clone (A2) derived independently of the B4 clone in Figure 2. Pull downs were performed in the presence of benzonase nuclease. V5 IP followed by FLAG immunoblotting and, viceversa, FLAG IP followed by V5 immunoblotting measure self-CoIP and IP efficiencies in the knock-in cell line. The leftmost blots were stripped and re-blotted with anti-Rad21 antibodies to check for cross-reactivity of V5 and FLAG antibodies with untagged Rad21 protein in wt cells. The antibodies used are the same as in (A); anti-Rad21-R is from abcam (ab154769). Black asterisks denote non-specific bands, while red asterisks mark specific bands. The FLAG antibody raised in rabbit showed some cross-reactivity with what might be wt, untagged Rad21 (#, Rabbit FLAG IP, rightmost blot). This could also explain the intense band detected in the mouse V5 IP (#, leftmost blot), corresponding to the size of the Rad21-Halo-V5 protein. To avoid erroneous data interpretation due to cross-reactivity, the rabbit anti-FLAG antibody was not used for further experiments.
Figure 3 with 1 supplement

A general and simple method for absolute quantification of cellular protein abundance.
(1) Cells expressing the Halo-tagged protein of interest are grown together with one of the cell standards described here (e.g. U2OS C32 Halo-CTCF; Figure 1B). (2) After labeling with a fluorophore coupled to the HaloTag ligand (e.g. TMR or a JF-dye), the absolute (3) and relative (4) fluorescence intensities can be measured using flow cytometry (FCM) and thus the absolute abundance of the protein of interest can be calculated (5). Here, this is illustrated using mESC lines for Halo-Sox2 (Teves et al., 2016) and Halo-TBP (Teves et al., 2018) (raw data in Figure 3—figure supplement 1).
Figure 3—figure supplement 1
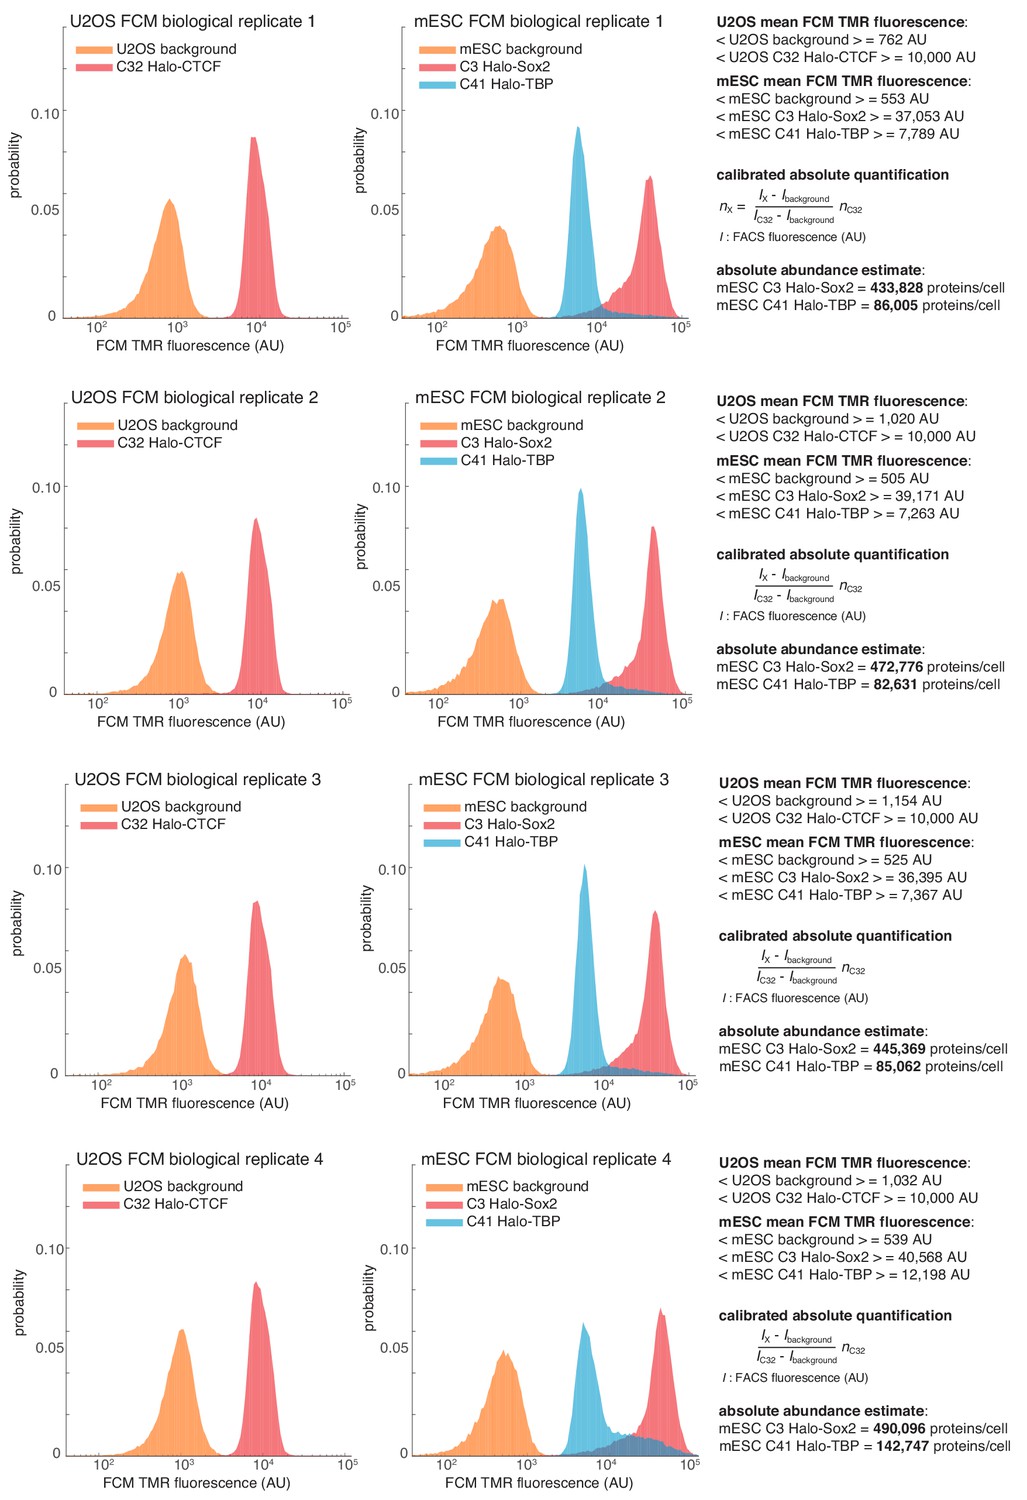
Quantification of Halo-Sox2 and Halo-TBP abundance in mESCs by flow cytometry (FCM).
Raw fluorescence histograms for U2OS (background = unlabeled), C32 Halo-CTCF and mESCs (background = unlabeled), C3 Halo-Sox2 and C41 Halo-TBP after forward and side-scattering gating. All four biological replicates are shown and the abundances are reported as the mean and standard deviation from these replicates in the main text. For full details on how the measurements were performed, please see the Materials and methods section.
Tables
Key resources table
| Reagent type (species) or resource | Designation | Source or reference | Identifiers | Additional information |
|---|---|---|---|---|
| Cell line (Homo sapiens) | U2OS | (Hansen et al., 2017) | U2OS | Wild-type U2OS cell line. RRID:CVCL_0042 |
| Cell line (Mus musculus) | mESC | (Pettitt et al., 2009) and UC Davis KOMP Repository | JM8.N4 mESC | https://www.komp.org/pdf.php?cloneID=8669 (RRID:CVCL_J962) |
| Cell line (Mus musculus) | mESC C59 Halo-CTCF | (Hansen et al., 2017) | mESC C59 Halo-mCTCF | mESC (JM8.N4) endogenous knock-in cell line where both endogenous copies of Ctcf have been N-terminally tagged with FLAG-HaloTag and where both endogenous copies of Rad21 have been C-terminally tagged with SNAPf-V5. Clone 59 |
| Cell line (Mus musculus) | mESC C87 Halo-CTCF | (Hansen et al., 2017) | mESC C87 Halo-mCTCF | mESC (JM8.N4) endogenous knock-in cell line where both endogenous copies of Ctcf have been N-terminally tagged with FLAG-HaloTag. Clone 87 |
| Cell line (Mus musculus) | mESC C45 Rad21-Halo | (Hansen et al., 2017) | mESC C45 mRad21-Halo | mESC (JM8.N4) endogenous knock-in cell line where both endogenous copies of Rad21 have been C-terminally tagged with HaloTag-V5. Clone 45. |
| Cell line (Mus musculus) | mESC C3 Halo-Sox2 | (Teves et al., 2016) | mESC C3 Halo-Sox2 | mESC (JM8.N4) endogenous knock-in cell line where both endogenous copies of Sox2 have been N-terminally tagged with FLAG-HaloTag. Clone 3 |
| Cell line (Homo sapiens) | U2OS C32 Halo-CTCF | (Hansen et al., 2017) | U2OS C32 Halo-hCTCF | U2OS endogenous knock-in cell line where all endogenous copies of Ctcf have been N-terminally tagged with FLAG-HaloTag. Clone 32 |
| Cell line (Mus musculus) | mESC C85 Rad21-Halo-V5 het | This Paper | C85 | mESC (JM8.N4) endogenous knock-in cell line where one endogenous Rad21 allele is Halo-V5 tagged while the other allele is ‘near wild type’ (see Materials and methods). Clone 85 |
| Cell line (Mus musculus) | mESC B4 Rad21-Halo-V5/Rad21-SNAPf-3xFLAG | This Paper | B4 | mESC (JM8.N4) endogenous knock-in cell line where one endogenous Rad21 allele is Halo-V5 tagged while the other allele is SNAPf-3xFLAG tagged. Clone B4 |
| Cell line (Mus musculus) | mESC A2 Rad21-Halo-V5/Rad21-SNAPf-3xFLAG | This Paper | A2 | mESC (JM8.N4) endogenous knock-in cell line where one endogenous Rad21 allele is Halo-V5 tagged while the other allele is SNAPf-3xFLAG tagged. Clone A2 |
| Antibody | rabbit polyclonal anti-V5 | Abcam | Cat. # ab9116, RRID:AB_307024 | (1:2000) for western blot (WB) |
| Antibody | mouse monoclonal mouse anti-V5 | ThermoFisher Scietific | Cat. # R960-25, RRID:AB_2556564; | (1:5000) for WB |
| Antibody | rabbit polyclonal anti-FLAG | Sigma-Aldrich | Cat. # F7425, RRID:AB_439687 | (1:1000) for WB |
| Antibody | mouse monoclonal anti-FLAG | Sigma-Aldrich | Cat. # F3165, RRID:AB_259529 | (1:5000) for WB |
| Antibody | rabbit polyclonal anti-Rad21 | Abcam | Cat. # ab154769, RRID:AB_2783833 | (1:2000) for WB |
| Antibody | mouse anti-Rad21 | Millipore | Cat. # 05–908, RRID:AB_417383 | (1:5000) for WB |
| Antibody | mouse monoclonal anti-Halo | Promega | Cat. # G9211, RRID:AB_2688011 | (1:1000) for WB |
| Antibody | mouse monoclonal anti-βactin | Sigma-Aldrich | Cat. # A2228, RRID:AB_476697 | (1:4000) for WB |
| Peptide, recombinant protein | 3xFLAG-Halo-CTCF-His6 | This Paper | 3xFLAG-Halo-CTCF-His6 | See Materials and methods. |
| Peptide, recombinant protein | His6-Rad21-Halo-3xFLAG | This paper | His6-Rad21-Halo-3xFLAG | See Materials and methods. |
| Recombinant DNA reagent | pHTCHaloTag | This paper | pHTCHaloTag | For FCS-calibrated imaging experiments (referred to as pHTCHaloTag), a stop codon was introduced into the pHTC HaloTag CMV-neo vector (Promega, #9PIG771) |
| Software, algorithm | Matlab | The Mathworks | MATLAB 2014b | https://www.mathworks.com/products/matlab.html |
| Software, algorithm | Flow cytometry analysis (Matlab) | This paper | Flow cytometry analysis | https://gitlab.com/tjian-darzacq-lab/cattoglio_et_al_absoluteabundance_2019 |
| Software, algorithm | FCSREAD (Matlab) | Mathworks File Exchange | FCSREAD (Matlab) | https://www.mathworks.com/matlabcentral/fileexchange/8430-flow-cytometry-data-reader-and-visualization |
| Commercial assay, kit | Click-iT EdU Alexa Fluor 488 Flow Cytometry Assay Kit | ThermoFisher Scientific | Click-iT EdU Alexa Fluor 488 Flow Cytometry Assay Kit | Cat. # C10425 |
| Chemical compound, drug | DAPI | Sigma-Aldrich | 4′,6-Diamidine-2′-phenylindole dihydrochloride | Cat. # 10236276001 |
| Chemical compound, drug | Halo-TMR | Promega | HaloTag TMR ligand | Cat. # G8251 |
| Chemical compound, drug | Halo-JF646 | (Grimm et al., 2015) | Halo-JF646 | Please contact Luke D Lavis for distribution. |
| Chemical compound, drug | Hoechst 33342 | Sigma-Aldrich | Hoechst 33342 | Cat. # B2261 |
Additional files
-
Transparent reporting form
- https://doi.org/10.7554/eLife.40164.011
Download links
A two-part list of links to download the article, or parts of the article, in various formats.
Downloads (link to download the article as PDF)
Open citations (links to open the citations from this article in various online reference manager services)
Cite this article (links to download the citations from this article in formats compatible with various reference manager tools)
Determining cellular CTCF and cohesin abundances to constrain 3D genome models
eLife 8:e40164.
https://doi.org/10.7554/eLife.40164


