The Acinetobacter baumannii Mla system and glycerophospholipid transport to the outer membrane
- University of Washington, United States
- The University of Sheffield, United Kingdom
Figures
Figure 1 with 2 supplements
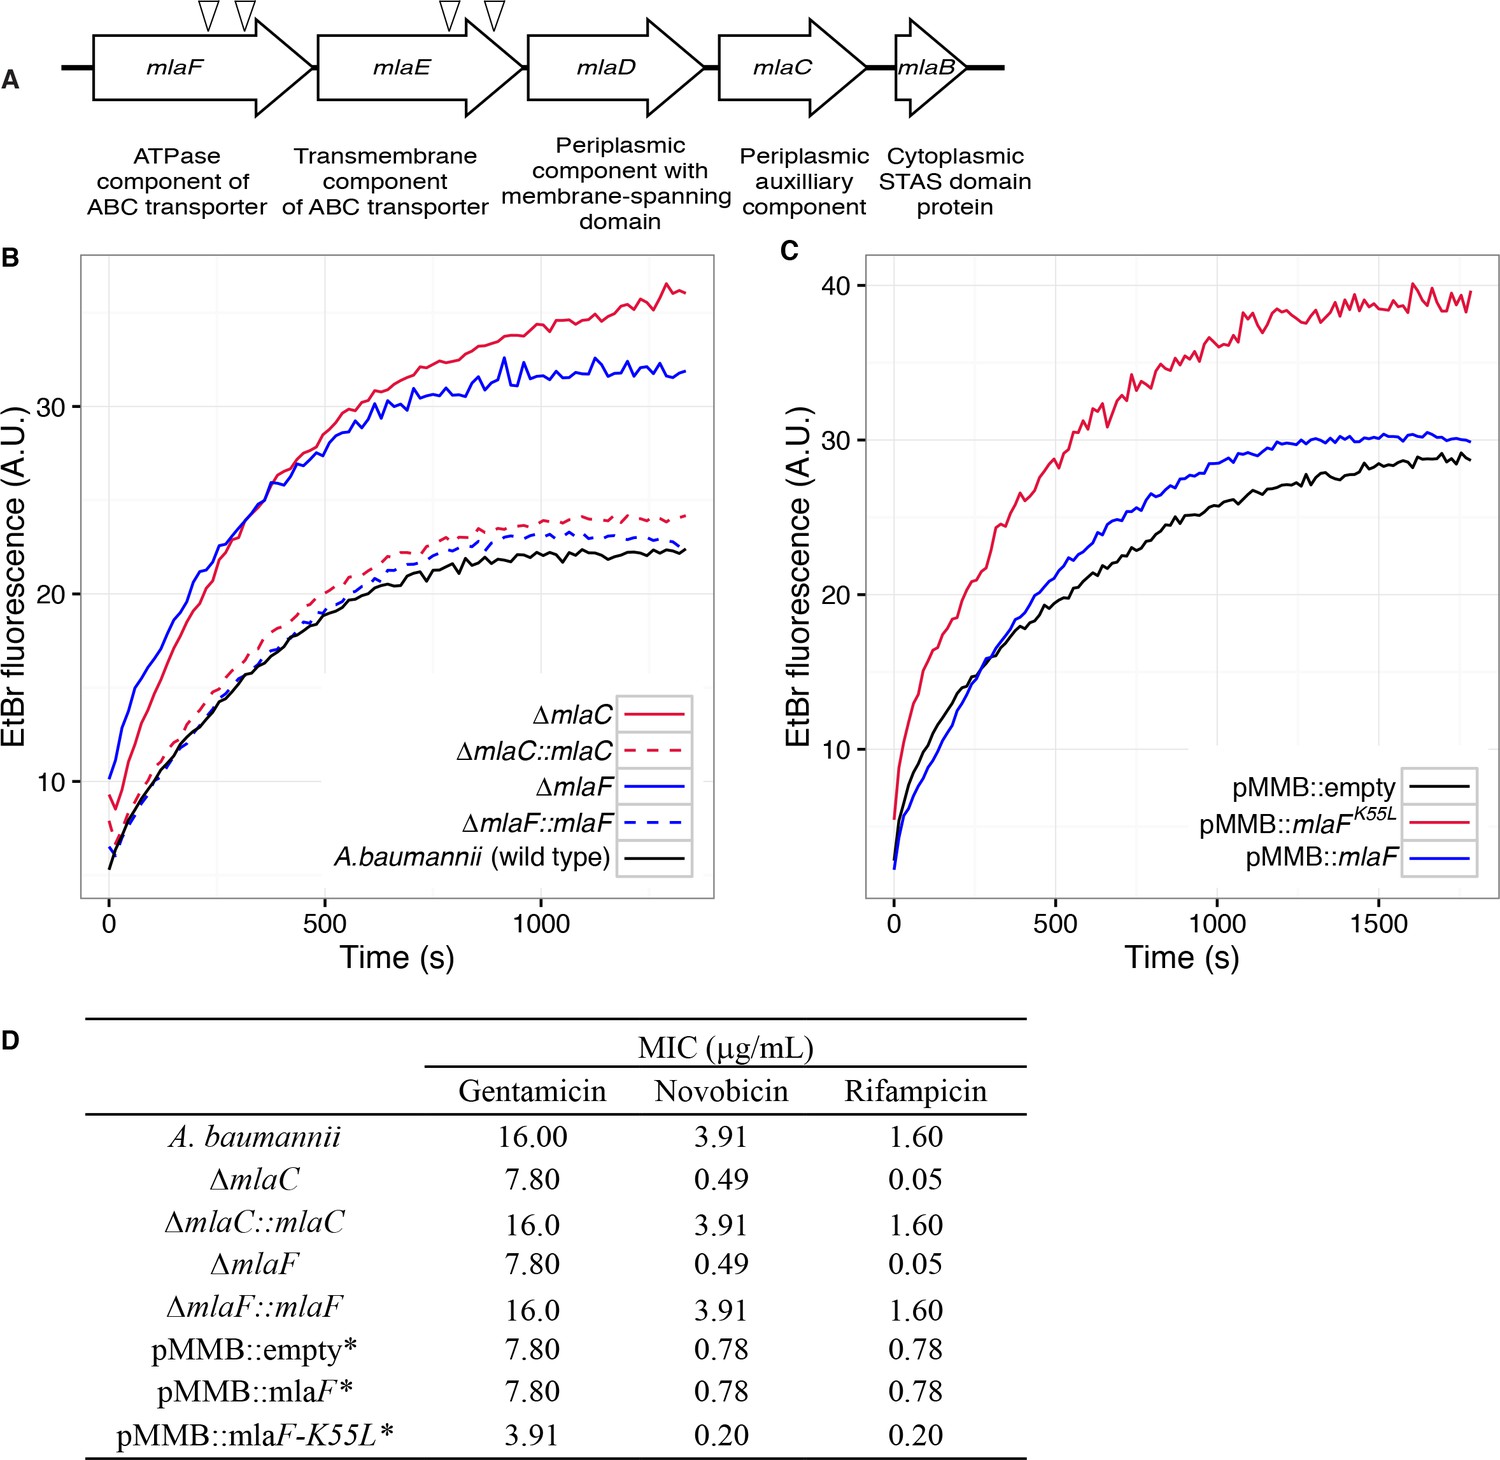
Disruption of the Mla system results in an altered outer membrane barrier.
(A) Genomic organization of the A. baumannii mlaFEDCB operon and its predicted products. Triangles indicate the position of four independent transposon insertions, isolated in a screen for genes involved in outer membrane integrity. (B) Ethidium bromide uptake assay of outer membrane permeability of ∆mla mutants and complemented strains. A.U., arbitrary units. Lines shown depect the average of three technical replicates. (C) Ethidium bromide uptake assay of outer membrane permeability following plasmid-based expression of MlaF, compared to its dominant negative version, MlaFK55L. Lines shown depict the average of three technical replicates. (D) Minimum inhibitory concentration (MIC) of select antibiotics in A. baumannii. *Indicates wild type A. baumannii containing pMMB plasmid constructs, and cultures grown with the addition of kanamycin (25 μg/mL) to maintain plasmids and 50 μM IPTG for induction.
Figure 1—figure supplement 1
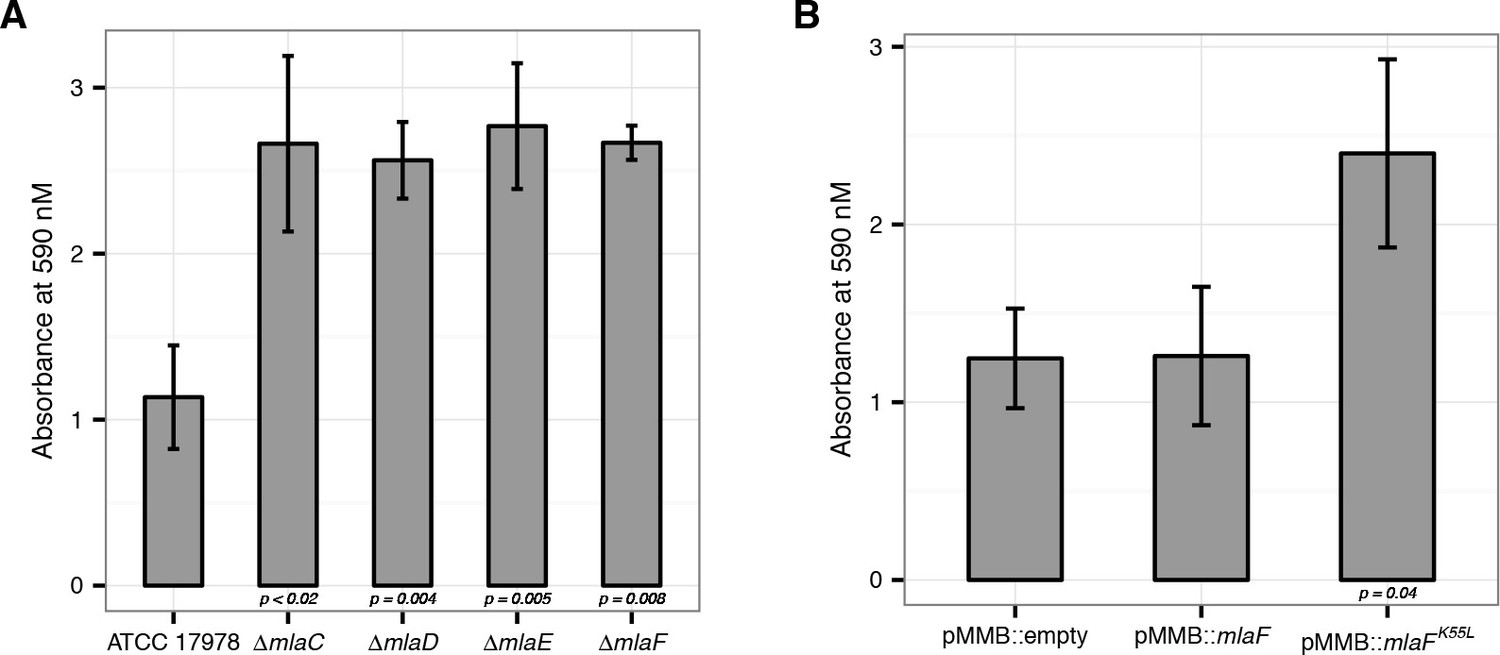
Disruption of the Mla system leads to an increase in exopolysaccharide production.
(A) Quantification of crystal violet staining from mla deletion mutants. Error bars represent ±s.d. for biological replicates (n = 3). (B) Quantification of crystal violet staining following plasmid expression of MlaF compared to its dominant negative version, MlaFK55L. Error bars represent ±s.d. for biological replicates (n = 3).
Figure 1—figure supplement 2
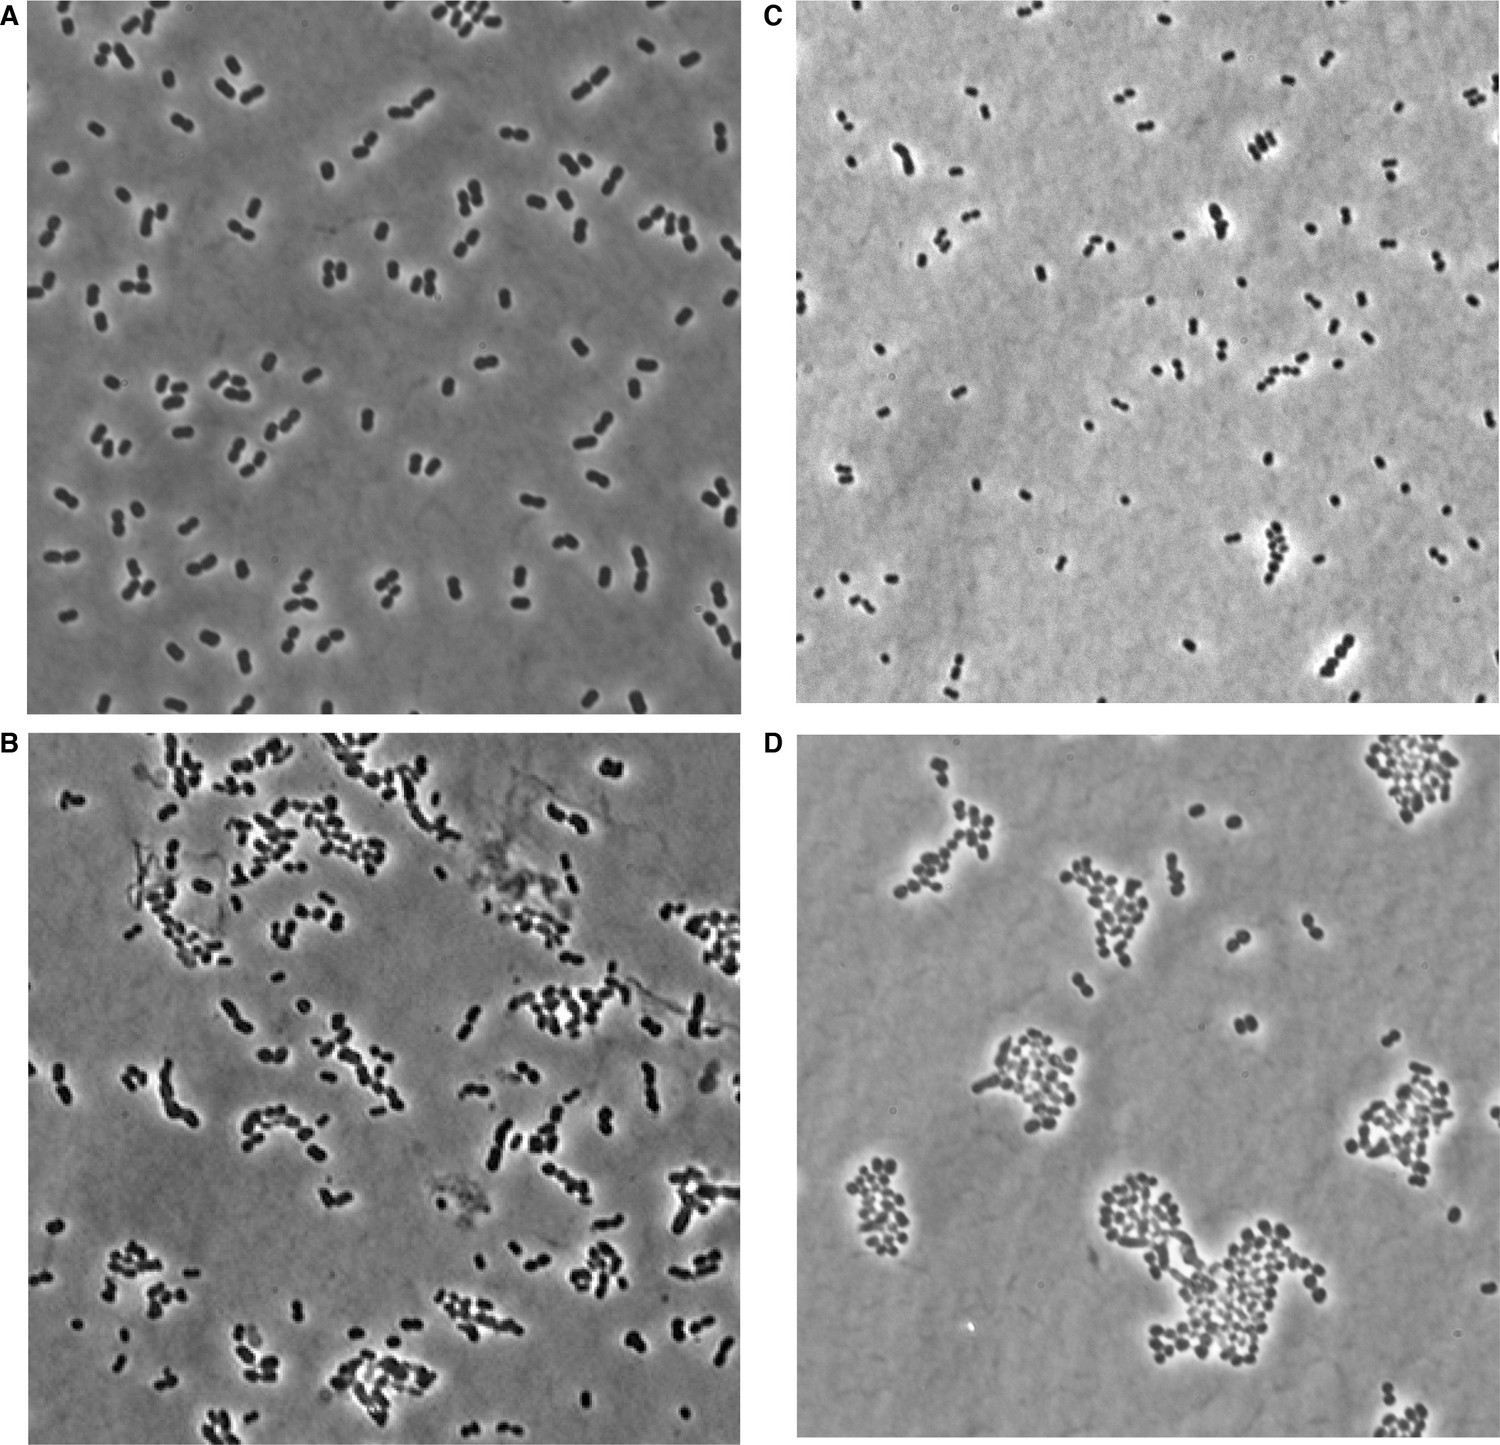
Phase microscopy images of wild type and mla mutant A. baumannii.
Images were collected from cultures grown to mid-log (OD600 0.4–0.6) growth phase from wild type (A), mlaA (B), mlaC (C), and mlaF (D) deletion mutants of A. baumannii.
Figure 2 with 4 supplements
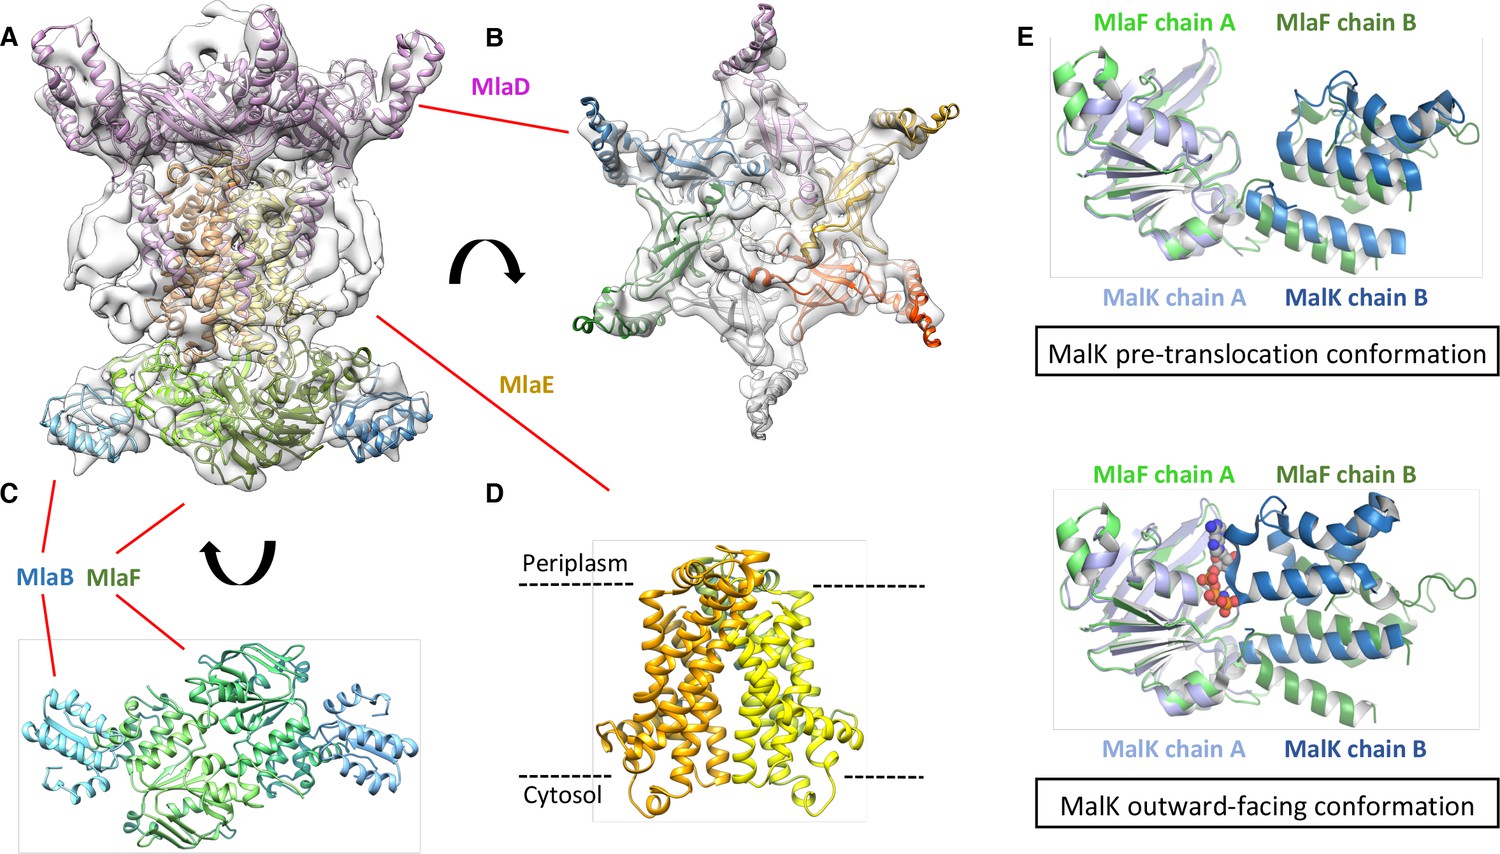
Structure of the abMlaBDEF complex.
(A) Cryo-EM map of abMlaBDEF (grey), with structural models for MlaD, MlaB and MlaF (in magenta, cyan and green respectively) docked at their putative location. The density for the TM helices is clearly resolved. (B–D) Cartoon representation of the MlaD hexamer (B), the MlaB-MlaF hetero-tetramer (C), and the MlaE dimer (D) region of the abMlaBDEF atomic model. (E) Comparison of the MlaF domain arrangement in the EM map to that of the Maltose transporter ATPase MalK. The two chains of MlaD (in light and dark green) superimpose well to those of MalK (in cyan and dark blue) in the pre- translocation conformation (top, PDB ID: 4 KHZ), while a clear rotation is observed compared to the ATP-bound outward-facing conformation (bottom, PDB ID: 4KI0).
Figure 2—figure supplement 1
Mla components copurify following protien expression.
SDS-PAGE analysis of proteins copurified with hexahistidine-tagged MlaB (-His6). Band identities were assigned based on MS.
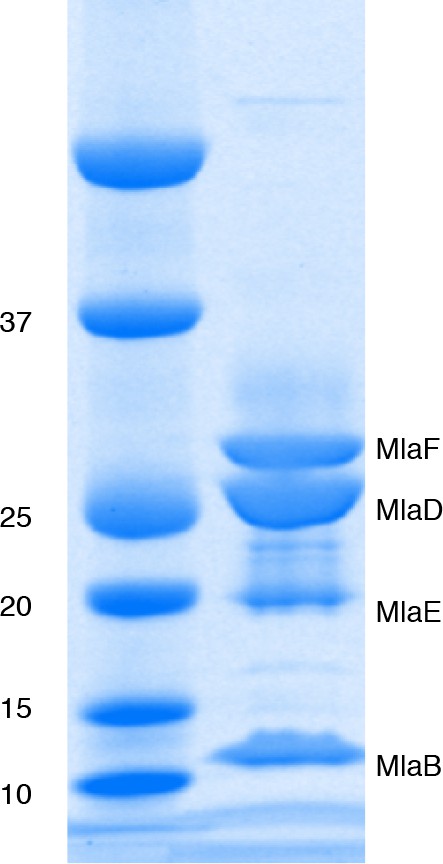
Figure 2—figure supplement 2
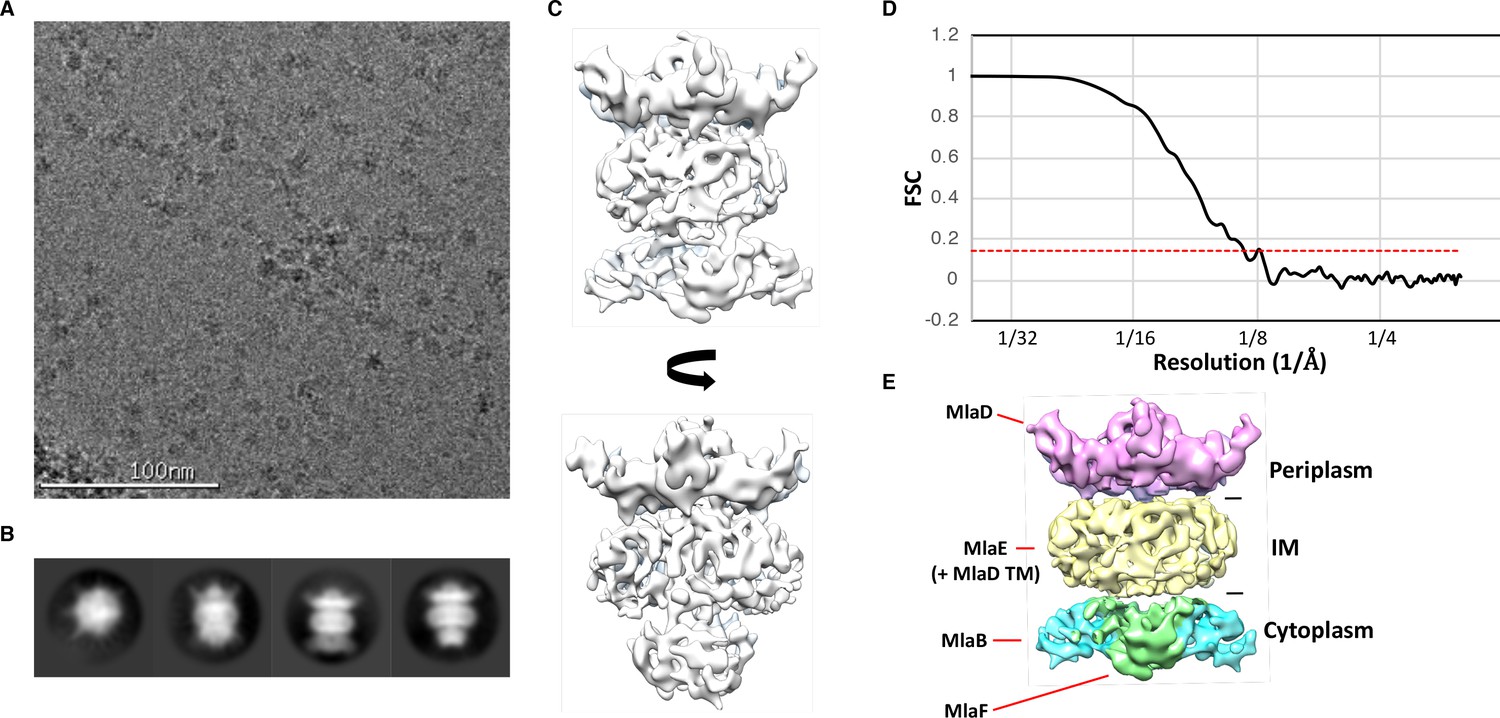
Cryo-EM structure of the abMlaBDEF complex.
(A) Representative electron micrograph region of frozen-hydrated MlaBDEF complex. The scale bar is in white at the bottom. (B) Representative reference-free 2D class averages of abMlaBDEF, generated using Relion, illustrating the various views observed. (C) Cryo-EM map of the MLA complex, shown in two orientations corresponding to the two last classes shown in B. (D) The FSC curve for the MlaBDEF structure is shown in black, with the gold-standard resolution definition of 0.143% indicated with a red dotted line. The nominal resolution for this structure is 8.7 Å. (E) The regions of density attributed to the periplasmic domain of MlaD, the TM domains of MlaD and MlaE, and to MlaB and MlaF are in pink, yellow, cyan and green respectively.
Figure 2—figure supplement 3
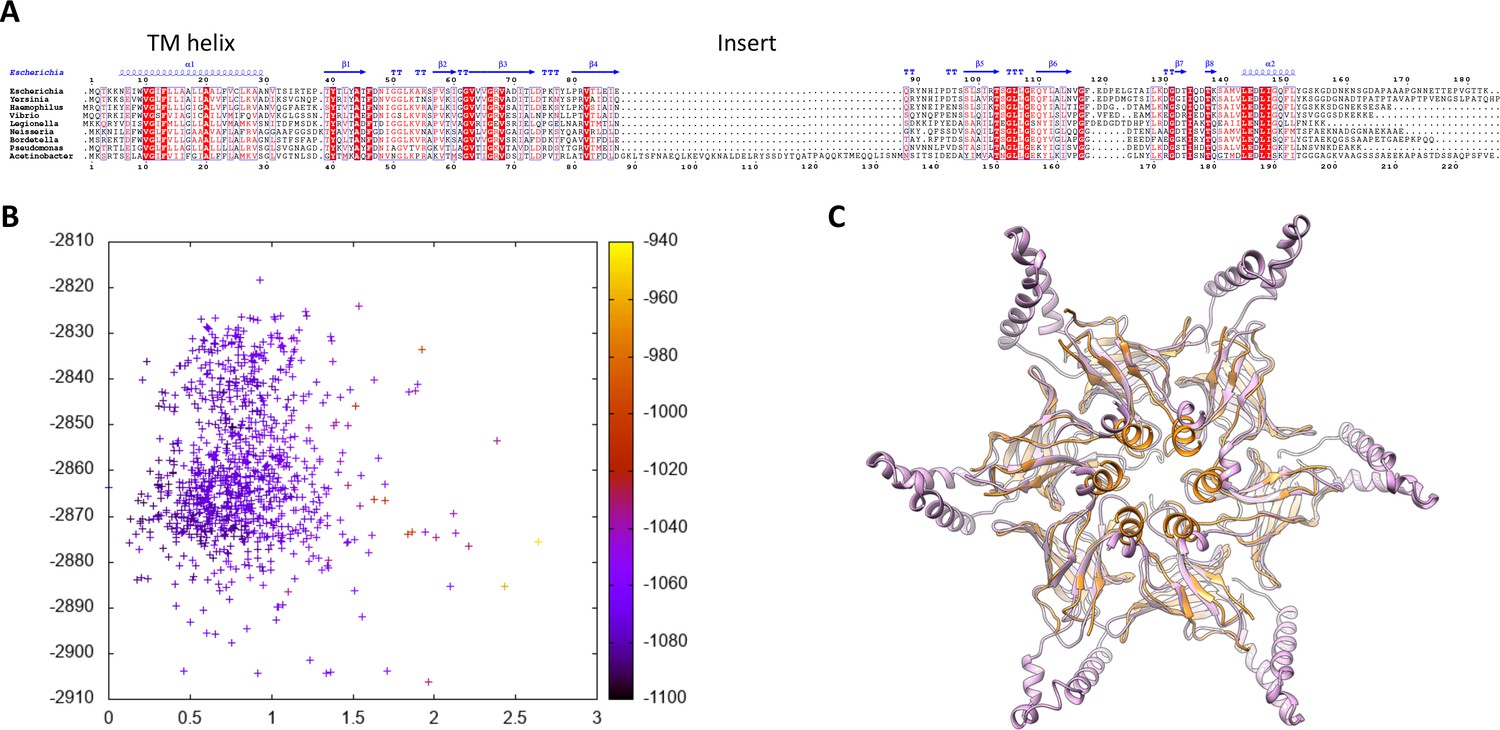
Modeling of the abMlaD hexamer.
(A) Multiple alignment of MlaD sequences from various gram-negative human pathogens. The secondary structure for ecMlaD is shown at the top. The position of the abMlaD insert is indicated. (B) Result of the all-atom refinement step for the MlaD hexameric model. The energy of each model is plotted versus the RMSD relative to the initial model and color-coded for the fit to the EM map density. (C) Cartoon representation of our abMlaD hexameric model (magenta), superimposed to the crystallographic ecMlaD hexamer structure (orange).
Figure 2—figure supplement 4
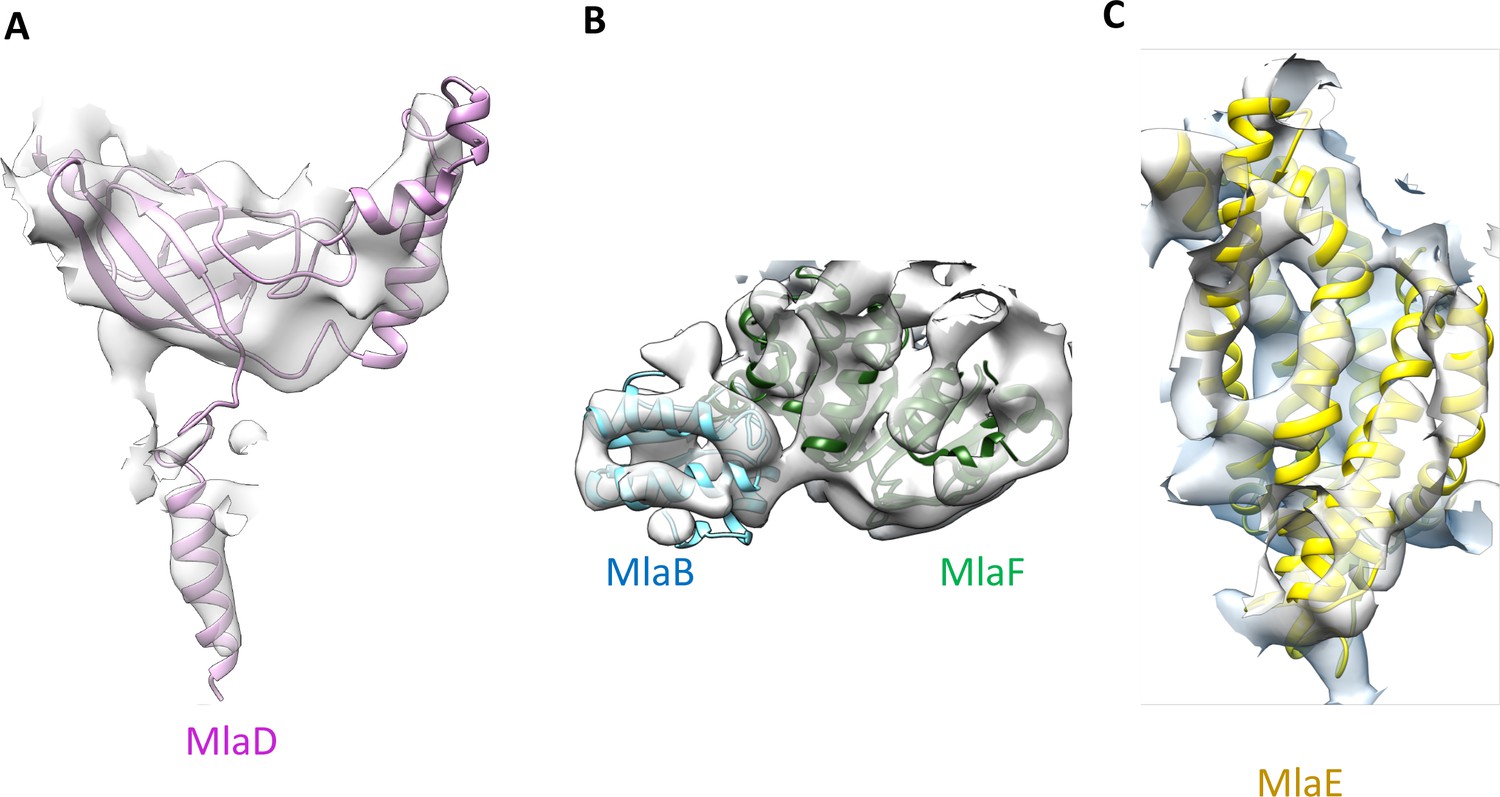
Close-up view of the MlaB, MlaD, MlaE and MlaF models in the abMlaBDEF cryo-EM map.
(A) Region of the density corresponding to a MlaD monomer, with the corresponding atomic model in magenta. The density of the N-terminal helix is well resolved, as well as that of the A. baumannii-specific insert. (B) Region of the density corresponding to a MlaF-MlaB hetero-dimer, with the corresponding atomic models in green and cyan respectively. Density for helices are well defined for most of the model. (C) Region of the density corresponding to a MlaE monomer, with the corresponding atomic model in yellow.
Figure 3 with 1 supplement
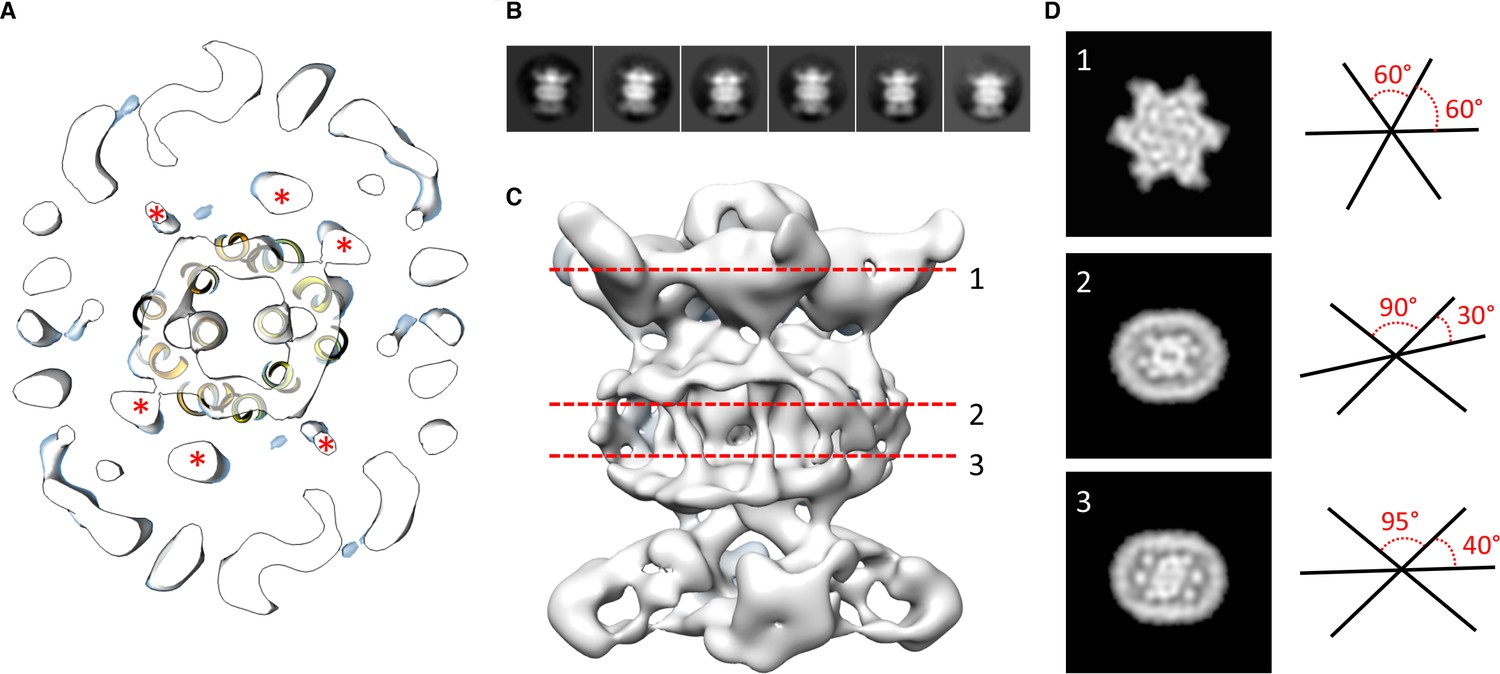
Localization of the 6 TM helices from MlaD.
(A) lateral section of the abMlaBDEF EM map, with the MlaE model in yellow. Density attributed to the MlaD N-terminal helices are indicated with a red star. (B) 2D classes generated from the set of particles used to generate the abMlaBDEF structure, corresponding to side views. A range of orientations for the periplasmic domain is observed. (C) Structure of abMlaBDEF, generated using a subset of the most homogeneous ~8000 particles. Some features of the map shown in Figure 3C are not present, but the overall structure is similar. Six well- defined helices in the central TM region are visible. (D) Sections along the vertical axis, corresponding to the three red lines shown in C, is shown on the left. The six- fold axis of MlaD is visible in the periplasmic region, but this breaks down in the TM region, where the six helices are asymmetric. An angular representation of the six helices at each three cross-sections is represented on the right.
Figure 3—figure supplement 1

Comparison of the abMlaBDEF and ecMalBDEF complex.
The map of abMlaBDEF (this study) is shown in grey, overlaid to that of ecMlaBDEF (Ekiert et al., 2017) in yellow, aligned in the cytosolic domains density. The overall architecture of both complexes are similar, however MlaD appears offset by ~20 O in the A. baumannii complex, compared to the E.coli complex. It remains to be determined if this corresponds to a difference between species, or if the two structures were obtained in different states of substrate binding and/or nucleotide hydrolysis.
Figure 4 with 2 supplements
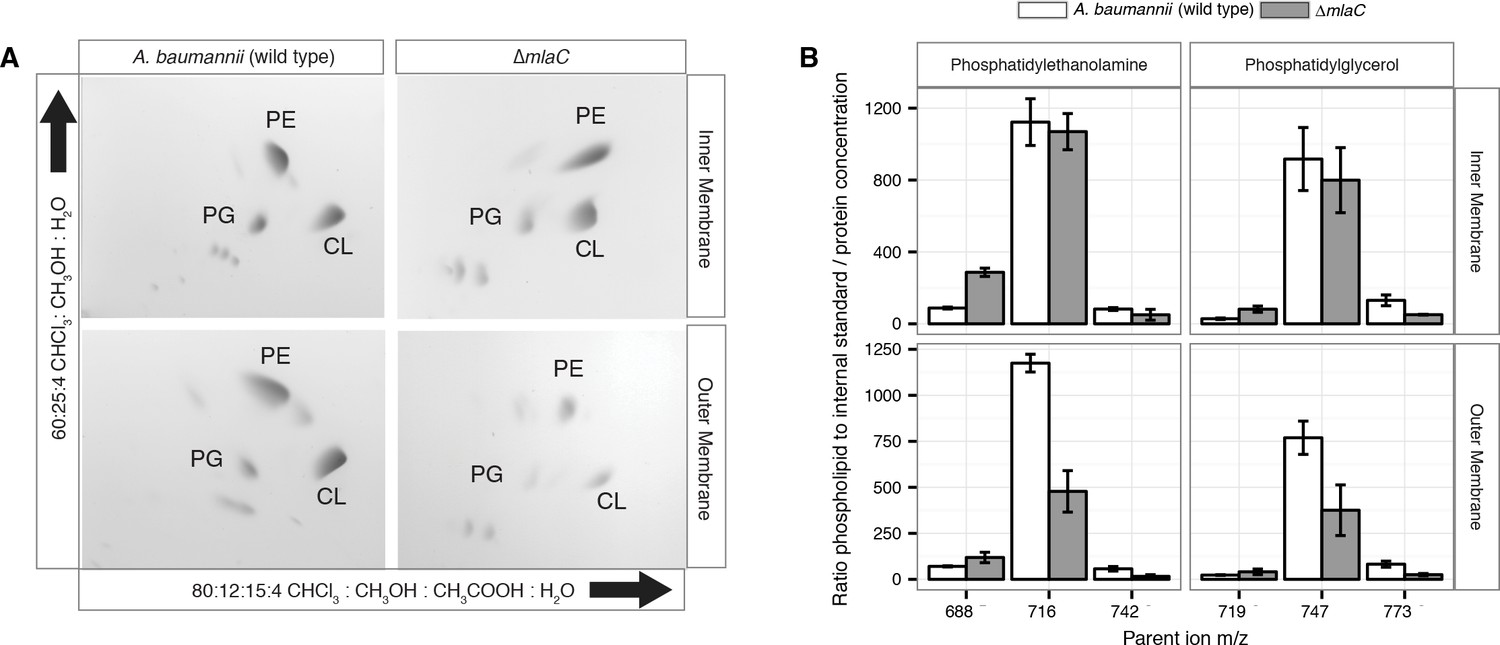
Outer membrane glycerophospholipid levels are reduced in ∆mlaC mutant.
(A) Identification of inner and outer membrane phospholipids of wild type A. baumannii and ∆mlaC using 2D thin-layer chromatography. PE, phosphatidylethanolamine; PG, phosphatidylglycerol; CL, cardiolipin. (B) LC-MS/MS quantification of isolated inner and outer membrane glycerophospholipids. Error bars indicate ±s.e.m. (n = 3).
Figure 4—figure supplement 1
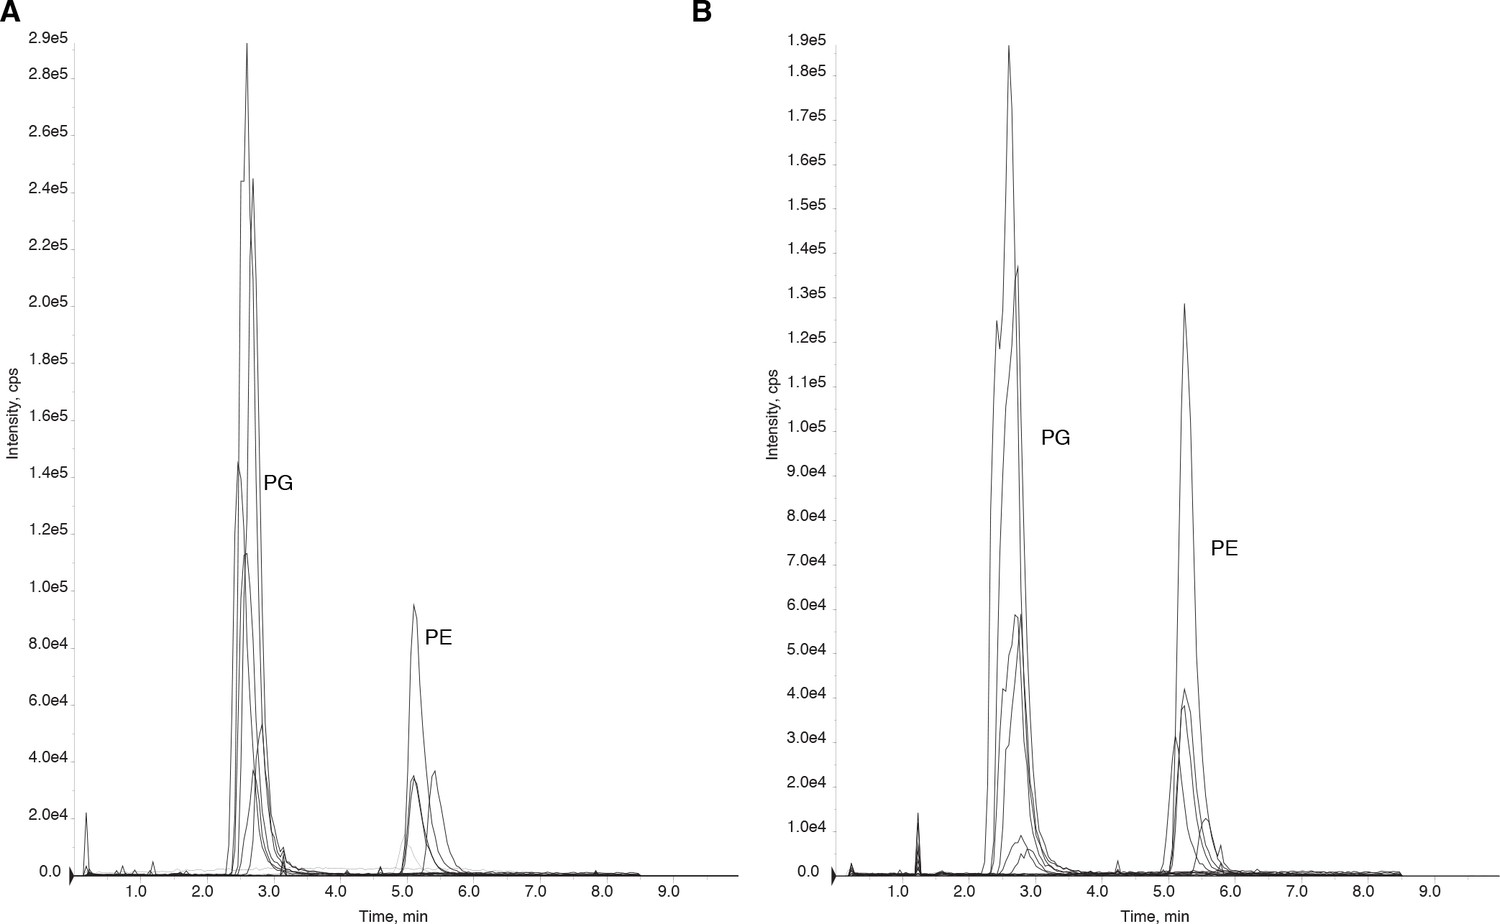
Purified periplasmic components of the Mla system remain bound to glycerophospholipids.
(A) Chromatogram of LC-MS/MS of glycerophospholipids extracted from purified MlaC. Peaks were identified based on MS and elution time. PG, phosphatidylglycerol. PE, phosphatidylethanolamine. (B) Chromatogram of LC-MS/MS of glycerophospholipids extracted from purified MlaD soluble domain.
Figure 4—figure supplement 2
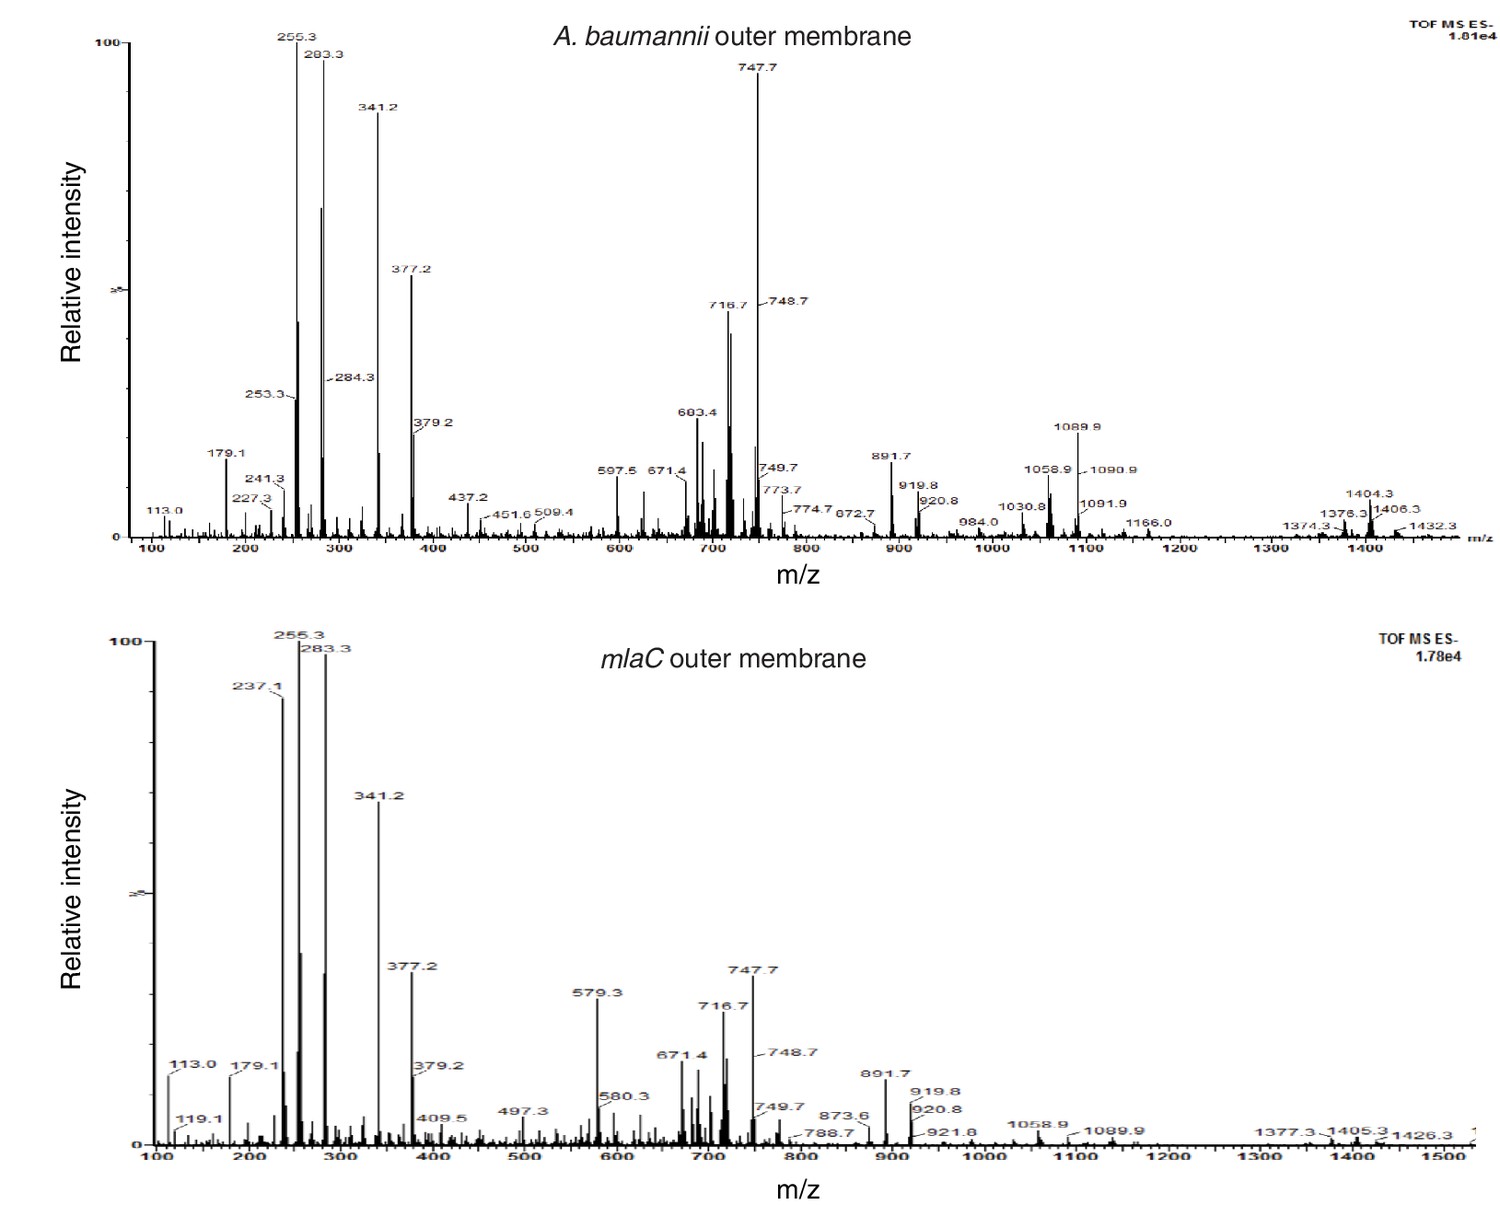
Deletion of mlaC results in a reduction in levels of outer membrane glycerophospholipids.
Total ion scan of isolated outer membranes of A. baumannii and ∆mlaC. Typical membrane glycerophospholipids fall within the m/z range of 600–1500.
Figure 5 with 3 supplements
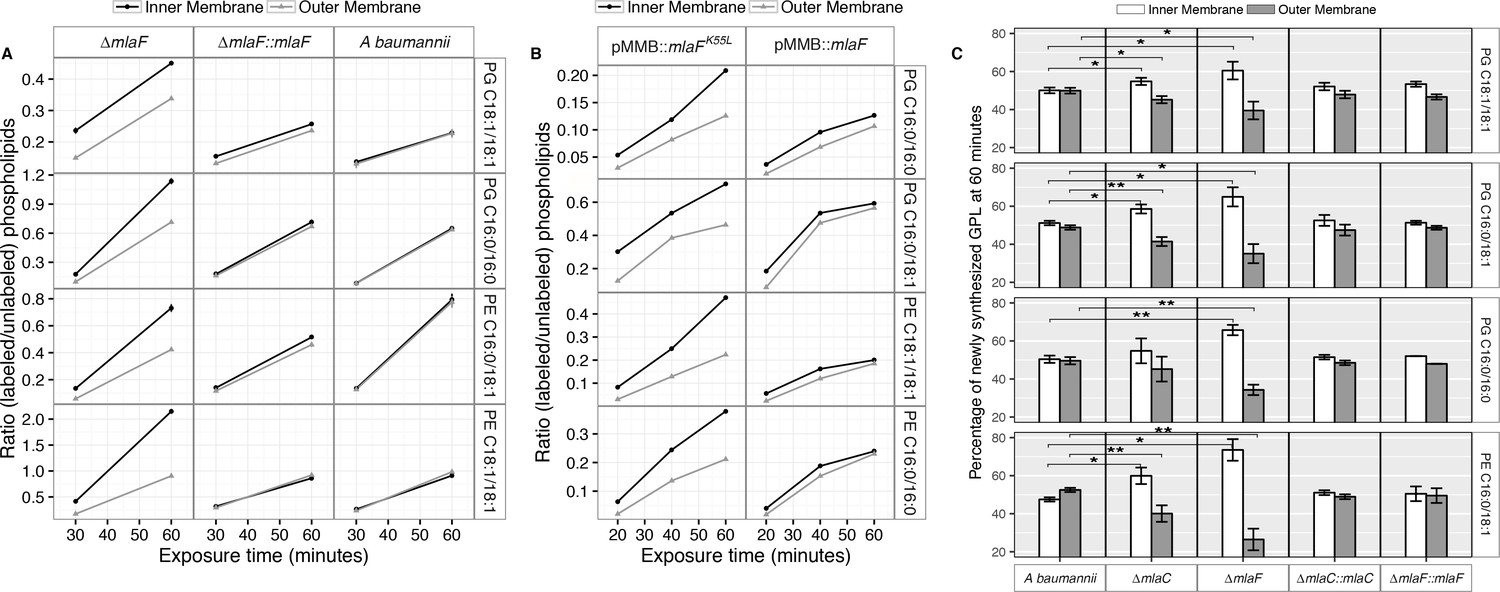
Newly synthesized glycerophospholipids accumulate at the inner membrane of Mla mutants.
(A) LC-MS/MS quantification of 13C labelled/unlabeled glycerophospholipids in isolated membrane fractions over time after growth in 2–13C acetate in ∆mlaF and complemented strain. Facet labels on the right indicate the specific glycerophospholipid species analyzed and the acyl chain length. PG, phosphatidylglycerol; PE, phosphatidylethanolamine. Shown is representative data from repeated experiments. (B) LC-MS/MS quantification of 13C labelled/un- labeled glycerophospholipids in isolated membrane fractions following plasmid-based expression of MlaF compared to its dominant negative version, MlaFK55L. Facet labels on the right indicate the specific glycerophospholipid species analyzed and the acyl chain length. PG, phosphatidylglycerol; PE, phosphatidylethanolamine. Shown is representative data from repeated experiments. (C) Relative proportion of newly synthesized GPL on IM and OM after one hour growth in 2–13C acetate. Error bars represent ± s.d. (n = 2). Statistical analyses performed using a Student’s t test. p-Value: *, p < 0.05; **, p < 0.01.
Figure 5—figure supplement 1
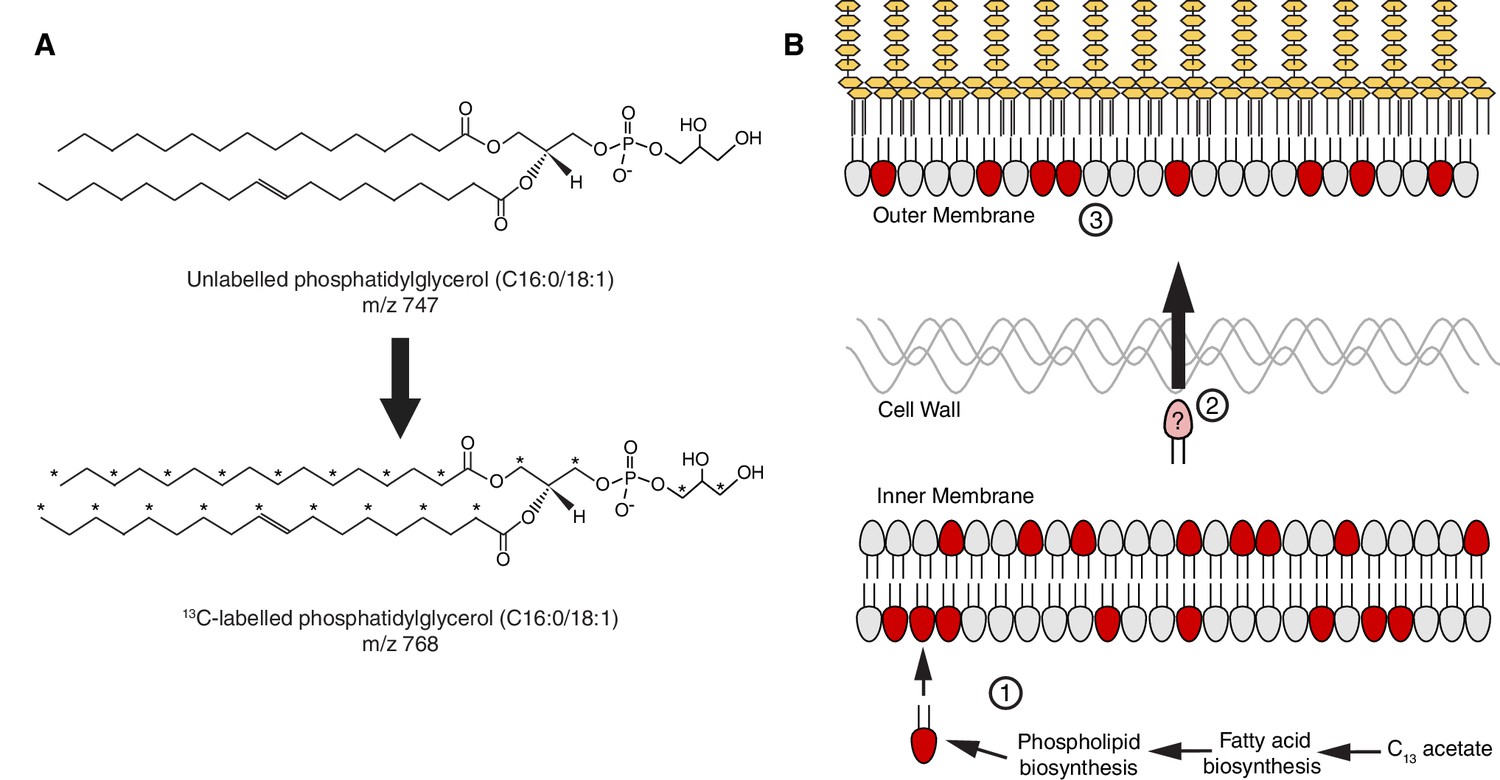
A stable isotope assay of glycerophospholipid transport from the inner membrane to the outer membrane.
(A) Schematic showing an example of the shift in mass-to-charge ratio (m/z) of glycerophospholipids (GPL) following growth in 2-13C acetate. (B) A schematic illustrating the rationale of the stable isotope assay: (Zhang and Rock, 2008) Newly synthesized 13C-labeled GPL, shown here in red, are first inserted into the inner membrane (IM) following synthesis; (Pelletier et al., 2013) the likelihood that a given GPL that is trafficked from the IM to the OM will be labeled is proportional to the ratio of labeled to unlabeled GPL in the IM; (Bishop, 2014) a comparison of the ratios of labeled to unlabeled GPL in the inner and outer membranes will therefore reflect the efficiency of GPL transport.
Figure 5—figure supplement 2

Newly synthesized glycerophospholipids accumulate at the inner membrane of MlaA mutants.
(A) LC-MS/MS quantification of 13C labelled/unlabeled glycerophospholipids in isolated membrane fractions over time after growth in 2-13C acetate in ∆mlaC and complemented strain. Facet labels on the right indicate the specific glycerophospholipid species analyzed and the acyl chain length. PG, phosphatidylglycerol; PE, phosphatidylethanolamine. Shown is representative data from repeated experiments. (B) LC-MS/MS quantification of 13C labelled/unlabeled glycerophospholipids in isolated membrane fractions over time after growth in 2-13C acetate in ∆mlaF and complemented strain. Facet labels on the right indicate the specific glycerophospholipid species analyzed and the acyl chain length. PG, phosphatidylglycerol; PE, phosphatidylethanolamine. Shown is representative data from repeated experiments. (C) Relative proportion of newly synthesized GPL on IM and OM after one hour growth in 2-13C acetate. Error bars represent ±s.d. (n = 2). Statistical analyses performed using a Student’s t test. p-Value: *, p < 0.05; **, p < 0.01.
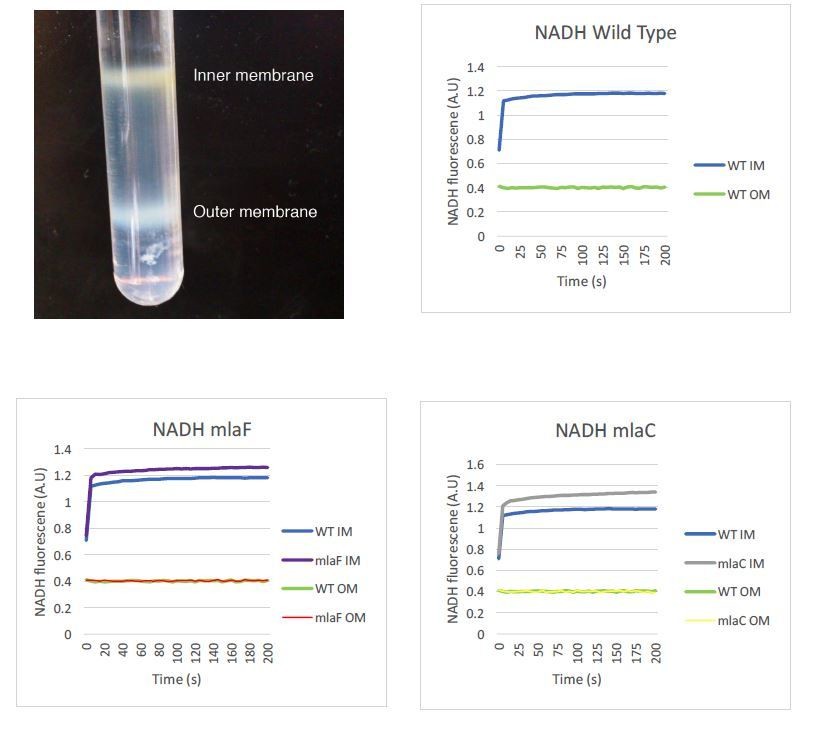
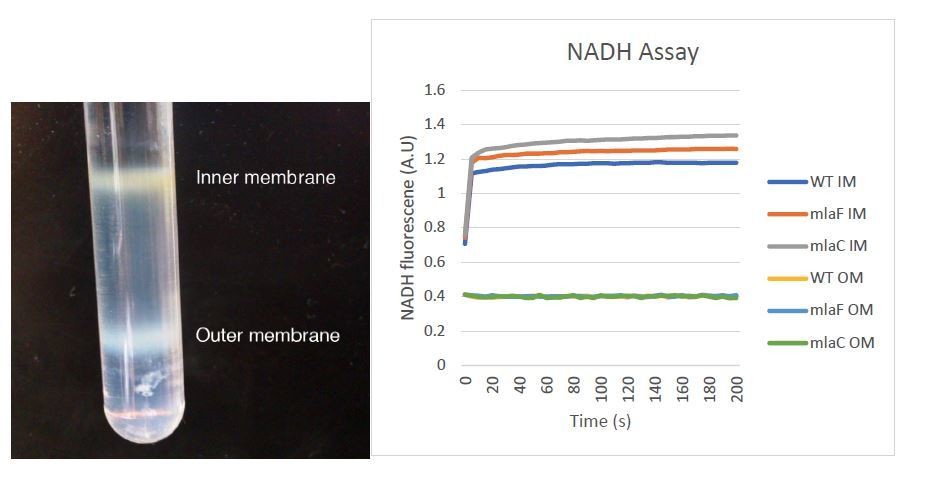
Figure 5—figure supplement 3
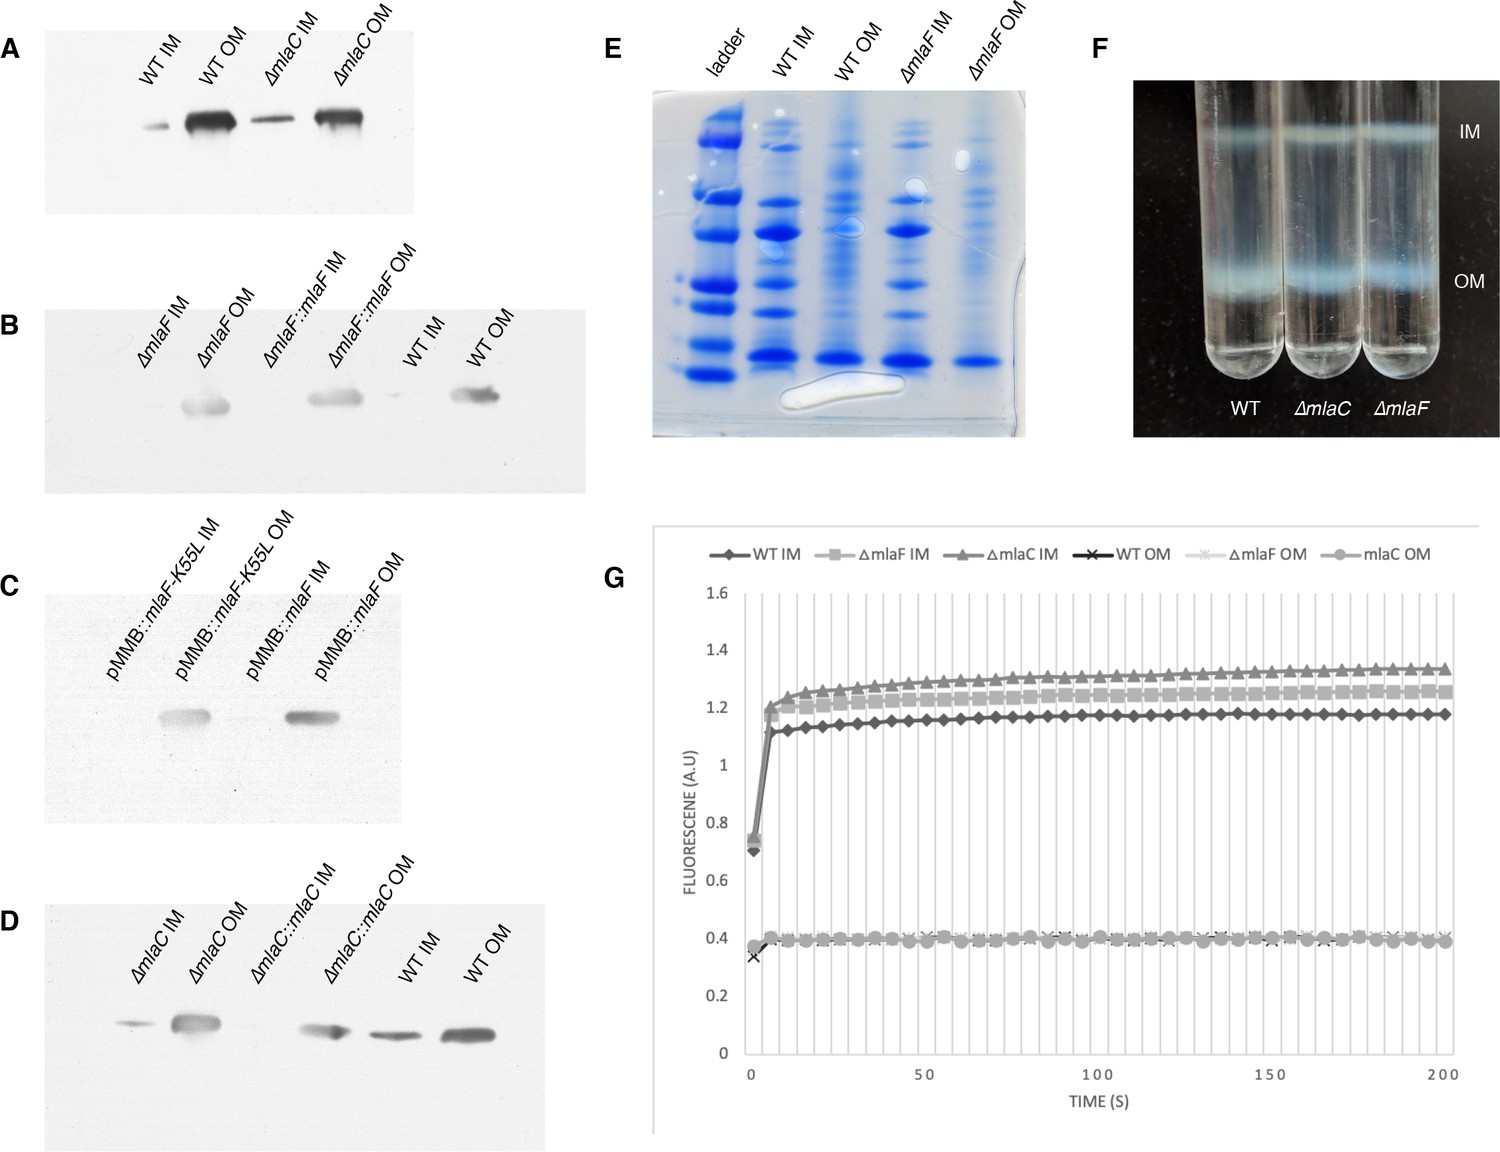
Confirmation of inner and outer membrane separation.
Each lane contains 10 µg total protein as measured by Bradford protein assay. (A) ɑ-OmpA Western blot of separated membranes analyzed in Figure 4. (B) ɑ-OmpA Western blot of separated membranes analyzed in Figure 5A (C) ɑ-OmpA Western blot of separated membranes analyzed in Figure 5B. (D) ɑ-OmpA Western blot of separated membranes analyzed in Figure 5C. (E) Coomasie stained SDS-protein gel of representative isolated membrane samples alongside BioRad Precision Plus Protein Standard. (F) Separation of inner and outer membranes into distinct bands by 3-step sucrose gradient. (G) NADH assay for enzymatic activity of inner membrane.
Figure 6
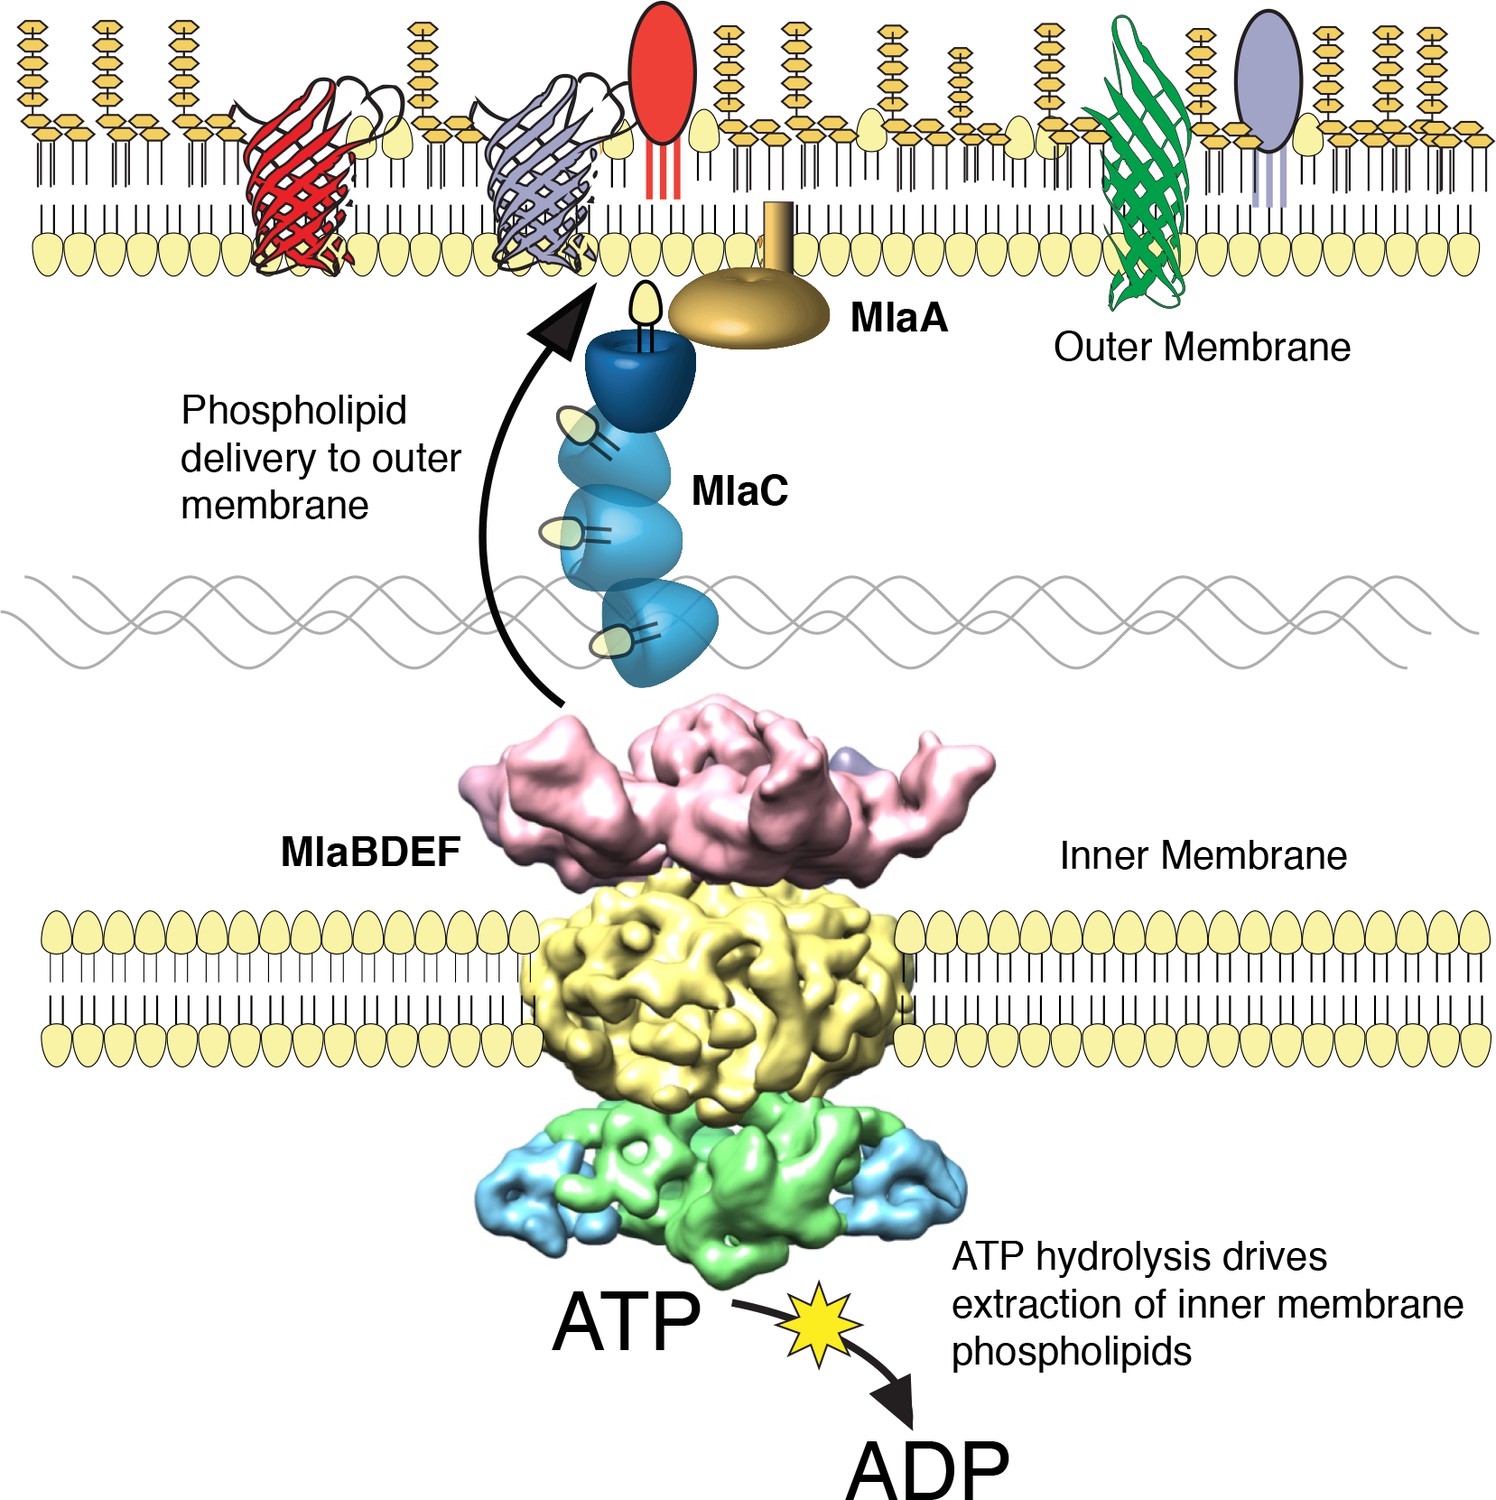
The multicomponent Mla system transports glycerophospholipids from the inner membrane to the outer membrane of A. baumannii.
A schematic of glycerophospholipid transport to the Gram-negative bacterial outer membrane by the Mla system.
Author response image 1
Author response image 2
Tables
Key resources table
| Reagent type (species) or resource | Designation | Source or reference | Identifiers | Additional information |
|---|---|---|---|---|
| Gene (Acinetobacter baumannii) | mlaC | NA | Genbank Accession: AKA30172.1 | |
| Gene (A. baumannii) | mlaF | NA | Genbank Accession: AKA30169.1 | |
| Gene (A. baumannii) | mlaE | NA | Genbank Accession: AKA30170.1 | |
| Gene (A. baumannii) | mlaD | NA | Genbank Accession: AKA30171.1 | |
| Gene (A. baumannii) | mlaB | NA | Genbank Accession: AKA30173.1 | |
| Gene (A. baumannii) | mlaA | NA | Genbank Accession: AKA32955.1 | |
| Gene (A. baumannii) | phoU | NA | Genbank Accession: AKA33305.1 | |
| Strain, strain background (A. baumannii) | Acinetobacter baumannii ATCC 17978 | Pelletier et al., 2013Baumann et al., 1968Source: ATCC | GenBank ACCESSION: CP000521 | |
| Genetic reagent (A. baumannii) | ATCC 17978 ∆phoU | This paper | Chromosomal deletion in ATCC 17978 by allelic exchange using pEX2tetRA vector | |
| Genetic reagent (A. baumannii) | ∆mlaF | This paper | Chromosomal deletion in ATCC 17978 by allelic exchange using pEX2tetRA vector | |
| Genetic reagent (A. baumannii) | ∆mlaC | This paper | Chromosomal deletion in ATCC 17978 by allelic exchange using pEX2tetRA vector | |
| Genetic reagent (A. baumannii) | ∆mlaA | This paper | Chromosomal deletion in ATCC 17978 by allelic exchange using pEX2tetRA vector | |
| Antibody | anti-OmpA (rabbit polyclonal) | This paper | Made to purified OmpA by GenScript Biotech Corp (1:1000) | |
| Recombinant DNA reagent | pMarKT (plasmid) | This paper | Progenitors: C9 Himar (PCR), TetRA from Tn10 (PCR), pACYC184, pBT20. | |
| Recombinant DNA reagent | pEX2tetRA (plasmid) | This paper | Progenitors: tetRA (PCR), pEXG2 | |
| Recombinant DNA reagent | pMMBkan (plasmid) | This paper | Kanamycin resistance marker inserted at DraI site of pMMB67EH | |
| Recombinant DNA reagent | pMMBkan:MlaF (plasmid) | This paper | pMMBKan expressing mlaF | |
| Recombinant DNA reagent | pMMBkan:MlaFK55L (plasmid) | This paper | pMMBKan expressing Walker box mutant of mlaF | |
| Recombinant DNA reagent | pET28a:MlaFEDCB-His (plasmid) | This paper | pET28a expressing MlaFEDCB with C-terminal HISX6 tag on MlaB. | |
| Recombinant DNA reagent | pET15b-mlaC-SD-His (plasmid) | This paper | pET15b expression vector containing MlaC soluble domain with C-terminal HisX6 tag. | |
| Recombinant DNA reagent | pET15b-mlaD- SD-His (plasmid) | This paper | pET15b expression vector containing MlaD soluble domain with C-terminal HisX6 tag. | |
| Chemical compound, drug | 2–13C acetate | Cambridge Isotope Laboratories, Inc. | ||
| Chemical compound, drug | BCIP-Toluidine (XP) | Gold Biotechnology | B-500–10 | |
| Chemical compound, drug | N-Phenyl-1-naphthylamine (NPN) | Sigma Aldrich | 104043–500G | |
| Chemical compound, drug | NADH | Sigma Aldrich | 606-68-8 | |
| Chemical compound, drug | CCCP (Carbonyl cyanide 3-chlorophenylhydrazone) | Sigma-Aldrich | C2759-1G | |
| Software, algorithm | MotionCorr2 | Thong et al., 2016 | Dr. Agard Lab, University of CA San Francisco | |
| Software, algorithm | CTFFIND4 | Rohou and Grigorieff, 2015 | Dr. Grigorieff Lab, University of MA Medical Center | |
| Software, algorithm | Appion | Lander et al., 2009 | Dr. Carragher Lab, The Scripps Research Institute | |
| Software, algorithm | Relion 2 | Scheres, 2012 | Dr. Scheres Lab, MRC Lab of Molecular Biology | |
| Software, algorithm | EMAN2 | Tang et al., 2007 | Dr. Ludtke Lab, Blue Mountain College | |
| Software, algorithm | Chimera | Pettersen et al., 2004 | UCSF Resource for Biocomputing, Visualization, and Informatics | |
| Software, algorithm | Modeller | Webb and Sali, 2016 | Dr. Sali Lab, University of CA San Francisco | |
| Software, algorithm | Rosetta | DiMaio et al., 2011 | Dr. Baker Lab, University of WA |
Additional files
-
Supplementary file 1
Results of transposon mutagenesis screen for genes involved in outer membrane barrier function in ATCC 17978.
- https://doi.org/10.7554/eLife.40171.021
-
Supplementary file 2
Accumulation of newly synthesized glycerophospholipids in A. baumannii inner and outer membranes.
- https://doi.org/10.7554/eLife.40171.022
-
Transparent reporting form
- https://doi.org/10.7554/eLife.40171.023
Download links
A two-part list of links to download the article, or parts of the article, in various formats.
Downloads (link to download the article as PDF)
Open citations (links to open the citations from this article in various online reference manager services)
Cite this article (links to download the citations from this article in formats compatible with various reference manager tools)
The Acinetobacter baumannii Mla system and glycerophospholipid transport to the outer membrane
eLife 8:e40171.
https://doi.org/10.7554/eLife.40171


