Time-resolved mapping of genetic interactions to model rewiring of signaling pathways
- German Cancer Research Center, Germany
- Heidelberg University, Germany
Figures
Figure 1

Genetic interactions rewire over time.
(A) Schematic illustration of a synthetic lethal trajectory between two genes A and B. The co-perturbation of A and B shows no unexpected combinatorial effect at early time points. At later time points, the combined perturbation of both genes prohibits cells from growing and even leads to increased cell death. However, knockdown of A or B alone reduces fitness at either time point. Scale bar is 50 µm. Greyscale image of tubulin (FITC-mAB). CTRL represents non-targeting RNAi. Early = 3 d after dsRNA transfections. Late = 5 d after dsRNA transfection. (B) Interactions can be quantified for each condition by a multiplicative model of interaction as the deviation of the measured combined phenotype from the expected combined phenotype. (C) Theoretical systematic of context-dependent genetic interactions. Interactions can potentially be constant (I-III) or change over time (IV-VI). Interactions can be sensitive (III, VI) or resilient (I–II, IV–V) to an external treatment. Resilient interactions, can be alleviating (II, V, positive π-scores) or aggravating (I, IV, negative π-scores). Sensitive interactions have alternating π-scores (III, VI).
Figure 2 with 9 supplements
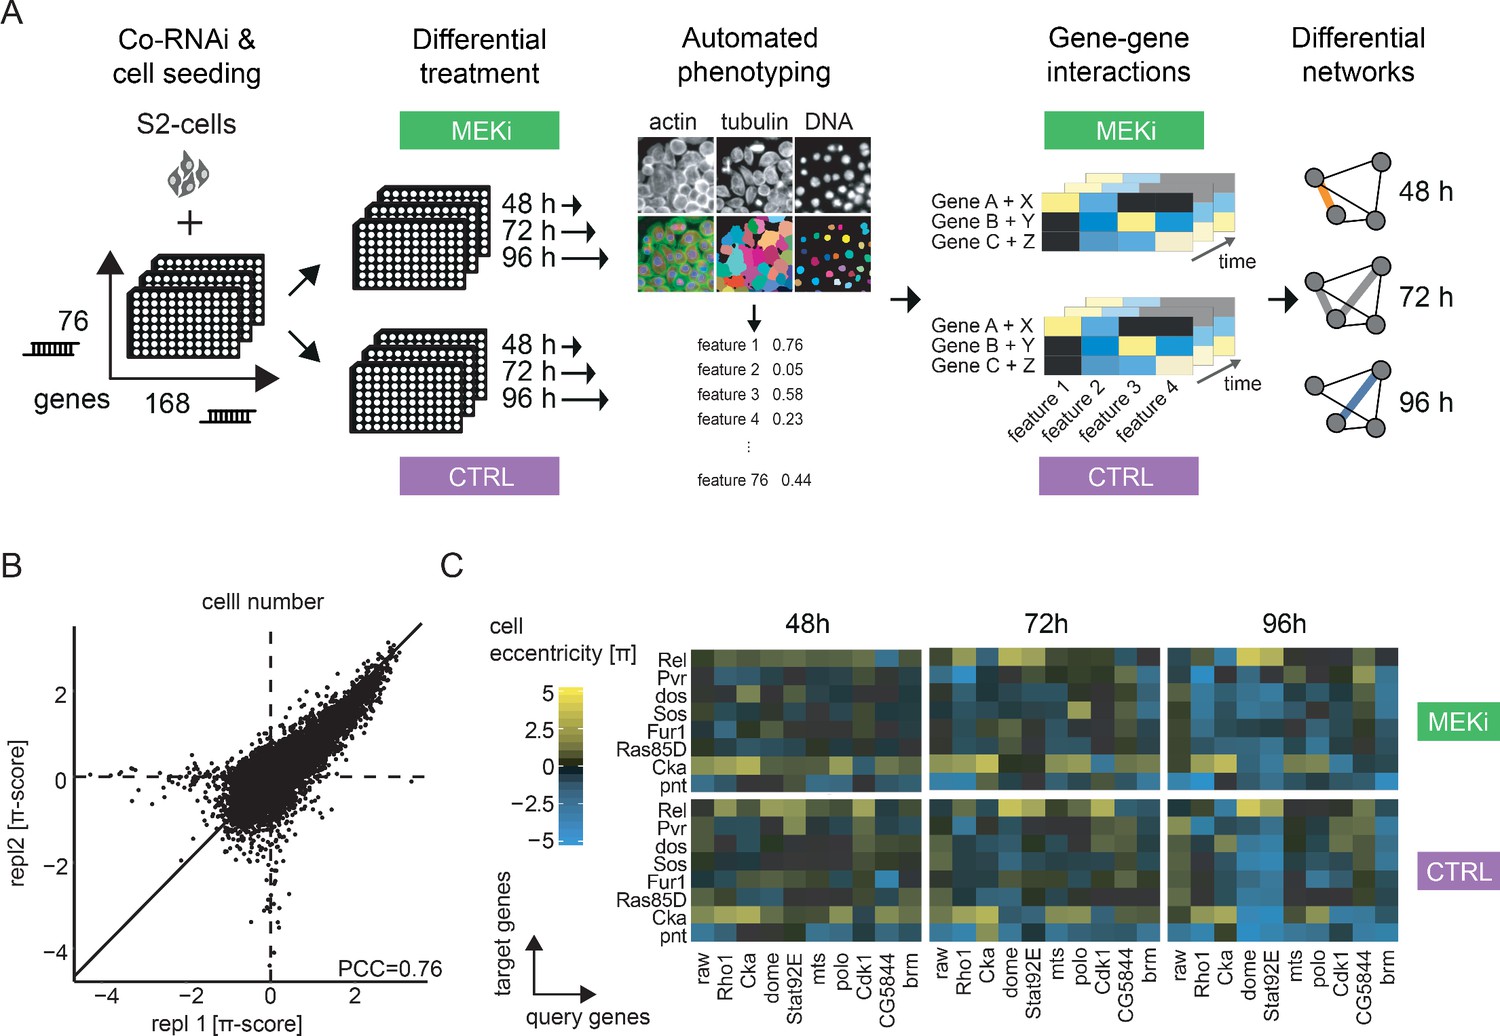
An image-based co-RNAi screen maps time resolved genetic interactions.
(A) Representation of the combinatorial RNAi (co-RNAi) screening setup. 168 ‘target’ and 76 ‘query’ genes were combined to all pairwise combinations and arranged accordingly in 384-well plates. S2 cells were reverse transfected with pre-spotted dsRNAs and incubated for 24 hr. Cells were treated either with small molecule (MEKi [PD-0325901], 1.5 nM) or DMSO (solvent control, 0.5% DMSO) and incubated for additional 48, 72 or 96 hr. The assay was stopped by fixation and staining of cells. Phenotypes were measured using automated microscopy and quantitative image analysis. Genetic interactions (π-scores) were called for 16 non-redundant phenotypic features from the combinatorial knock downs, separately for each treatment and time point. MODIFI was applied to identify significant differential genetic interactions. The model is defined as π[A,B,time,treatment] ~ σ[A,B] * time + δ[A,B] * treatment + ε[A,B] with π being the measured interaction for a pair of genes A and B at a given time and treatment. (B) Reproducibility of π-scores between biological replicates is high for the exemplary feature ‘cell number’ (PCC = 0.76). (C) Example of genetic interactions observed over time and treatment. Interaction data for the inhibitor treated and control condition are shown for eight selected target genes (y-axis) and 10 query genes (x-axis). Genetic interactions shown were calculated for the cell eccentricity feature.
Figure 2—figure supplement 1
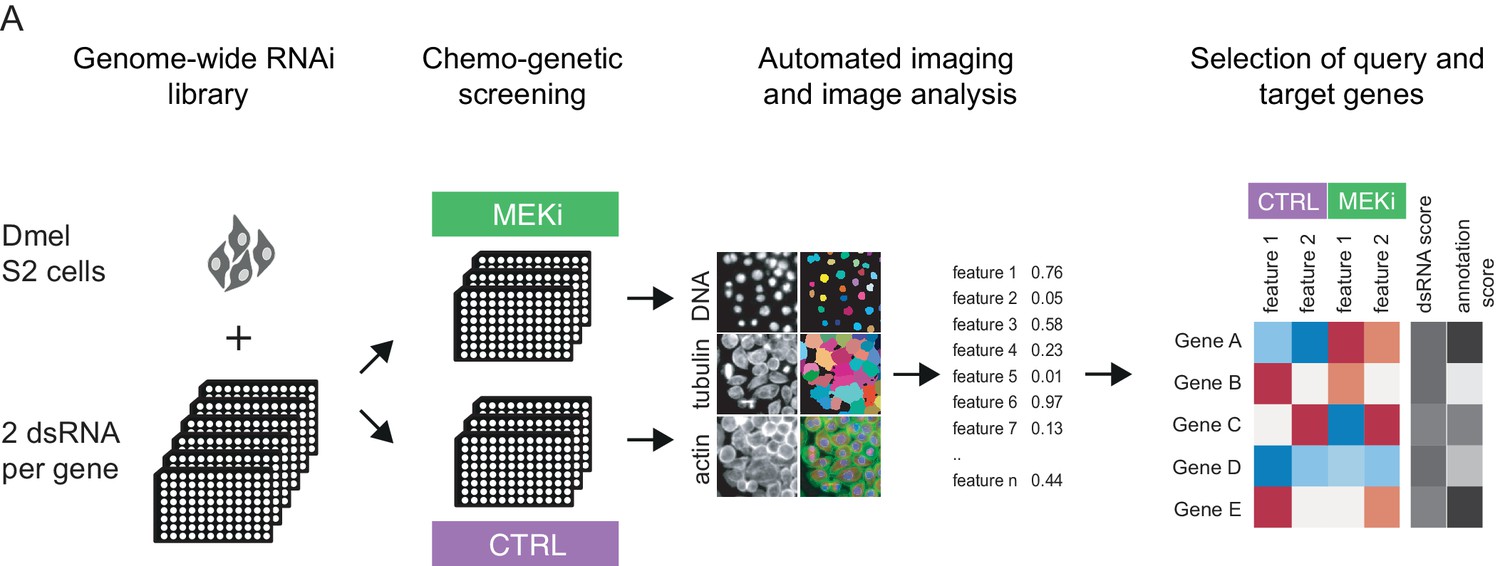
Measuring chemo-genetic interactions by high throughput imaging and RNAi.
(A) Schematic representation of the workflow. A genome-wide RNAi library covering 13,617 unique Drosophila genes with two dsRNA constructs was screened in the presence of DMSO (control) or MEKi (PD-0325901) at 1.5 nM. Fixed cells were stained for DNA, actin and α-tubulin and imaged at 20x magnification at a resolution of 2048 × 2048 pixels. Phenotypes were analyzed by automated image analysis of cell morphology on a single-cell level using an R/EBImage pipeline. Genes were rank ordered for co-RNAi screening by dsRNA score (quality and differential phenotype) and gene annotations (unknown genes favored).
Figure 2—figure supplement 2

A large proportion of phenotypic features deliver independent information.
To focus downstream analysis, normalized features describing the data need to be filtered to avoid redundancy in their information content otherwise skewing further clustering analysis. (A) Here, features were identified that do not correlate amongst each other but well between biological replicates, e.g. cell number and actin eccentricity. (B) Further, features are clustered by their correlation of interactions identifying clusters of features with near identical information content, based 96 hr Dsor1 inhibitor treatment bi-genic interaction data. A cluster is defined if its members correlate with absolute PCC >0.7. From each cluster, the feature with the highest correlation is chosen. This approach maximizes reproducibility while minimizing redundancy. ‘Cell number’ and ‘tubulin mad’ were fixed starting points in this analysis. (C) To verify the feature selection the linear correlation between cell number and actin eccentricity was analyzed. A weak correlation between (PCC = 0.48) indicated that both features provide independent information (D) Filtered this way, the 16 final features remain biologically interpretable while simultaneously delivering independent information as analyzed using information gain analysis introduced in earlier studies (Fischer et al., 2015; Laufer et al., 2013).
Figure 2—figure supplement 3
Screening quality control.
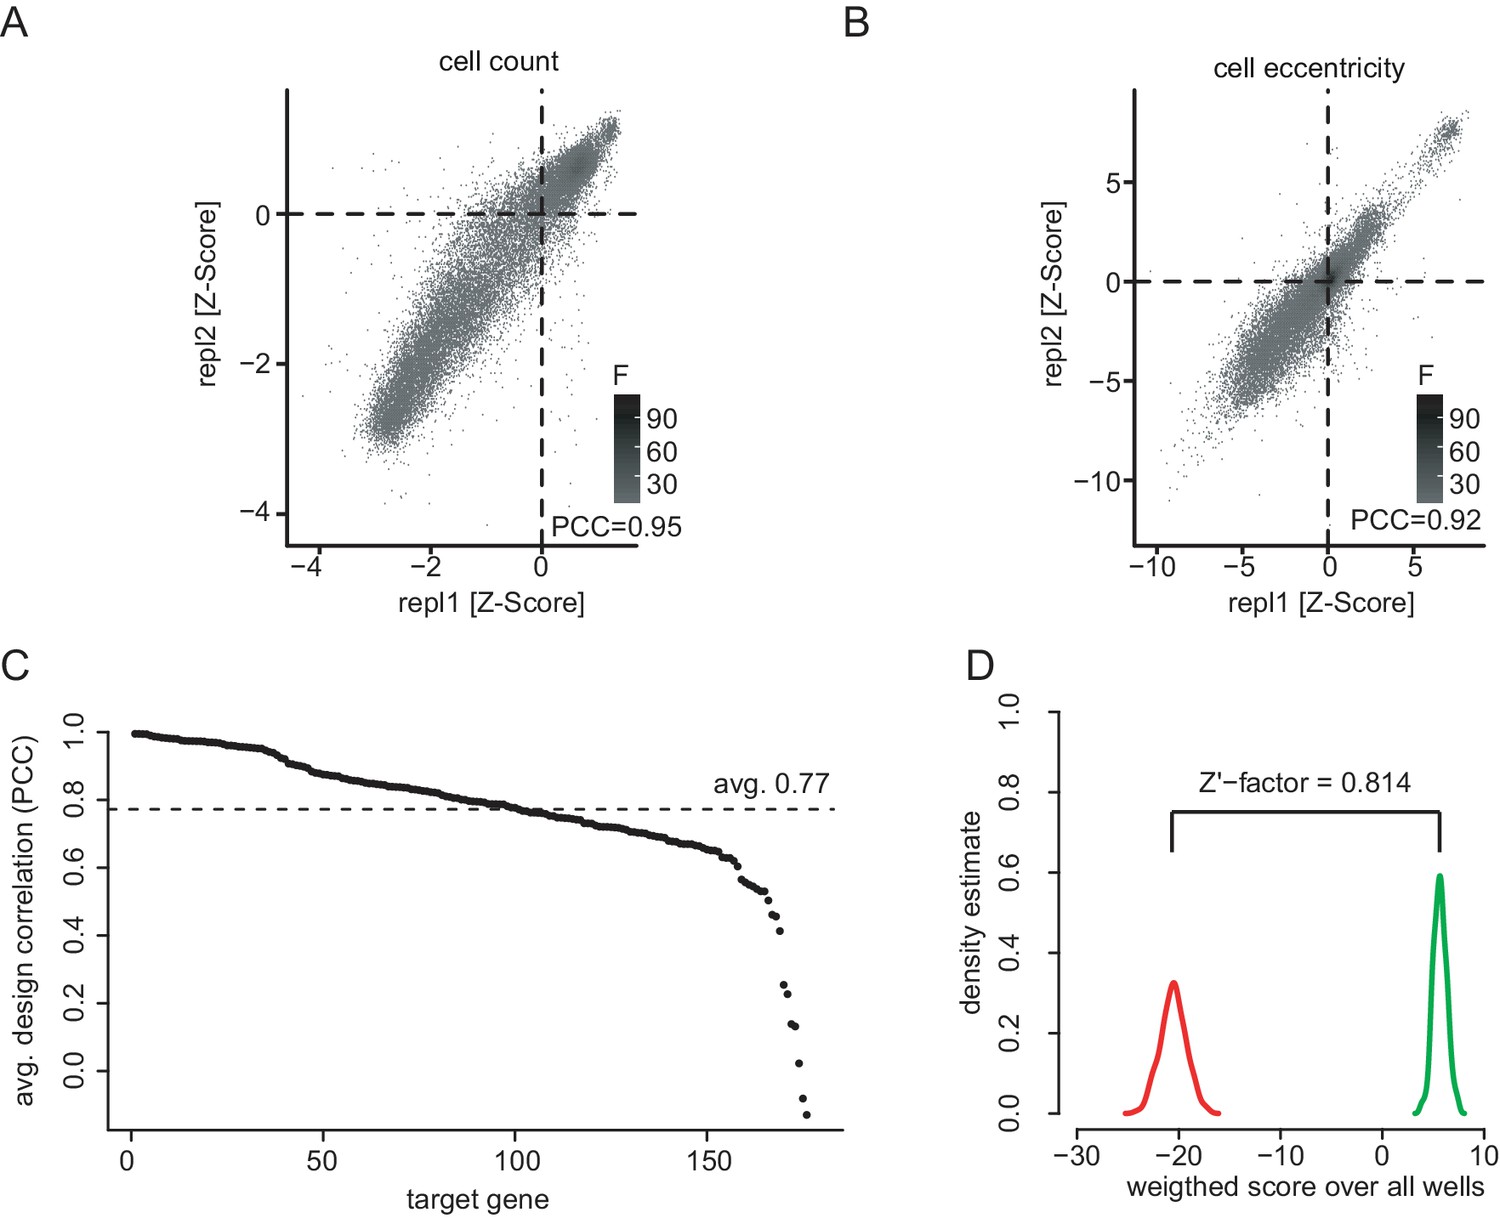
(A) Quality control of the co-RNAi screen. Scatter plots showing all replicate measurements of normalized and processed phenotypic feature data for cell count (PCC = 0.95) and cell eccentricity (B, PCC = 0.92). Plates for which positive (RasGAP1) and negative (Diap1) controls could not be distinguished (Z’-factor < 0.3) were excluded. Data was normalized for plate and batch effects using median normalization and scaled and centered using Z-score analysis. (C) RNAi reagents ranked by dsRNA design correlation. dsRNAs were paired by gene to calculate pairwise correlations along 16 selected features. All dsRNAs together showed an average design correlation of PCC = 0.77. Figure C and D show data 96 hr after MEK inhibitor treatment representatively. (D) Assay performance assessed by statistical effect size. The multi-variate Z’-factors between the positive control knockdown of RasGAP1 and a negative control knockdown of Pvr (Zhang et al., 1999) were calculated for the selected 16 phenotypic features for the MEKi screen after 96 hr.
Figure 2—figure supplement 4
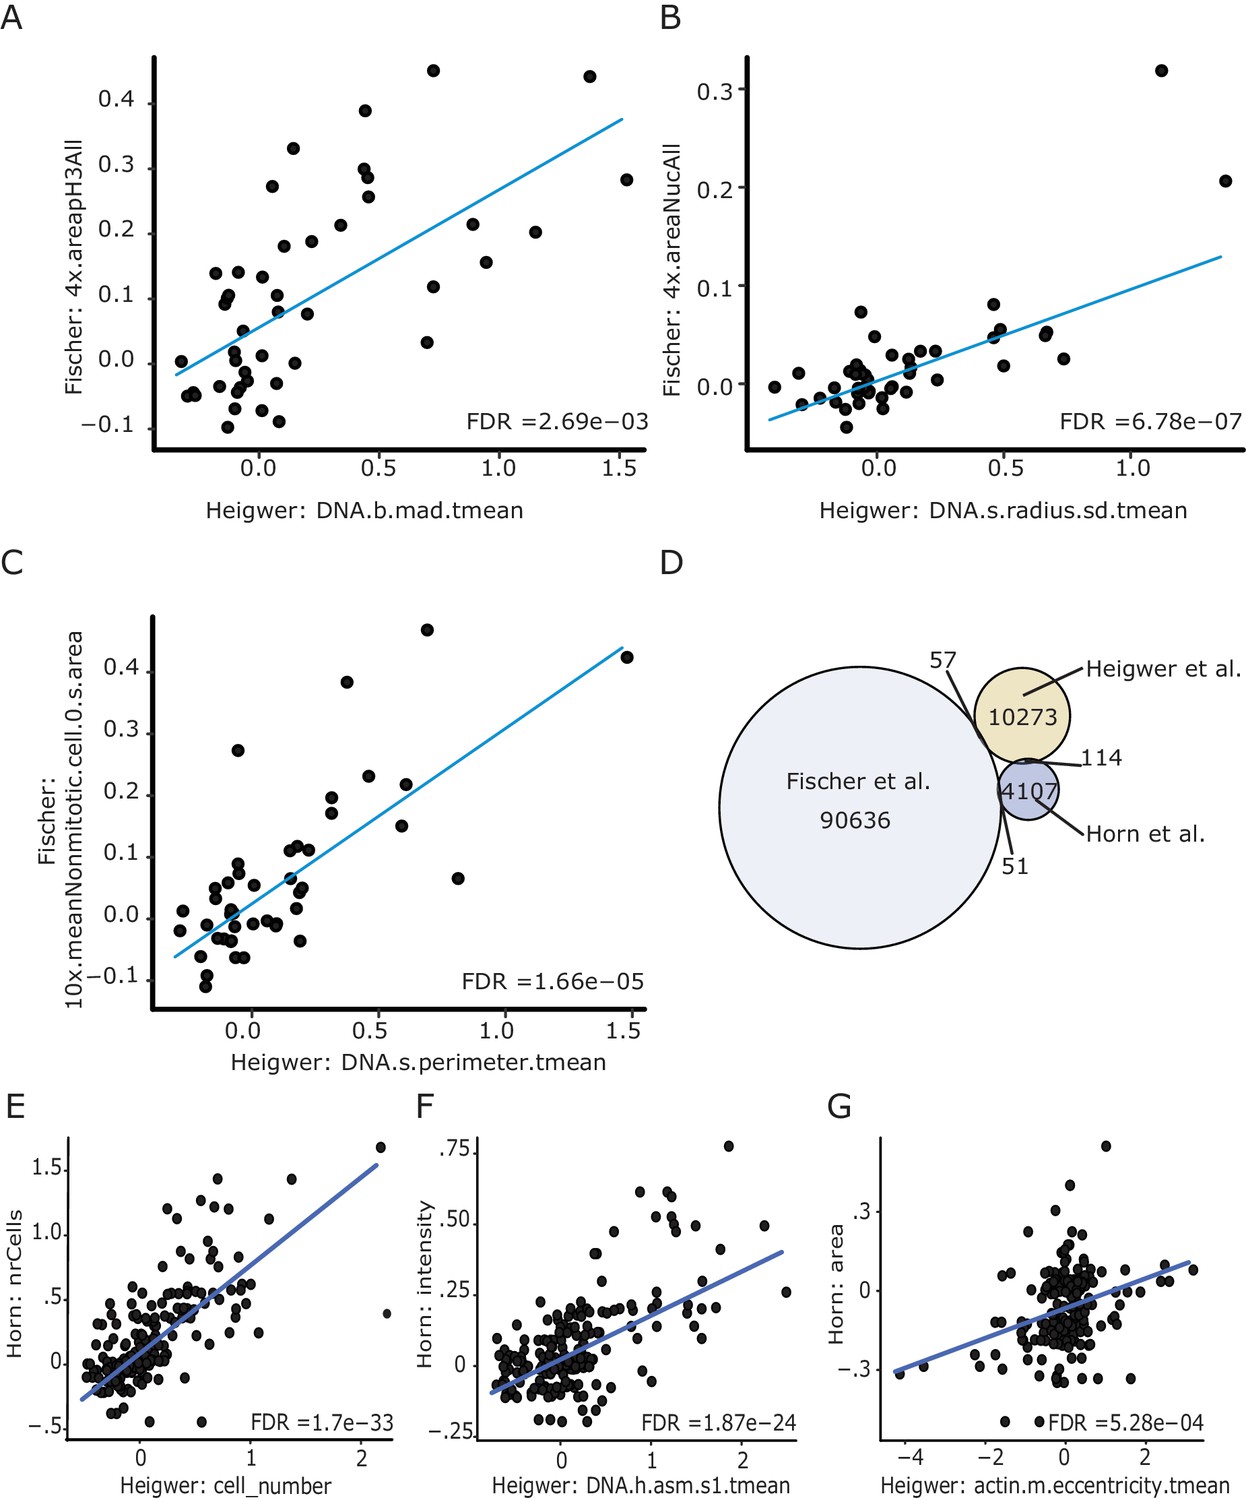
Image derived phenotypes closely resemble those of preceeding screens.
(A–C) Starting with measurements of genetic interacton strength (π-score) of all bi-genic combination that were screened in Fischer et al. and this study we found a number of highly correlating features measuring: (A) DNA distribution in the nucleus, (B) radius of the nucleus, (C) area of the cell and the nulceus (Fischer et al., 2015; Horn et al., 2011). (D) Venn Diagram showing the overlap and uniquely screened bi-genic Drosophila genetic interactions. To increase the reate of novel findings but retain backwards comparability all screens contain minimal overlap and add to the larger map of synthetic genetic interactions of the fly cell. (E–G) Sustantial comparability between Heigwer and Horn et al.
Figure 2—figure supplement 5
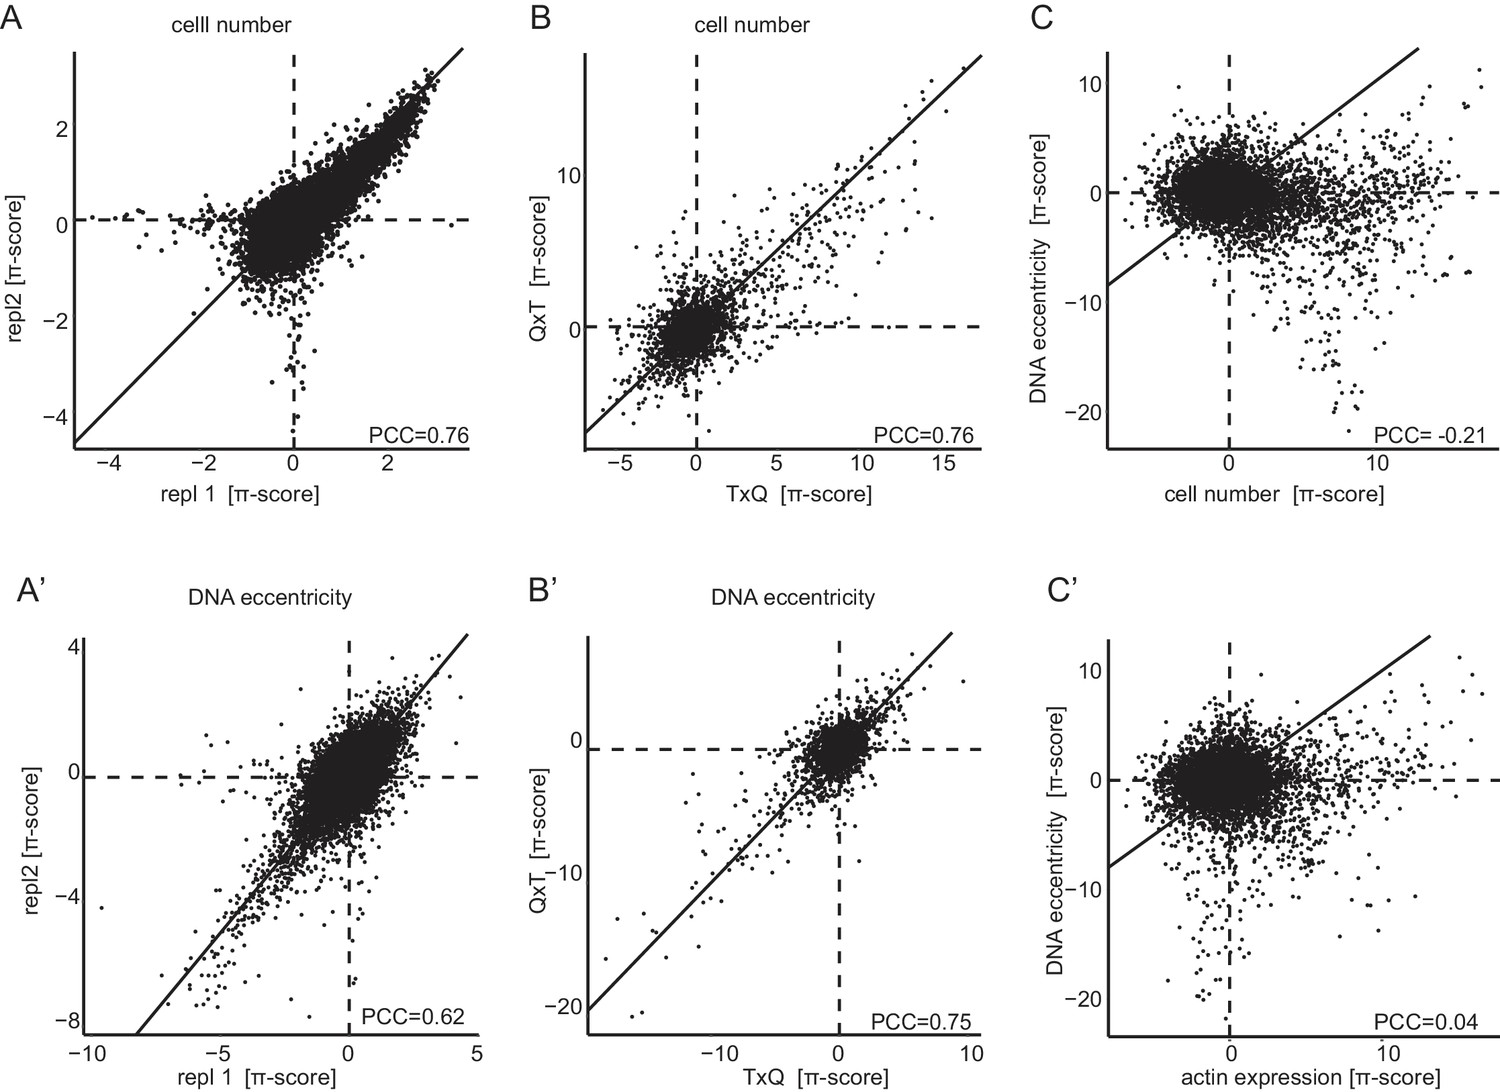
Genetic interactions are reproducible, permutation agnostic and non-redundant.
Interactions measured by π-scores were analyzed for one representative condition (Dsor1 inhibition 96 hr). (A,A’) Reproducibility of π-scores between biological replicates is high for the exemplary features ‘cell number’ and ‘DNA eccentricity’, PCC = 0.76 and PCC = 0.62. (B,B’) Similar correlations, PCC = 0.76 and PCC = 0.75 respectively, are obtained when comparing the query-target (QxT) interaction with the target-query (TxQ). Both combinatorial variants are measured independently in this experiment for half of all target genes. (C,C’) Weak linear correlation between genetic interactions caluclated for different phenotypic features indicates non-redundancy of multiparametric interactions (PCC of −0.24 between ‘DNA eccentricity’ and ‘cell number’ and 0.04 between ‘DNA eccentricity’ and ‘actin level’). Diagonal lines were drawn to indicate the identity. Horizontal and vertical lines indicate zero crossing.
Figure 2—figure supplement 6
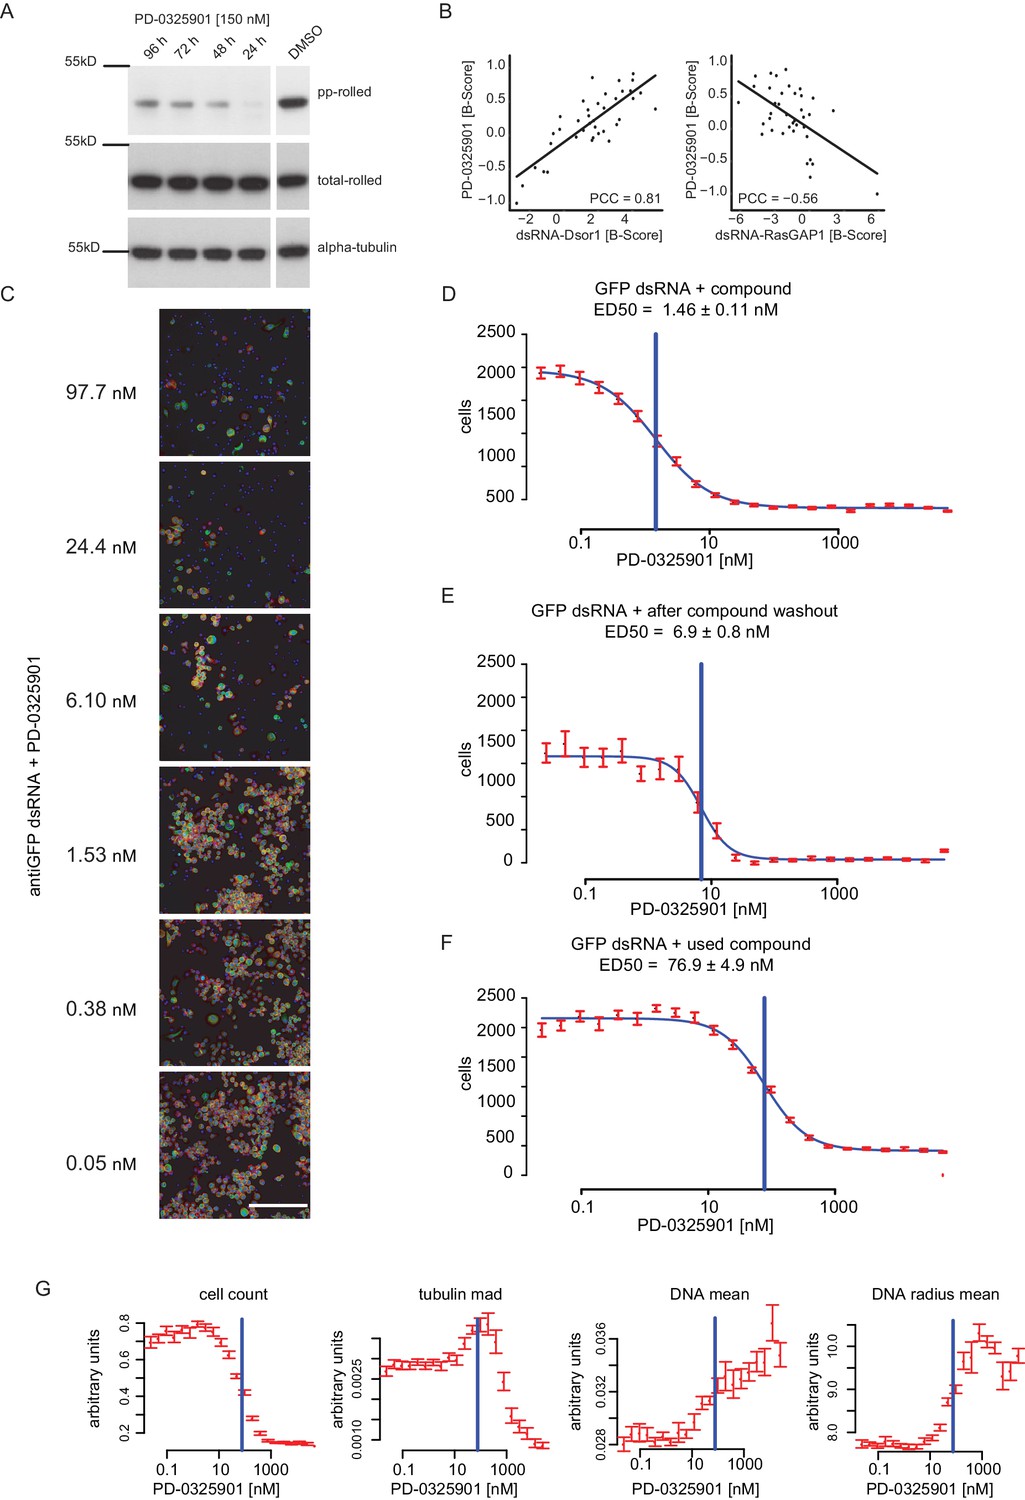
Dsor1 inhibiting effect of PD-0325901 shown by loss of rl phosphorylation, loss of viability and differential phenotypic responses.
(A) S2 cells were treated for either 24 hr, 48 hr, 72 hr and 96 hr using 150 nM PD-0325901 in 0.5% DMSO. Samples were lysed and subjected to western blot analysis. The DMSO only control was treated the same way in the same experiment and blotted on the same membrane, however initially not right next to the other samples. Membranes were stripped and re-probed for total-rolled and α-tubulin after each development. (B) Correlation analysis of compound (MEKi) vs. RNAi perturbation of Dsor1. Data was taken from B-Score normalized genome wide chemo-genetic screens. Thirty-eight features were analysed between MEK inhibitor and anti-RLUC treated controls (MEKi) and either Dsor1 or RasGAP1 knockdown. Correlation of median feature vectors is given as Pearson correlation coefficient (PCC). (C) Image based illustration of the concentration depended decline in cellular fitness (Scale bar = 140 µm). (D) Dose-response curve under co-perturbation with a dsRNA against GFP (not expressed in these cells). (E) Dose-response curve of the same cells after the drug containing medium was washed out and cells were left to grow for another 72 hr. (F) Dose-response curve after treatment of freshly seeded cells with the remainder medium of the treated cells. A horizontal blue line demarks the ED50 as estimated by four-parameter logistic regression (blue curve fit). All values are mean ±s.e.m. (red, n = 32). (G) Dose-Response curves were measured using a fluorescent microcopy-based read-out. Cells were segmented and extracted features summarized per well. Multiple features show a distinctive reactivity towards chemical inhibition of Dsor1 and demonstrate the power of multi-parametric phenotyping for measuring cellular reactions to small molecule treatment. The blue line indicates the ED50 estimate in this experiment. Data were taken from the ‘used compound’ treatment (E).
Figure 2—figure supplement 7
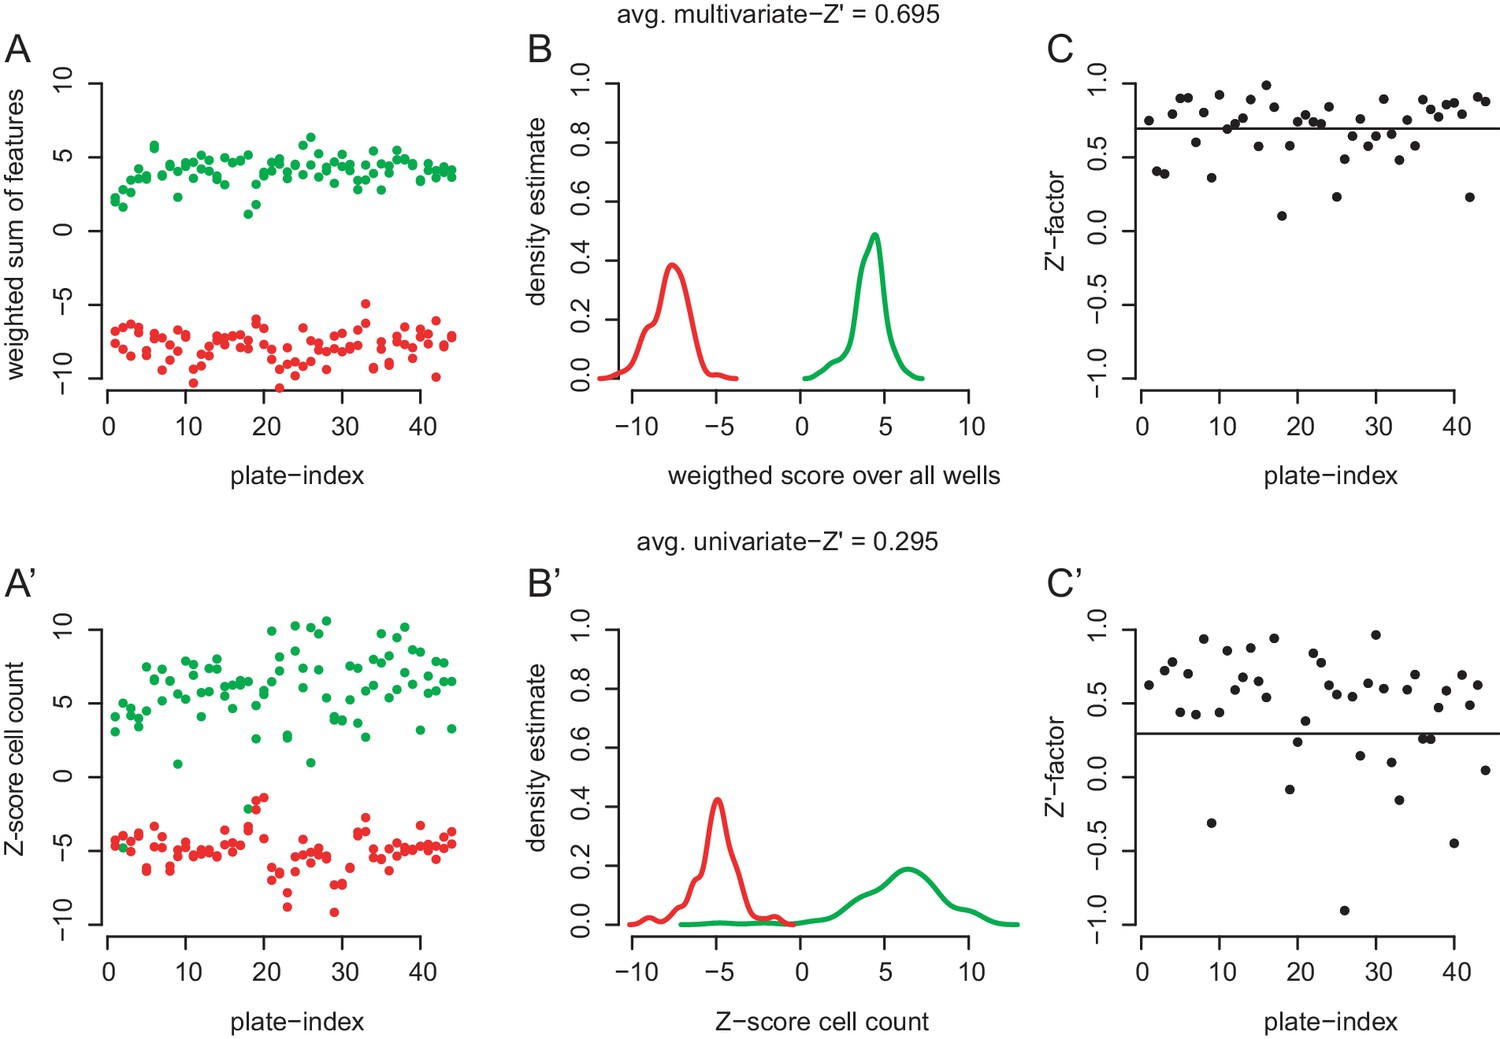
Ability of the cell morphology assay to distinguish phenotypes produced by control dsRNA.
(A,A’) Cells were pertubed with dsRNA against RasGAP1 (green) and drk (red) and treated with 0.5% DMSO (#1 dsRNA designs). Each plate contained two wells of each control. (A) Weighted feature sums were summarized by multiplying each feature score with the feature’s scaling in an linear discriminant analysis (lda) between positive and negative controls. The lda was performed on data from all plates together. The weighted sum of scores is plotted against the plate index. (A’) Data for unscaled cell count only plotted against palte index. (B) Density estimates of the data shown in (A). Note the good separation betwenn positive and negative control phenotypes. (B’) Density estimates of data shown in (A’). Note significant overlap between the two control populations. (C) Multivariate Z’-factors on the basis of 38 selected features (Caicedo et al., 2017). An average Z’-factor of 0.695 marks an almost excellent performance of the multivariate assay to disguish controls in most plates. (C’) When using only one readout such as cell count, the average Z’-factor drops to 0.295.
Figure 2—figure supplement 8

Measuring chemo-genetic interactions by high-throughput imaging and RNAi.
(A) Well-level correlation of biological replicates. Shown are B-score normalized cell count data (left, PCC = 0.64) and nuclear texture scores (right, PCC = 0.82) exemplarily for the control condition. One outlier was flagged and not plotted for nuclear texture. (B) Comparison of induced phenotypes by correlation of feature vectors (Pearson correlation coefficient [PCC] and asymptotic p-value). Knockdown of Dsor1 and drk, two known positive regulators of Ras signaling resulted in high (PCC = 0.91) positive correlation. Knockdown of RasGAP1 (neg. regulator of Ras) and Dsor1 induced inverse correlating feature vectors (PCC = −0.78). dsRNA reagents directed against the same gene show a high level of similarity (RasGAP1 design #1 vs. #2, PCC = 0.88). (C) Feature vectors for selected genes regulating Ras signaling and protein translation. Hierarchical clustering groups genes into regulatory units, marked by similar feature profiles. Shown are average B-scores across replicates of 16 representative features. (D) Hierarchical clustered matrix of pairwise correlations. Pairwise PCC were calculated for all example genes in (C). Clustering genes by their pairwise correlation sorted them into groups of functionally related genes. All data show MEK inhibited condition, if not noted otherwise.
Figure 2—figure supplement 9
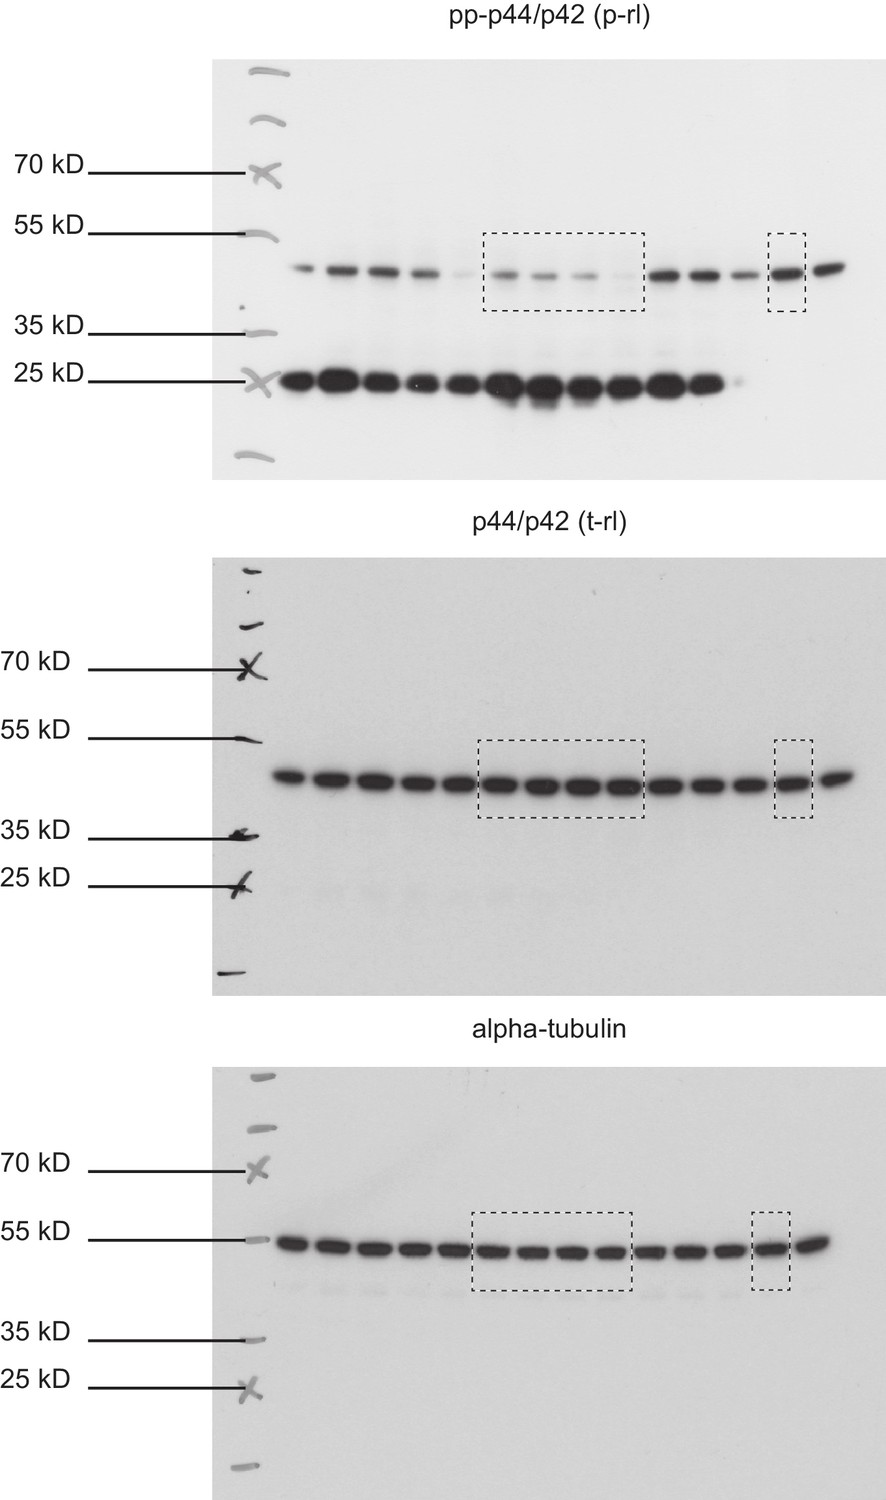
Full immunoblots.
Full, un-edited immunoblots accompanying (Figure 2—figure supplement 6). Areas that were cut are indicated. Raw scans of developed Amersham hyperfilms (GE-Healthcare). Exposure times varied from 3 s to 10 s. Membranes were stripped and re-probed for total-rolled and α-tubulin after each development.
Figure 3 with 1 supplement

Robust linear models describe the continuity of genetic interaction rewiring.
(A) Derived measures from the interaction model: the time dependence (σ) of interaction development, treatment sensitivity (δ) of response to MEKi and average initial interaction difference. (B) Differential interactions detected depending on the used data and model. Significant (FDR < 0.1) differential interactions were counted when analyzed using a linear model (lm), a robust linear model (rlm), a moderated t-test (limma) or Welch’s t-test. End-point, sequential and randomized data were compared. The analysis was carried out for all features and accumulated counts are shown. ‘none’ means that all time points were treated as replicates of the same measurement. ‘rand’ means that measurements were assigned to random time points and 96 hr denotes the data treated as end-point measurements of the last time point. All models tested the null hypothesis that there is no difference between treatments. A two-sided Welch’s t-test was used. The robust linear model (rlm) coefficient’s significance was estimated using robust F-tests. The significance of the linear model coefficient was tested by two-way ANOVA. (C) Measurement of sensitivity toward MEKi. The treatment sensitivity was assessed by comparing δ between biological processes. Significance was tested by a two-sided Kolmogorov-Smirnov test of the sample against all measured interactions. Resulting p-values are indicated. Upper-left p-value compares process specific δ between translation and proteasome.
Figure 3—figure supplement 1
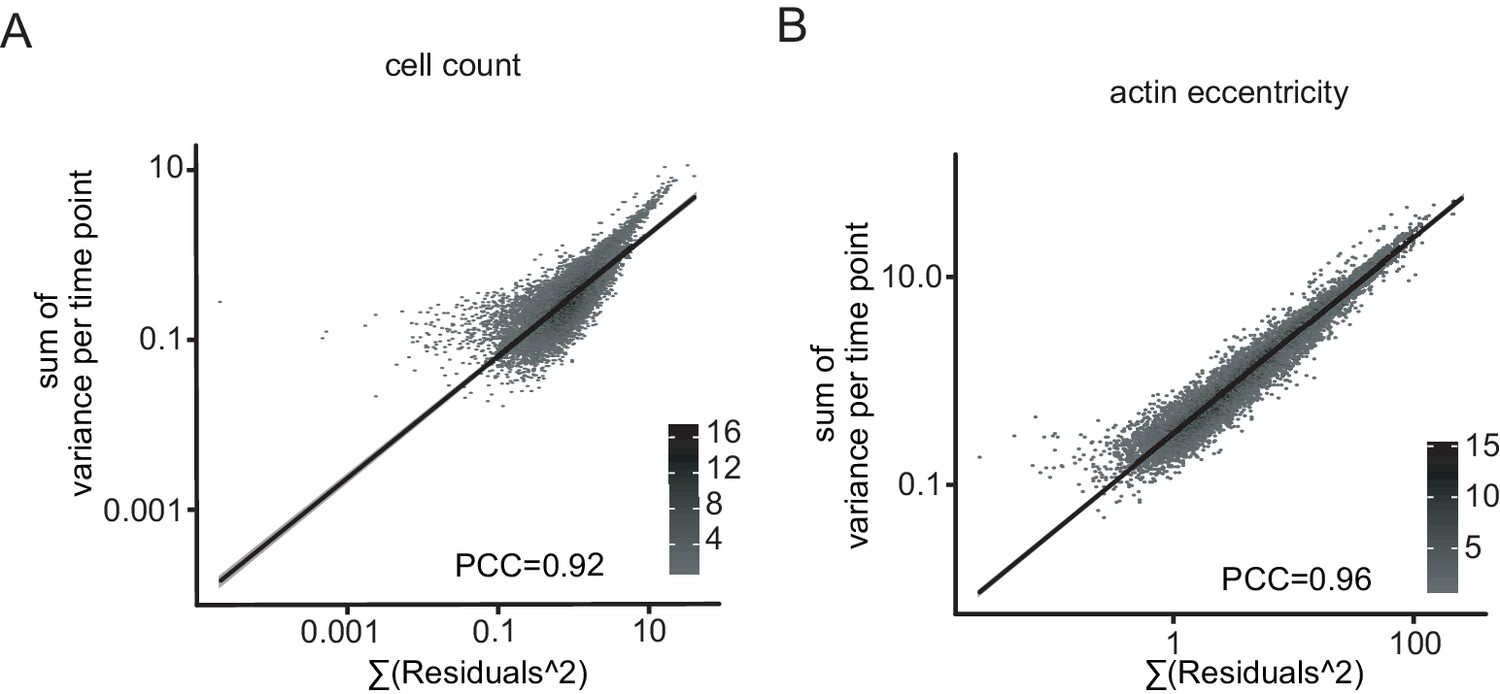
Robust linear models reliable quantify the differential interactions.
(A) Robust linear model credibility. Residuals are compared to replicate variance for each time point, exemplarily shown for cell count (A, PCC = 0.92) and cell eccentricity (B, PCC = 0.96). Trendline indicates good agreement of residuals and variance.
Figure 4 with 1 supplement

Genetic interactions rewire over time.
(A–D) Examples of time- and treatment-dependent genetic interactions: (A) alleviating treatment-insensitive interaction of Prosbeta4 (proteasome) and mts (cytoskeleton), treatment invariant and increasing over time, (B) aggravating- treatment-insensitive interaction of ksr and rl (both Ras signaling), treatment invariant and decreasing over time, (C) positive treatment-sensitive interaction of skd (mediator complex) and Stat92E (STAT receptor), lifted from synthetic lethal to non-interacting by treatment, (D) negative treatment-sensitive interaction of Rel (innate immunity) and pnt (Ras signaling), π-scores decreased by the treatment. (cell count, FDR < 0.1, robust f.test followed by multiple testing correction after Benjamini Hochberg). Dashed lines are trendlines for each treatment group. (E) Interaction counts after MODIFI. Interactions (FDR < 0.1) are counted for 16 features, grouped into cell count, shape, texture and intensity within cell and nucleus.
Figure 4—figure supplement 1

Time- and treatment-dependent interaction between skd and Stat92E.
Interactions measured by π-scores were analyzed across all conditions. Shown bars are always from left to right: skd knock down, Stat92E knockdown, expected co-perturbation phenotype, measured co-knockdown of skd and Stat92E and the calculated difference between observed and detected co-perturbation (π). All bars are in units of cell count z-score normalized. Single knockdown phenotypes rarely change over time, while the π-score does change the interaction is largely treatment sensitive. Bars are mean of four replicates.
Figure 5
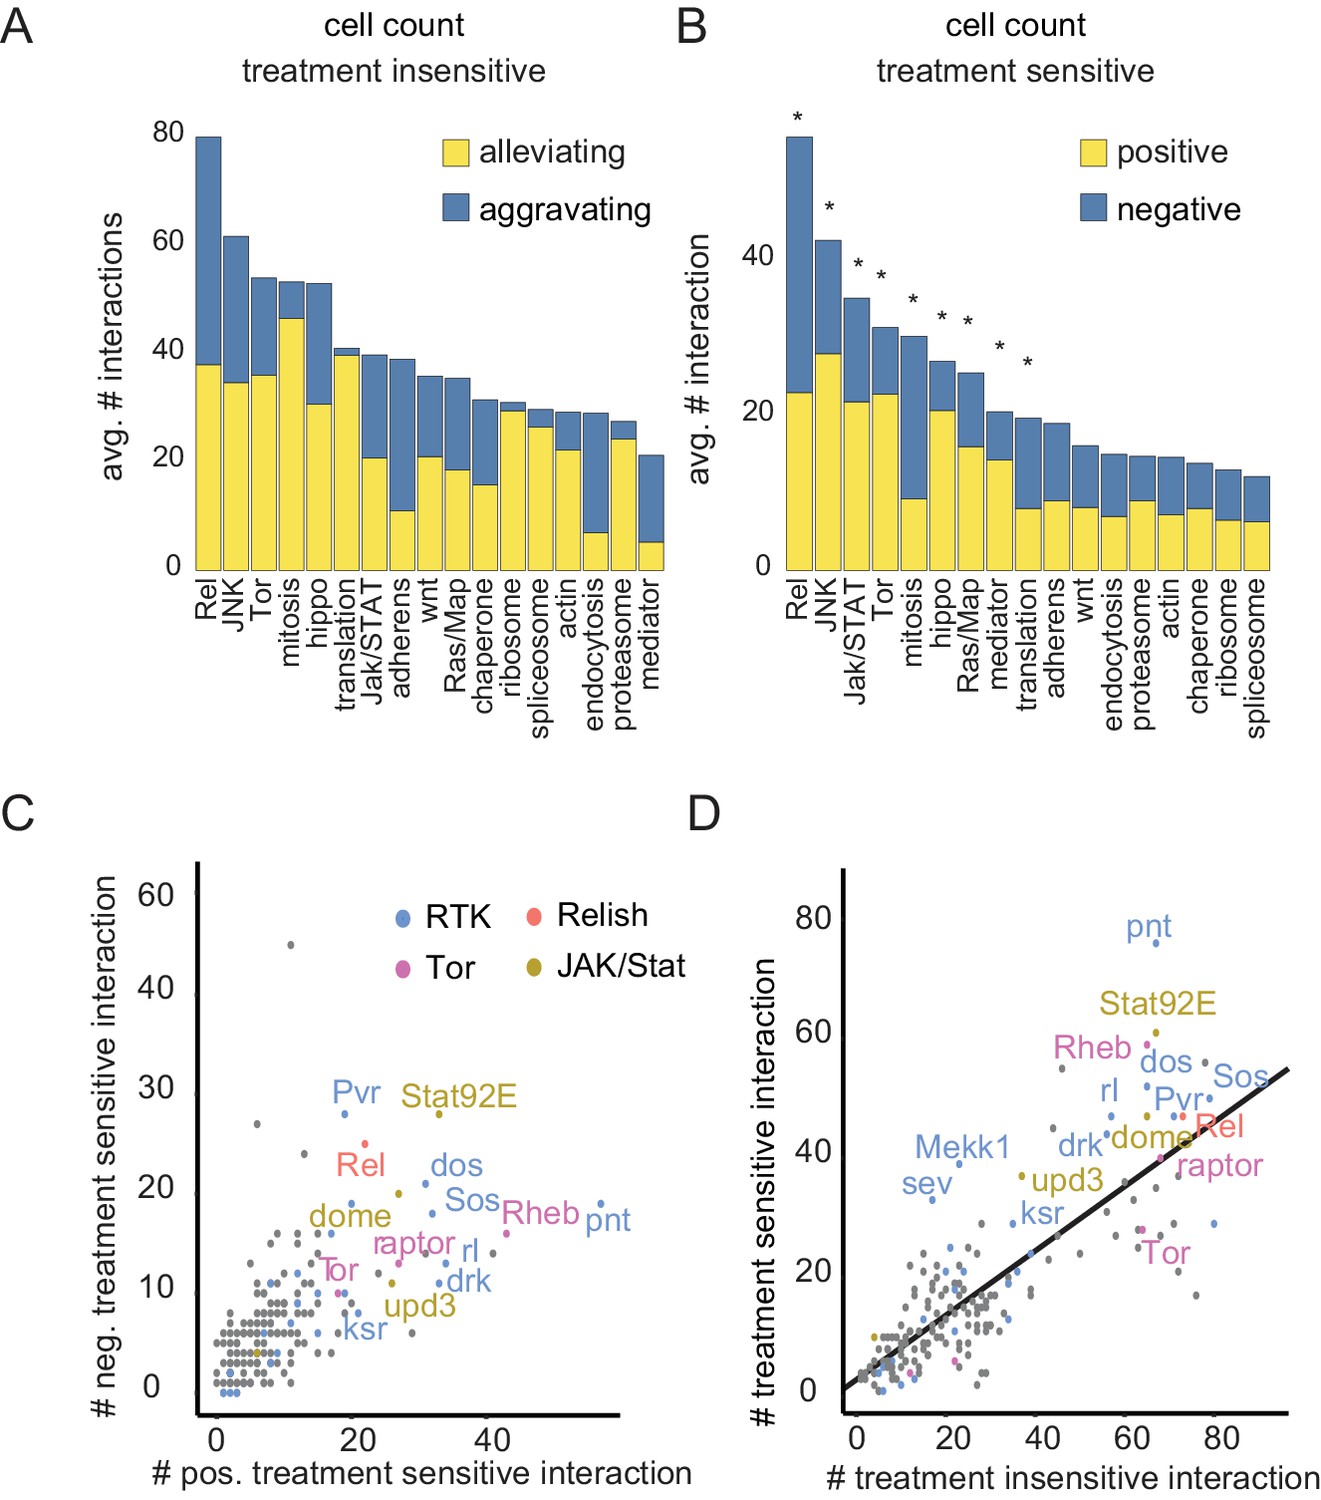
Drug sensitive genetic interactions are enriched for stress responsive signaling pathways
(A–B) Distribution of aggravating/alleviating treatment-insensitive (A) and positive/negative treatment-sensitive (B) interactions among molecular pathways. Binomial testing estimated if counts were expected by chance (*=FDR < 0.1). (C) Gene-level interaction counts. Counts of significant, unique negative treatment-sensitive interactions compared to counts of positive treatment-sensitive interactions. Dots are colored by functional groups. Pathways with the most treatment-sensitive interactions (Tor, Ras, Rel and Jak/STAT signaling) are highlighted. (D) Counts of treatment-insensitive interactions are plotted against treatment differential interaction counts. A trendline indicates a general linear dependency between treatment-insensitive and treatment-sensitive interaction counts. (A–D) Count data are based on cell number feature, significant (FDR < 0.3), MODIFI modelled interactions.
Figure 6

Timing and initial difference of interactions depend on the biological process and feature.
(A) Time dependence (σ) of interactions stratified by biological process. Boxplots show the median (black bar), the 25th and 75th percentile (box) ±1.5 times the interquartile range (whiskers). Points outside that range are plotted individually. Significance is tested by a two-sided welch t-test (***: p<<0.001, NS: p>0.05). Data is shown based on significant (FDR < 0.1) cell-count-based interactions involving genes belonging to this process. (B) Median π-score differences stratified by pathway annotation of affected genes. All significant (FDR < 0.1) time-dependent interactions based on cell count feature are summarized by median. Interactions formed by genes that are proteasome associated show the highest initial difference and steepest increase over time. (C) Initial difference of interaction scores 48 hr after treatment stratified by feature. Boxplots show the median (black bar), the 25th and 75th percentile (box) ±1.5 times the interquartile range (whiskers). Points outside that range are plotted individually. All features (except nucleus texture) show significantly (p<<0.001, two-sided student’s t-test) higher initial differences than cell count based interactions. (D) Median π-score differences for the first and the last measured time point. Trajectories for all features are shown over all genes that showed a significantly time-dependent interaction (FDR < 0.1). Features are highlighted by their feature group. All features except nucleus eccentricity measure interaction differences that become more profound over time.
Figure 7 with 1 supplement
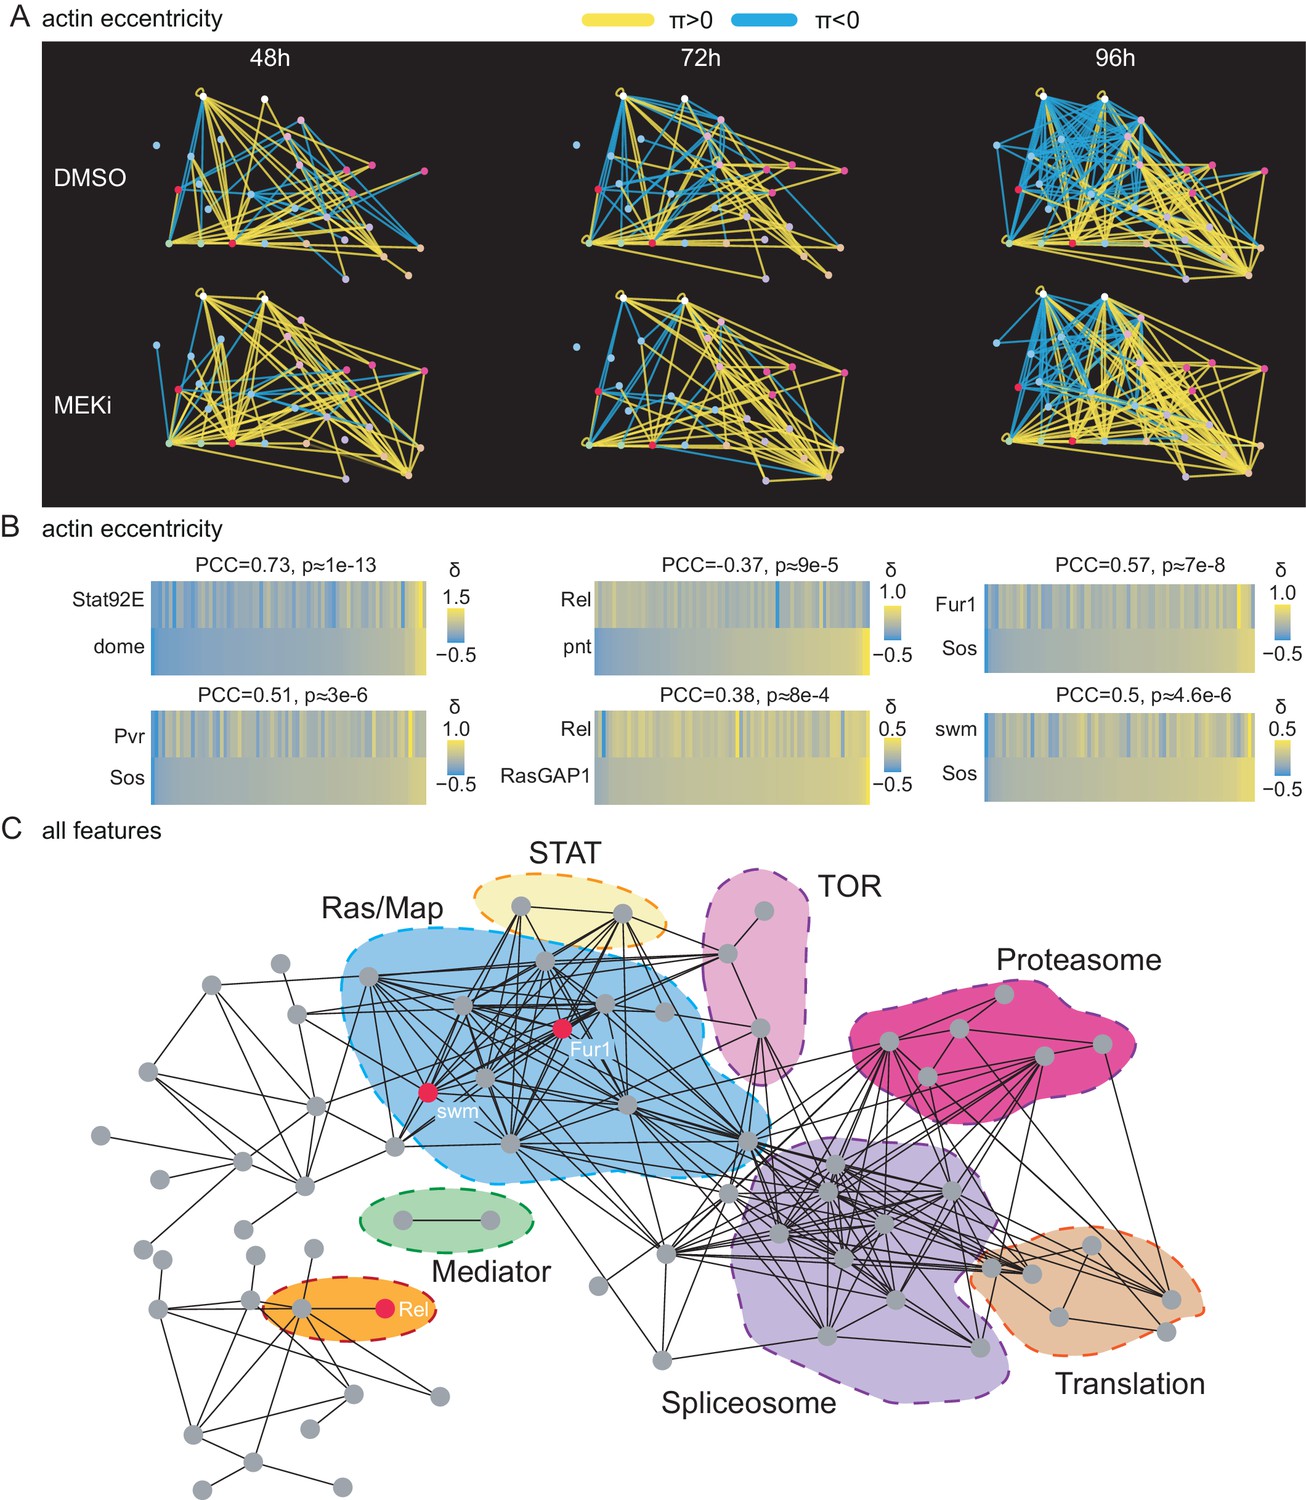
A correlation network of treatment-sensitive interactions maps pathways modules.
(A) Network of genetic interactions between selected genes. The networks include all candidate Ras-signaling (blue), Jak/STAT-signaling (white), Tor-signaling (pink), proteasome (red), translation (orange) and splicing (purple) related genes. Significant (FDR < 0.1) alleviating interactions are shown in yellow. Significant (FDR < 0.1) aggravating interactions are shown in blue. All interactions are based on the cell eccentricity feature. Interactions become more abundant and stronger over time, more alleviating interactions can be observed under MEK inhibition. Ras and Jak/STAT related genes are mostly connected by aggravating interactions. (B) Correlations of treatment-sensitive interaction profiles between known regulators and candidate genes. Profiles of all -scores along cell eccentricity and 76 query genes were constructed for 168 target genes and pairwise correlations were calculated. Shown is the Pearson correlation coefficient (PCC) and asymptotic p-value as implemented in the R package Hmisc. All correlations shown are significant with an p-value < 0.01. Jak/STAT and Ras components show high correlations as expected. Rel appears as negative, Fur1 and swm as positive regulators of Ras signaling. (C) Pairwise correlation network of treatment-sensitive interaction profiles across all 16 features. Shown are all genes with at least one edge. Edges are drawn if two gene’s -profiles correlate with PCC > 0.5. Nodes are ordered by force directed spring embedded layout. A high degree of clustering of known pathways indicates meaningful correlations.
-
Figure 7—source data 1
Cytoscape session file to reproduce Figure 7A.
- https://doi.org/10.7554/eLife.40174.021
-
Figure 7—source data 2
Cytoscape session file to reproduce Figure 7C.
- https://doi.org/10.7554/eLife.40174.022
Figure 7—figure supplement 1

Differential correlation analysis reveals that Fur1 and swm rewire coherently to Ras signaling components.
Interaction profiles of all target genes interacting with all query genes amongst all features and time points were analyzed for their pairwise Pearson correlation coefficient within and between treatment conditions. Non-significant interaction (FDR > 10%) were set to 0, such that they do not contribute to the correlation. A linear regression shows the expected average dependency of intra and inter condition profile correlation. Deviations from this expectation mark interaction profiles highly dependent on Dsor1 (Billmann and Boutros, 2017).
Figure 8 with 6 supplements
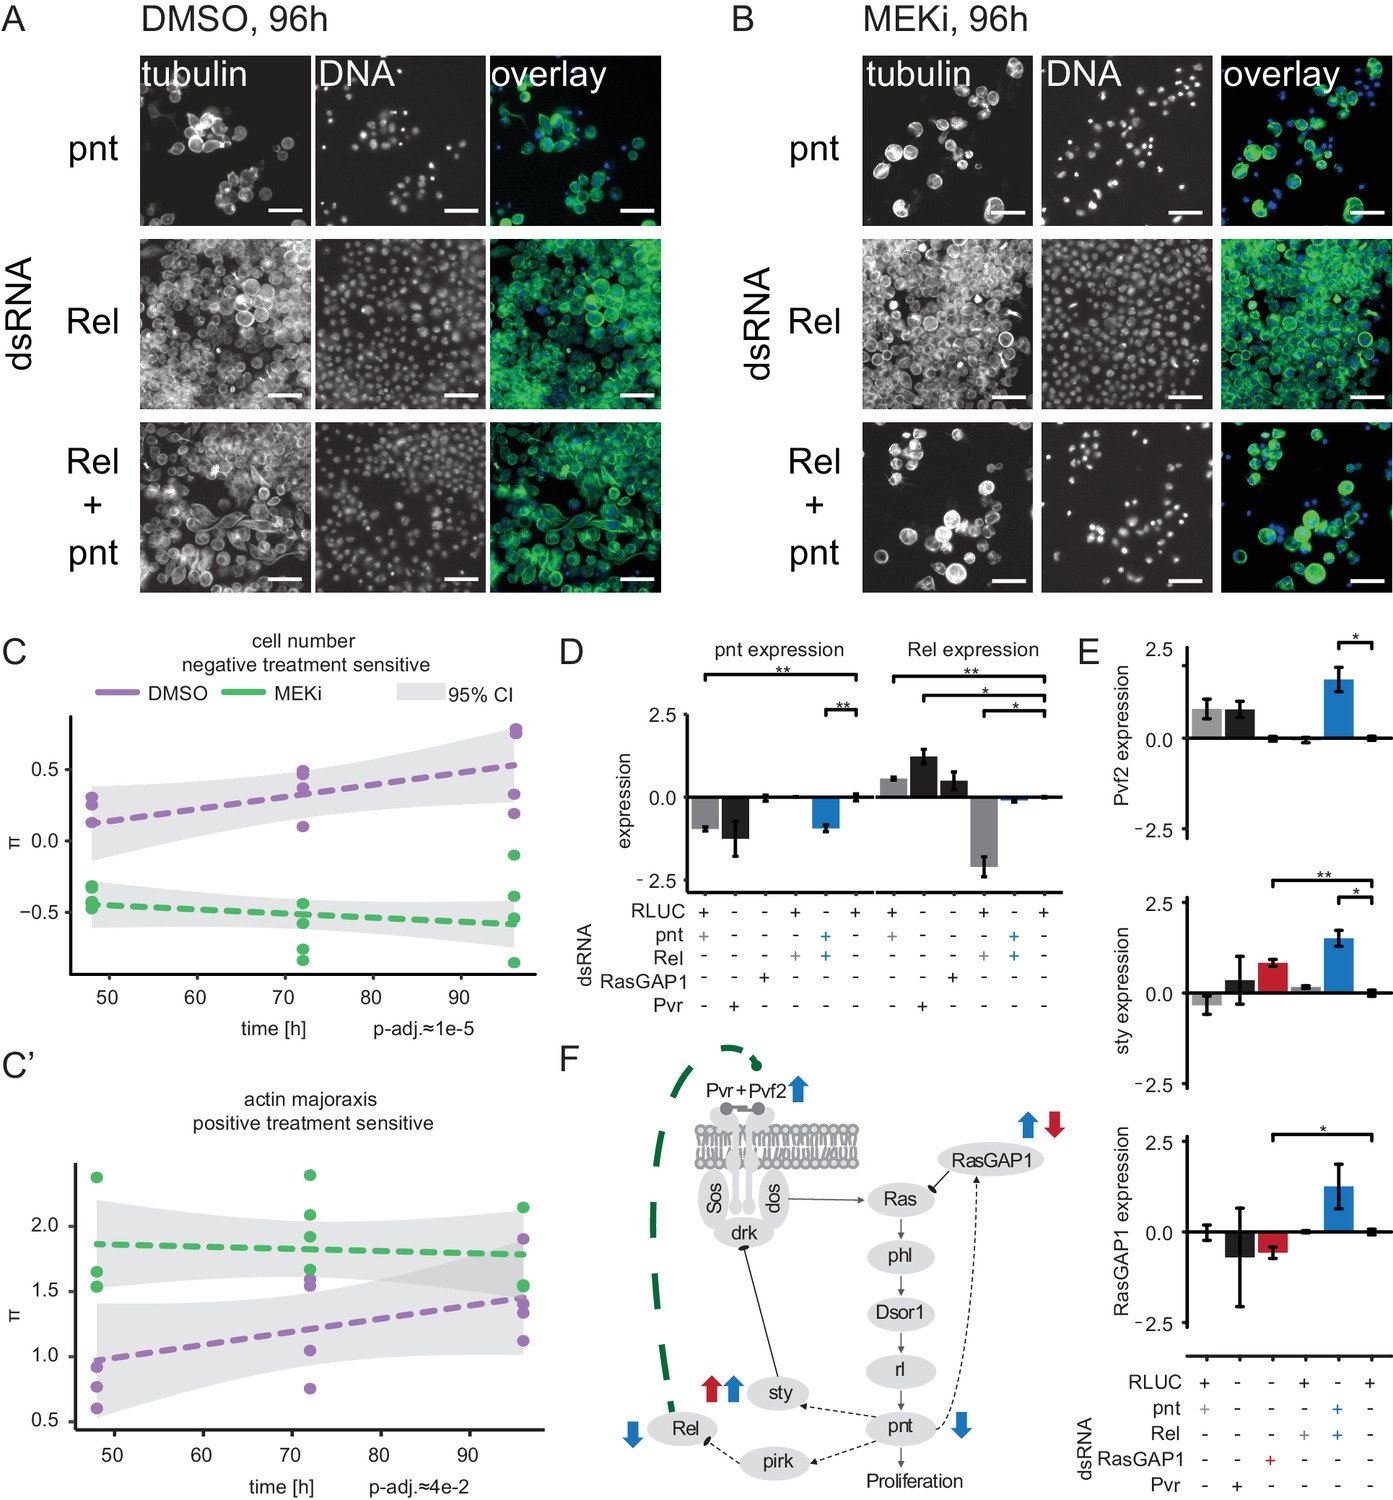
Crosstalk of NF-κB and Ras signaling through Rel and pnt.
(A) Upon Rel or Rel/pnt knockdown cells behave normally, growth is inhibited upon pnt knockdown alone. (B) Dsor1 inhibitor treatment attenuated this alleviating interaction. Scale bar = 30 µm. Images are pseudo colored, DNA/DAPI = blue, FITC/α-tubulin = green. (C) Quantified negative treatment-sensitive interaction between Rel and pnt. The trajectory of the MEK inhibitor treatment is lower than the solvent control condition for cell count interaction indicating synthetic lethality under MEK inhibition. (C’) Actin major axis shows a strong positive interaction (cells are enlarged like under pnt knockdown). Error of fit is shown as 95% confidence interval. Dashed lines show trendlines of a treatment wise model fit. (D, E) Expression of candidate and marker genes assessed by qPCR (3 days RNAi treatment, n = 3, log2 foldRLUC, mean ±s.e.m., t-test) on S2 cells. (D) pnt expression is reduced upon pnt and Pvr knockdown. Rel knockdown does not rescue pnt expression. Rel expression is increased upon pnt and Pvr knockdown and decreased upon Rel knockdown. Upon pnt and Rel knock down, Rel expression is rescued to normal levels. (E) Pvf2 expression is induced only upon Rel/pnt double knockdown. This leads to increased expression of sty and RasGAP1. RasGAP1 knockdown increases sty expression and decreases RasGAP1 expression. (D–E) *=p < 0.05, **=p < 0.01. (F) A model summarizes the qPCR results in context of the Ras signaling cascade. Dashed lines are transcriptional interactions, solid lines are protein-protein interactions. All black interactions are known, while the green interaction is inferred from the data. Blue arrows indicate that Pvf2, sty and RasGAP1 were upregulated upon Rel/pnt co-knockdown and by that Ras pathway activity was restored. A similar pattern could be observed upon RasGAP1 knockdown, which causes intrinsic hyper-activation of Ras signaling by constitutive Ras activation (measured by upregulation of sty, red arrows).
Figure 8—figure supplement 1
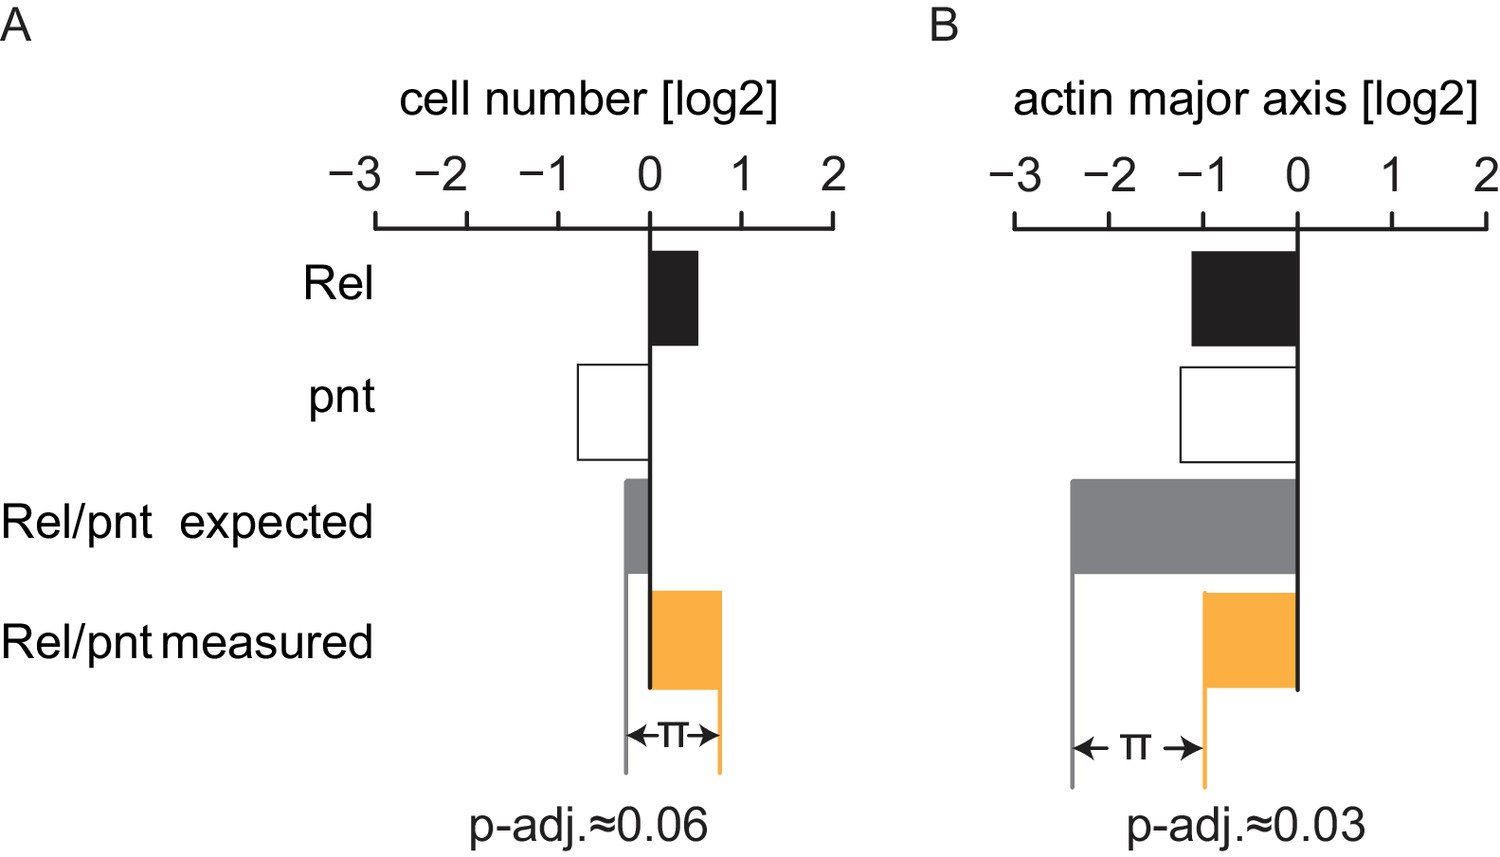
Genetic interactions were summarized under the multiplicative model.
Statistical synthetic genetic interactions were defined as the deviation (π) of the combined perturbation phenotype of two genes compared to the linear combination of the two single knockdown phenotypes. Since all features were transformed to a logarithmic scale this linear model translates to a multiplicative model in raw feature space. (A) π-scores are derived comparably for each feature and condition. Genes A and B show a measured phenotype (median, n = 4) that significantly deviates from the expected linear combination of the single knockdown phenotypes. This example interaction manifests in the features cell number and actin major axis (cell length), FDR = 0.06 and 0.03, respectively.
Figure 8—figure supplement 2
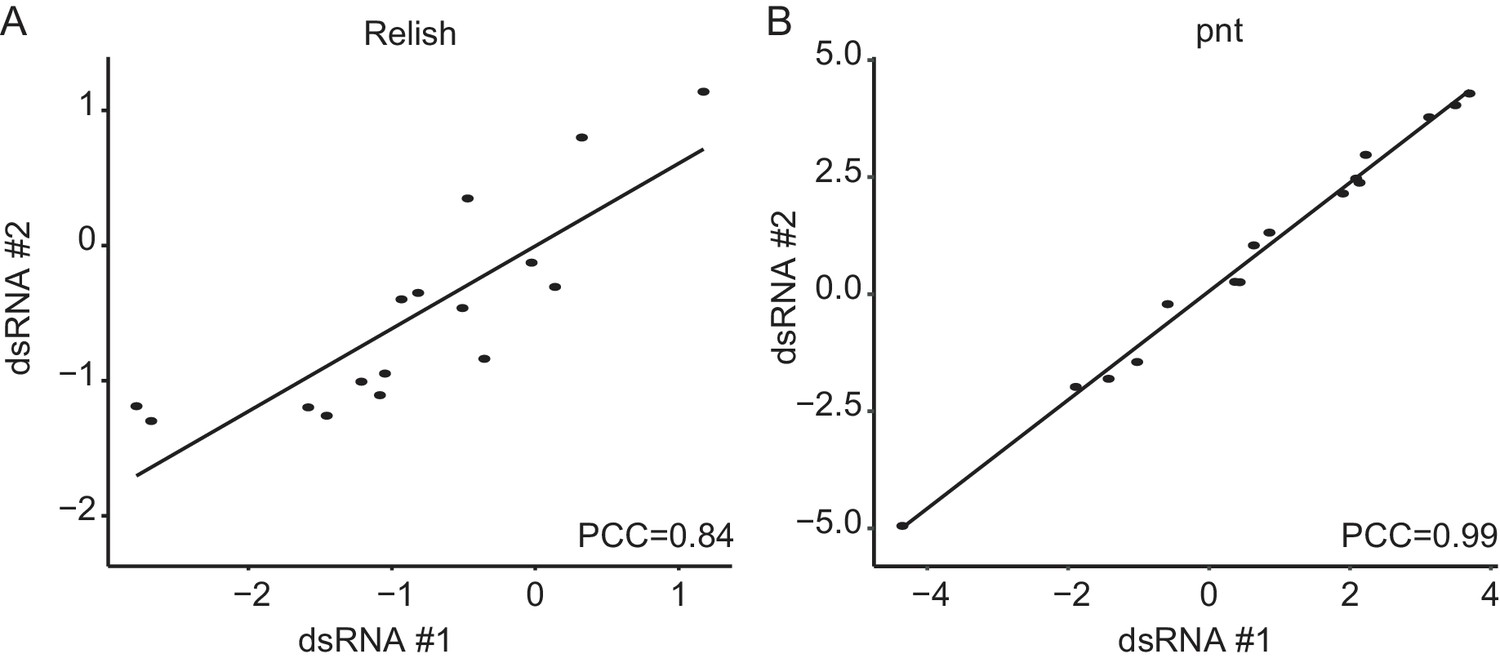
Rel and pnt show high phenotypic aggreement between sequence-independent dsRNA designs.
(A, B) Comparisons of two independent dsRNA designs against Relish and pointed reveals a high level of phenotypic similarity between the two sequence independent perturbation reagents (PCC: Pearson’s correlation coefficient, assymtotic p-values are far below 0.001). This indicates that the main phenotypic effects are target-specific not driven by off-target effects.
Figure 8—figure supplement 3
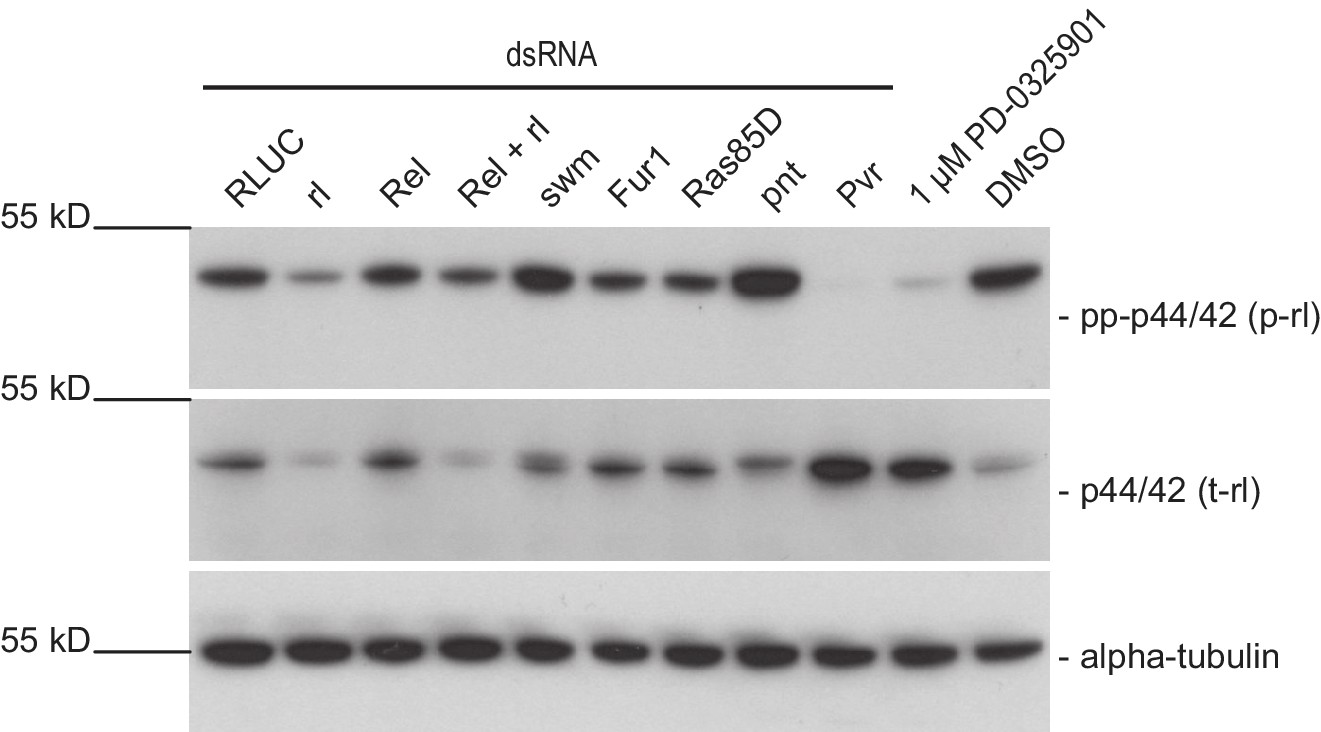
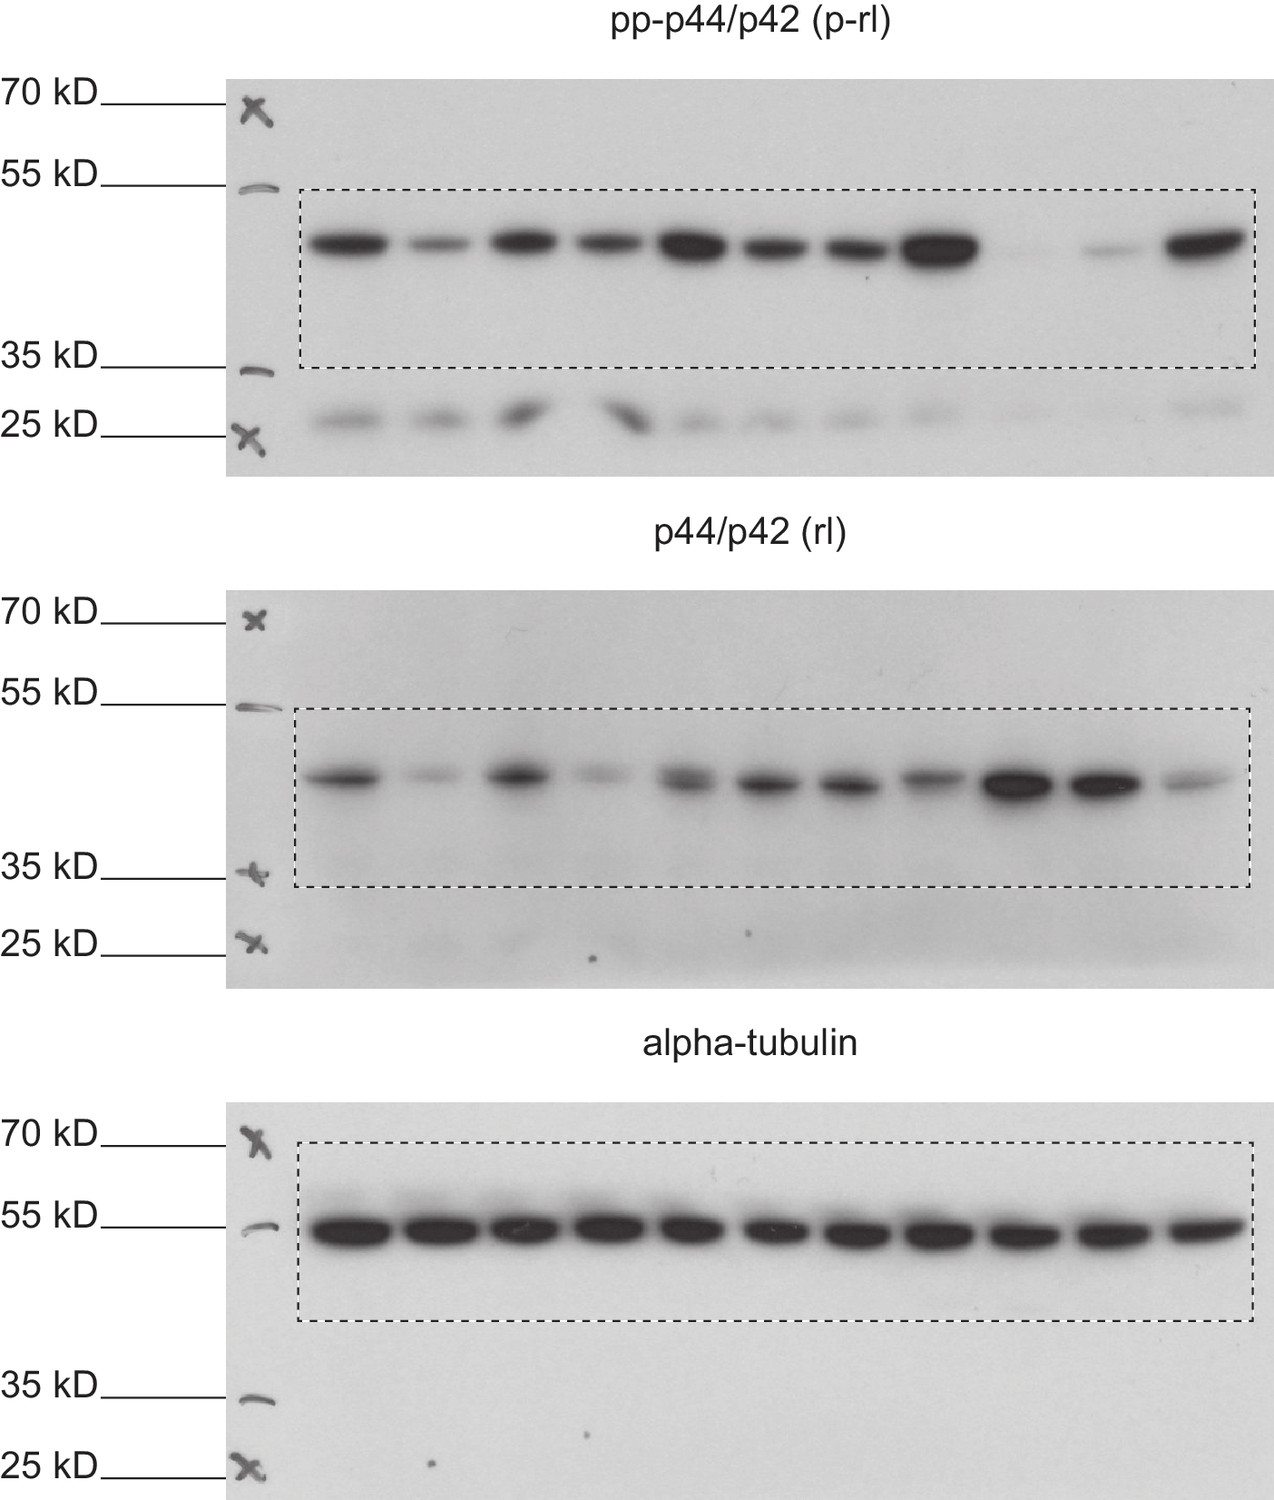
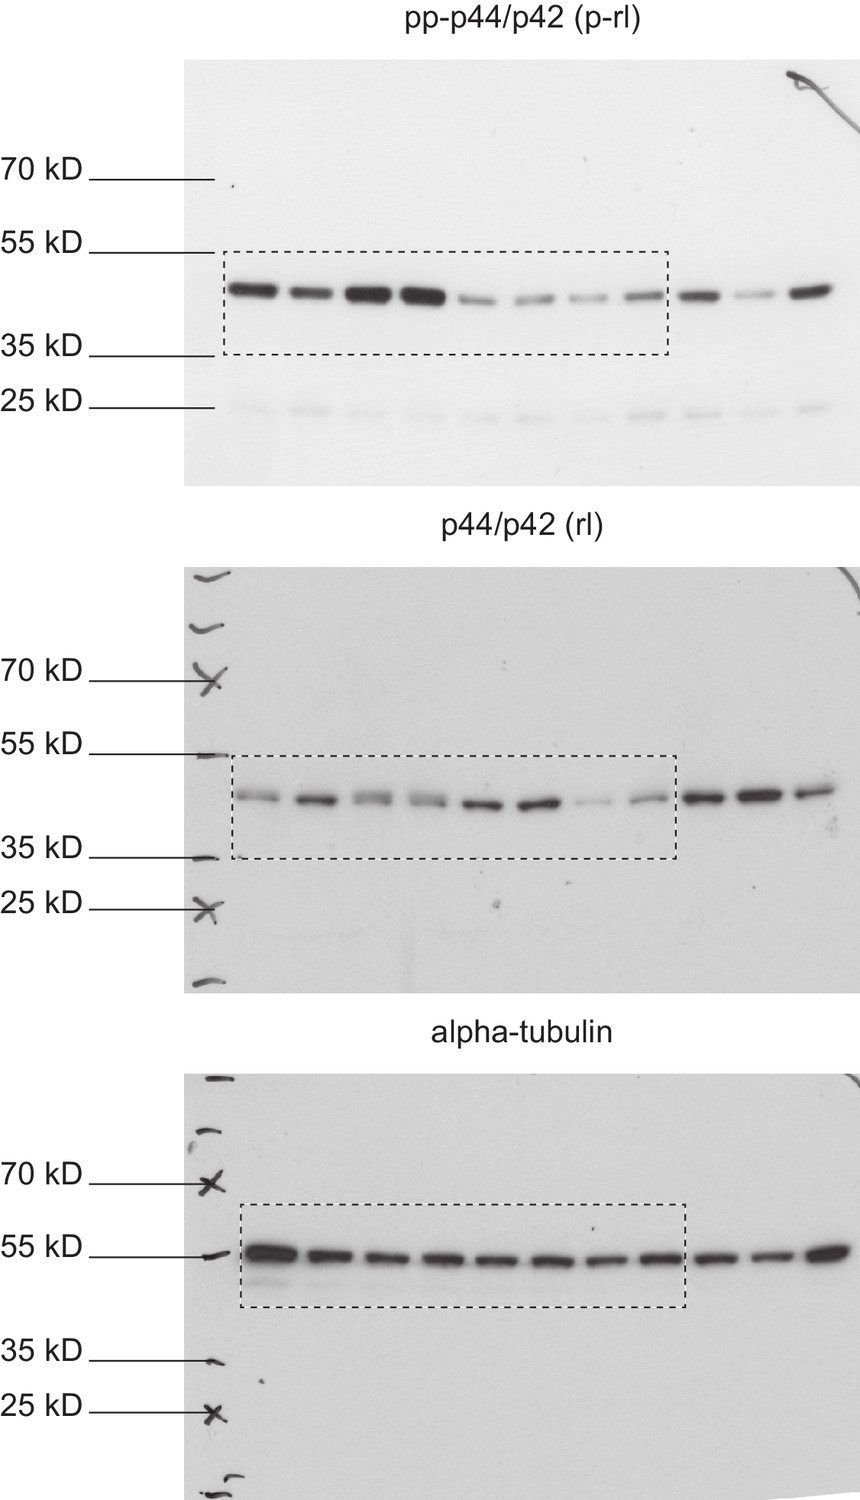
pnt knockdown strongly induces rl phosphorylation and reduces rl levels after 96 hr.
Dmel-2 cells were treated with dsRNA or compound for 96 hr and analyzed for levels of phosphorylated rl. It appears that pnt knockdown strongly induces rl phosphorylation while Sos, Rel, rl, Dsor1, and RasGAP1 knockdown. seem to have little or no effect on rl phosphorylation. Dsor1 inhibiton by small molecule treatment (1 µM PD-0325901 treatment 24 hr prior harvesting) in contrast shows very clear reduction of rl phosphorylation. rl knockdown proofed the identity of the band (gone after 96 hr). Since growth altering phenotypes of the other treatments could be observed we reasoned that their effect on rl phosphorylation is more immediate after dsRNA transfection. (representative result of two dsRNA design independent replicates) Membranes were stripped and re-probed for total-rolled and α-tubulin after each development.
Figure 8—figure supplement 4
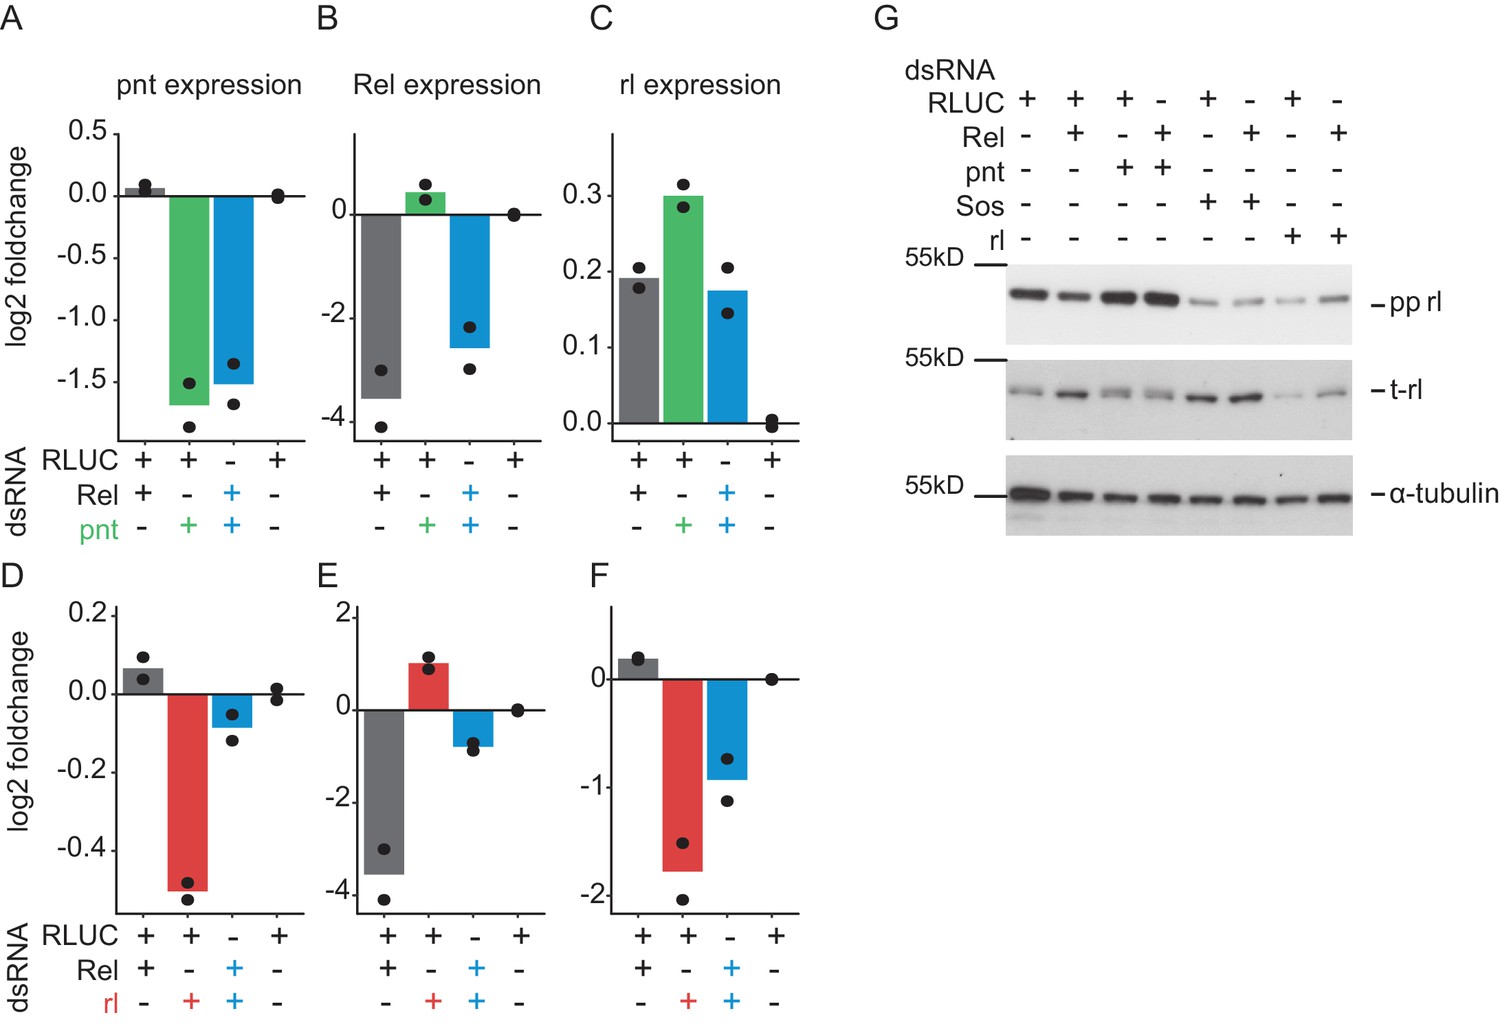
Instead of phosphorylation, total expression of rolled is altered by Relish knockdown.
Expression of rolled (rl), pointed (pnt) and Relish (Rel) was assessed using qPCR analyses (2 days treatment, n = 2, mean plus raw data) on RNAi treated Dmel-2 hemocytes. (A) pnt expression was reduced upon pnt and pnt/Rel co-RNAi. Rel RNAi could not rescue pnt expression. (B) Rel expression was decreased upon Rel knockdown. Here, knockdown of pnt cannot attenuate Rel knockdown. (C) rl expression is mildly increased upon Rel or pnt perturbation. (D) rl RNAi decreases pnt expression while Rel co-RNAi can lift its expression in turn. (D) Rel RNAi reduces Rel expression, while rl co-RNAi attenuates this reduction. (F) rl knockdown reduces rl expression. Rel co-RNAi can lift rl expression again (G) Western blot analysis of 2 days RNAi treatment on Dmel-2 hemocytes. Rel knockdown alters total rl levels but not phosphorylation. rl phosphorylation in turn is strongly up-regulated upon pnt knockdown, while rl and Sos knockdown decrease phosphorylation levels (n = 2). Membranes were stripped and re-probed for total-rolled and α-tubulin after each development.
Figure 8—figure supplement 5
Full immunoblots.
Full, un-edited immunoblots accompanying (Figure 8—figure supplement 3). Areas that were cut are indicated. Raw scans of developed Amersham hyperfilms (GE-Healthcare). Exposure times varied from 3 s to 10 s. Membranes were stripped and re-probed for total-rolled and α-tubulin after each development.
Figure 8—figure supplement 6
Full immunoblots.
Full, un-edited immunoblots accompanying (Figure 8—figure supplement 4). Areas that were cut are indicated. Raw scans of developed Amersham hyperfilms (GE-Healthcare). Exposure times varied from 3 s to 10 s. Membranes were stripped and re-probed for total-rolled and α-tubulin after each development.
Tables
Key resources table
| Reagent type (species) or resource | Designation | Source or reference | Identifiers | Additional information |
|---|---|---|---|---|
| Cell line (D. melanogaster) | Dmel-2; S2 cells; Schneider S2 cells | ATCC CRL1963 from ThermoFisher, Waltham, MA, used in PMID:21378980; PMID: 26912791; PMID:25748138; | ATCC Cat# CRL-1963; RRID: CVCL_Z232 | |
| Antibody | alpha-tubulin-FITC mAB, tubulin antibody, mouse monoclonal clone DM1A | Sigma-Aldrich Cat# F2168 | Sigma-Aldrich Cat# F2168, RRID: AB_476967 | (1:1500) |
| Peptide, recombinant protein | Phalloidin-TRITC antibody | Sigma-Aldrich Cat# P1951 | Sigma-Aldrich Cat# P1951, RRID: AB_2315148 | (1:6000), TRITC conjugate, C62H72N12O12S4 |
| Chemical compound, drug | Hoechst 33342 | Thermo Fisher Scientific Cat# H1399 | Thermo Fisher Scientific Cat# H1399 | (1:4000) from 1 mg/ml |
| Chemical compound, drug | DMSO | Sigma-Aldrich Cat# 276855 | Sigma-Aldrich Cat# 276855 | 0.05% |
| Chemical compound, drug | PD-0325901; MEKi; MEK inhibitor | Cayman Chemical Cat# 13034 | Cayman Chemical Cat# 13034; CAS: 391210-10-9 | 1.5 nM |
| Sequence-based reagent | HD3 dsRNA library; dsRNAs for combinatorial library | other; PMID: 26912791 | in house synthesized dsRNA library | |
| Software, algorithm | R | https://cran.r-project.org/; R Project for Statistical Computing | nif-0000–10474; OMICS_01147; RRID: SCR_001905 | |
| Software, algorithm | custom R code | this paper; https://github.com/boutroslab/Supplemental-Material/tree/master/Heigwer_2018 | ||
| Software, algorithm | Perl | http://www.cpan.org; Comprehensive Perl Archive Network | nif-0000–30267; RRID: SCR_007253 | |
| Other | source data; well-wise feature data | this paper; https://doi.org/10.6084/m9.figshare.6819557 | ||
| Other | Flybase gene annotation database | http://flybase.org/; PMID: 30364959 | RRID:SCR_006549 |
Additional files
-
Supplementary file 1
Metrics that were used to assess candidate genes from genome wide gene-drug interaction screens
- https://doi.org/10.7554/eLife.40174.031
-
Supplementary file 2
Manually curated list of gene annotations used for all analyses
- https://doi.org/10.7554/eLife.40174.032
-
Supplementary file 3
Detailed description of phenotypic features used within the combinatorial RNAi screen
- https://doi.org/10.7554/eLife.40174.033
-
Supplementary file 4
Genome wide dsRNA library annotation
- https://doi.org/10.7554/eLife.40174.034
-
Supplementary file 5
Annotation file for the combinatorial dsRNA library
- https://doi.org/10.7554/eLife.40174.035
-
Supplementary file 6
Detailed description of phenotypic features used within the genome-wide RNAi screens
- https://doi.org/10.7554/eLife.40174.036
-
Supplementary file 7
Weights to GO-term confidence levels
- https://doi.org/10.7554/eLife.40174.037
-
Supplementary file 8
List of dsRNAs used for all follow-up experiments
- https://doi.org/10.7554/eLife.40174.038
-
Supplementary file 9
List of qPCR primers used for all follow-up experiments
- https://doi.org/10.7554/eLife.40174.039
-
Transparent reporting form
- https://doi.org/10.7554/eLife.40174.040
Download links
A two-part list of links to download the article, or parts of the article, in various formats.
Downloads (link to download the article as PDF)
Open citations (links to open the citations from this article in various online reference manager services)
Cite this article (links to download the citations from this article in formats compatible with various reference manager tools)
Time-resolved mapping of genetic interactions to model rewiring of signaling pathways
eLife 7:e40174.
https://doi.org/10.7554/eLife.40174


