Translation attenuation by minocycline enhances longevity and proteostasis in old post-stress-responsive organisms
- The Scripps Research Institute, United States
- The Skaggs Institute for Chemical Biology, The Scripps Research Institute, United States
- The Buck Institute for Research on Aging, United States
Figures
Figure 1 with 1 supplement
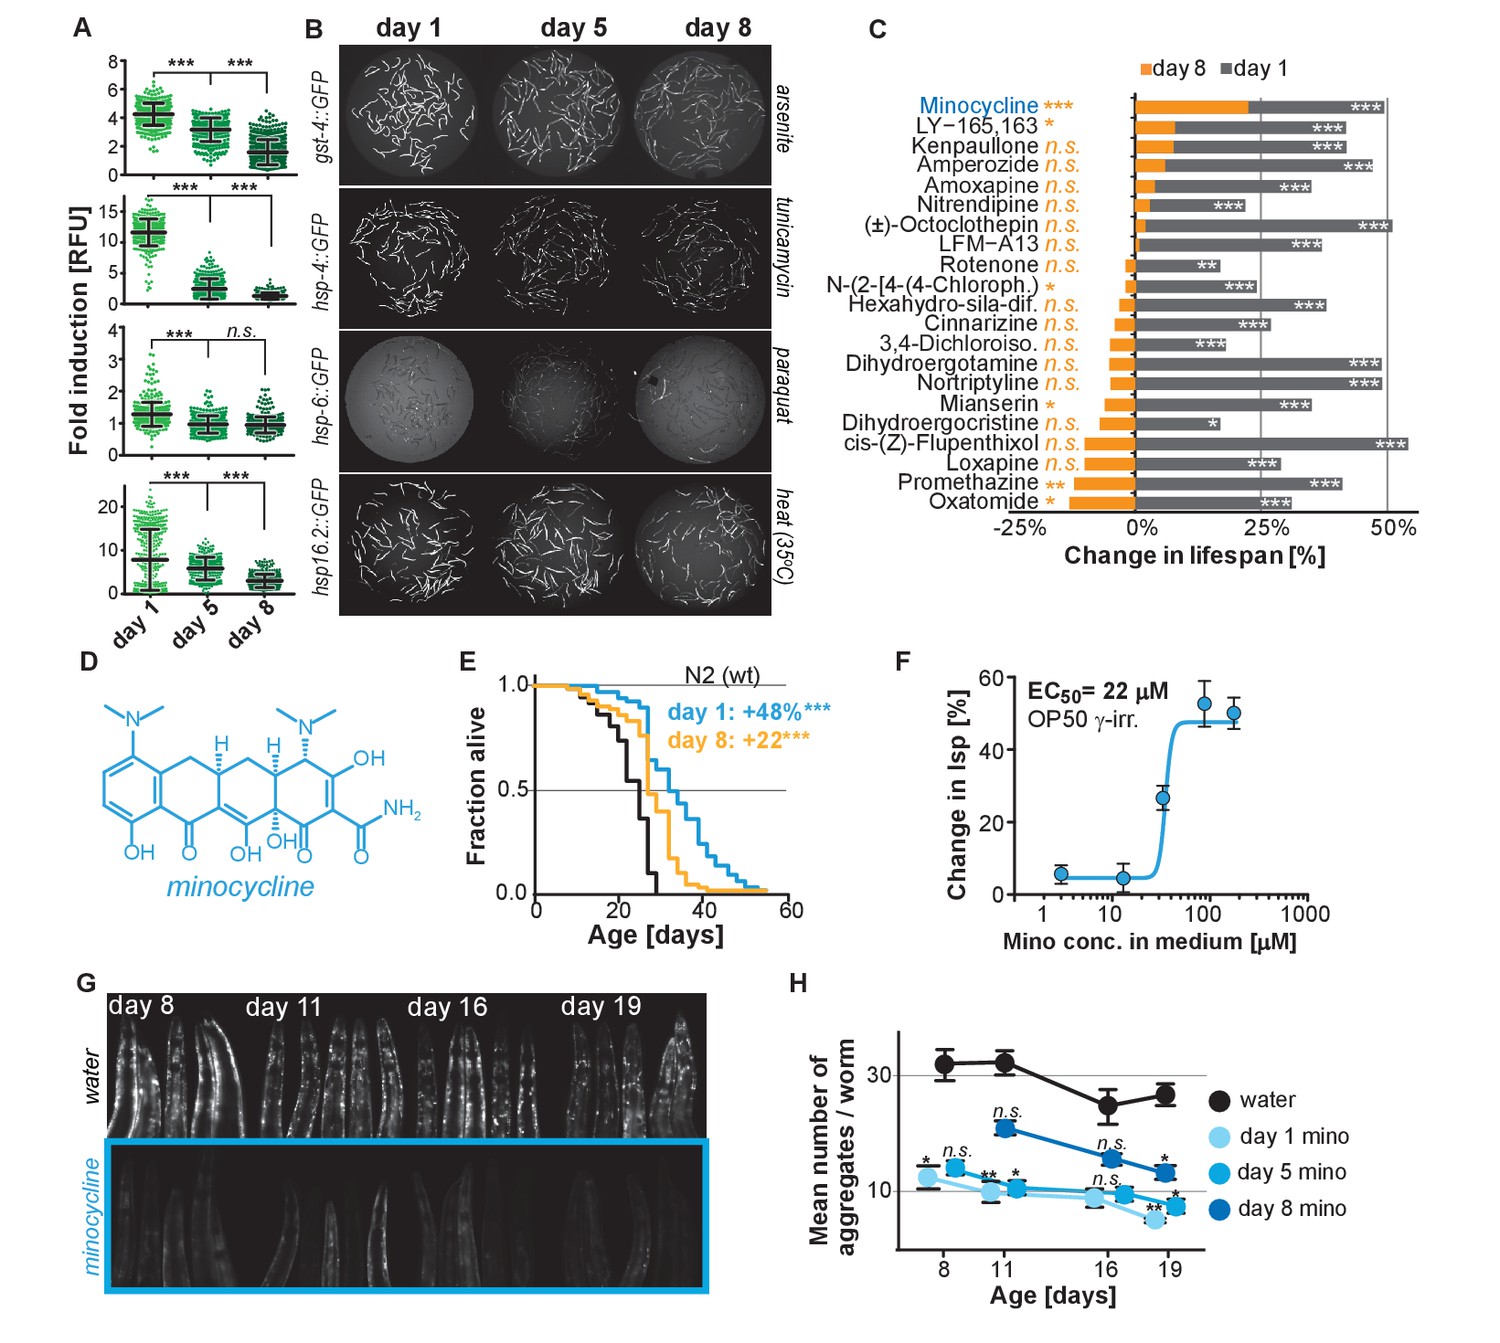
Stress signaling pathway activity declines with age.
(A) Scatter plots show fold induction of GFP fluorescence induced by stressors compared to untreated animals in gst-4p::GFP (oxidative stress), hsp-4p::GFP (UPRER), hsp-6p::GFP (UPRmt) and hsp-16.2p::GFP (heat stress) C. elegans at 1, 5 and 8 days of age. We define day 1 as the first day of adulthood. Error bars show mean ± S.D., each dot represents one animal with all n > 300 for each reporter strain and age. Significance determined by ANOVA followed by Dunett’s test. Total of four independent experiments. (B) Representative fluorescent microscopy images of 100 randomly selected animals for each condition and strain. Stressors indicated to right of each image panel. Images for each strain were taken in parallel on the same day using identical settings. Total of four independent experiments. (C) Bar graphs show % change in lifespan for 21 small molecules when treatment was initiated on day 1 of adulthood (gray) or on day 8 of adulthood (orange). Note that some compounds that extend lifespan when treatment is initiated on day 1 become slightly toxic at later ages. One independent experiment with at least 53 animals per condition. Significance determined by the log-rank test. (D) Structure of minocycline. (E) Survival curves for untreated (black line) and minocycline-treated wild-type N2 animals when treatment was initiated on day 1 (blue line) or day 8 (orange line) of adulthood. OP50 were killed by γ-irradiation to separate antibiotic from lifespan effects. Total of five independent experiments. Significance determined by the log-rank test. (F) Percent change in lifespan as a function of minocycline concentration for N2. OP50 were γ-irradiated. Total of four independent experiments. (G) Representative fluorescence microscopy images showing heads of C. elegans at increasing ages expressing the α-synuclein::YFP fusion protein. Top: water-treated control, bottom: minocycline-treated (100 μM). Note the increase in punctuate staining with age indicative of protein aggregation. (H) Graph shows the average number of α-synuclein::YFP aggregates per worm as a function of age for water- or minocycline-treated animals. Age when minocycline treatment is initiated for each color is shown right of the graph. Error bars indicate S.E.M. For each data point, n > 15. Total of four independent experiments. Asterisks indicate significance *<0.05, **<0.01, ***<0.001, n.s. not significant. Source data for N2 lifespan experiments are available in the Figure 1—source data 1.
-
Figure 1—source data 1
Summary of N2 lifespan data, related to Figure 1.
- https://doi.org/10.7554/eLife.40314.004
Figure 1—figure supplement 1
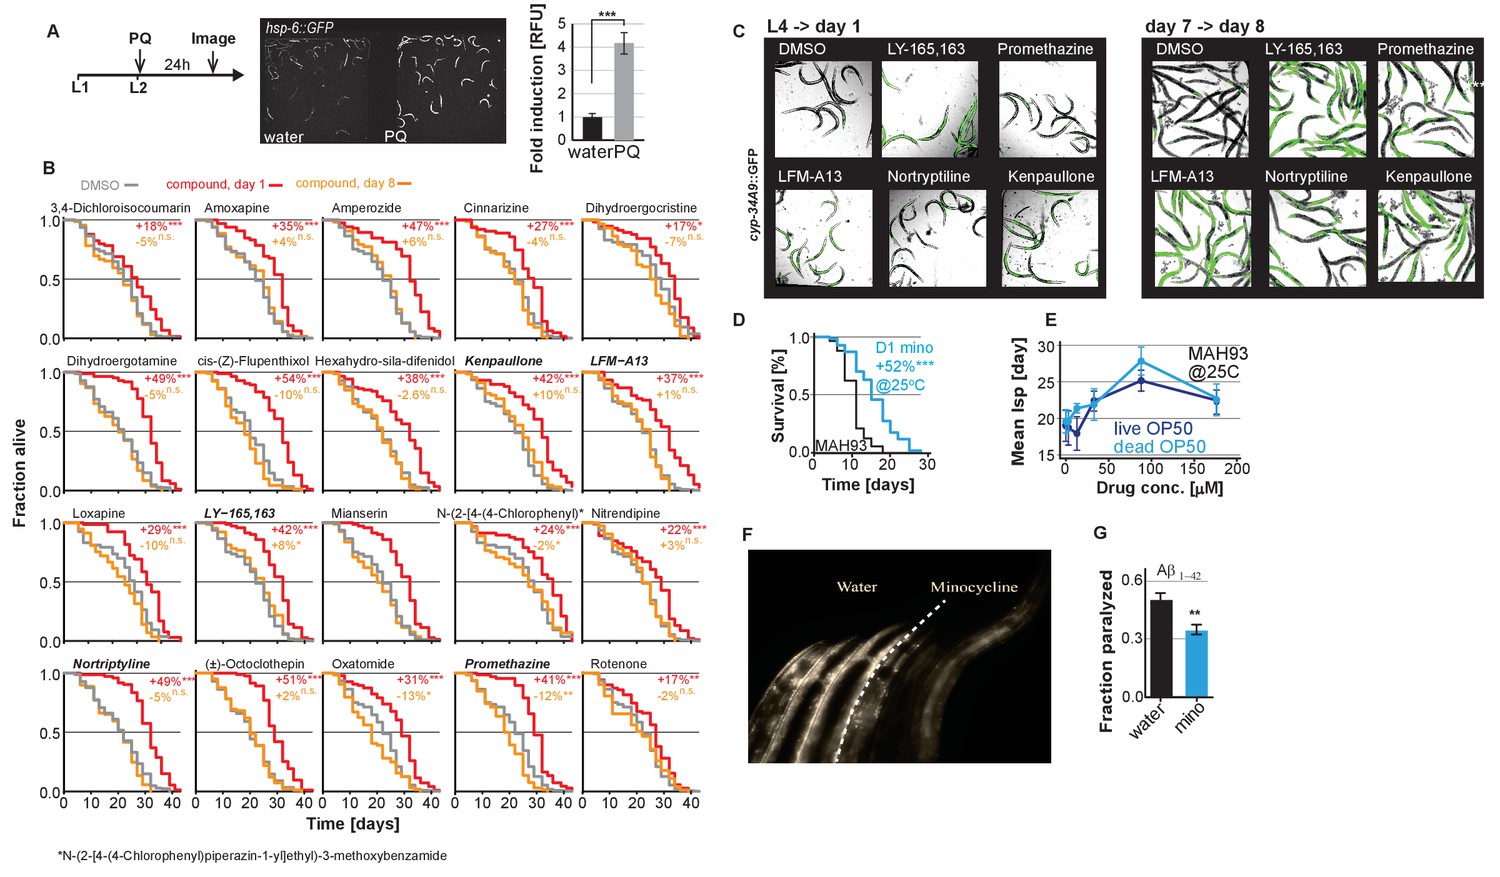
Small molecules screened for post-stress-responsive lifespan.
(A) Positive control to demonstrate that the lack of hsp-6p::GFP activation in adult animals (Figure 1A,B) is due to age and not due to a defective strain. Experimental timeline, fluorescent images and bar graphs depicting paraquat-induced (PQ) expression of hsp-6p::GFP when added at the L2 larval stage. (B) Survival curves for the bar graphs shown in Figure 1C. Small molecules screened for lifespan extension when added on day 1 (red line) or day 8 (orange line) compared to untreated (gray line). Significance determined by the log-rank test. (C) Confirmation of drug uptake for a subset of drugs tested in Figure 1. Overlay of bright field and fluorescent images to monitor the xenobiotic reporter, cyp-34A9p::GFP activation. Small molecules that activate cyp-34A9p::GFP in day 1 animals also do so in day 8 animals as visualized by GFP expression confirming drug uptake at both ages. (D and E) Representative survival and dose response curves showing minocycline extends lifespan of MAH93 glp-1(ar202), a strain that is sterile at 25°C, in the absence of FUDR (D) and with or without γ-irradiated OP50 dose-dependently (E). (F) Side-by-side comparison of 8-day-old NL5901 α-synuclein::YFP animals treated on day 1 with water (left three animals) or minocycline (right three animals). (G) Graph shows fraction of paralyzed 4-day-old adult C. elegans animals expressing Aβ1-42 after a 1 hr heat shock at 35°C. Pretreatment with minocycline (100 μM) reduces paralysis. Asterisks indicate significance *<0.05, **<0.01, ***<0.001, n.s. not significant.
Figure 2 with 1 supplement
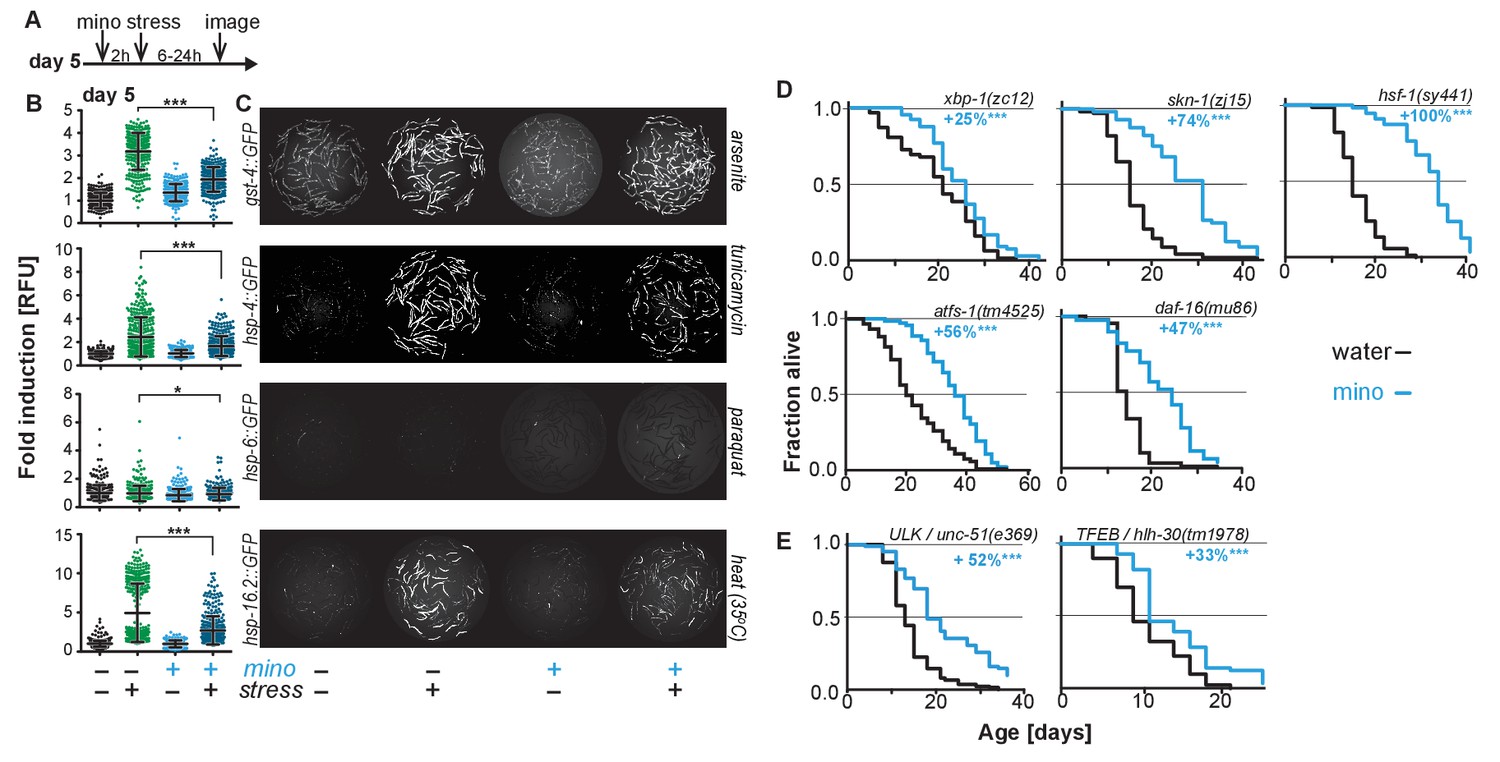
Minocycline suppresses stress signaling pathway activity.
(A) Experimental timeline to monitor stress response activation of 5-day-old adult C. elegans GFP-reporter strains induced by stressor and/or minocycline. Minocycline (100 μM) was added 2 hr prior to each stressor. (B) Scatter plots show fold induction of GFP fluorescence induced by stressors and/or minocycline treatment compared to untreated animals in 5-day-old adults. Pretreatment with minocycline suppresses stress response activation. Reporters: gst-4p::GFP (oxidative stress), hsp-4p::GFP (ER UPR), hsp-6p::GFP (UPRmt) and hsp-16.2p::GFP (heat stress). Error bars show mean ± S.D., each dot represents one animal with all n > 300. Significance determined by the Mann-Whitney t-test. At least three independent experiments. (C) Representative fluorescence microscopy images of 100 randomly selected animals for each condition and strain. Stressors indicated to the right of each panel. Images for each strain were taken in parallel on the same day using identical settings. (D) Survival curves. Minocycline significantly extends lifespan in strains carrying mutations in regulators of stress and proteostasis responses. Statistical significance determined by the log-rank test. Number of animals n ranging from 35 to 218. Total of at least three independent experiments per strain. (E) Survival curves. Minocycline significantly extends lifespan in two strains carrying mutations in regulators of lysosomal and autophagic pathways. Statistical significance determined by the log-rank test. Number of animals n ranging from 56 to 138. Total of at least three independent experiments per strain. Asterisks indicate significance *<0.05, **<0.01, ***<0.001, n.s. not significant. Source data for all lifespan experiments in (D) and (E) are available in the Figure 2—source data 1.
-
Figure 2—source data 1
Summary of lifespan data for strains carrying mutations in regulators of stress, proteostasis, autophagy and lysosomal responses, related to Figure 2.
- https://doi.org/10.7554/eLife.40314.007
Figure 2—figure supplement 1
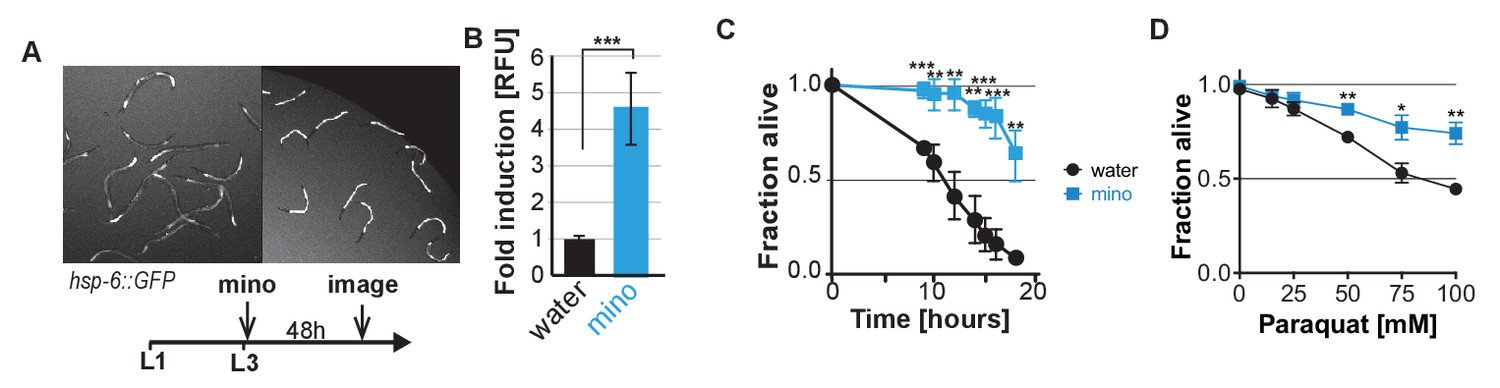
Despite inhibiting the UPRmt and the heat shock response in adults, minocycline activates the UPRmt in larvae and protects from stress.
(A and B) Fluorescence image and experimental timeline (A) and quantification (B) for hsp-6p::GFP induction by minocycline added to L3 larvae. While minocycline suppressed GFP induction of all stress reporters tested in adults, it activates the hsp-6p::GFP in larvae. Data are represented as mean ±S.D. Significance determined by the Mann-Whitney t-test. (C) Survival as a function of time in hours for water- or 100 μM minocycline-treated wild-type N2 C. elegans subjected to a continuous heat shock of 35°C. Data are represented as mean ±S.E.M. Significance determined by the Mann-Whitney t-test at each time point. Total of three independent experiments. (D) Survival of water- or 100 μM minocycline-treated wild-type N2 C. elegans 24 hr after addition of increasing concentrations of paraquat added on day 5. Data are represented as mean ±S.E.M. Significance determined by the Mann-Whitney t-test for each paraquat concentration. Total of three independent experiments. Asterisks indicate significance *<0.05, **<0.01, ***<0.001, n.s. not significant.
Figure 3 with 1 supplement
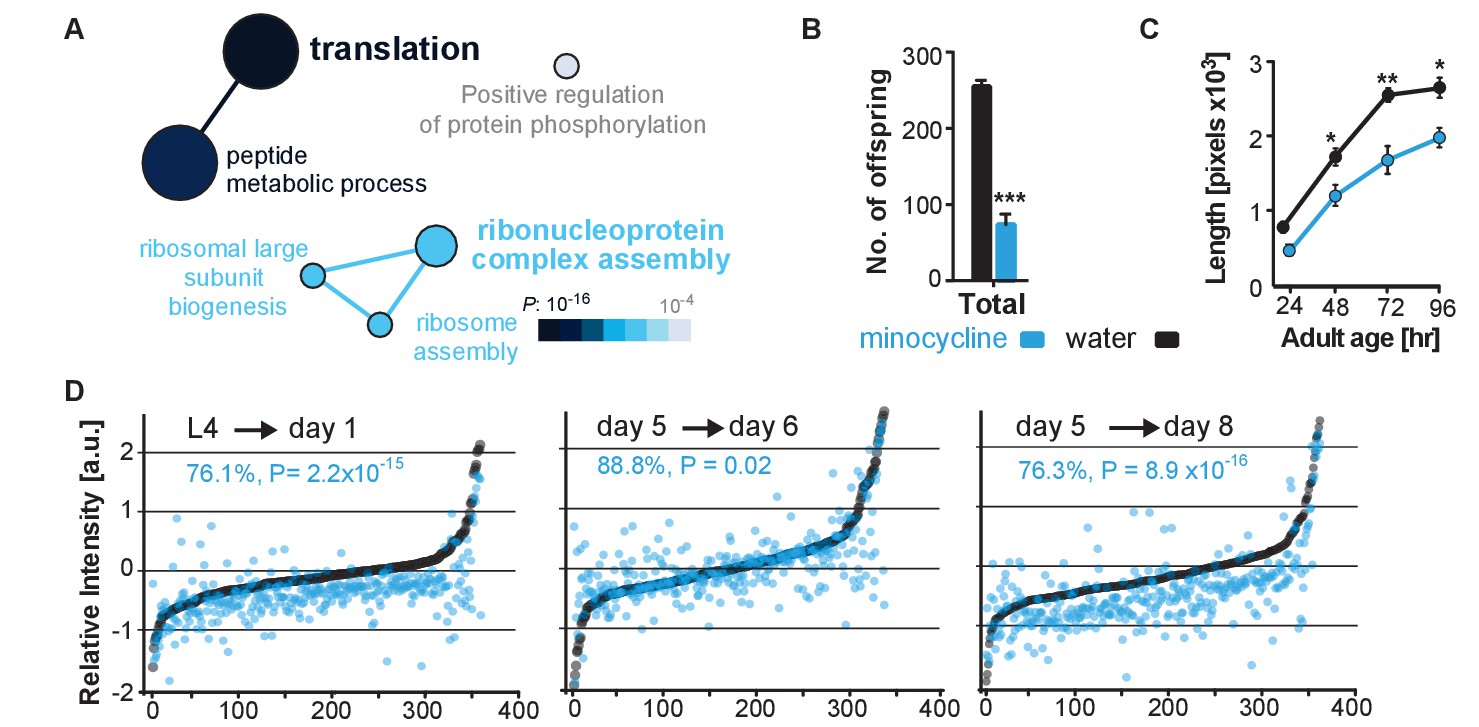
Minocycline attenuates translation in C. elegans.
(A) Network analysis by ClueGO of isoTOP-ABPP results corresponding to protein-probe labeling changes that decrease with minocycline treatment. Size of the circle is proportional to the number of proteins identified and the color represents significance. Total of three independent experiments. (B) Graph shows total number of offspring for water- or minocycline-treated C. elegans over 5 days after minocycline addition. Significance determined by the Mann-Whitney t test n = 15. Total of five independent experiments. (C) Graph shows C. elegans length in pixels as a function of age in hours after minocycline addition. Significance determined by the Mann-Whitney Student's t test n > 50. Total of five independent experiments. (D) Graphs show relative intensity ratios of 14N incorporation to total 14N +15N -labeled proteins in water (black circles) or minocycline-treated (blue circles) animals as a function of abundance in water-treated animals at different ages. Length and age of labeling indicated above each graph. Total of two independent experiments. Significance determined by a paired t test. Asterisks indicate significance *<0.05, **<0.01, ***<0.001, n.s. not significant. Source data for isoTOP-ABPP and quantitative mass spectrometry experiments are available in Figure 3—source datas 1 and 2, respectively.
-
Figure 3—source data 1
Summary of isoTOP-ABPP analysis.
- https://doi.org/10.7554/eLife.40314.010
-
Figure 3—source data 2
Summary of15N-incorporation analysis.
- https://doi.org/10.7554/eLife.40314.011
Figure 3—figure supplement 1
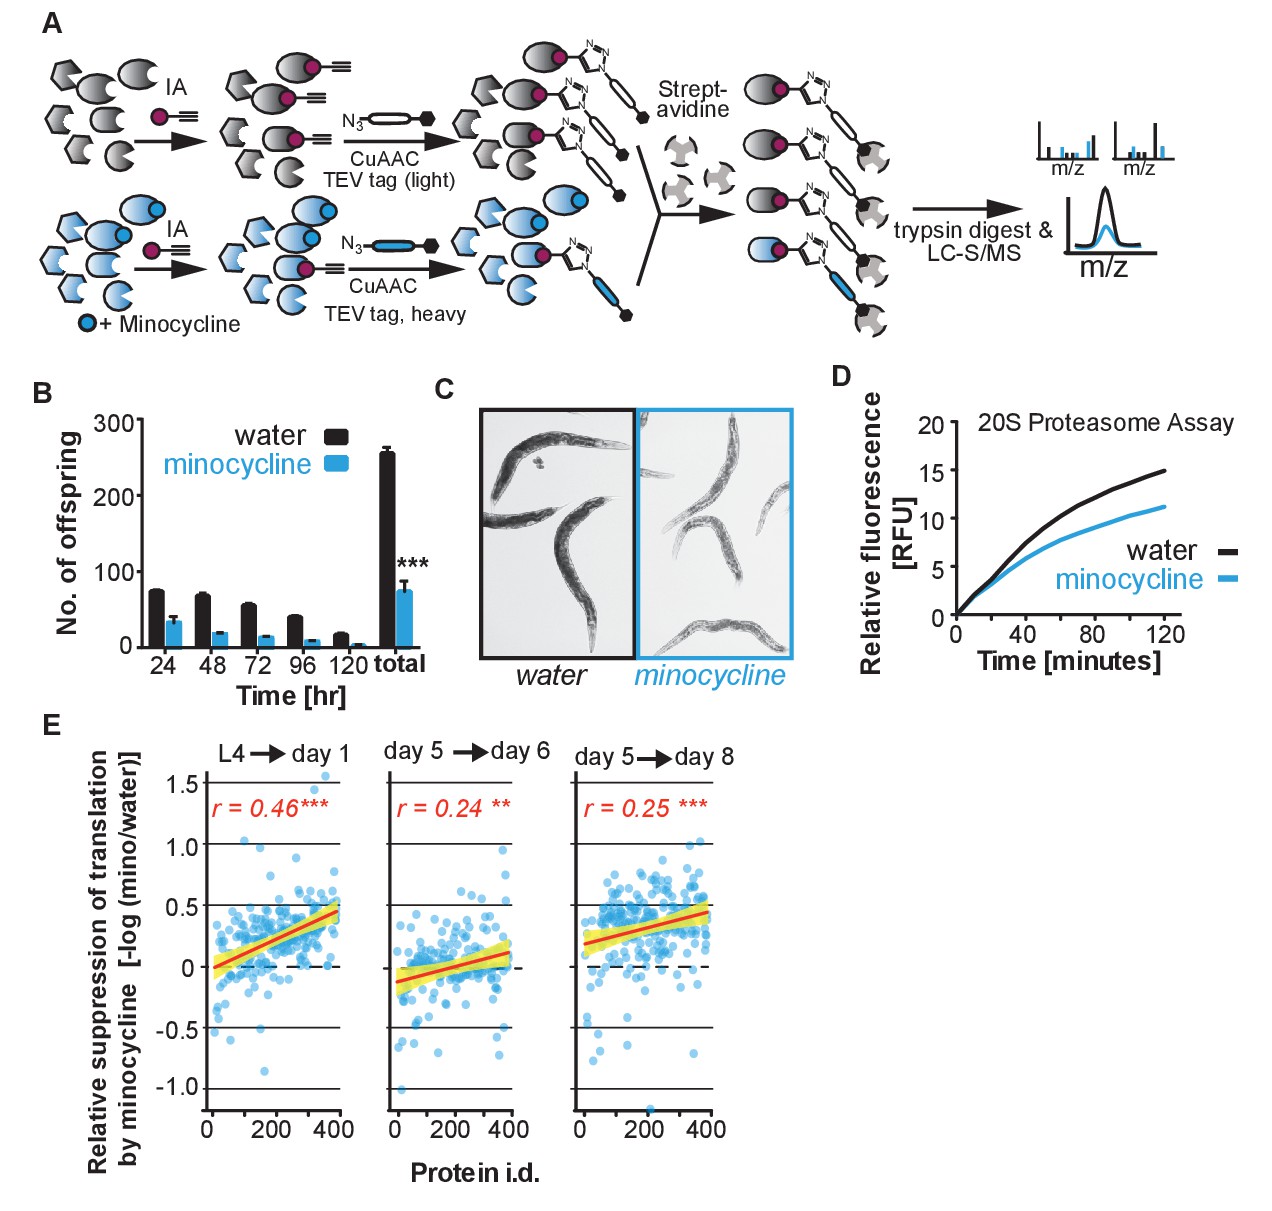
Minocycline-treated animals display phenotypes characteristic of translation inhibition, Related to Figure 3.
(A) Schematic of the isoTOP-ABPP strategy to detect changes in minocycline interactions, expression or post-translational modifications in treated and untreated C. elegans lysate. (B) Same data as in Figure 3B, but showing number of offspring produced per day, in addition to cumulative total. Significance determined by the Mann-Whitney t test. (C) Bright-field images of water- and minocycline-treated adults on day 2 of adulthood. (D) Quantification of 20S proteasome activity from water- or minocycline-treated C. elegans protein extract. (E) Same data as in Figure 3D but analyzed to determine the fold reduction in translation caused by minocycline. Graphs plot the suppressive effect of minocycline (-log10 [intensitymino/intensitywater]) as a function of protein abundance (by rank from Figure 3D) with the correlation coefficient r shown in the upper right corner. Each circle corresponds to the -log10 [intensitymino/intensitywater] expression ratio for one protein. Yellow shading indicates 99% confidence interval. As the observed correlation is based on an expression ratio of the same protein under different conditions, the correlation is not explained by technical considerations like the greater ability of mass spectrometry to detect more abundant proteins. Asterisks indicate significance *<0.05, **<0.01, ***<0.001, n.s. not significant.
Figure 4 with 1 supplement
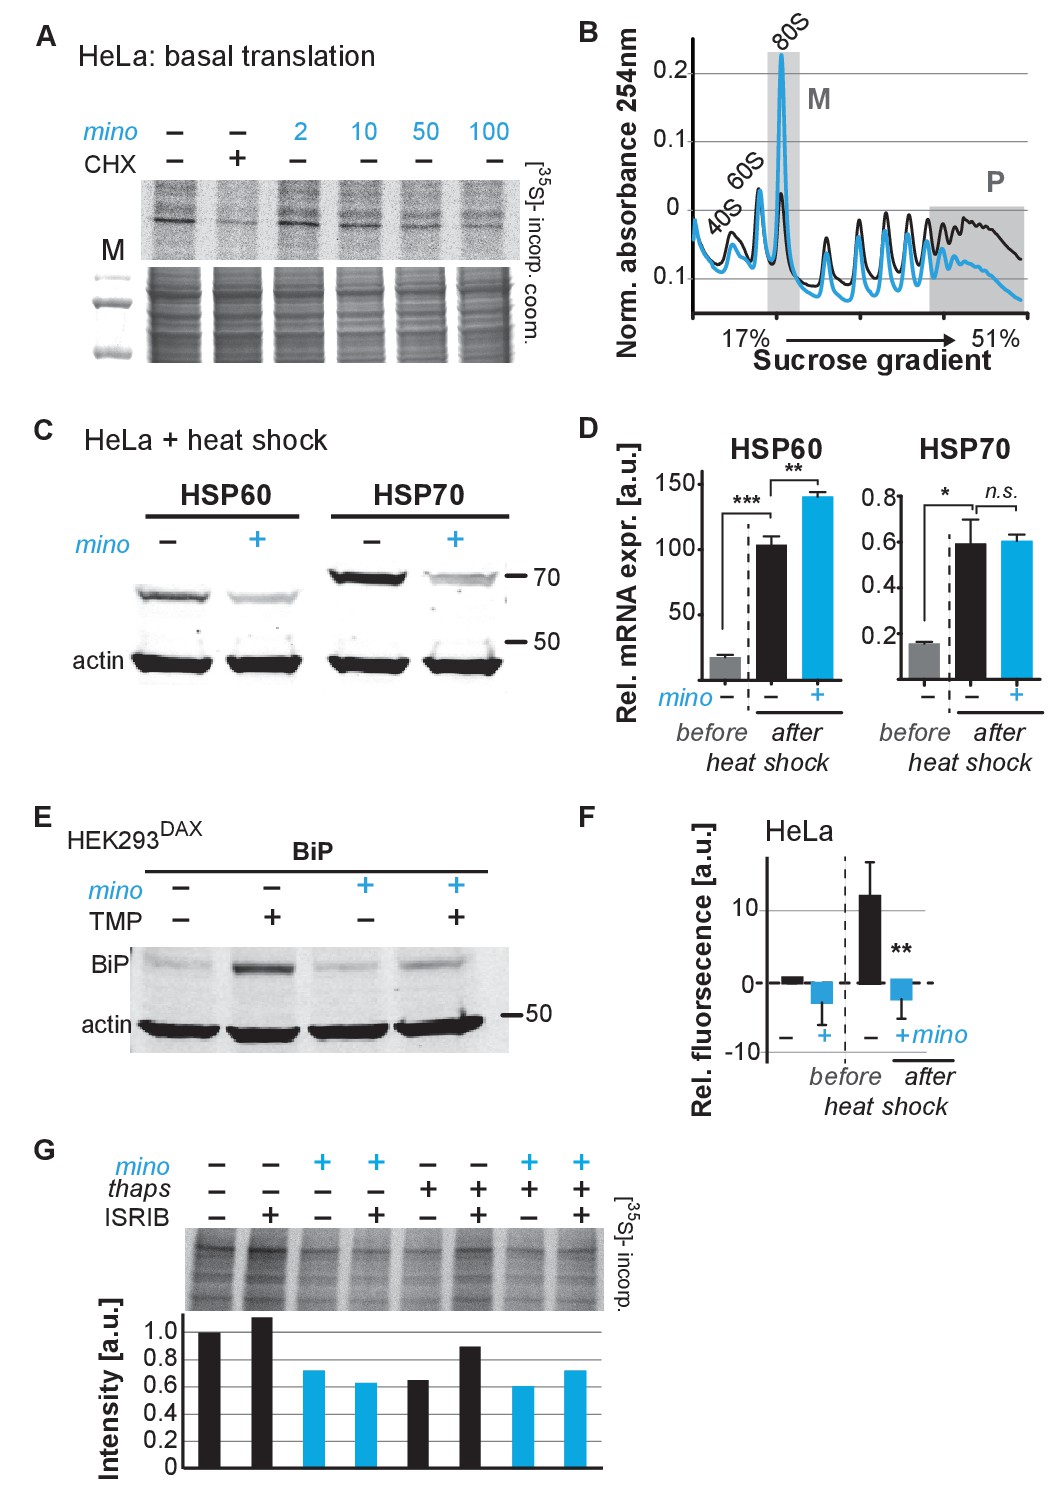
Minocycline attenuates translation and reduces ribosomal load of highly translated mRNAs.
(A) Autoradiograph (top) monitoring 35S incorporation over 1 hr of HeLa cells treated for 6 hr with cycloheximide or increasing concentrations of minocycline. Coomassie gel (bottom) is shown as a loading control. Total of four independent experiments. (B) Polysome profile analysis of 12 hr water- (black) or minocycline-treated (blue) HeLa cells. High molecular weight polysomes (P) and 80S monosomes (M) regions are shaded in gray. An increase in monosomes and a decrease in high-molecular-weight polysomes are indicative of translation attenuation. Total of three independent experiments. (C) Immunoblots probing for HSP60 and HSP70 expression of water- or minocycline-treated (100 μM) HeLa cells after a 1 hr, 43°C heat shock. Total of three independent experiments. (D) qRT-PCR analysis of HSP60 and HSP70 mRNA expression in HeLa cells treated with or without minocycline (100 μM) before and after a 1 hr, 43°C heat shock. Minocycline treatment was initiated 12 hr prior to the heat shock. Data are represented as mean ± S.E.M. Significance determined by the Mann-Whitney t-test. Total of three independent experiments. (E) Immunoblots probing for BiP expression of water- or minocycline-treated (100 μM) HEK293DAX cells engineered to allow UPRER activation by trimethoprim treatment (TMP). Water or 100 μM minocycline was added alone or in combination with 20 uM trimethoprim for 12 hr prior to cell lysis. Samples were normalized by RNA concentration. Total of three independent experiments. (F) Bar graph shows change in protein aggregate formation, as measured by the ProteoStat assay, before and after a 1 hr, 43°C heat shock in control (black) and minocycline-treated (blue) HeLa cells. Data are represented as mean ± S.E.M. Significance determined by the Mann-Whitney t-test. Total of four independent experiments. (G) Autoradiograph (top) monitoring 35S incorporation of HeLa cells treated with the ISR inhibitor ISRIB (200 nM), minocycline (100 μM), thapsigargin (thaps, 200 nM) and a combination of the three. Coomassie gel (bottom) is shown as a loading control. Total of two independent experiments. Asterisks indicate significance *<0.05, **<0.01, ***<0.001, n.s. not significant. Figure 5. Lifespan extension by minocycline depends on cytoplasmic translation.
Figure 4—figure supplement 1
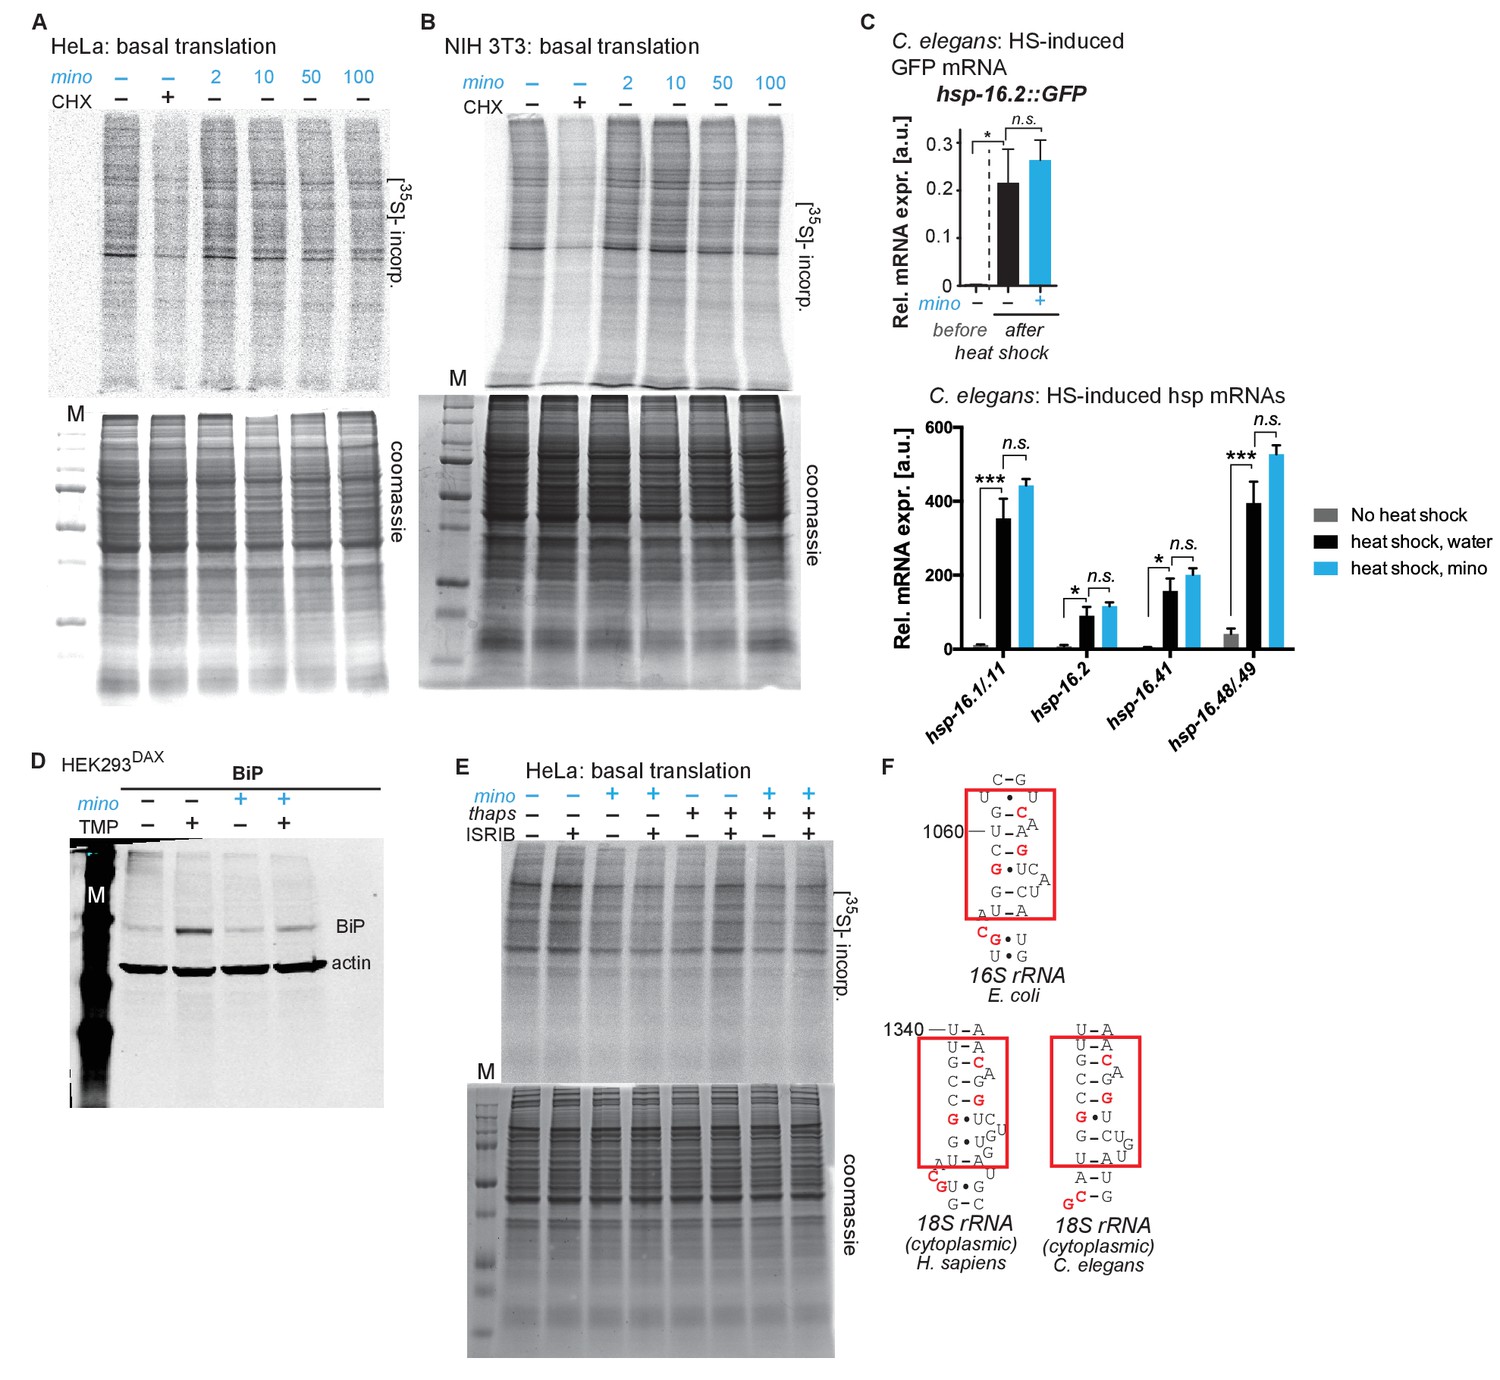
Minocycline suppresses 35S incorporation in multiple paradigms.
(A) Full gels shown from Figure 4A. Autoradiograph (top) monitoring 35S incorporation of HeLa cells treated with cycloheximide or increasing concentrations of minocycline. Coomassie gel (bottom) shown as loading control. (B) Autoradiograph (top) monitoring 35S incorporation of NIH 3T3 cells treated with cycloheximide or increasing concentrations of minocycline. Coomassie gel (bottom) is shown as a loading control. Total of 3 independent experiments. (C) qRT-PCR quantification of relative GFP mRNA (top) or hsp mRNAs (bottom) expression from untreated or minocycline-treated (100 μM) hsp-16.2p::GFP C. elegans before and after a 1.5 hr, 35°C heat shock. While heat shock fails to induce GFP fluorescence in hsp-16.2p::GFP reporter animals in the presence of minocycline (Figure 2B,C), it still induces the GFP mRNA, revealing the effect of minocycline on translation. Significance determined by the Mann-Whitney Student's t test. n = 1500 animals per condition. Total of three independent experiments. (D) Full gel shown from Figure 4E. Immunoblots probing for BiP expression of control or minocycline-treated (100 μM) HEK293DAX cells engineered to allow UPRER activation by trimethoprim treatment (TMP). (E) Full gels shown from Figure 4G. Autoradiograph (top) monitoring 35S incorporation of HeLa cells treated with the ISR inhibitor ISRIB, minocycline, thapsigargin (thaps) and a combination of the three. Coomassie gel (bottom) is shown as a loading control. (F) Comparison of the known tetracycline binding site in helix 34 (h34) of the E. coli 16S rRNA with the 18S rRNA of H. sapiens and C. elegans. Red squares indicate the tetracycline binding region with the interacting residues highlighted in red. Asterisks indicate significance *<0.05, **<0.01, ***<0.001, n.s. not significant.
Figure 5 with 1 supplement
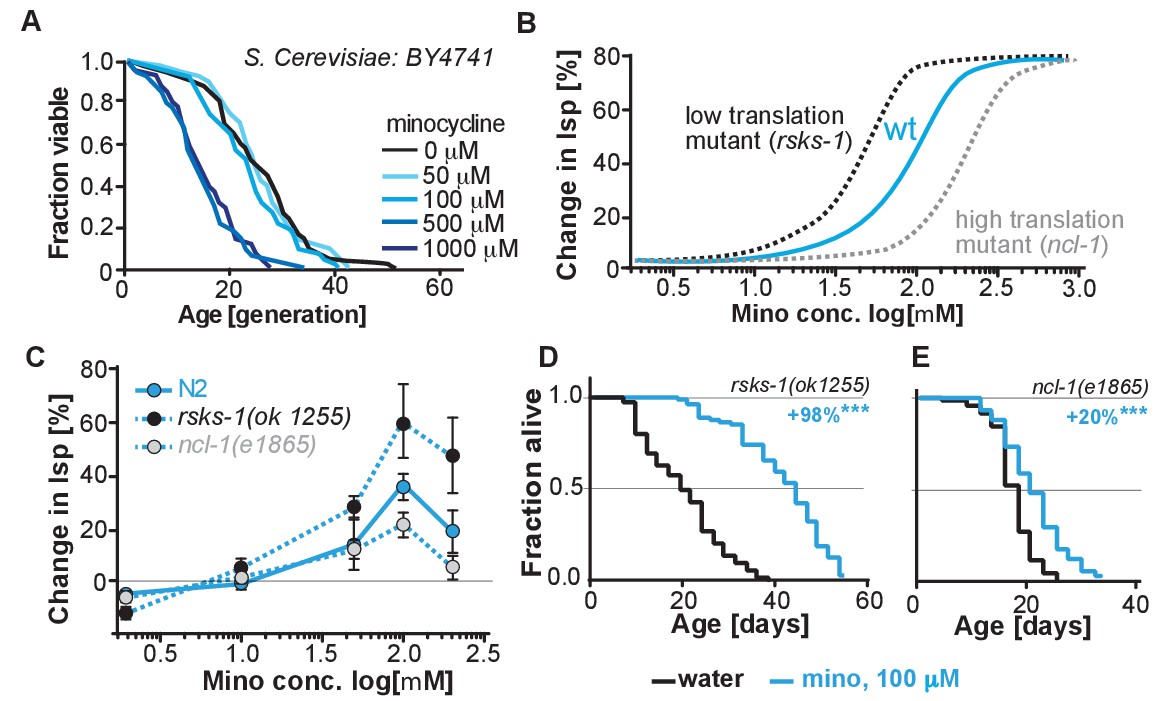
(A) Replicative lifespan of S. cerevisae treated with increasing concentrations of minocycline.
Data were analyzed using the Wilcoxon rank-sum test. (B) Depicts expected dose response curve shifts for mutants with lower (black curve) or higher (gray curve) translation rates treated with minocycline compared to wild-type (blue curve). As translation is essential, translation mutants must retain some translation activity, albeit less than in wild type. Thus, in mutants with reduced translation like rsks-1, less minocycline should be necessary to optimally lower translation and to increase lifespan resulting in a left-shifted dose-response curve. If minocycline targets the 18S rRNA, an excess of rRNA and an increase in translation as in ncl-1 mutants should result in a right-shifted dose-response curve. (C) Dose response curves show the % change in lifespan as a function of increasing minocycline concentrations for N2, rsks-1(ok1255) and ncl-1(e1865) mutants. Total of four independent experiments performed. Data are represented as mean ± S.E.M. (D) Survival curves for water- or minocycline- (100 μM) treated rsks-1(ok1255) C. elegans mutants. At least four independent experiments performed. (E) Survival curves for water- or minocycline- (100 μM) treated ncl-1(e1865) C. elegans mutants. Statistical significance determined by the log-rank test. Number of animals n ranging from 42 to 87, total of four independent experiments. Asterisks indicate significance *<0.05, **<0.01, ***<0.001, n.s. not significant. Source data for N2, rsks-1 and ncl-1 lifespan experiments are available in Figure 5—source data 1.
-
Figure 5—source data 1
Summary of rsks-1 and ncl-1 lifespan data, related to Figure 5 and Figure 5—figure supplement 1.
- https://doi.org/10.7554/eLife.40314.016
Figure 5—figure supplement 1

Evidence for a toxic off-target at higher minocycline concentrations.
(A) Depicts expected effect on change in lifespan of a translation-independent toxic off-target. Too much translation attenuation by too much minocycline is likely to be detrimental. However, the minocycline concentration to reach this detrimental effect should depend on the endogenous translation rate of each strain and should occur at lower concentrations in rsks-1 mutants and at higher concentration in ncl-1 mutants. The observed detrimental effect however occurs in all strains, N2, ncl-1, rsks-1 at the same minocycline concentration irrespective of their endogenous translation rate. It is therefore more consistent with the engagement of a toxic off-target not related to translation. (B) Same as Figure 5C, showing the shift in dose-response curves and toxic off-target effect between 100 and 200 μM minocycline (shaded gray). Also note that 200 μM minocycline do not cause a drop in lifespan extension in skn-1 mutants (Figure 2) but further extend lifespan suggesting that the expression of the toxic off-target may be regulated by skn-1.
Figure 6
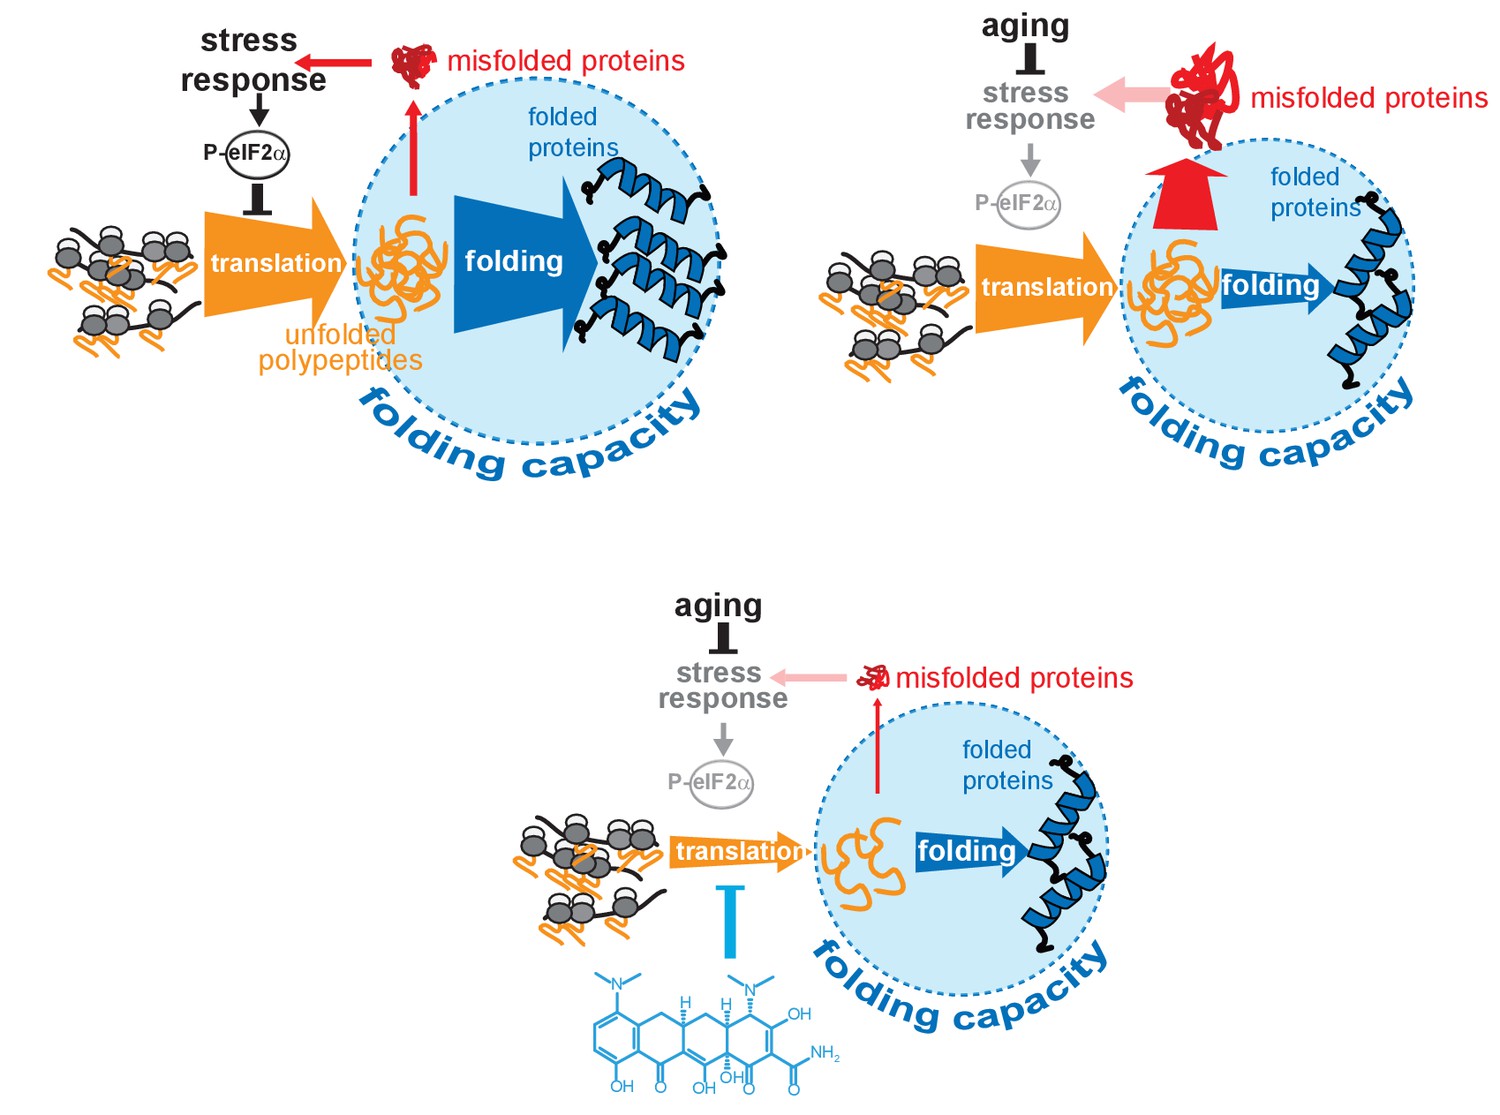
Model on how minocycline rebalances proteostatic load with the decreased folding capacity in older organisms.
Top left: In young animals stress responses and the ISR act as feedback mechanisms to control proteostatic load driven by mRNA translation. Translation is prevented from overburdening the folding machinery as accumulation of unfolded proteins leads to the induction of stress responses, triggering attenuation of translation through eIF2α phosphorylation, acting as a feedback control to reduce protesostatic load. Top right: Age-associated decline of stress response signaling compromises the translational feedback attenuation, allowing a relative excess in mRNA translation compared to the declining folding capacity in older adults. Thus, in old organisms cellular signals (i.e. inflammatory signals) that induce widespread gene expression changes and protein synthesis may lead to an excessive proteostatic load that can no longer be handled by the existing folding capacity. Bottom: Minocycline targets the ribosome to attenuate translation, thus aligning proteostatic load with folding capacity, mimicking the effect of the ISR. The thickness of the ‘translation’ and ‘folding’ arrows are drawn to signify the relative capacity of each system.
Tables
Key resources table
| Reagent type (species) or resource | Designation | Source or reference | Identifiers | Additional information |
|---|---|---|---|---|
| Strain, strain background (Caenorhabditis elegans) | N2 | Caenorhabditis Genetics Center | RRID:WB-STRAIN:N2_(ancestral) | wild-type (Bristol) |
| Strain, strain background (C. elegans) | CL2166 | CGC | RRID:WB-STRAIN:CL2166 | dvIs19 [(pAF15)gst -4p::GFP::NLS] III |
| Strain, strain background (C. elegans) | SJ4005 | CGC | RRID:WB-STRAIN:SJ4005 | zcIs4 [hsp-4::GFP] V |
| Strain, strain background (C. elegans) | SJ4100 | CGC | RRID:WB- STRAIN:SJ4100 | zcIs13 [hsp-6::GFP] |
| Strain, strain background (C. elegans) | CL2070 | CGC | RRID:WB-STRAIN:CL2070 | dvIs70 [hsp-16.2p::GFP + rol-6(su1006)] |
| Strain, strain background (C. elegans) | SJ17 | CGC | RRID:WB-S TRAIN:SJ17 | xbp-1(zc12) III; zcIs4 V |
| Strain, strain background (C. elegans) | QV225 | CGC | RRID:WB- STRAIN:QV225 | skn-1(zj15) IV |
| Strain, strain background (C. elegans) | PS3551 | CGC | RRID:WB-STRAIN:PS3551 | hsf-1(sy441) I |
| Strain, strain background (C. elegans) | CF1038 | CGC | RRID:WB-STRAIN:CF1038 | daf-16(mu86) I |
| Strain, strain background (C. elegans) | CB369 | CGC | RRID:WB-STRAIN:CB369 | unc-51(e369) V |
| Strain, strain background (C. elegans) | RB1206 | CGC | RRID:WB-STRAIN:RB1206 | rsks-1(ok1255) III |
| Strain, strain background (C. elegans) | CB3388 | CGC | RRID:WB-STRAIN:CB3388 | ncl-1(e1865) III |
| Strain, strain background (C. elegans) | CL2006 | CGC | RRID:WB-STRAIN:CL2006 | dvIs2(pCL12(unc-54:hu-Aβ 1–42)+pRF4) |
| Strain, strain background (C. elegans) | NL5901 | CGC | RRID:WB-STRAIN:NL5901 | pkIs2386 [α-synuclein::YFP unc-119(+)] |
| Strain, strain background (C. elegans) | MAH93 | Other | glp-1(ar202), unc-119(ed3), ItIs38[pAA1; pie-1/GFP::PH(PLCdelta1); unc-119 (+)] III; ItIs37[pAA64; pie-1/mCHERRY::his-58, unc-119 (+)]IV); gift from M. Hansen | |
| Strain, strain background (C. elegans) | MAH686 | Other | hlh-30(tm1978) IV; gift from M. Hansen | |
| Strain, strain background (C. elegans) | CMH5 | DOI: 10.1371/ journal.pone.0159989 | atfs-1(tm4525) V | |
| Strain, strain background (C. elegans) | BC20306 | Baillie Genome GFP Project, Simon Fraser University | RRID:WB:-STRAIN:BC20306 | cyp-34A9::GFP |
| Cell line (Homo sapiens) | HeLa | ATCC | Cat # CCL-2, RRID:CVCL_0030 | |
| Cell line (Mus musculus) | NIH 3T3 | ATCC | Cat # CRL-1658, RRID:CVCL_0594 | |
| Cell line (H. sapiens) | HEK293DAX | DOI: 10.1016/j.celrep.2013.03.024 | ||
| Antibody | anti-actin (mouse monoclonal) | MP Biomedicals | Cat # 08691001, RRID:AB_2335127 | (1:500) |
| Antibody | anti-Hsp60 (mouse monoclonal) | ThermoFisher | Cat # MA3-012, RRID:AB_2121466 | (1:250) |
| Antibody | anti-Hsp70/72 (mouse monoclonal) | Enzo | Cat # ADI-SPA-810, RRID:AB_10616513 | (1:1000) |
| Antibody | anti-GRP78 (BiP) (rabbit polyclonal) | Abcam | Cat # ab21685, RRID:AB_2119834 | (1:1000, from1 mg/ml) |
| Antibody | IRDye 800CW (secondary) | Li-Cor | Cat # 926–32210, RRID:AB_621842 | (1:10000) |
| Antibody | IRDye 800CW (secondary) | Li-Cor | Cat # 926–32211, RRID:AB_621843 | (1:10000) |
| Sequence-based reagent | HSP60 forward primer, 5'- GCAGAGTTCCTCAGAAGTTGG-3' | DOI: 10.1186/ s12974-016-0486-x | qRT-PCR | |
| Sequence- based reagent | HSP60 reverse primer, 5'- GCATCCAGTAAGGCAGTTCTC-3' | DOI: 10.1186/ s12974-016-0486-x | qRT-PCR | |
| Sequence-based reagent | HSPA1A (HSP70) forward primer, 5'- GGAGGCGGAGAAGTACA-3' | DOI: 10.1021/ cb500062n | qRT-PCR | |
| Sequence-based reagent | HSPA1A (HSP70) reverse primer, 5'- GCTGATGATG GGGTTAACA-3' | DOI: 10.1021/cb500062n | qRT-PCR | |
| Sequence-based reagent | hsp-16.1/.11 forward primer, 5'- ACCACTATTTC CGTCCAGCT-3' | DOI: 10.7554/ eLife.08833 | qRT-PCR | |
| Sequence-based reagent | hsp-16.1/.11 reverse primer, 5'- TGACGTTCCATCTGAGCCAT-3' | DOI: 10.7554/ eLife.08833 | qRT-PCR | |
| Sequence-based reagent | hsp-16.2 forward primer, 5'- TCGATTGAAGCGCCAAAGAA-3' | DOI: 10.7554/eLife.08833 | qRT-PCR | |
| Sequence-based reagent | hsp-16.2 reverse primer, 5'- TCTCTTCGACGATTGCCTGT-3' | DOI: 10.7554/ eLife.08833 | qRT-PCR | |
| Sequence-based reagent | hsp-16.41 forward primer, 5'- TCTTGGACGAACTCACTGGA-3' | DOI: 10.7554/eLife.08833 | qRT-PCR | |
| Sequence- based reagent | hsp-16.41 reverse primer, 5'- AGAGACATCGAGTTGAACCGA-3' | DOI: 10.7554/eLife.08833 | qRT-PCR | |
| Sequence-based reagent | hsp-16.48/.49 forward primer, 5'- CTCATGCTCCGTTCTCCATT-3' | DOI: 10.7554/ eLife.08833 | qRT-PCR | |
| Sequence-based reagent | hsp-16.48/.49 reverse primer, 5'- GAGTTGTGATCAGCATTTCTCCA-3' | DOI: 10.7554/ eLife.08833 | qRT-PCR | |
| Sequence-based reagent | GFP forward primer, 5'- GGTCCTTCTTGAGTTTGTAAC-3' | DOI: 10.1074/ jbc.C100556200 | qRT-PCR | |
| Sequence- based reagent | GFP reverse primer, 5'- CTCCACTGACA GAAAATTTG-3' | DOI: 10.1074/jbc.C100556200 | qRT-PCR | |
| Sequence-based reagent | SDHA forward primer, 5'- TGGTGCTGGTTGTCTCATTA-3' | DOI: 10.1134/ S0003683813090032 | qRT-PCR | |
| Sequence- based reagent | SDHA reverse primer, 5'- ACCTTTCGCCTTGACTGTT-3' | DOI: 10.1134/ S0003683813090032 | qRT-PCR | |
| Sequence- based reagent | HSPC3 forward primer, 5'- ATGGAAGAGA GCAAGGCAAA-3' | DOI: 10.1134/ S0003683813090032 | qRT-PCR | |
| Sequence-based reagent | HSPC3 reverse primer, 5'- AATGCAGCAAG GTGAAGACA-3' | DOI: 10.1134/ S0003683813090032 | qRT-PCR | |
| Sequence- based reagent | crn-3 forward primer, 5'- GAATGCACTCAT GAACAAAGTC-3' | DOI: 10.7554/ eLife.08833 | qRT-PCR | |
| Sequence- based reagent | crn-3 reverse primer, 5'- TAATGTTCGACT GATGAACCG-3' | DOI: 10.7554/ eLife.08833 | qRT-PCR | |
| Sequence- based reagent | xpg-1 forward primer, 5'- ATTGAGAACAG GATCATGAGG-3' | DOI: 10.7554/eLife.08833 | qRT-PCR | |
| Sequence- based reagent | xpg-1 reverse primer, 5'-ACTAGCA ACTCGTTTATCATCC-3' | DOI: 10.7554/ eLife.08833 | qRT-PCR | |
| Sequence-based reagent | rpl-6 forward primer, 5'-ACTAGCAACTCGTTTATCATCC-3' | DOI: 10.7554/eLife.08833 | qRT-PCR | |
| Sequence-based reagent | rpl-6 reverse primer, 5'- GACAGTCTTGGAATGTCCGA-3' | DOI: 10.7554/eLife.08833 | qRT-PCR | |
| Commercial assay or kit | 20S Proteasome Activity Assay Kit | Chemicon International | Cat # APT280 | |
| Commercial assay or kit | RNeasy Mini Kit | Qiagen | Cat # 74104 | |
| Commercial assay or kit | iScript RT-Supermix | Bio-Rad | Cat # 170–8841 | |
| Commercial assay or kit | SsoAdvanced SYBR Green Supermix | Bio-Rad | Cat # 172–5264 | |
| Commercial assay or kit | PROTEOSTAT Prot. aggregation assay | Enzo | Cat # ENZ-51023 | |
| Chemical compound, drug | minocycline | Mp Biomedicals | Cat # 0215571891 | |
| Chemical compound, drug | methyl viologen hydrate (paraquat) | Acros Organics | Cat # 227320010 | |
| Chemical compound, drug | tunicamycin | LKT Laboratories | Cat # T8153 | |
| Chemical compound, drug | thapsigargin | Cayman Chemical | Cat # 10522 | |
| Chemical compound, drug | ISRIB | R and D Systems | Cat # 5284/10 | |
| Chemical compound, drug | levamisole | Mp Biomedicals | Cat # 0215522810 | |
| Chemical compound, drug | sodium arsenite | Spectrum Chemical | Cat # S1135 | |
| Chemical compound, drug | cycloheximide | Alfa Aesar | Cat # J66901-03 | |
| Software, algorithm | CellProfiler | Broad Institute | RRID:SCR_007358 | α-synuclein::YFP aggregate number and worm size analyses |
| Software, algorithm | Bio-Rad CFX Manager | Bio-Rad | qRT-PCR analysis | |
| Software, algorithm | ImageQuant | GE Healthcare Life Sciences | RRID:SCR_014246 | 35S incorporation analysis |
Additional files
-
Supplementary file 1
Select minocycline clinical trials.
- https://doi.org/10.7554/eLife.40314.018
-
Supplementary file 2
Completed and ongoing clinical trials with minocycline.
- https://doi.org/10.7554/eLife.40314.019
-
Transparent reporting form
- https://doi.org/10.7554/eLife.40314.020
Download links
A two-part list of links to download the article, or parts of the article, in various formats.
Downloads (link to download the article as PDF)
Open citations (links to open the citations from this article in various online reference manager services)
Cite this article (links to download the citations from this article in formats compatible with various reference manager tools)
Translation attenuation by minocycline enhances longevity and proteostasis in old post-stress-responsive organisms
eLife 7:e40314.
https://doi.org/10.7554/eLife.40314


