Splicing factors Sf3A2 and Prp31 have direct roles in mitotic chromosome segregation
- Sapienza Università di Roma, Italy
- University of Exeter, United Kingdom
Figures
Figure 1 with 4 supplements
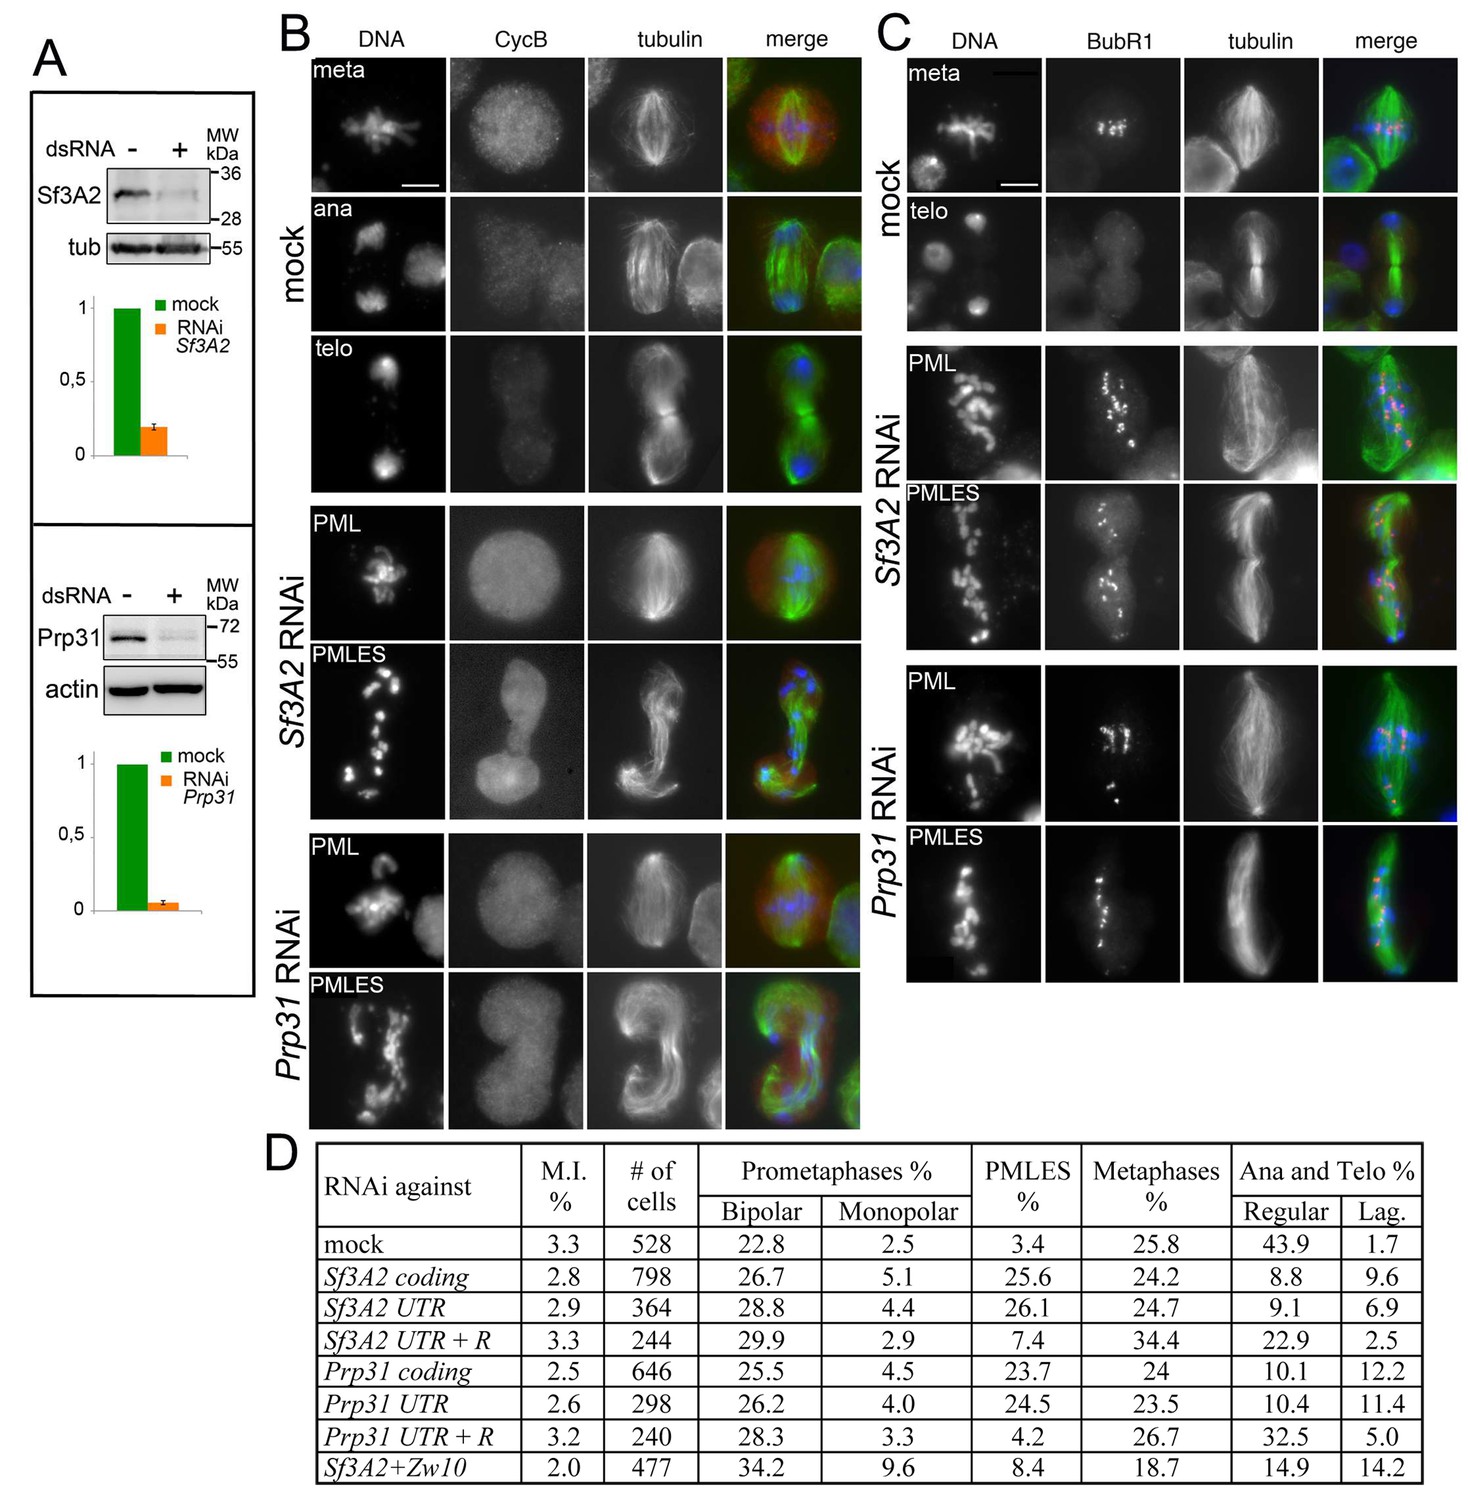
RNAi-mediated depletion of Sf3A2 or Prp31 inhibits sister chromatid separation during mitosis.
(A) Western blots of S2 cell extracts and quantitation of relative band intensities showing that RNAi against Sf3A2 or Prp31 strongly reduces the levels of these proteins; tubulin (tub) and actin are loading controls (the full blot is shown in (Figure 1—figure supplement 1). (B) Mitotic figures observed in mock-treated control cells and in Sf3A2- and Prp31-depleted cells stained for DNA (blue), tubulin (green) and Cyclin B (red). meta, metaphase; ana, anaphase; telo, telophase; PML, prometaphase-like; PMLES prometaphase-like cells with elongated spindles. Note that PMLES exhibit a high level of Cyclin B. Scale bar, 5 μm. (C) Mitotic figures observed in control and RNAi cells stained for DNA (blue), tubulin (green) and BubR1 (red). BubR1 is enriched at the kinetochores in PMLES but not in control ana-telophases. Scale bar, 5 μm. (D) Frequencies of mitotic figures observed after RNAi against the indicated Sf3A2 and Prp31 sequences, or against both the Sf3A2 and Zw10 coding sequences; R are rescue constructs expressing either the Sf3A2 or the Prp31 coding sequence devoid of the UTRs. Lag, lagging chromosomes between the ana-telophase nuclei. M.I., mitotic index (i.e. percent of cells undergoing mitosis).
-
Figure 1—source data 1
Source data for Figure 1A and Figure 1—figure supplement 4.
- https://doi.org/10.7554/eLife.40325.007
Figure 1—figure supplement 1
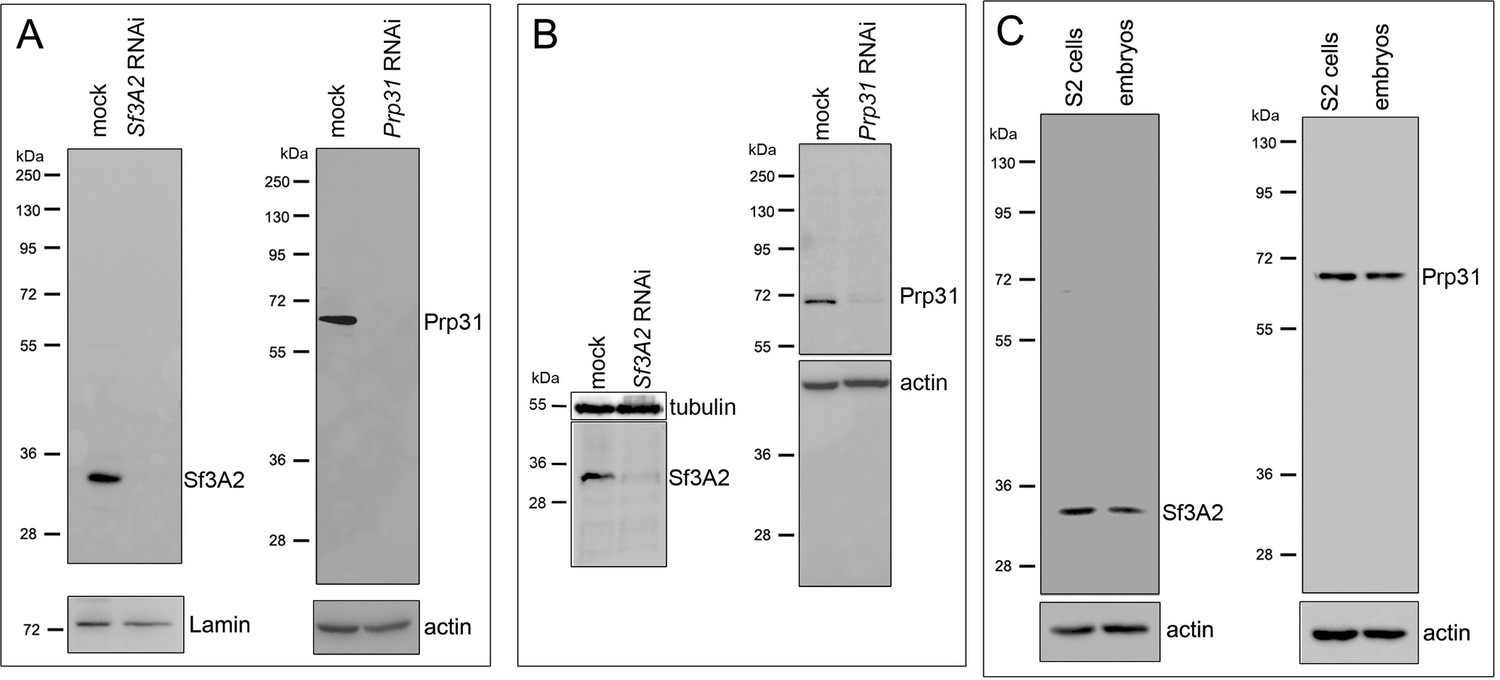
Specificity of the anti-Sf3A2 and anti-Prp31 antibodies.
(A, B) Western blots from mock-treated, Sf3A2 RNAi and Prp31 RNAi S2 cell extracts stained with affinity-purified anti-Sf3A2 and anti-Prp31 antibodies; the blots in (B) are the same as those of Figure 1A. Lamin, actin and tubulin are loading controls. (C) Western blots from untreated S2 cell and embryo extracts stained with affinity-purified anti-Sf3A2 and anti-Prp31 antibodies. Actin is a loading control.
Figure 1—figure supplement 2
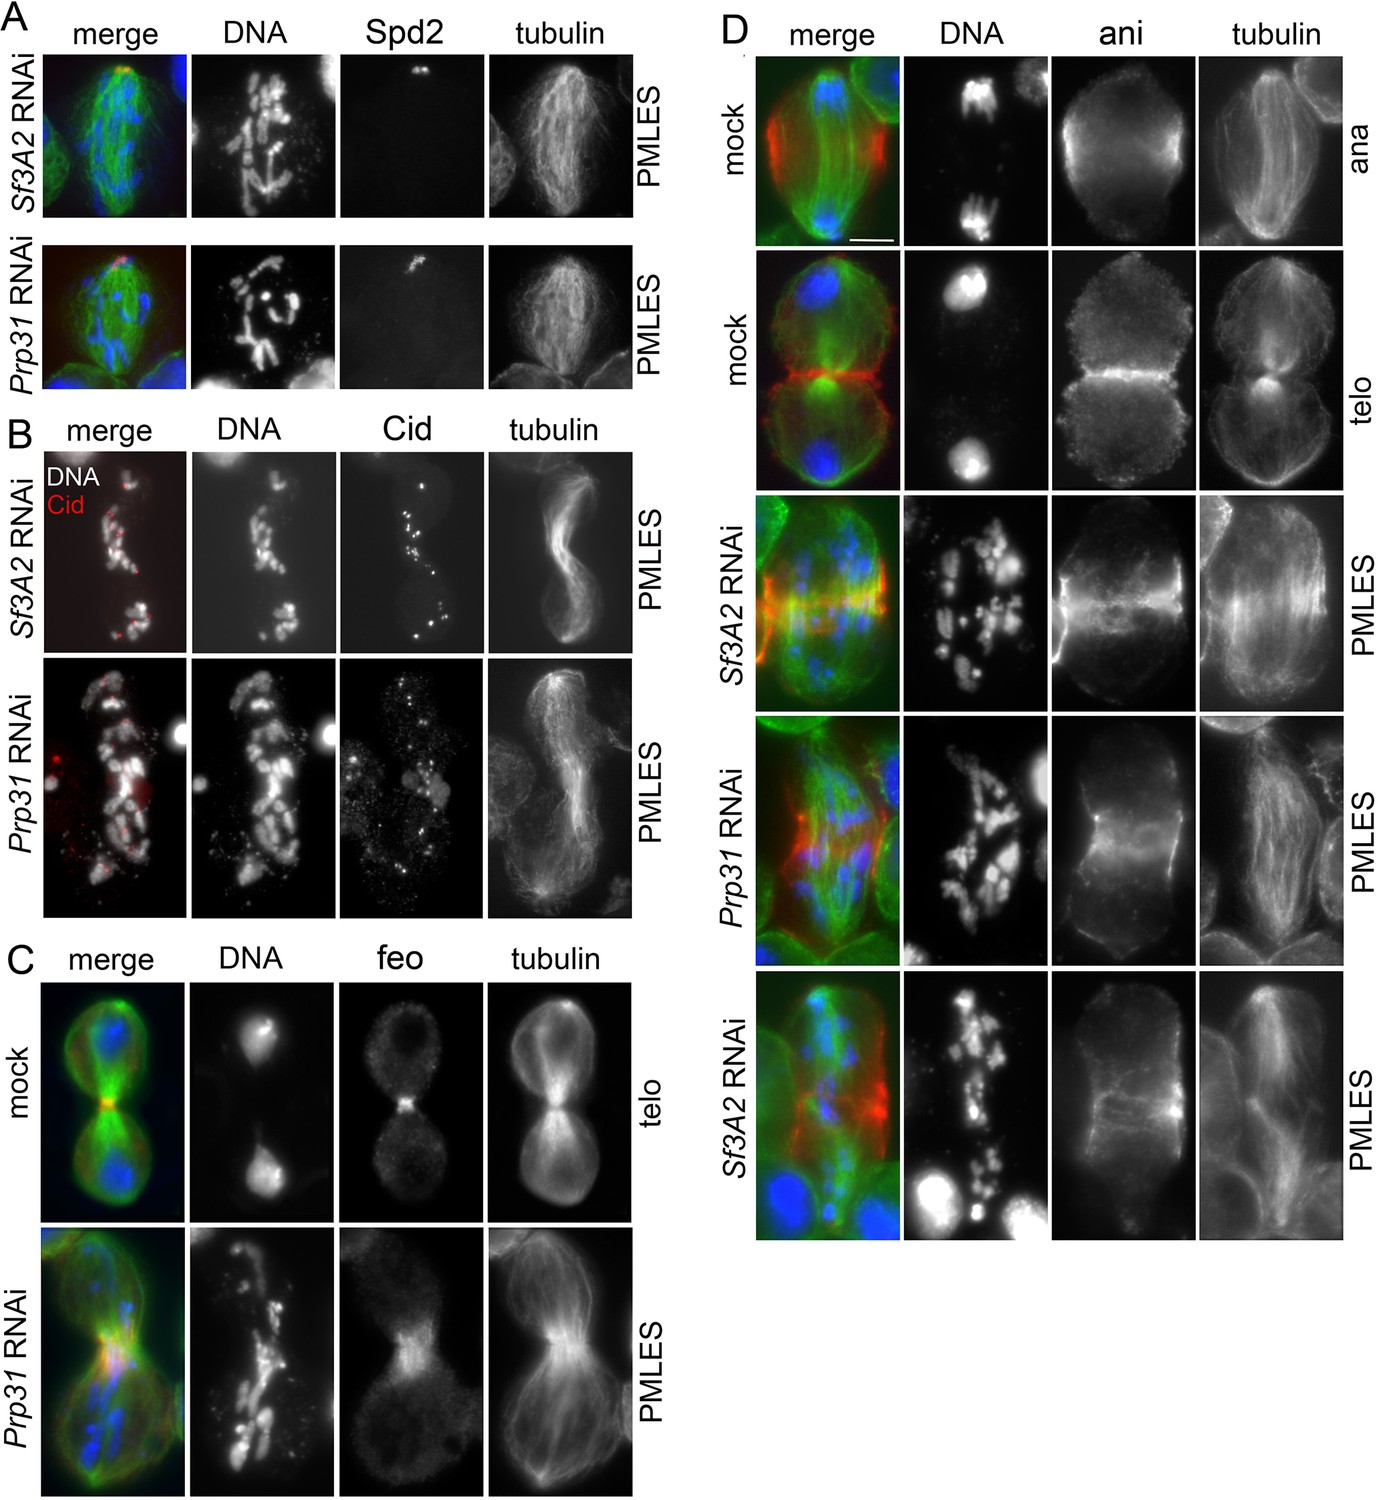
Examples of monopolar spindles and PMLES observed in Sf3A2 and Prp31 RNAi cells.
(A) Monopolar spindles showing two centrosomes at the pole; cells were stained for tubulin (green), the centrosomal marker Spd2 (Giansanti et al., 2008) (red), and DNA (DAPI, blue). (B) PMLES stained for tubulin, Cid/Cenp-A and DNA; note that the chromosomes comprise both sister chromatids. (C) PMLES stained for tubulin (green), DNA (blue), and the central spindle marker Fascetto (Feo; red), the Drosophila orthologue of PRC1, required for central spindle formation and cytokinesis (Vernì et al., 2004). Note that Feo accumulates in the central spindle midzone of both PMLES and mock-treated cells. (D) Control anaphases and telophases and PMLES stained for tubulin (green), DNA (blue) and the contractile ring marker anillin (red) required for S2 cell cytokinesis (Somma et al., 2002). Note that PMLES showing anaphase B-like and telophase-like spindles exhibit an anillin signal.
Figure 1—figure supplement 3
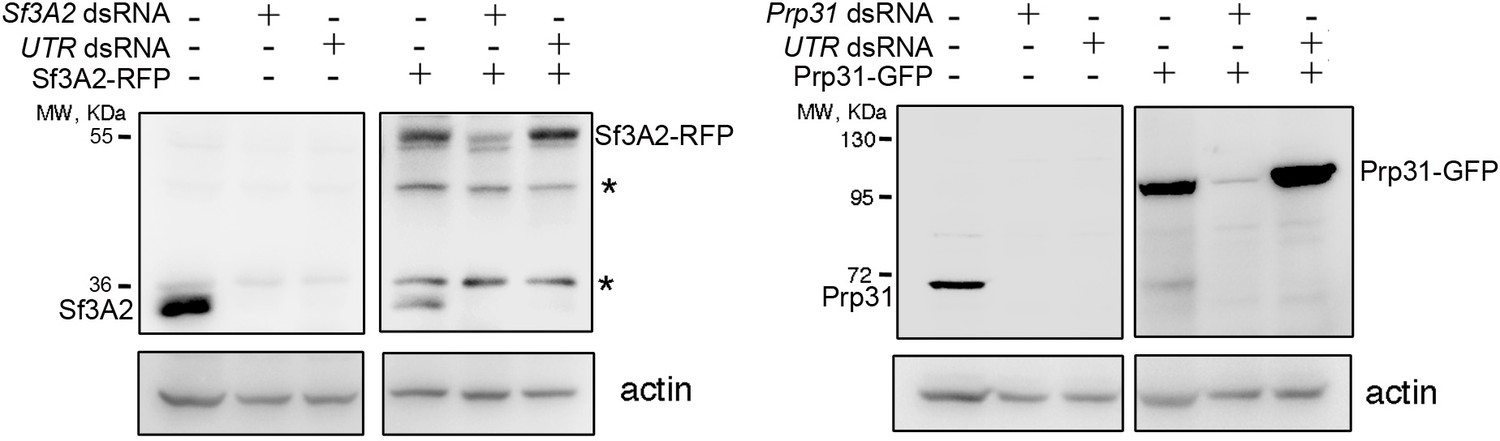
RNAi against the coding sequences and the UTRs of Sf3A2 and Prp31 rules out off-target effects (see also Figure 1D).
RNAi against the 5' UTR of Sf3A2 or the 3' UTR of Prp31 leads to depletion of the endogenous Sf3A2 and Prp31 proteins but not of Sf3A2-RFP and Prp31-GFP that lack both the 5' and the 3’ UTRs. Sf3A2 dsRNA and Prp31 dsRNA are complementary to the coding sequences of these genes. The asterisks indicate non-specific bands. Actin was used as loading control.
Figure 1—figure supplement 4
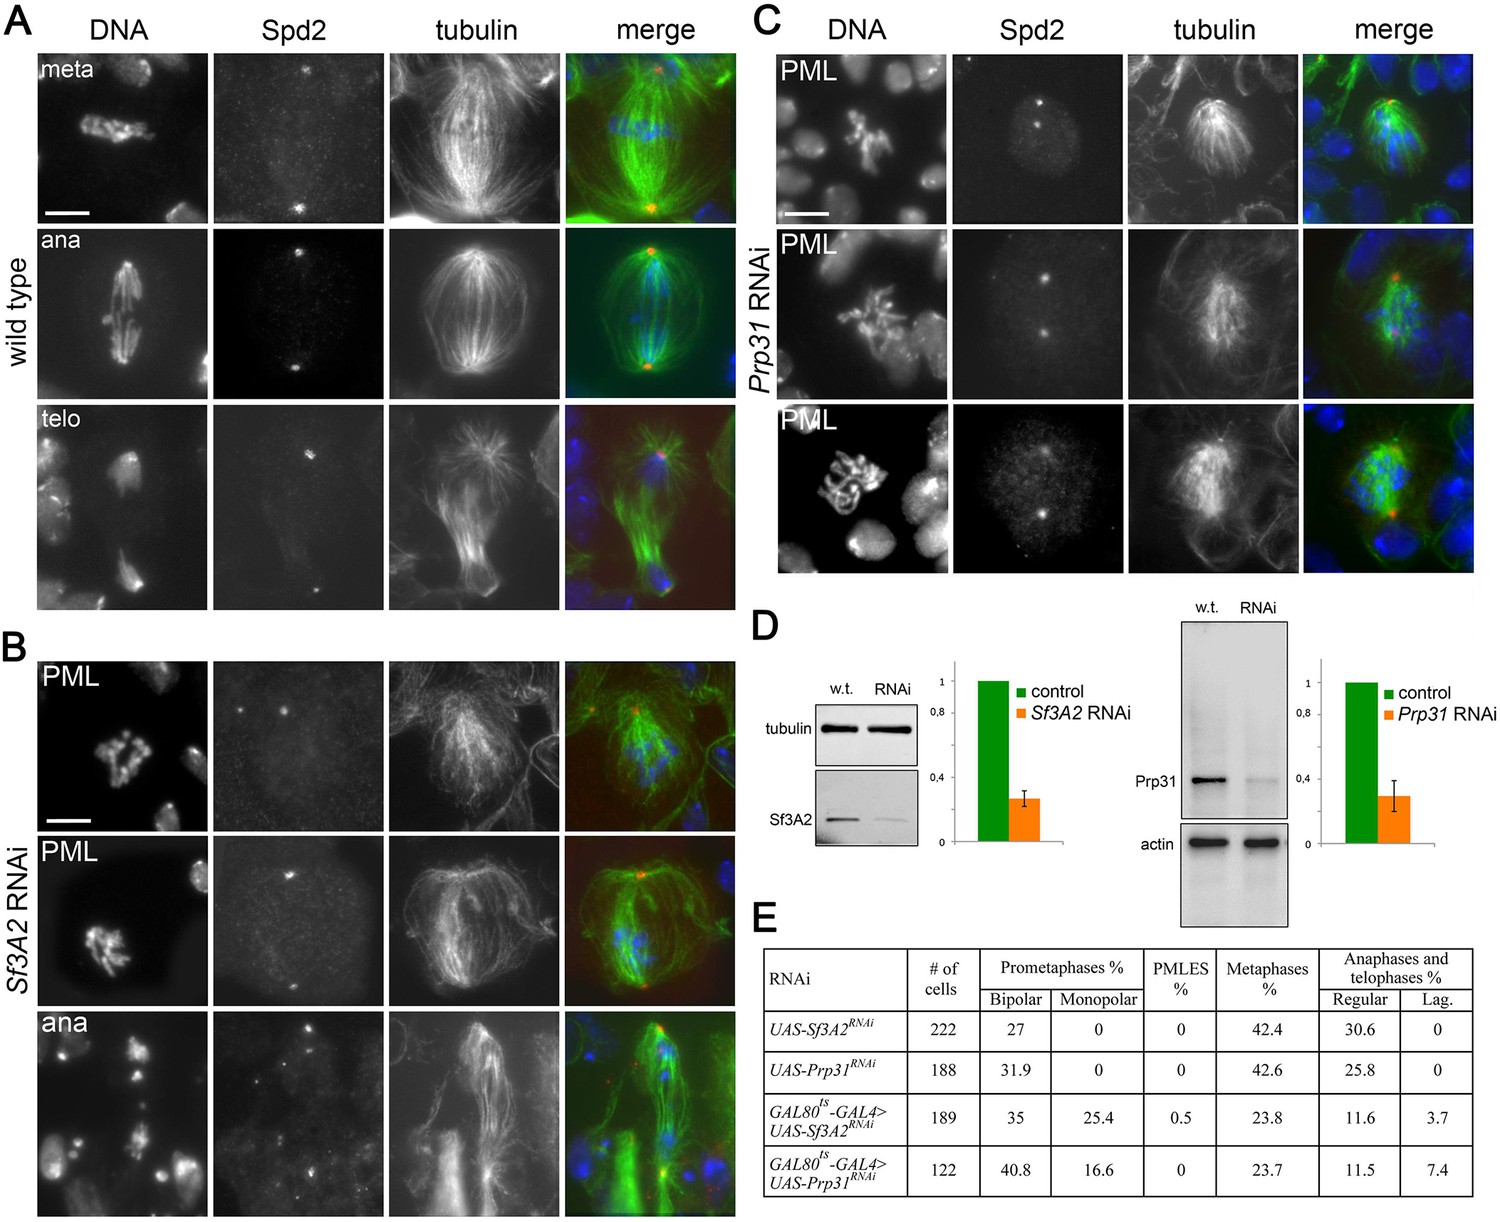
RNAi-mediated depletion of Sf3A2 or Prp31 affects spindle structure of larval brain cells and inhibits chromosome segregation.
(A–C) Metaphase (meta), prometaphase-like (PML, monopolar and bipolar), anaphase (ana) and telophase (telo) figures of neuroblasts stained for DNA (blue), the centrosomal marker Spd2 (red) and tubulin (green) from wild type (A), Sf3A2 RNAi (B) and Prp31 RNAi (C) larval brains. Scale bars, 5 μm. (D) Western blots and quantitation of relative band intensities showing that in brain extracts from tub-GAL80ts tub-GAL4 >UAS-Sf3A2RNAi and tub-GAL80ts tub-GAL4 >UAS-Prp31RNAi larvae exposed for 72 hr at 29°C the levels of Sf3A2 and Prp31 are strongly reduced. Tubulin and actin were used as loading controls. (E) Frequencies of mitotic figures observed after RNAi against the indicated genes. UAS-Sf3A2RNAi and UAS-Prp31RNAi are control brains containing the RNAi constructs alone. Lag, lagging chromosomes between the ana-telophase nuclei.
Figure 2
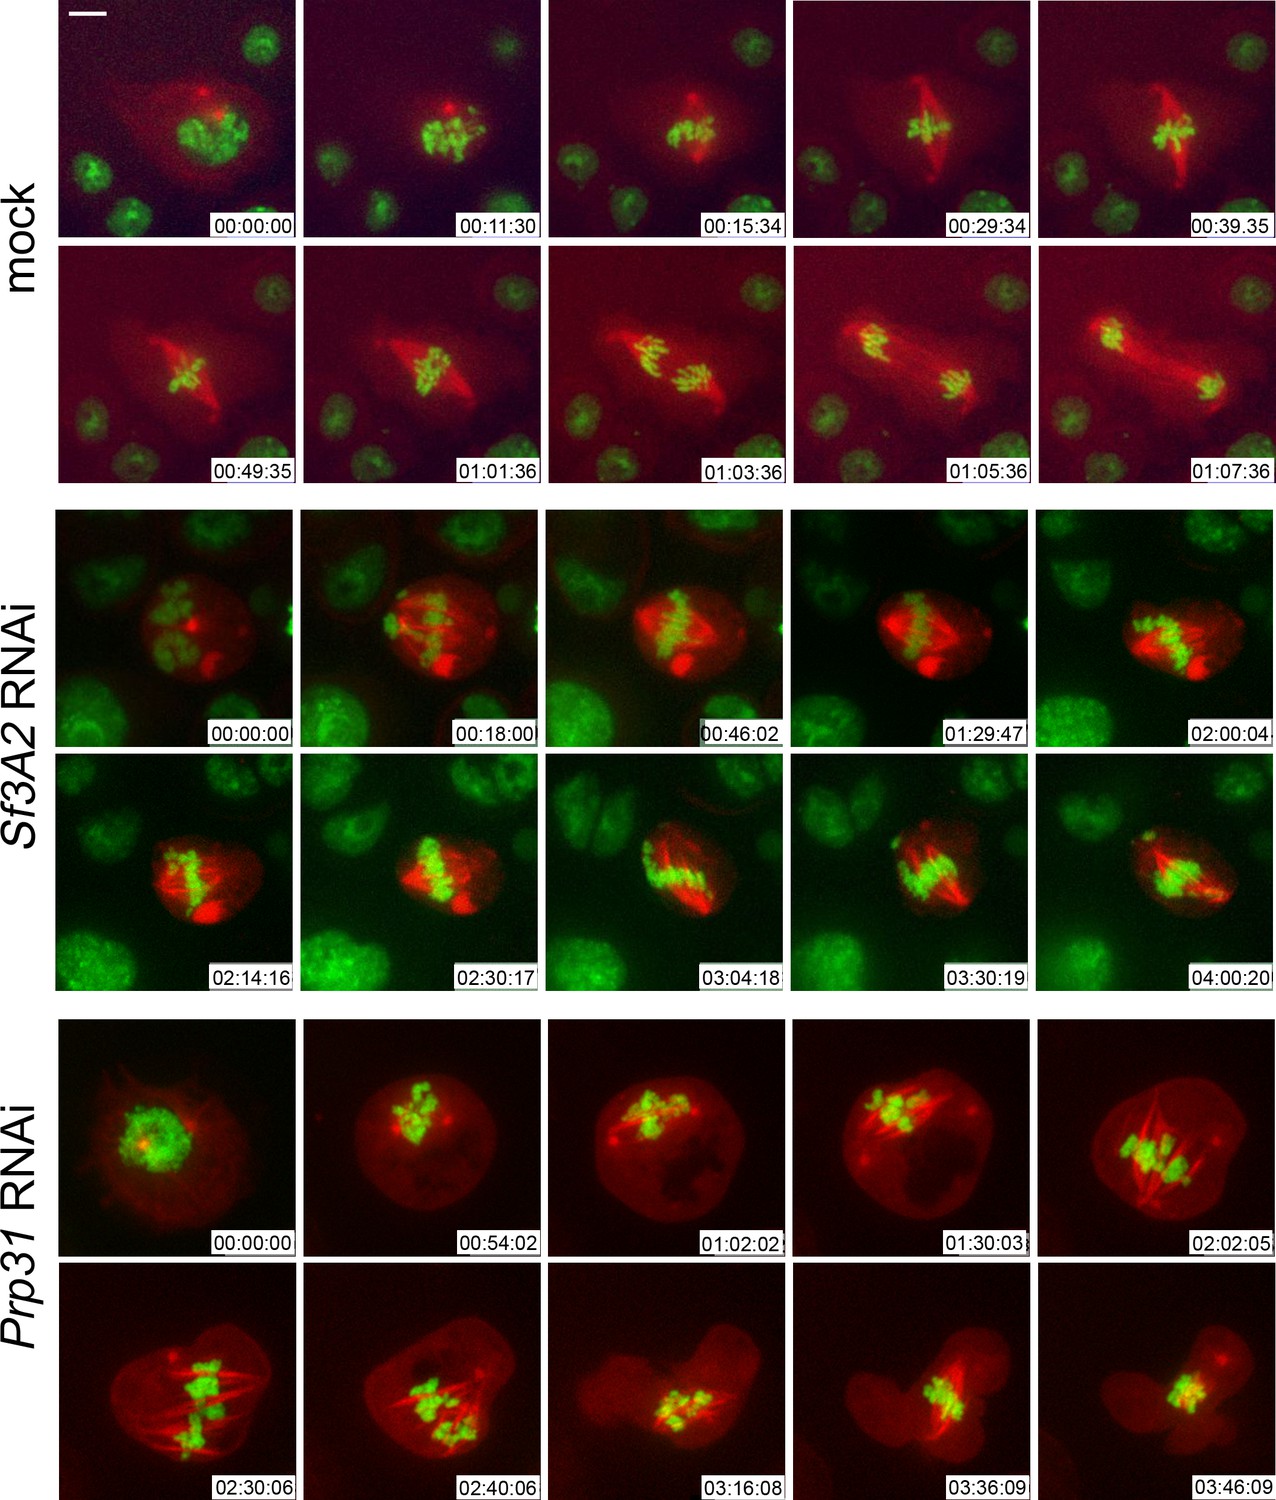
Live analysis shows that Sf3A2- and Prp31-depleted cells arrest in metaphase.
Stills from time-lapse videos of mitosis in mock-treated and RNAi S2 cells expressing histone-GFP (green) and cherry-tubulin (red). The numbers at the bottom of each frame indicate the time (h:min:s) elapsed from the beginning of imaging. See text for description of chromosome behavior. See also Videos 1–3. Scale bar, 5 μm.
Figure 3

RNAi against SfA31, Sf3A3, Prp3, Prp4, Prp6, Prp8, or hoip/CG3949 does not result in gross mitotic defects.
(A) RT PCR showing that RNAi against the indicated factor strongly reduces the corresponding transcript; r, rp49 used as internal control. (B) Mitotic indexes (MI) and frequencies of mitotic figures observed after RNAi against the indicated gene. Mono, monopolar; Meta, metaphases; Ana and Telo, anaphases and telophases; Reg, regular; Lag, lagging chromosomes between the ana-telophase nuclei. The control (Mock) is the same as that of Figure 1.
Figure 4 with 3 supplements
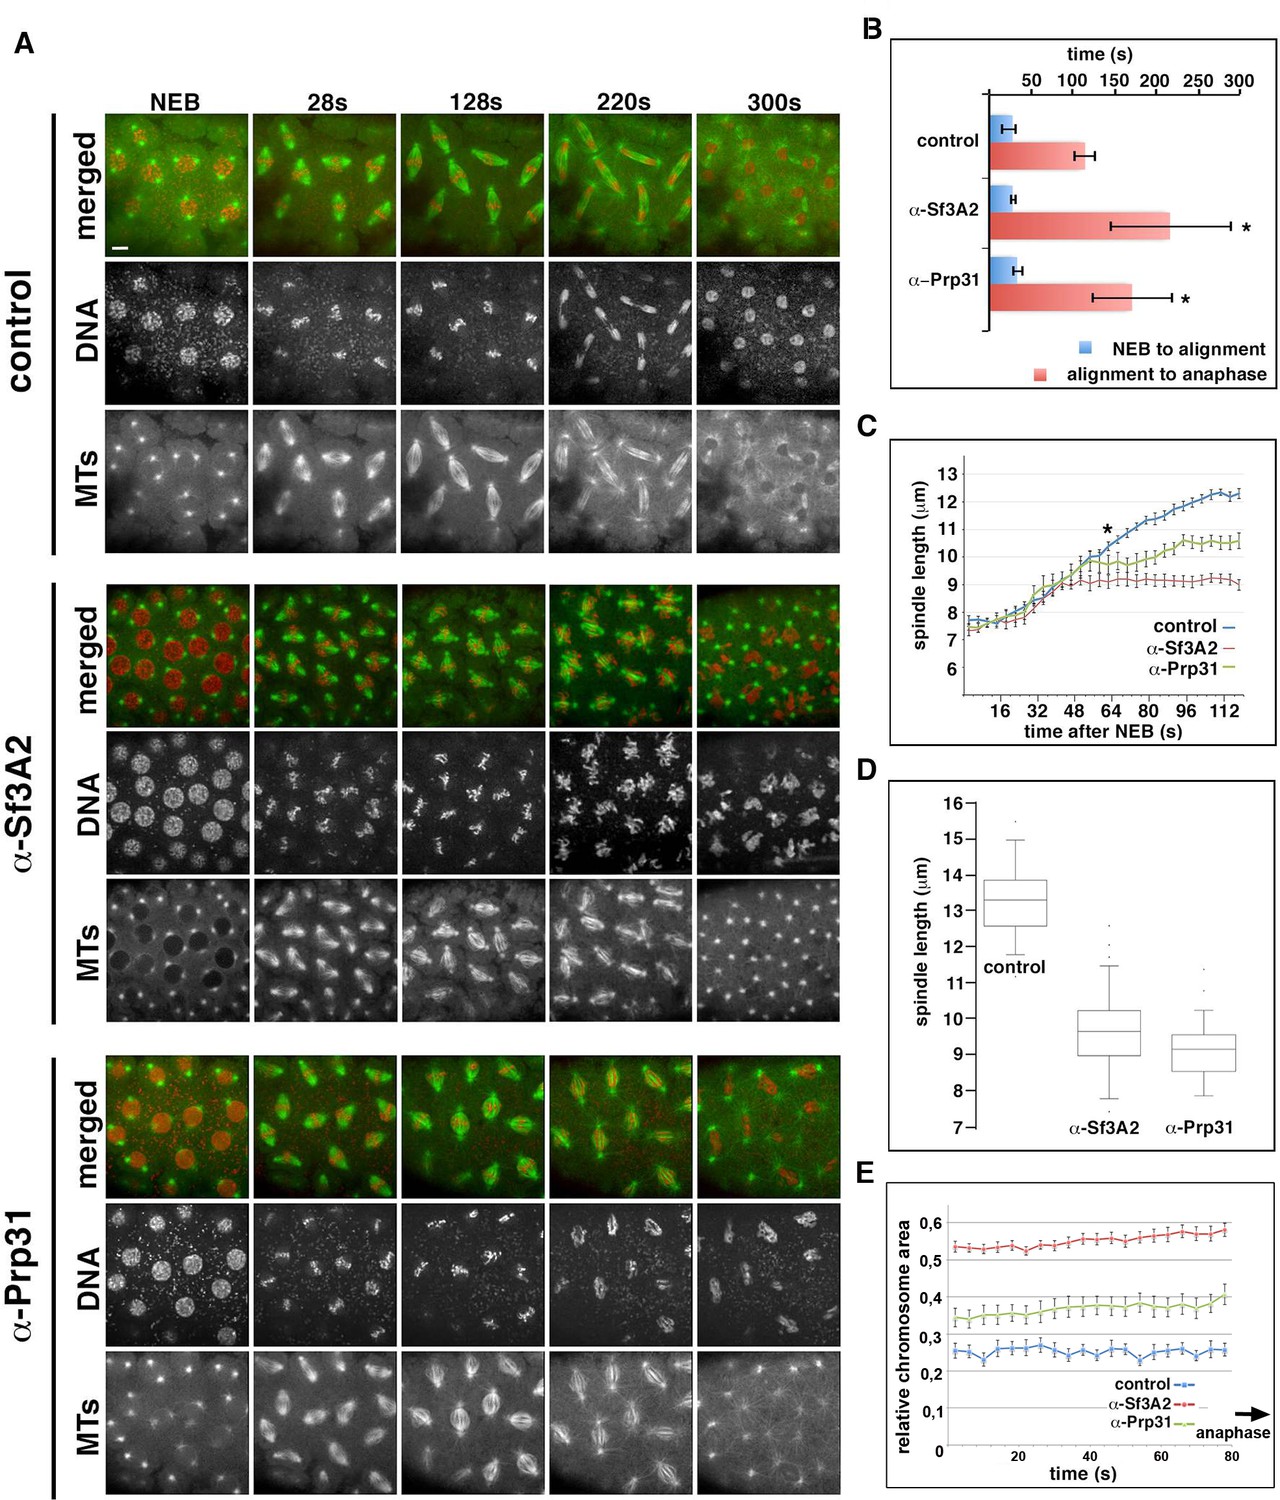
Acute inhibition of Sf3A2 and Prp31 causes mitotic delay, spindle instability and abortive chromosome segregation in Drosophila embryos.
(A) Stills from time-lapse movies of syncytial embryos expressing GFP-tubulin and histone-RFP injected with BSA (control), α-Sf3A2 or α-Prp31 antibodies. Scale bar, 5 μm. (B) Bar chart comparing mitotic timing between control injected and α-Sf3A2 or α-Prp31 injected embryos. The time from NEB to initial chromosome alignment is similar between conditions but the length of metaphase is significantly increased in both α-Sf3A2 and α-Prp31 injected embryos (*p=0.016 control: α-Sf3A2; p=0.029 control: α-Prp31; unpaired t-test, five embryos each condition); error bars, SD. (C) Spindle length over time in the control, α-Sf3A2 and α-Prp31 injected embryos. From 64 s following NEB onwards, the shorter length of spindles in anti-SF injected embryos becomes significant (*; unpaired t-test; eight spindles per embryo). Error bars, SEM. (D) Box and whisker plots showing the quartile ranges of mitotic spindle length ~20 s prior to anaphase onset. Error bars, SD. (E) Area occupied by the chromosomes during the last 80 s of filming before anaphase onset, relative to the area occupied in early prophase. The areas were measured using the ImageJ software; 15 metaphases analyzed for each condition; p<0.001 control: α-Sf3A2; p<0.001 control: α-Prp31; unpaired t-test). Error bars, SEM. See also Videos 4–6.
-
Figure 4—source data 1
Source data Figure 4B–E and Figure 4—figure supplement 2D and E.
- https://doi.org/10.7554/eLife.40325.017
Figure 4—figure supplement 1
Mitotic division in live Drosophila embryos injected with anti-Sf3A2 or anti-Prp31 antibodies during the late telophase of the previous cell cycle.
Selected frames from time-lapse videos of mitosis in syncytial Drosophila embryos expressing histone-RFP and tubulin-GFP, injected with anti-Sf3A2, anti-Prp31 antibodies or buffer only (control) during the late telophase of the previous cell cycle. Filming began when nuclei were in prophase; the numbers in the lower left corner of each frame indicate the time elapsed from the beginning of imaging (min.s). Note that these embryos display the same defects seen in embryos injected just before mitosis (Figure 4). Scale bar, 5 μm.
Figure 4—figure supplement 2
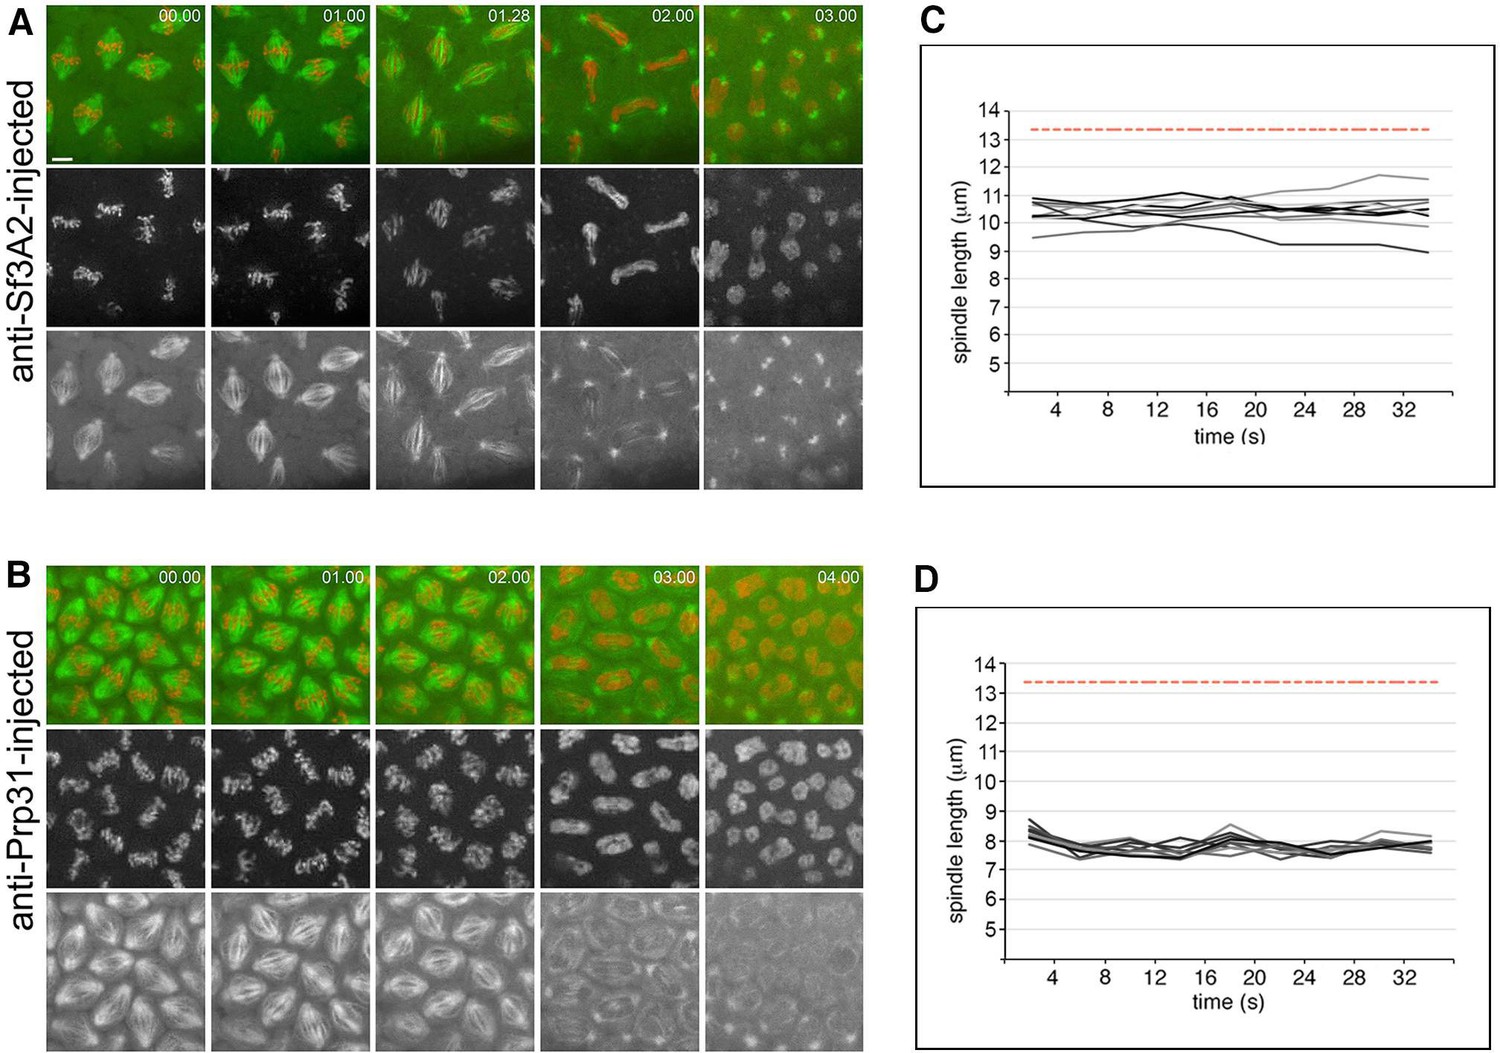
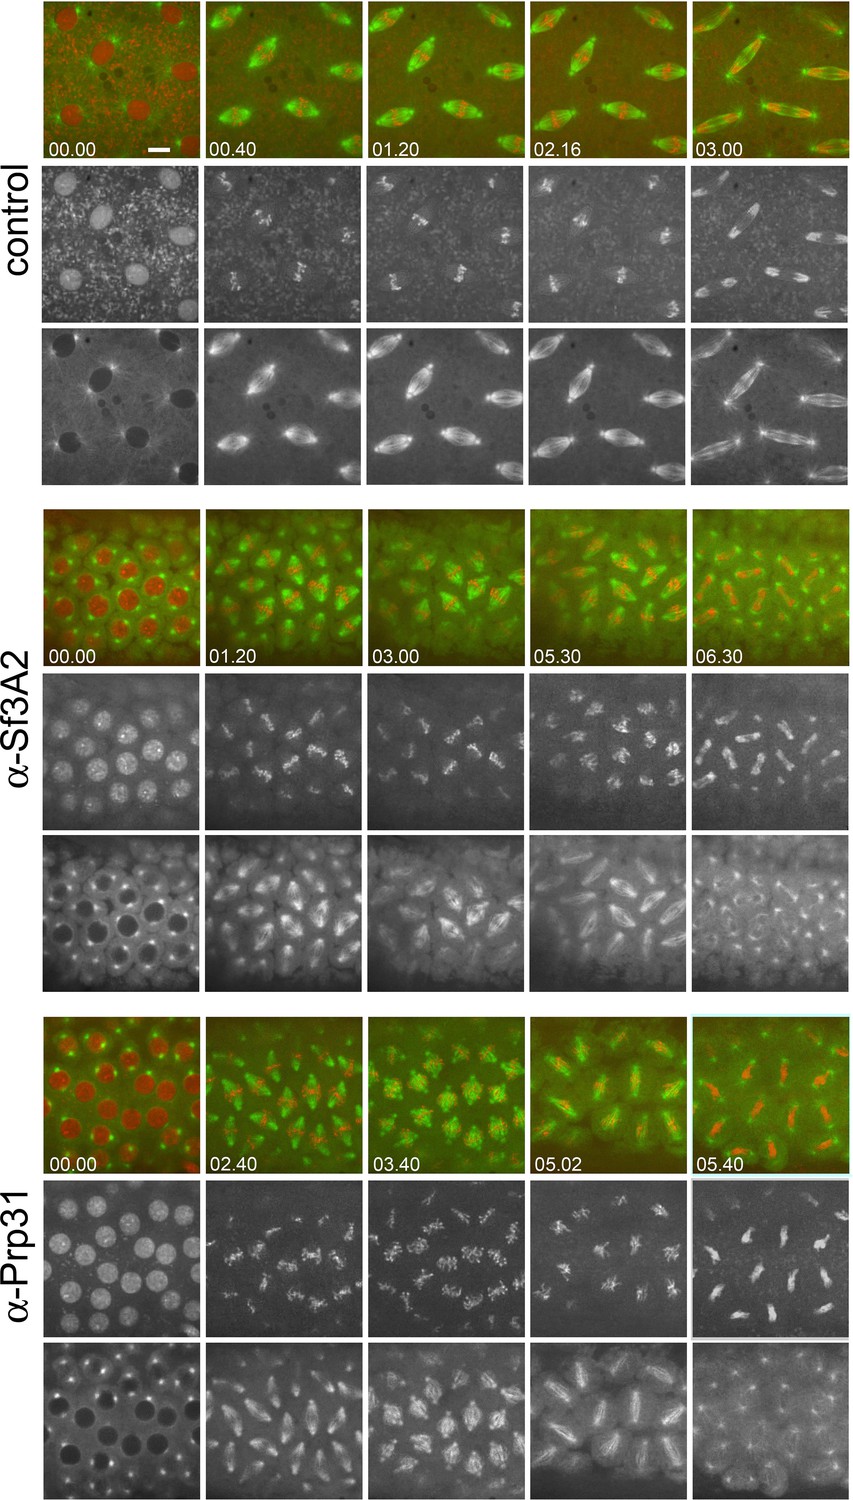
Failure of mitotic chromosome segregation in live Drosophila embryos injected with anti-Sf3A2 or anti-Prp31 antibodies during mitosis.
(A, B) Selected frames from time-lapse videos of mitosis in syncytial Drosophila embryos expressing histone-RFP and tubulin-GFP, injected with anti-Sf3A2 and anti-Prp31 antibodies. The numbers in the right upper corner of each frame indicate the time elapsed from the beginning of imaging (min.s). Note that filming starts after NEB when cells are already in metaphase and exhibit spindles shorter than those of wild-type embryos (compare with Figure 4A). The still images are from Videos 7 and 8. Scale bar, 5 μm. (C and D) Spindle length over time in the anti-Sf3A2 (C) and anti-Prp31 (D) injected embryos. 9 (C) and 8 (D) individual spindles were measured every 4 s for the first 32 s of the movie. A one-way ANOVA showed that there is no significant increase in spindle length over time, in any of the spindles within the injected embryo (p<0.01), demonstrating that the spindles have a steady-state length significantly shorter than that of control embryos. The dashed red line is the mean mature spindle length in a control embryo.
Figure 4—figure supplement 3
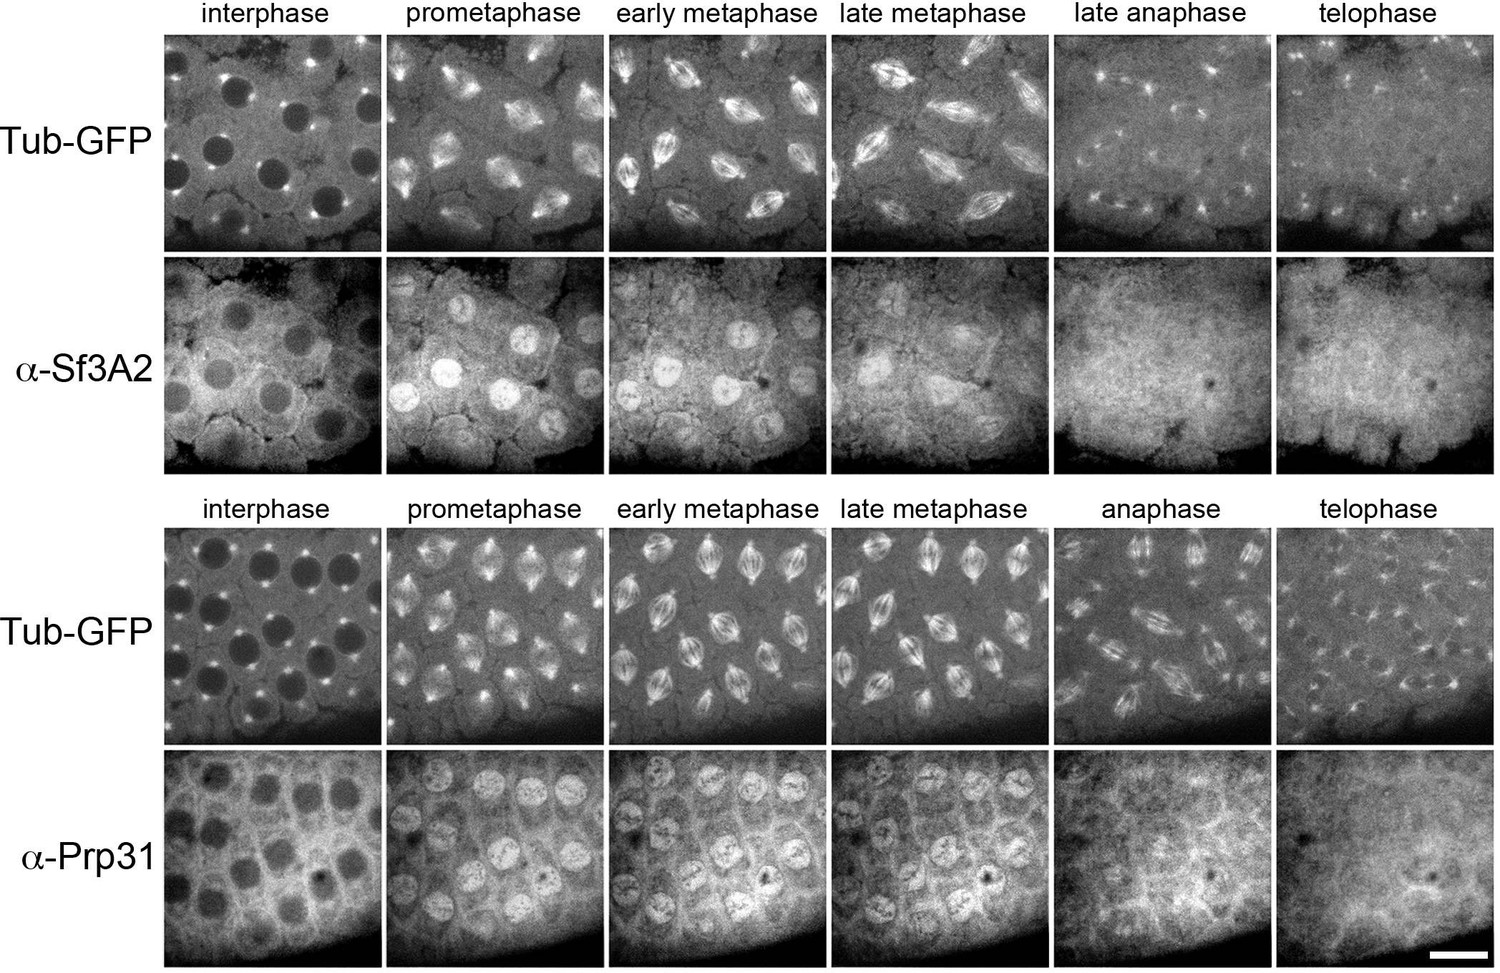
Dynamic localization of fluorescently-labeled anti-SF3A2 and anti-Prp31 antibodies during Drosophila syncytial divisions.
Cycle 11 or 12 embryos expressing α-tubulin-GFP were injected with ~0.5 mg/ml Dylight 550-labeled anti-SF3A2 or anti-Prp31 and imaged using spinning disc confocal microscopy. During interphase both antibodies appear to be excluded from nuclei. Following nuclear envelope fenestration in prometaphase, antibodies accumulate within the nuclear envelope that also includes most of the spindle, and remain there also in metaphase. During anaphase and telophase, the antibodies progressively diffuse. Scale bar, 10 μm.
Figure 5 with 2 supplements
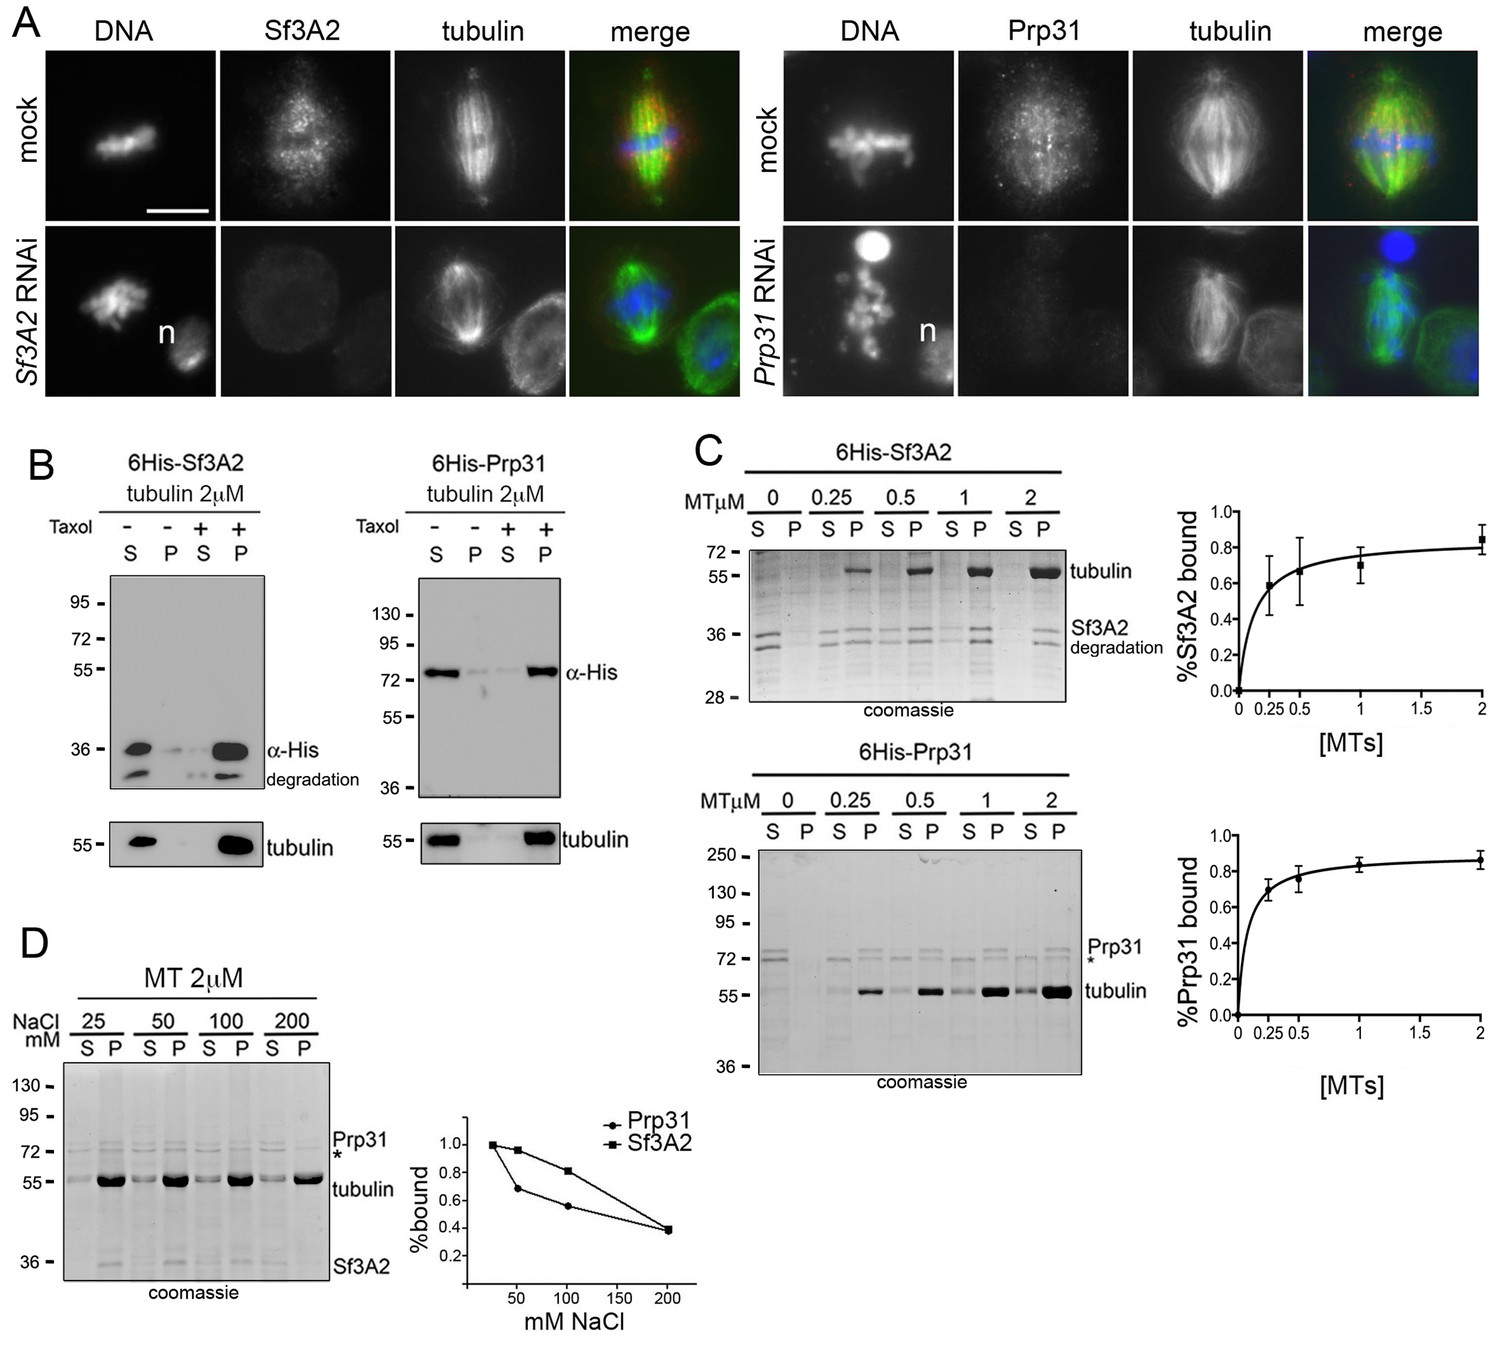
Sf3A2 and Prp31 associate with S2 cell spindle MTs.
(A) Mitotic figures observed in mock-treated control cells and in Sf3A2- and Prp31-depleted cells stained for DNA (blue), tubulin (green) and Sf3A2 or Prp31 (red). Sf3A2 and Prp31 associate with spindle MTs in S2 control cells; note that in Sf3A2 and Prp31 RNAi cells spindles are not stained. n, nucleus. Scale bar, 5 μm. (B) 6His-Sf3A2 and 6His-Prp31 co-sediment with 2 μM taxol-stabilized MTs (2 μM is the concentration of tubulin dimers in MT polymers) but remain in the supernatant in the presence of unpolymerized tubulin. S, supernatant; P, pellet. Samples were subjected to Western blotting. Tubulin is shown as a control. (C) Cosedimentation of 6His-Sf3A2 and 6His-Prp31 with taxol-stabilized MTs at the indicated concentrations in the presence of 25 mM NaCl. The input in the Sf3A2 experiment shows an additional band that is roughly 2 kDa smaller than full-length, 6X-His tagged Sf3A2. This smaller band appears only inconsistently in various preparations and is likely a degradation product because its behavior in these assays is identical to that of the full-length protein. * Unspecific band. Samples were subjected to SDS-PAGE followed by Coomassie staining. Cosedimentation of each SF with MTs was quantified and plotted using data from three independent experiments. Each point in MT-binding curves represents the percentage of MT-bound 6His-Sf3A2 or 6His-Prp31 (intensity of the pellet band/intensity of the pellet plus supernatant bands). Error bars, SD. (D) Cosedimentation of SFs with 2 μM taxol-stabilized MTs in the presence of increasing concentrations of NaCl. * Unspecific band. Samples were subjected to SDS-PAGE followed by Coomassie staining. The SF-MT-binding curves are from two independent experiments.
-
Figure 5—source data 1
Source data for Figure 5.
- https://doi.org/10.7554/eLife.40325.026
Figure 5—figure supplement 1
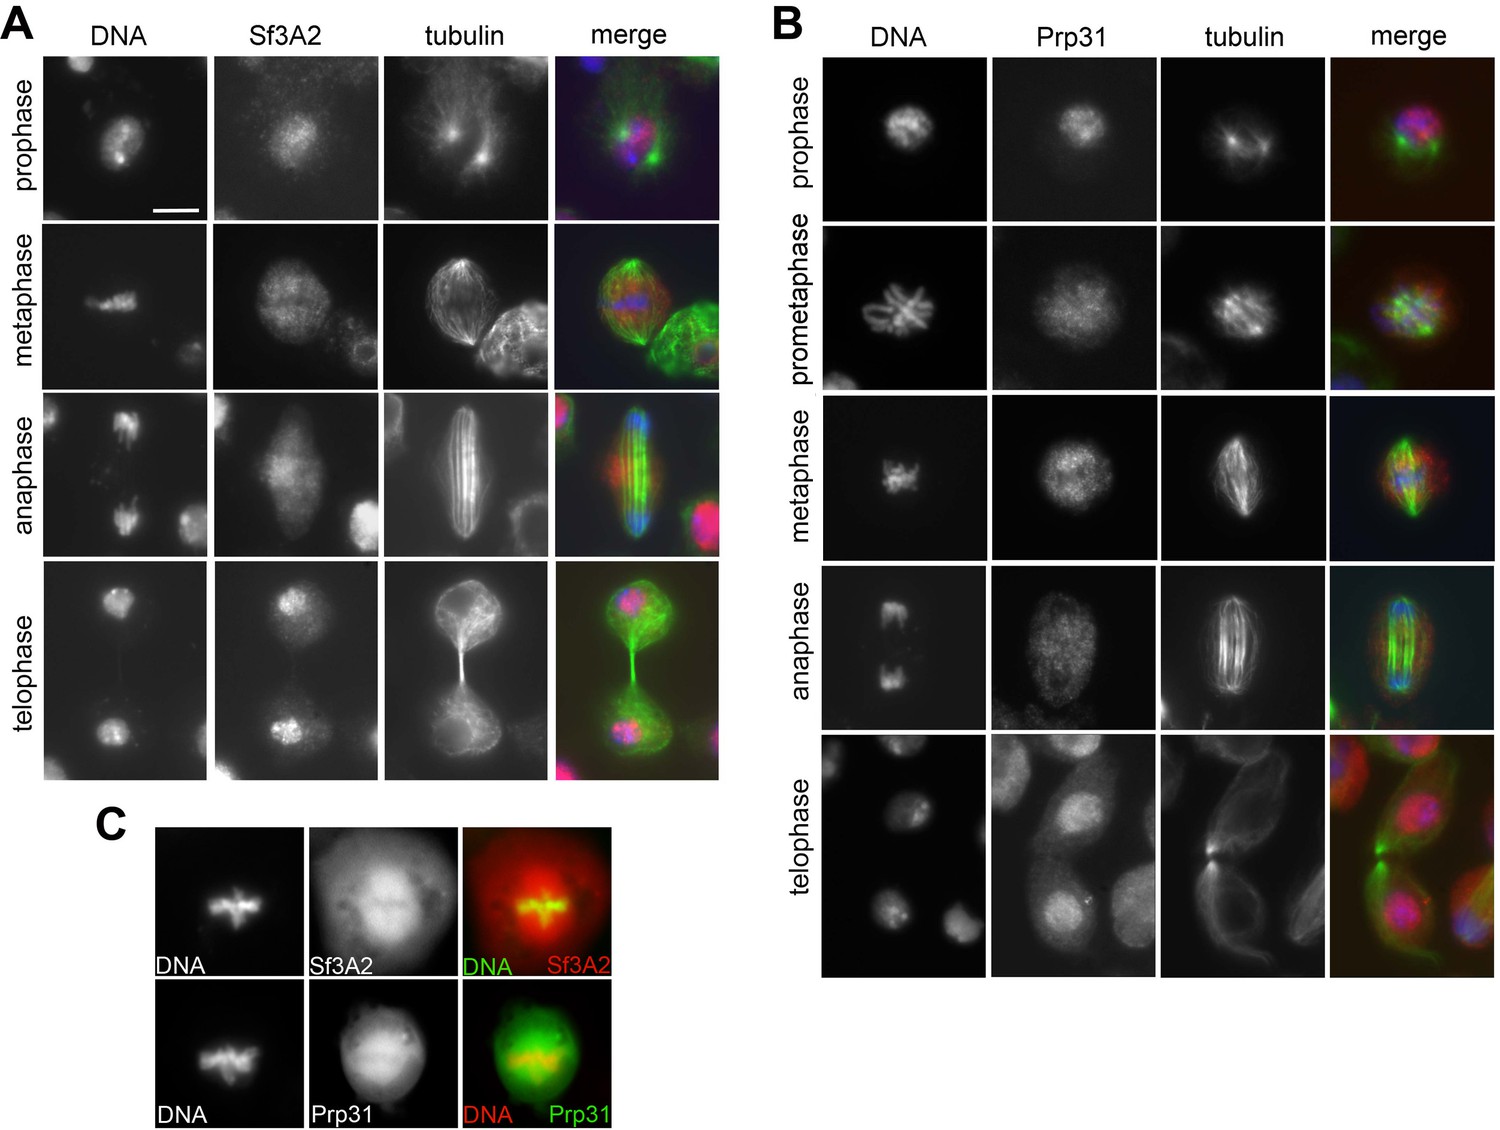
Localization of Sf3A2 and Prp31 during mitosis of S2 cells.
(A) Localization of Sf3A2 during mitosis of S2 cells. Note the nuclear localization in prophase and late telophase cells. (Sf3A2 is red, tubulin green and DNA blue). Scale bar, 5 μm. (B) Localization of Prp31 during mitosis of S2 cells (Prp31 is red, tubulin green and DNA blue) (C) Localization of Sf3A2-RFP and Prp31-GFP in metaphase spindles.
Figure 5—figure supplement 2
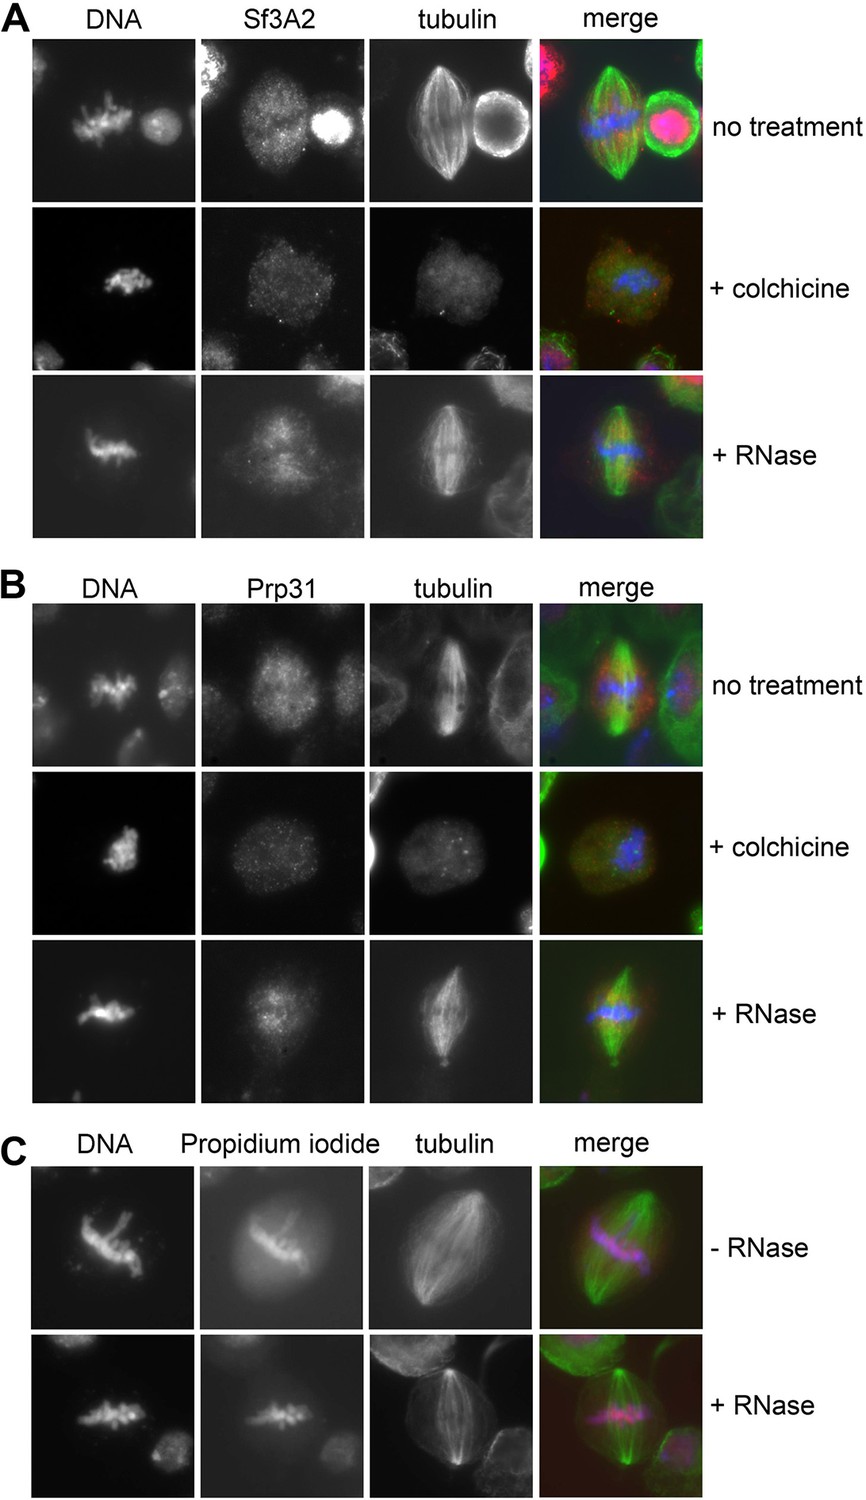
Localization of Sf3A2 and Prp31 on metaphase spindle is MT-dependent and RNA-independent.
(A) Localization of Sf3A2 (red) in untreated, colchicine-treated (30 min with 100 μM colchicine) and RNAse-treated (post fixation treatment with 0.1 mg/ml RNAse) cells stained for tubulin (green) and DNA (blue). Note the absence of Sf3A2 signals around the chromosomes of colchicine-treated cells and the persistence of a spindle-associated signal in RNAse-treated cells. (B) Localization of Prp31 (red) in untreated, colchicine-treated (30 min with 100 μM colchicine) and RNAse-treated (post fixation treatment with 0,1 mg/ml RNAse) cells stained for tubulin (green) and DNA (blue). Note that Prp31 localization is very similar to that of Sf3A2 shown in (A). (C) Test for RNAse efficiency showing that in treated cells the diffuse propidium iodide staining of RNA (red) is no longer detectable.
Figure 6
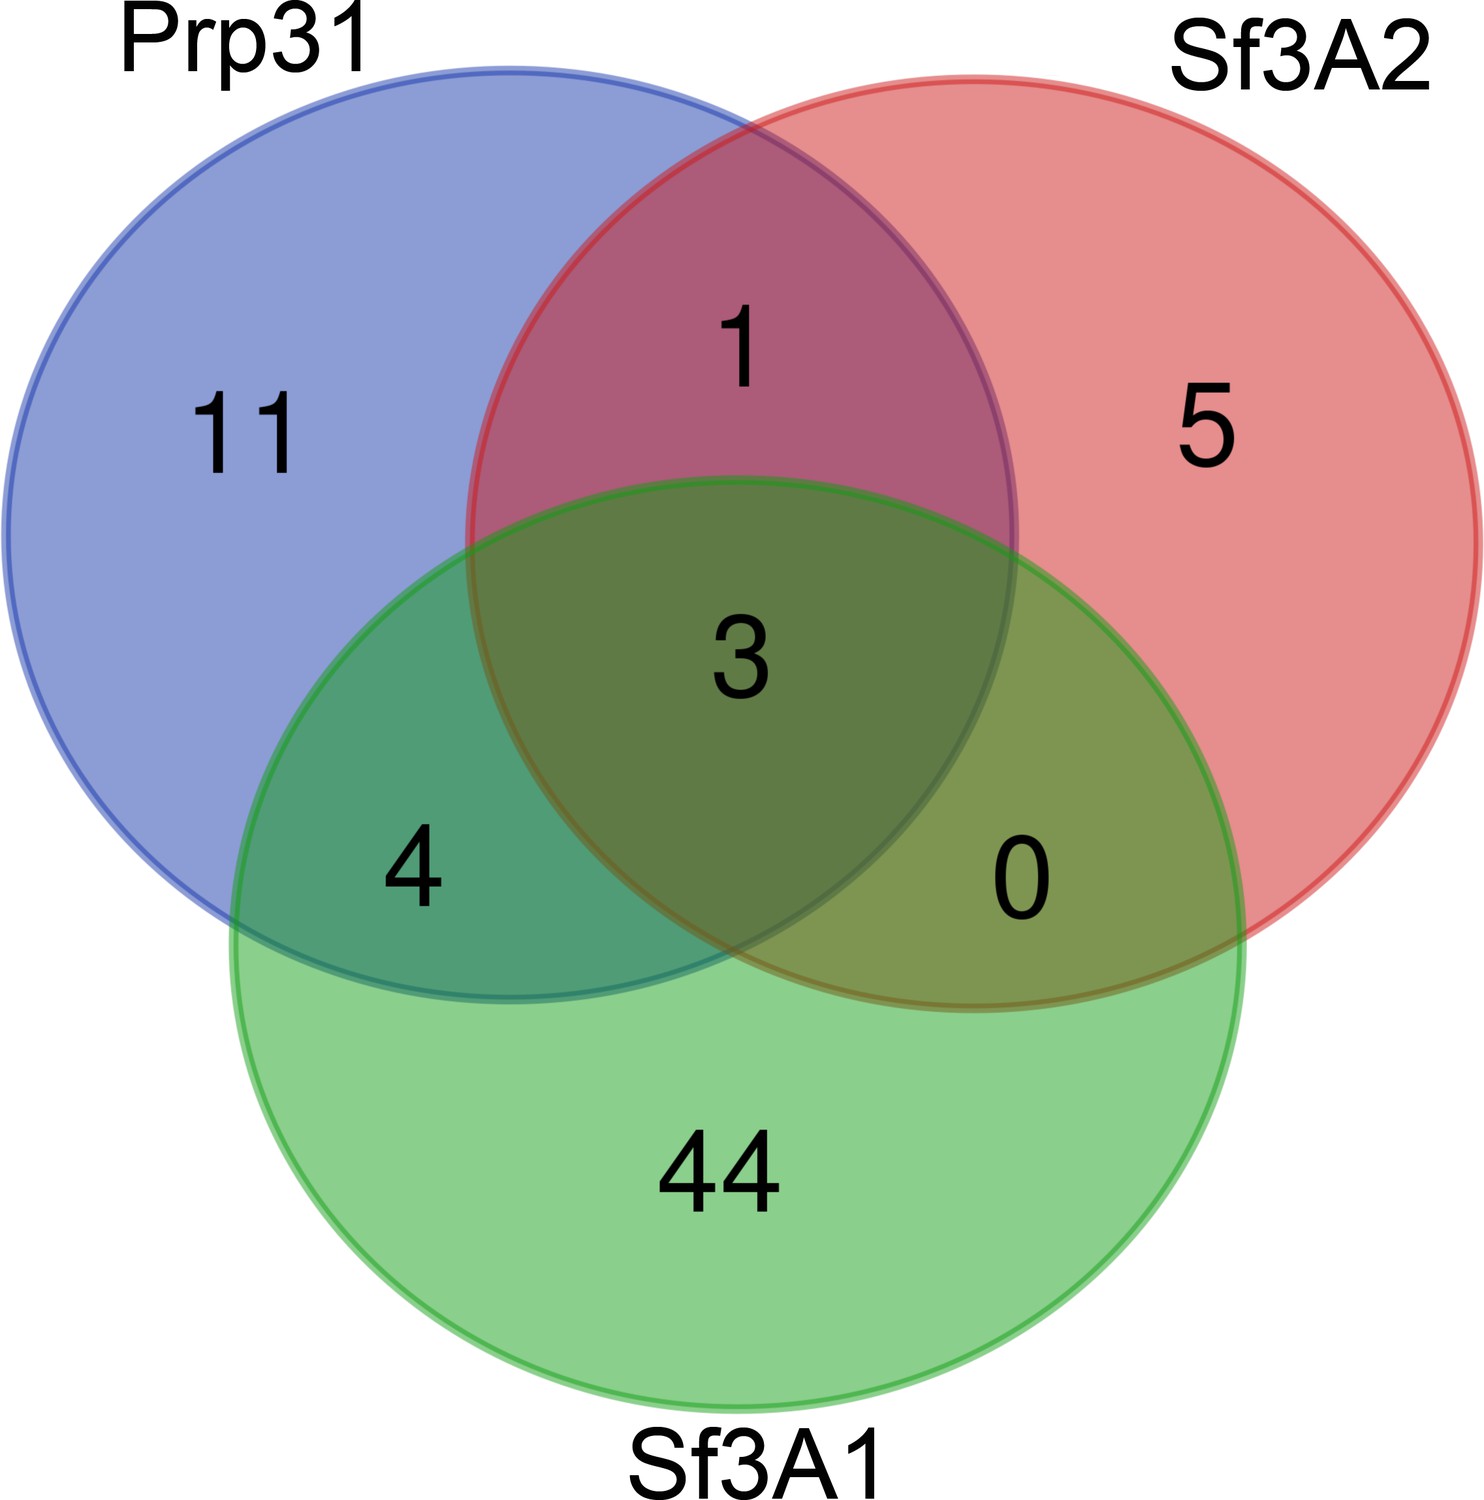
Venn diagram showing the overlap of mitotic proteins that are significantly reduced in Sf3A2, Prp31 and Sf3A1 RNAi cells.
Proteins whose abundance was significantly reduced in Prp31, Sf3A2 or Sf3A1 RNAi cells, and possessing Gene Ontologies (GOs) of mitotic cell cycle, cell division or chromosome segregation, were visualized using the Venn diagram software. Only a single protein, HUS1-like, is shared between Prp31 and Sf3A2, but not Sf3A1.
Figure 7 with 3 supplements
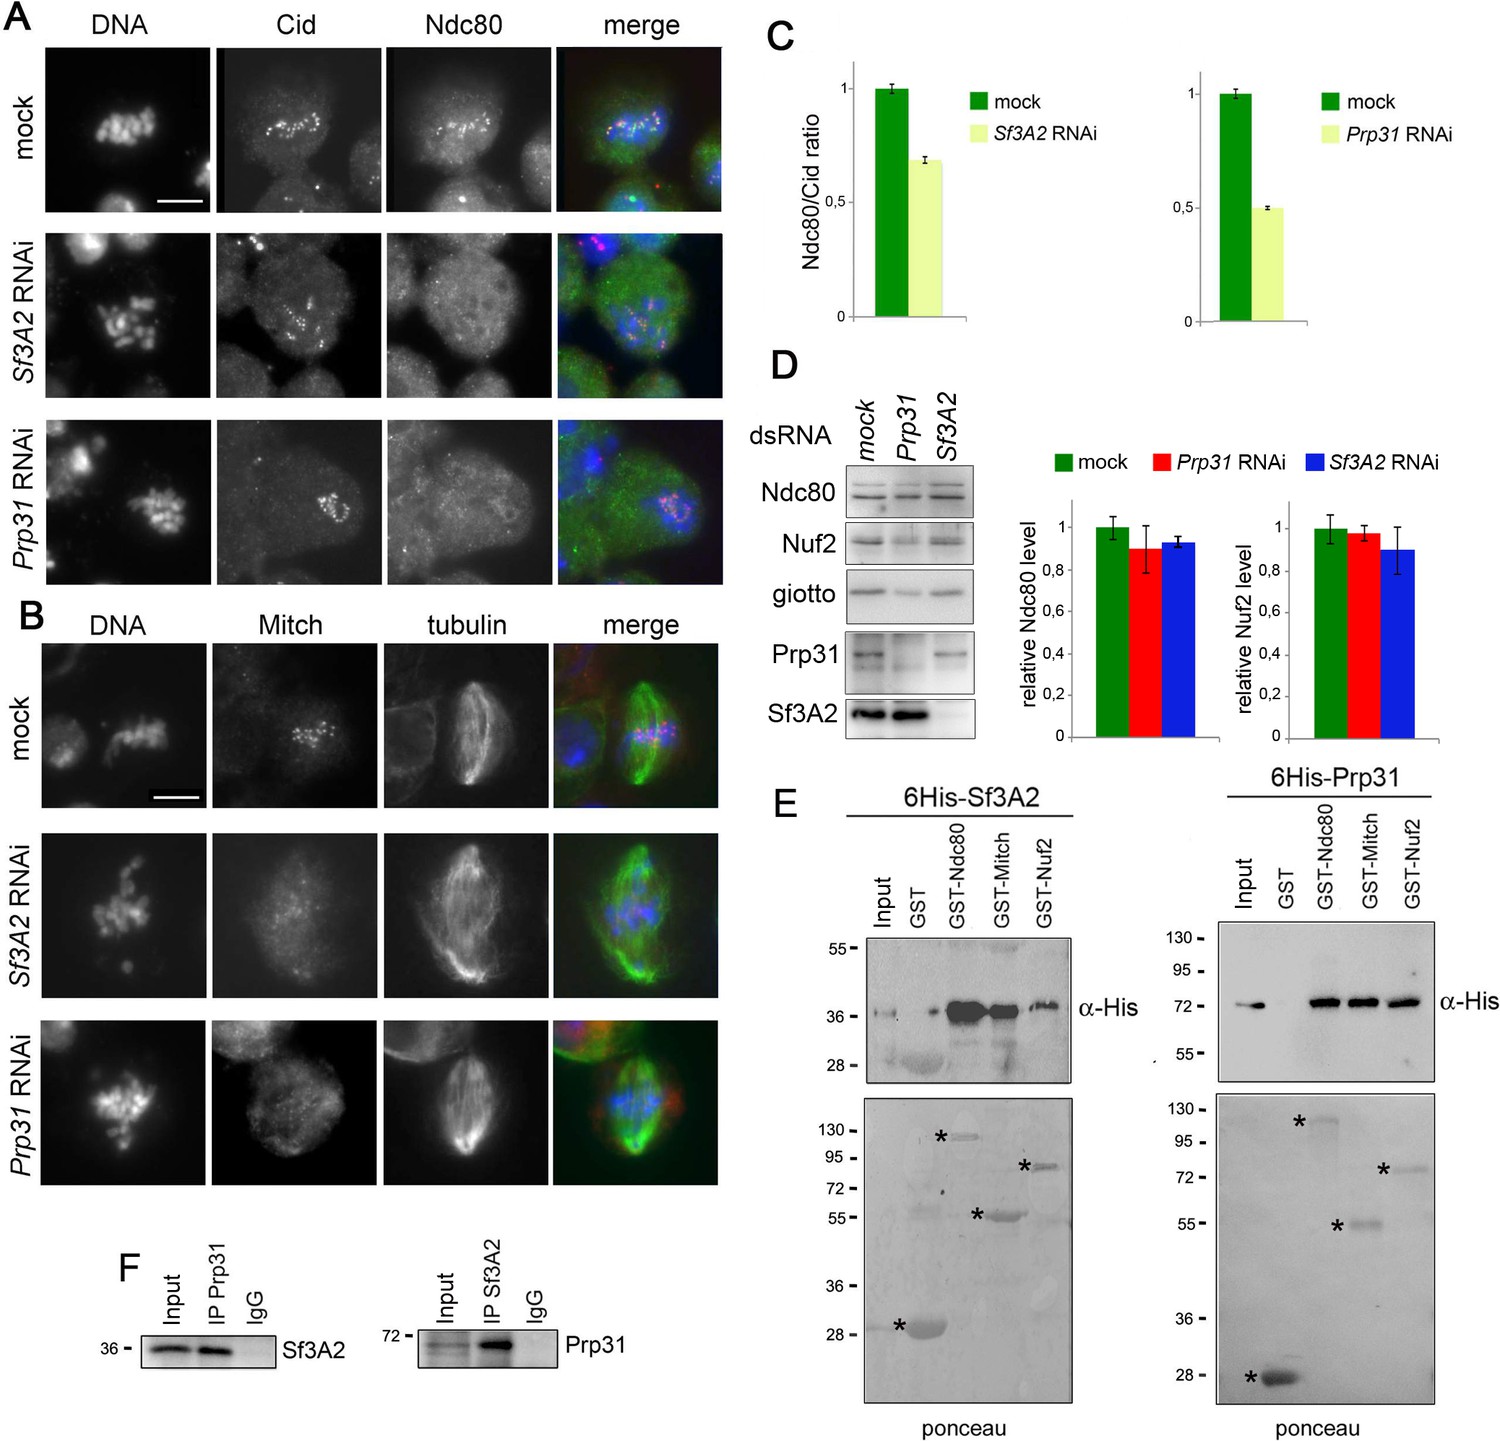
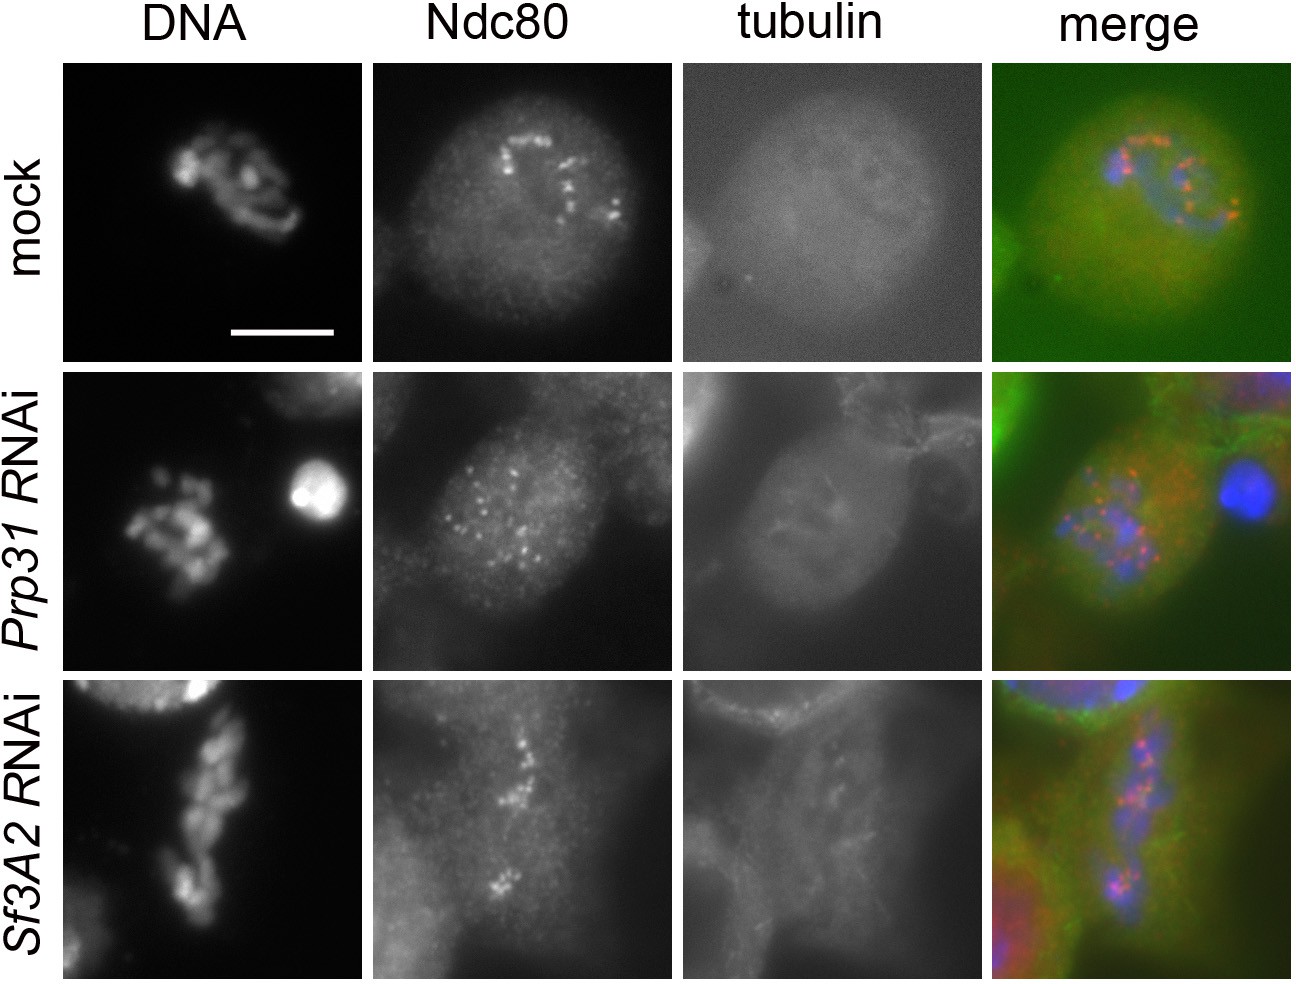
Sf3A2 and Prp31 bind Ndc80 and Spc25/Mitch and are required for their localization at kinetochores.
(A) Metaphase and prometaphase-like figures stained for DNA (blue), Cid/Cenp-A (red) and Ndc80 (green) showing that RNAi against Sf3A2 or Prp31 reduces Ndc80 accumulation at kinetochores. Scale bar, 5 μm. (B) Metaphase and prometaphase-like figures stained for DNA (blue), Mitch (red) and tubulin (green) showing that RNAi against Sf3A2 or Prp31 reduces Spc25/Mitch accumulation at kinetochores. Scale bar, 5 μm. (C) Quantification of Ndc80 kinetochore-associated fluorescence relative to the Cid fluorescence in Sf3A2 and Prp31 RNAi cells. The relative fluorescence was calculated by measuring the fluorescence (minus the background) of Ndc80/Cid signals of at least 20 cells, using the ImageJ software. Error bars, SEM. (D) Western blotting analysis showing that RNAi-mediated depletion of either Sf3A2 or Prp31 does not significantly affect the Ndc80 and Nuf2 amount. Giotto (a Drosophila Phosphatidylinositol transfer protein (Giansanti et al., 2006)) is used as a loading control. Quantification of the Ndc80 and Nuf2 levels is from three independent experiments. Error bars, SEM. (E) GST-Ndc80, GST-Mitch and GST-Nuf2 precipitate bacterially expressed and purified 6His-Sf3A2 (5% input) and 6His-Prp31 (10% input), which are not pulled down by GST alone. Asterisks indicate GST and GST-tagged kinetochore proteins. (F) Reciprocal Co-IPs showing that Sf3A2 and Prp31 interact in vivo.
-
Figure 7—source data 1
Source data for Figure 7C and D.
- https://doi.org/10.7554/eLife.40325.033
Figure 7—figure supplement 1
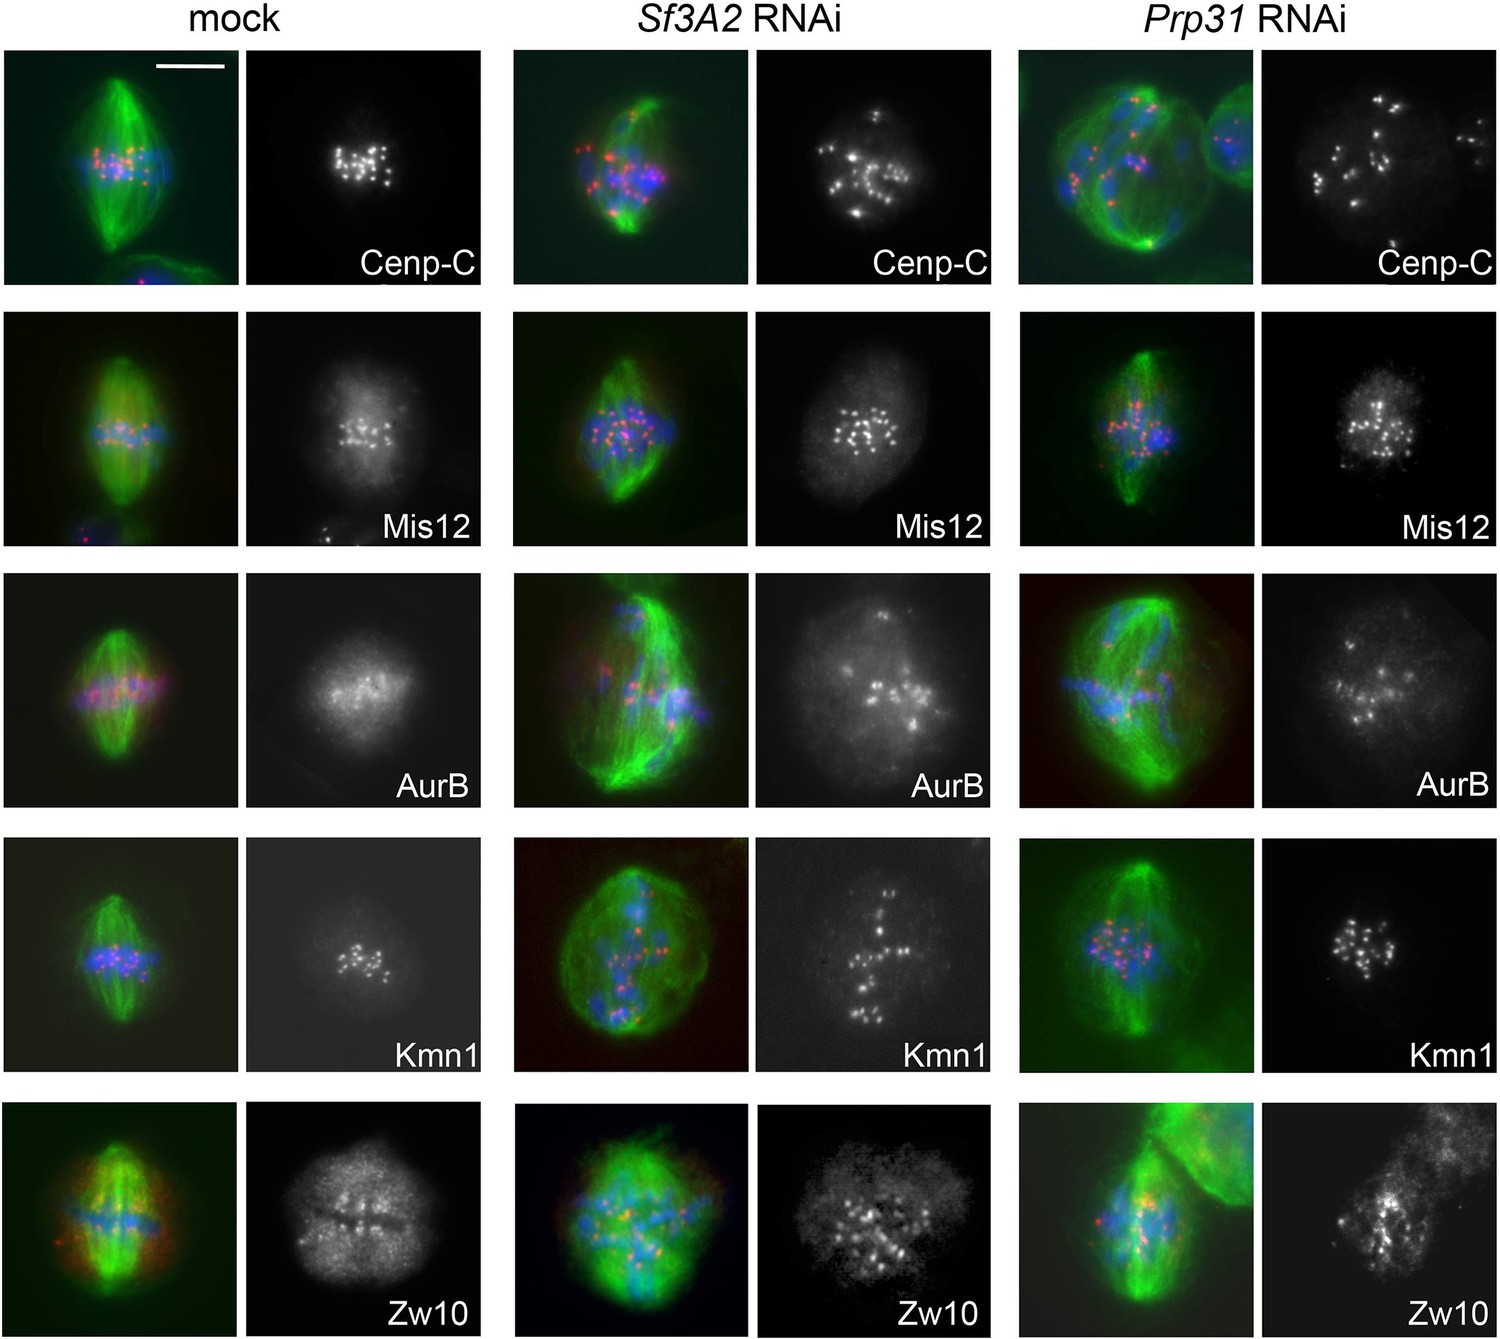
Cenp-C, Mis12, Aurora B, Kmn1 and Zw10 localize normally in Sf3A2 and Prp31 RNAi cells.
S2 cell metaphase and prometaphase-like figures were stained for DNA (blue) tubulin (green) and the indicated kinetochore component (red). Scale bar, 5 μm.
Figure 7—figure supplement 2
Colchicine-treated cells (for 3 hr) stained for DNA (blue), Ndc80 (red) and tubulin (green) showing that RNAi against Sf3A2 or Prp31 does not affect Ndc80 accumulation at kinetochores.
Scale bar, 5 μm.
Figure 7—figure supplement 3
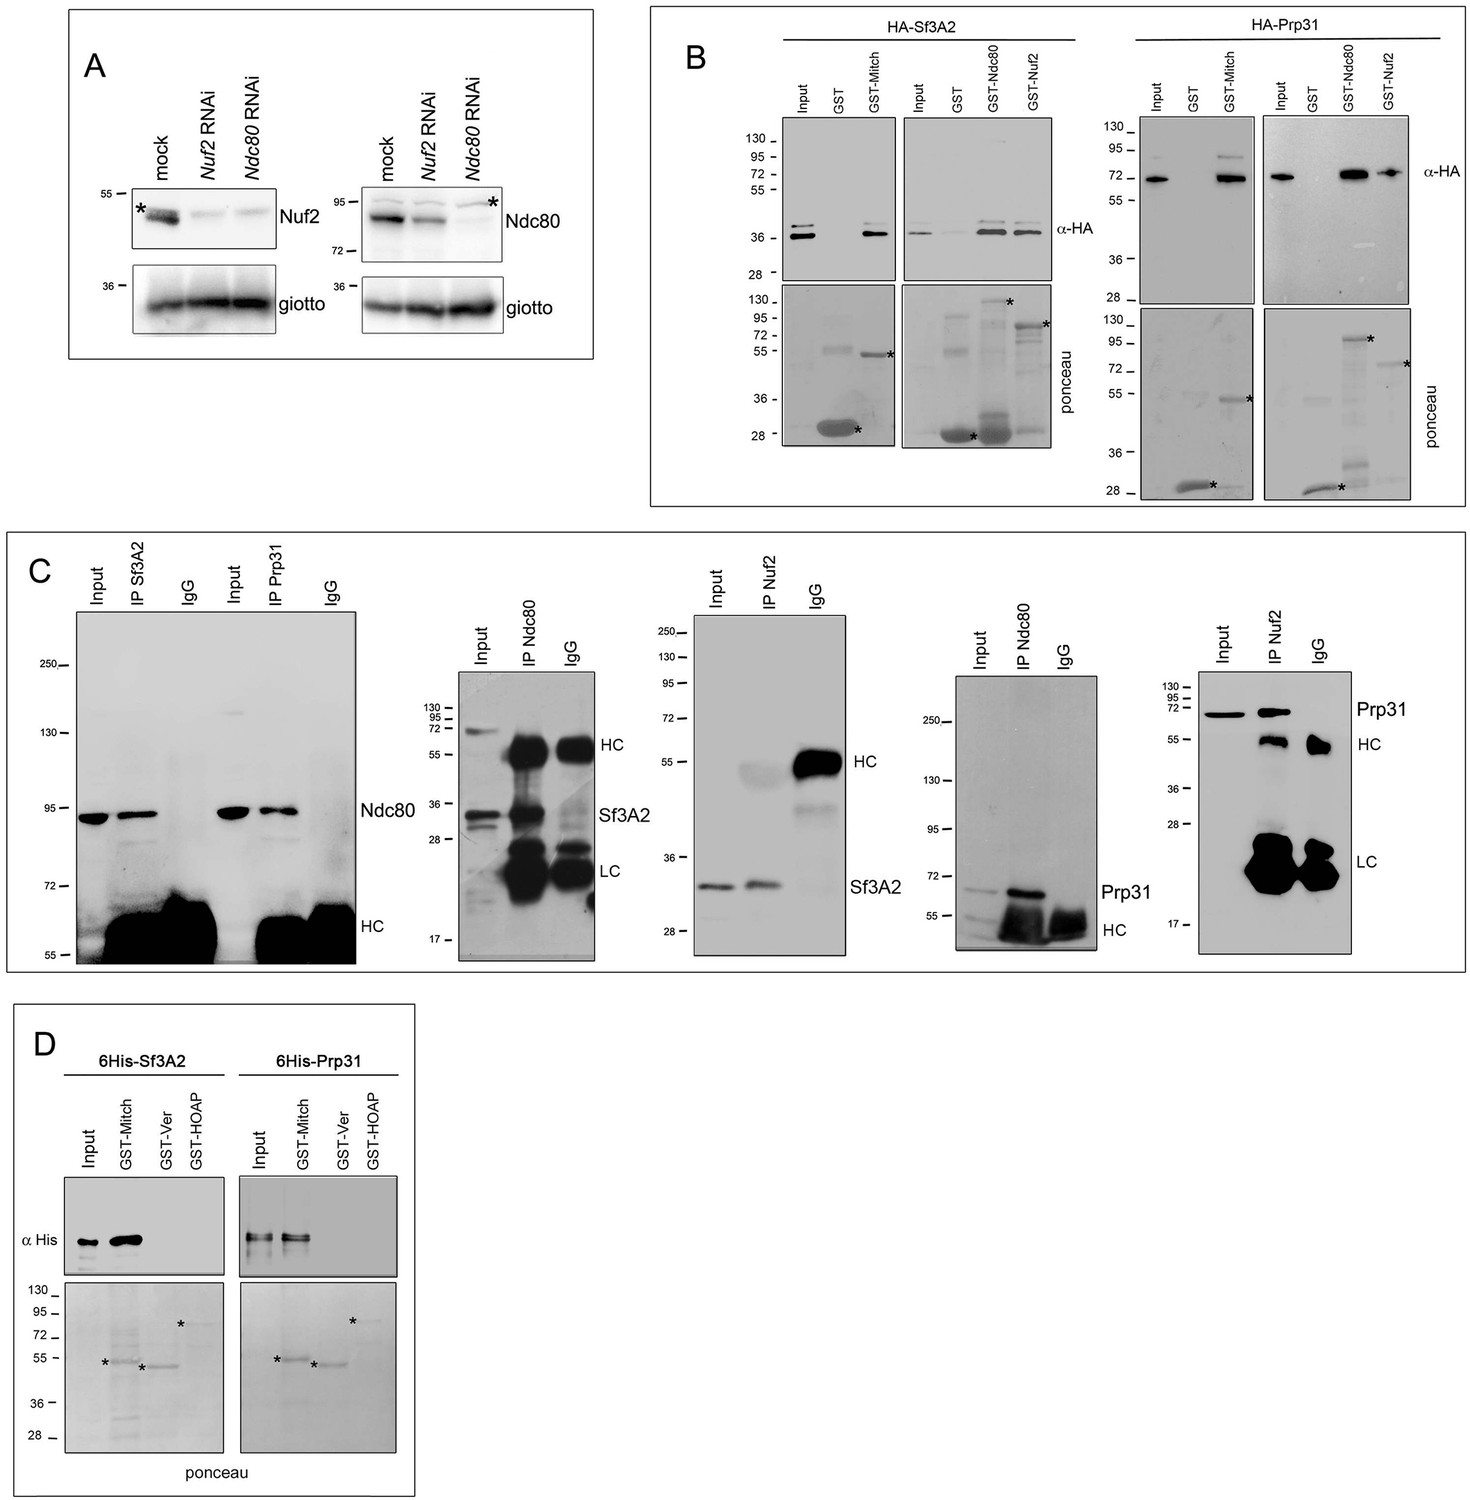
Biochemical relationships between Ndc80, Nuf2, Sf3A2 and Prp31.
(A) Western blotting showing that RNAi against Ndc80 leads to a strong Nuf2 reduction, while RNAi against Nuf2 slightly reduces the Ndc80 level. Asterisks indicate non-specific bands. Giotto is used as loading control. (B) GST pulldown analysis showing that GST-Ndc80, GST-Mitch and GST-Nuf2 precipitate both 3HA-Sf3A2 (5% input) and 3HA-Prp31 (2% input) from extracts of S2 cells expressing these tagged proteins. Asterisks indicate GST and GST-tagged kinetochore proteins. (C) Reciprocal Co-IPs showing that antibodies against Sf3A2 or Prp31 precipitate Ndc80, and antibodies against Ndc80 or Nuf2 precipitate Sf3A2 and Prp31. LC and HC are the IgG light and heavy chains. (D) GST pulldowns with bacterially purified proteins show that 6His-Sf3A2 and 6His-Prp31 do not bind the telomeric proteins GST-HOAP and GST-Ver (Raffa et al., 2011) used as a control for a possible unspecific binding activity of the SFs. Asterisks indicate GST and GST-tagged telomere proteins.
Figure 8
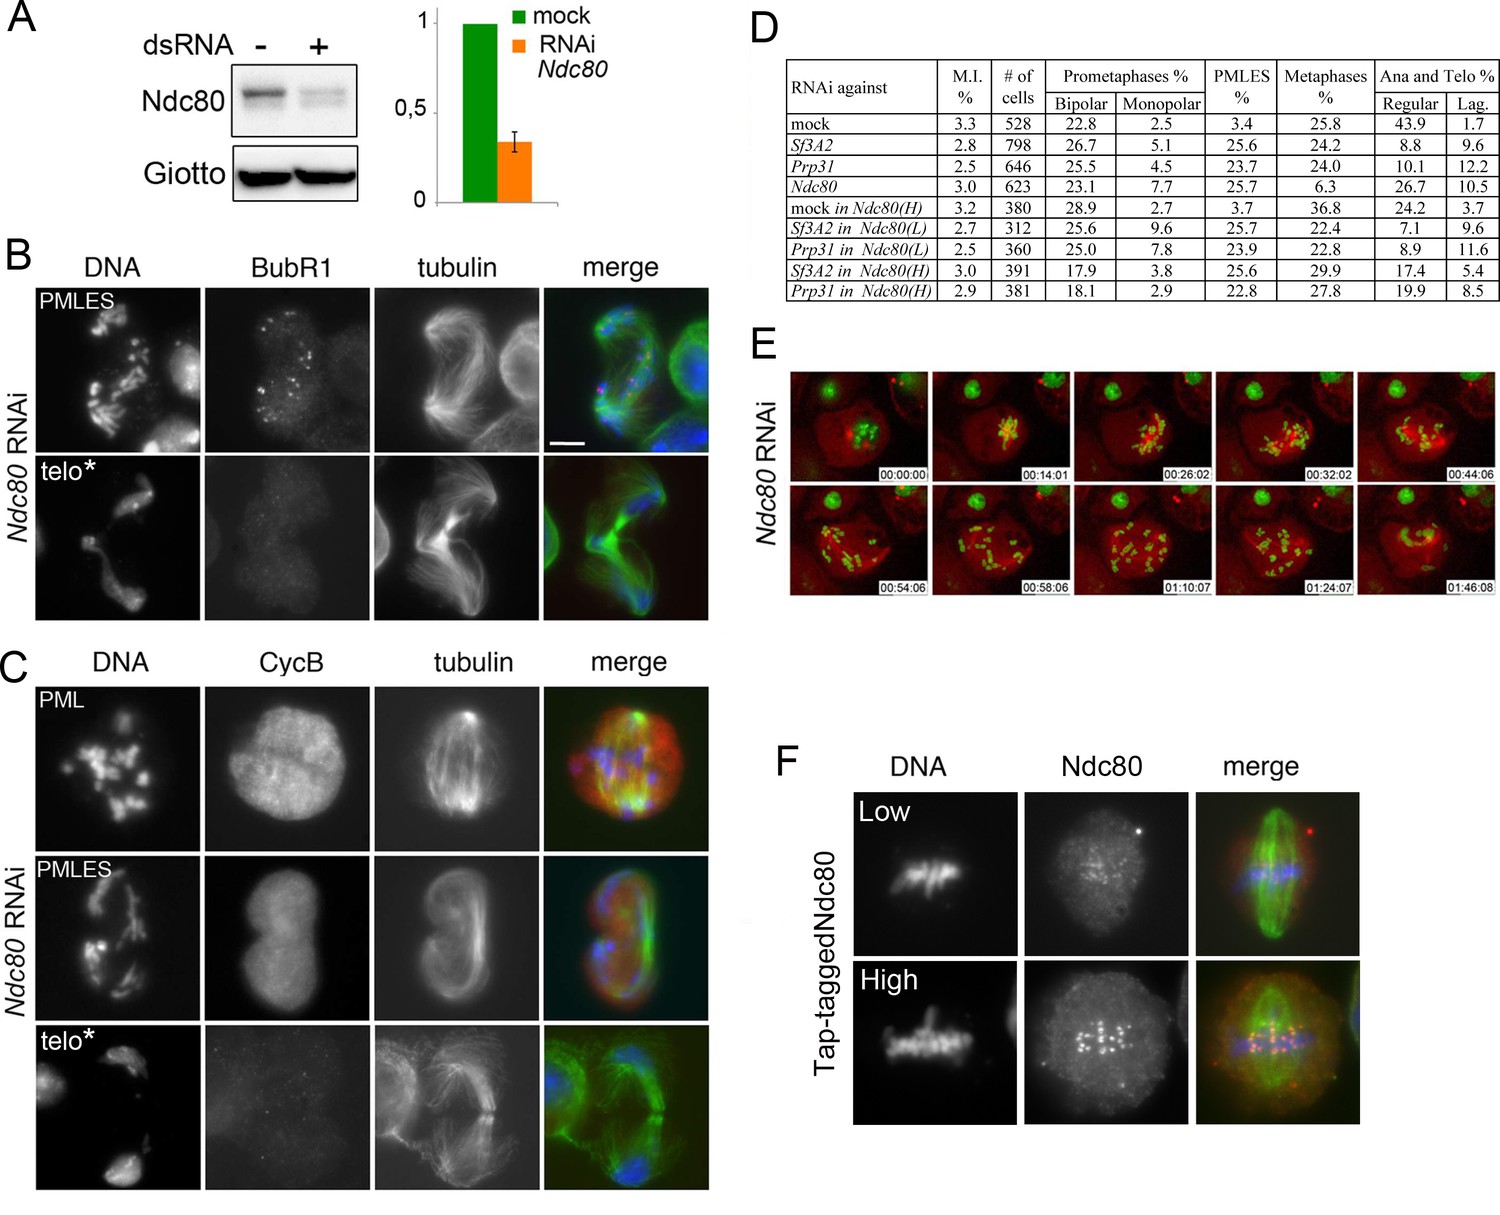
Phenotype of Ndc80-depleted cells.
(A) Western blots of S2 cell extracts and quantitation of relative band intensities showing that RNAi against Ndc80 strongly reduces the level of this protein. Giotto is a loading control. (B and C) Mitotic figures observed in Ndc80-depleted cells stained for DNA (blue), tubulin (green), BubR1 and Cyclin B (red). PML, prometaphase-like; PMLES, prometaphase-like cells with elongated spindles; telo*, telophase-like figures with decondensed chromosomes that might represent stages subsequent to PMLES. Note that PMLES exhibit BubR1-stained kinetochores and a high level of Cyclin B, whereas telo* figures no longer exhibit BubR1 and Cyclin B signals. See text for detailed explanation. Scale bars, 5 μm. (D) Mitotic indexes (M.I.) and frequencies of mitotic figures observed after RNAi against Sf3A2, Prp31 or Ndc80. Where indicated, RNAi against Sf3A2 or Prp31 was performed in cells that express Tap-tagged Ndc80 cDNA under the control of the copper-inducible Mtn promoter. Ndc80 (L) and Ndc80 (H) indicate low and high Ndc80-Tap expression. Lag, lagging chromosomes between the ana-telophase nuclei. Data on mock-treated control cells and SF-depleted cells are the same as those of Figure 1D. (E) Stills from time-lapse videos of mitosis in mock-treated and Ndc80 RNAi cells expressing histone-GFP and cherry-tubulin. The numbers at the bottom of each frame indicate the time elapsed from the beginning of imaging (h:min:s) See text for description of chromosome behavior. See also Videos 1 and 9. (F) Examples of cells expressing Tap-tagged Ndc80 induced by 20 mM (low) and 100 mM (high) copper sulfate. Note that that Tap-tagged Ndc80 accumulates normally at kinetochores.
-
Figure 8—source data 1
Source data for Figure 8.
- https://doi.org/10.7554/eLife.40325.035
Figure 9 with 1 supplement
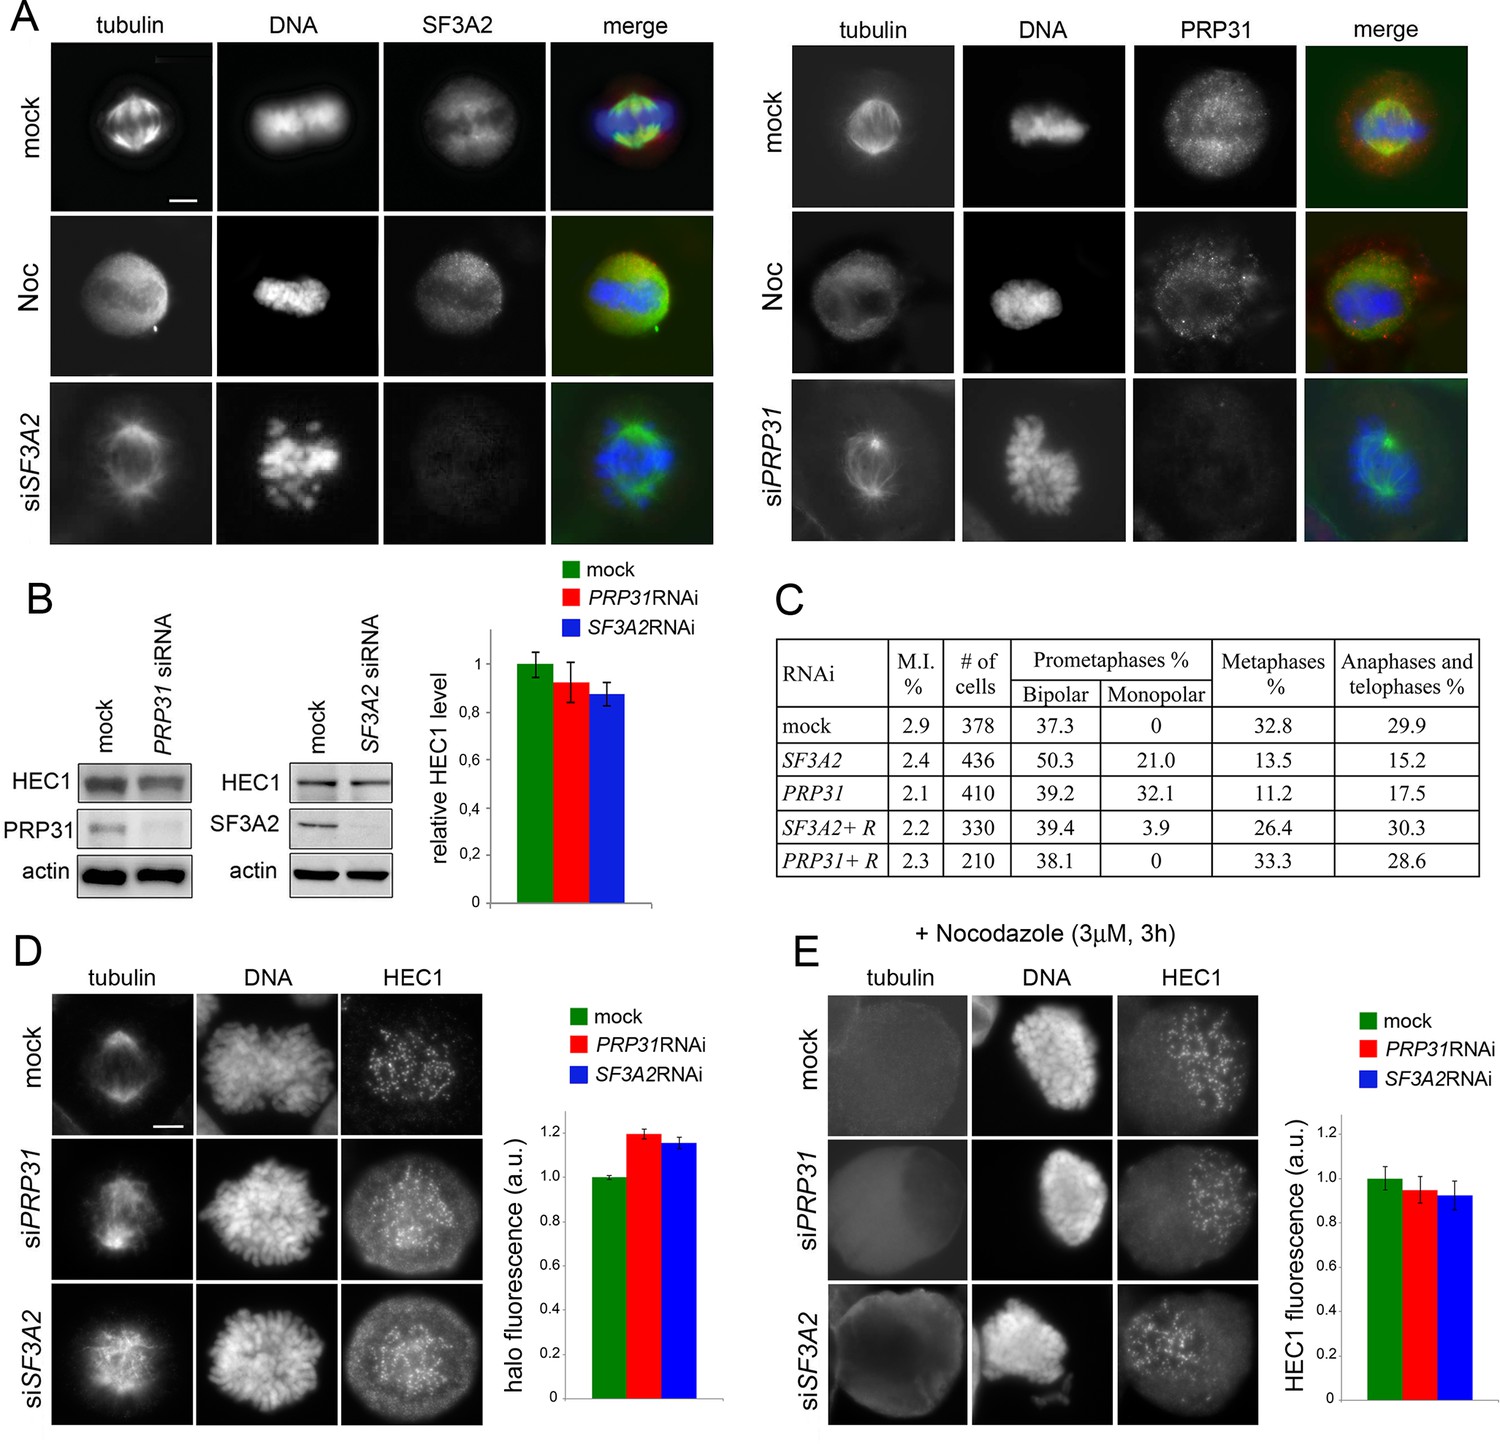
SF3A2 and PRP31 interact with HEC1/Ndc80 and are required for chromosome segregation in HeLa cells.
(A) SF3A2 and PRP31 localization in HeLa cells; both SFs are slightly enriched in the central part of the spindle region; in nocodazole (Noc)-treated cells the SFs are diffuse in the mitotic cytoplasm; in SF3A2 or PRP31 RNAi cells, the spindles are not immunostained by the pertinent antibodies. In merged images, DNA is blue, tubulin green and the SFs red. Scale bar, 5 μm. (B) Western blotting showing that RNAi-mediated depletion of SF3A2 or PRP31 strongly reduces the levels of these proteins without affecting HEC1 expression. Actin is a loading control. Quantification of the HEC1 level from three independent experiments does not reveal significant differences between control and RNAi cells using unpaired t-test. Error bars, SEM. (C) Mitotic index (M.I.) and frequencies of mitotic figures observed after RNAi against SF3A2 and PRP31. R, are specific rescue constructs expressing RNAi resistant SF3A2 and PRP31 genes. (D) Representative prometaphase figures (not treated with nocodazole) stained for DNA, HEC1 and tubulin showing that RNAi against SF3A2 or PRP31 results in the formation of a HEC1 halo surrounding the chromosomes. The graph shows quantification of halo fluorescence. To estimate the fluorescence intensities of the halos, we calculated the signal-to-background ratios in 20 randomly chosen cells, as described in Materials and methods. In SF3A2 and PRP31 RNAi cells, these ratios are significantly higher than that detected in control cells (p<0.001 for both samples in the unpaired t test).(E) Representative nocodazole-treated mitotic figures stained for tubulin and HEC1. The graph shows a quantification of the HEC1 fluorescence associated with the chromosomes; see Materials and methods for details on fluorescence measurement. The fluorescence intensities detected in SF3A2 and PRP31 RNAi cells are not significantly different from that of control cells in the unpaired t test.
-
Figure 9—source data 1
Source data for Figure 9B,D and E.
- https://doi.org/10.7554/eLife.40325.039
Figure 9—figure supplement 1

SF3A2 localization in HeLa cells Immunolocalization of SF3A2 (red) during mitosis of HeLa cells stained for tubulin (green) and DNA (blue).
Note the nuclear localization of SF3A2 in prophase and late telophase cells. Scale bar, 5 μm.
Figure 10
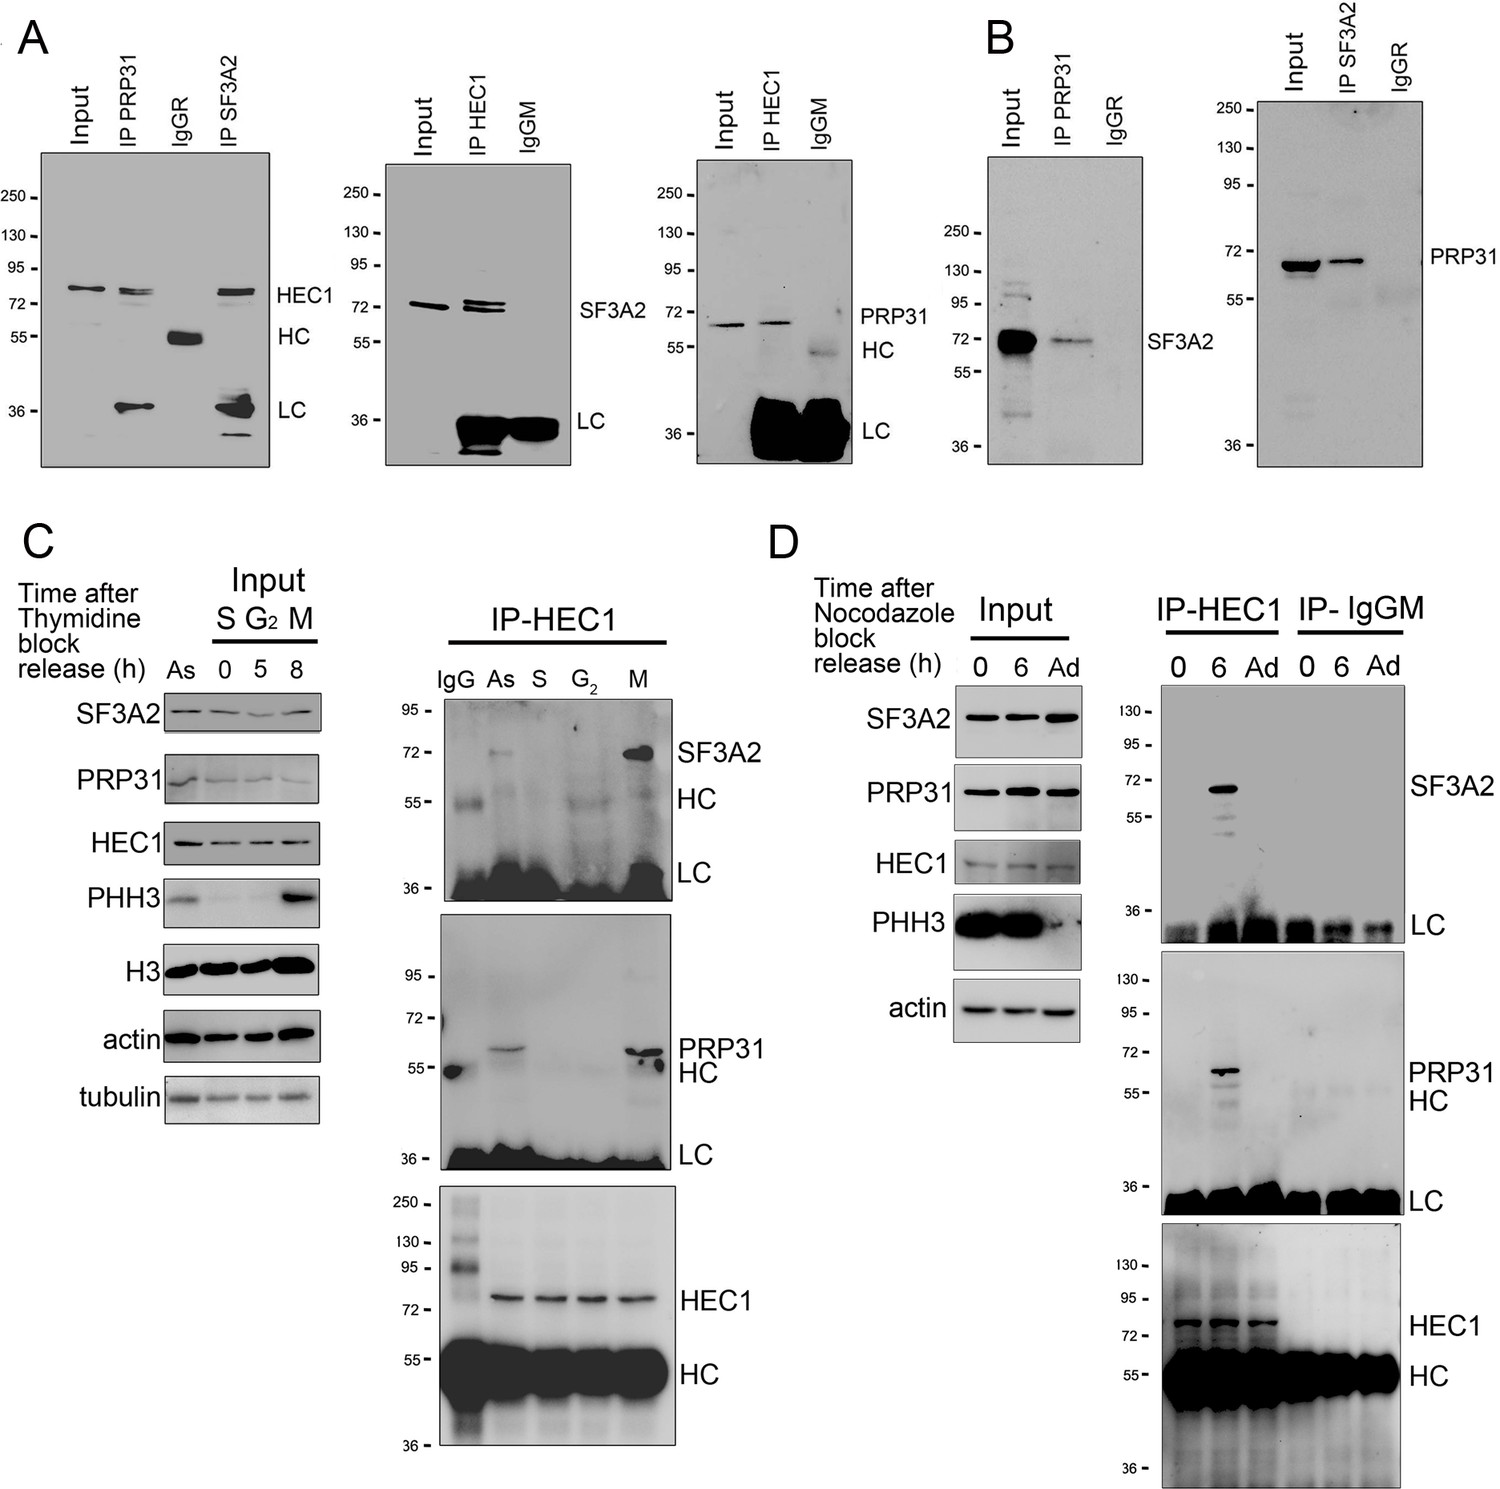
SF3A2 and PRP31 interact with HEC1 only during the M phase in the presence of MTs.
(A) Co-IP analysis showing that SF3A2 and PRP31 interact with HEC1 (input was 8% in all experiments). HC and LC, IgG heavy and light chains, respectively. (B) Reciprocal Co-IPs showing that SF3A2 and PRP31 interact with each other. (C) HEC1-SF interaction in HeLa cells synchronized using a double thymidine block. Cells were examined at different times after release from the block (see Materials and methods for details). As, Asynchronous cells; S (0 hr), G2 (5 hr) and M (8 hr) indicate the phases of the cell cycle; PHH3 is the mitotic marker phosphohistone H3; H3, histone H3; LC and HC are the IgG light and heavy chains. Tubulin and actin are loading controls. Note that SF3A2 and PRP31 coprecipitate with HEC1 only when the sample contains mitotic cells. (D) SF-interaction in HeLa cells synchronized using nocodazole treatment. Cells were collected by mitotic shake-off at 0 hr or 6 hr after nocodazole removal; Ad, Adherent cells. Note that SF3A2 and PRP31 do not interact with HEC1 in cells with depolymerized MTs (0 hr).
Figure 11 with 1 supplement
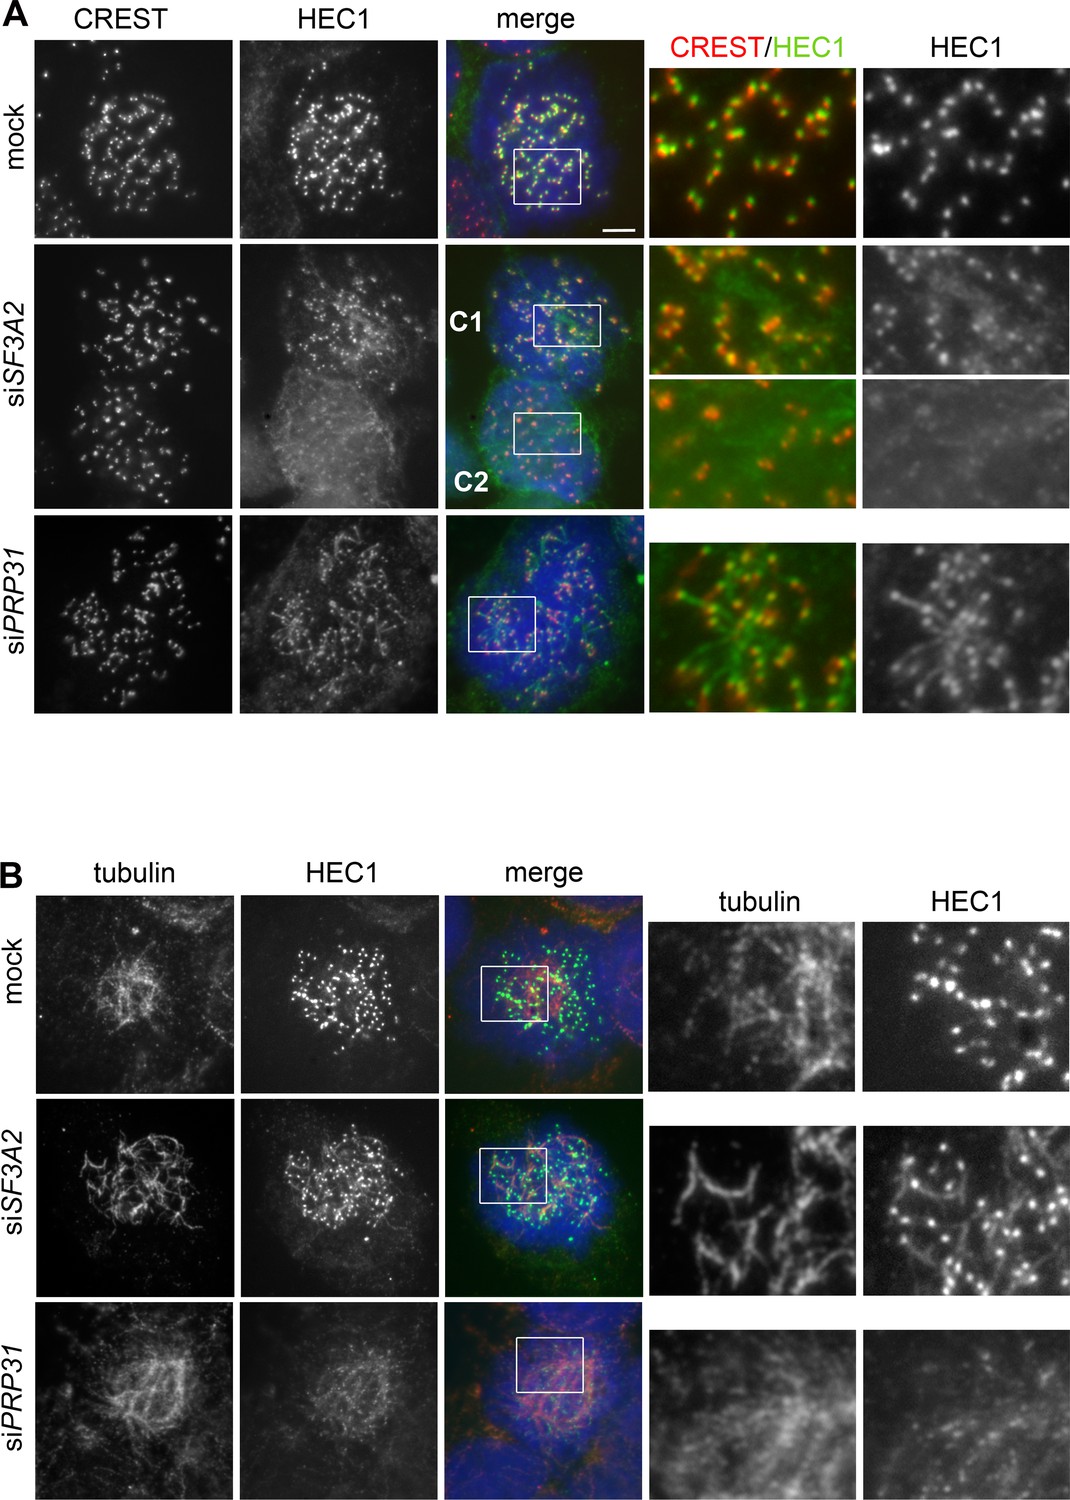
SF3A2 and PRP31 are required to prevent diffusion of HEC1 from kinetochores of HeLa cells.
(A, B) Prometaphases and prometaphase-like figures were fixed after pre-extraction with Triton X-100 (see Materials and methods) and stained with DAPI (DNA, blue) and either CREST (red) and anti-HEC1 (green) antibodies (A) or anti-tubulin (red) and anti-HEC1 (green) antibodies (B). Boxes delimit regions shown as enlargements in the rightmost panels. In SF3A2 and PRP31 RNAi cells the anti-HEC1 antibodies stain filaments protruding from the CREST signals (A); these filaments are also stained by anti-tubulin antibodies (B). The middle panels in A show two cells, C1 and C2. In C1, HEC1 is mostly associated with the kinetochores, showing only short protrusions from the CREST signals; in C2, the bulk of HEC1 is no longer on kinetochores but is instead associated with filamentous structures. Scale bar, 5 μm.
Figure 11—figure supplement 1
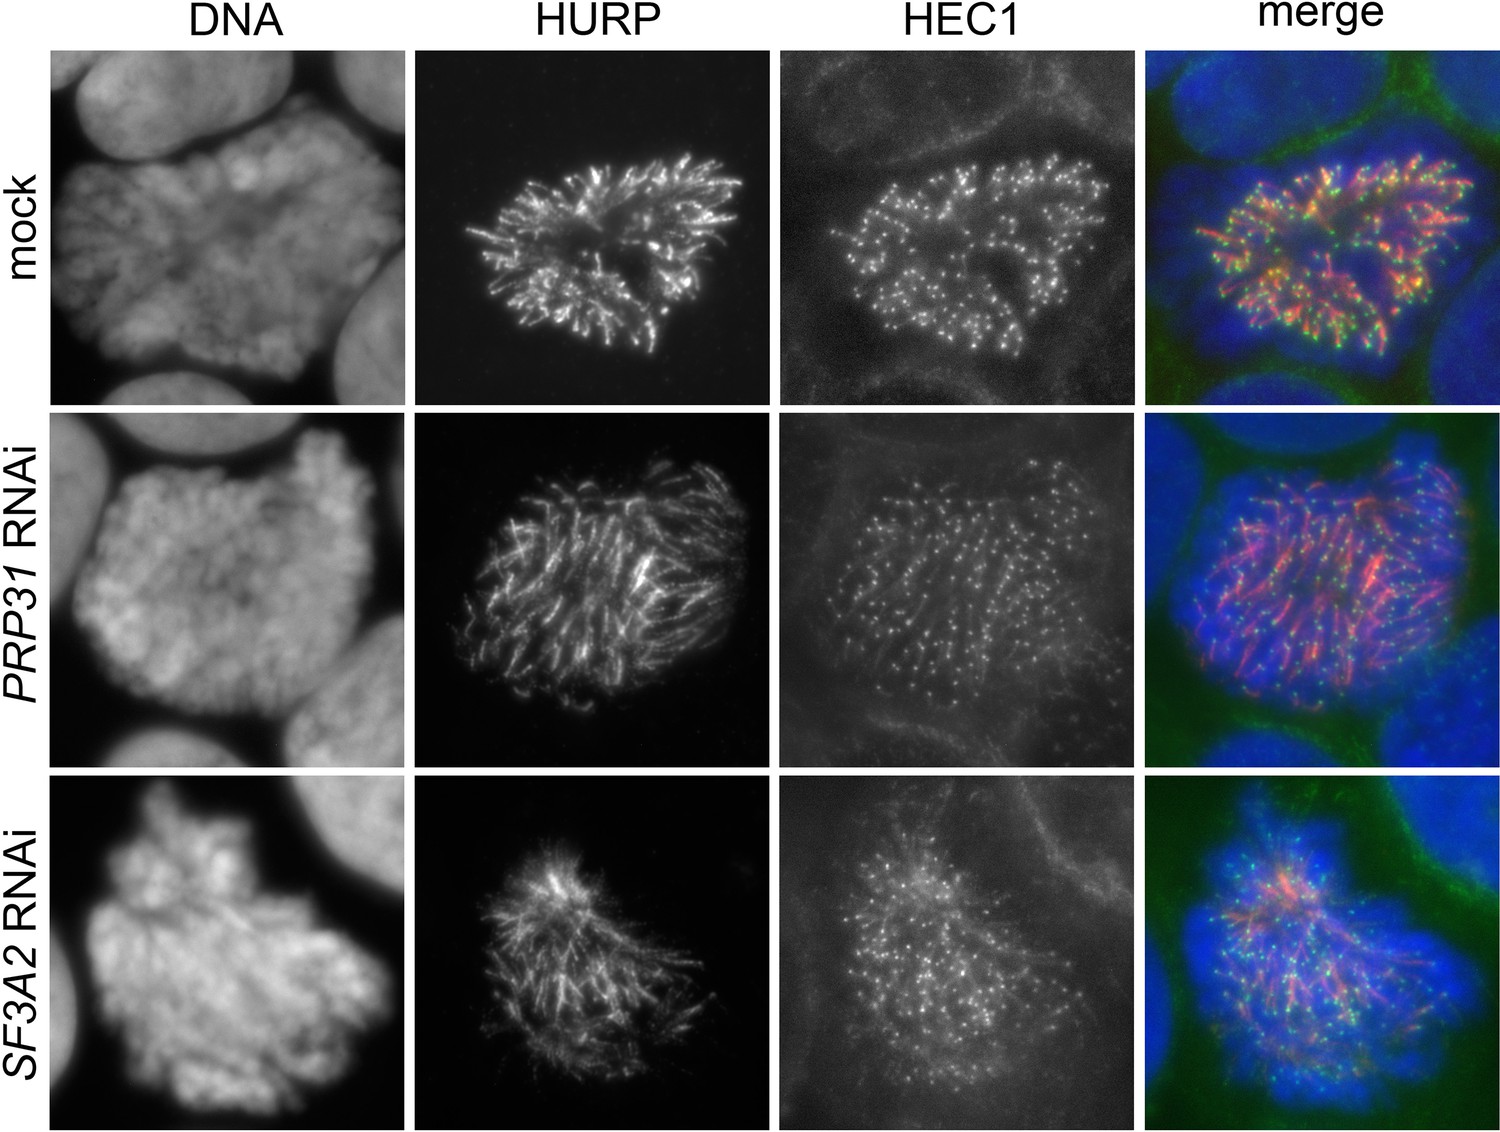
Localization of HEC1 in HeLa cells depleted of SF3A2 and PRP31 and stained for HURP.
(A) Representative control (mock), SF3A2 RNAi and PRP31 RNAi cells fixed after pre-extraction with Triton X-100 (see Materials and methods), and stained with DAPI (DNA, blue), anti-HURP (red) and anti-HEC1 (green) antibodies.
Videos
Video 1
Mitosis in control S2 cells expressing histone-GFP and tubulin mCherry.
https://doi.org/10.7554/eLife.40325.009
Video 2
Prolonged metaphase arrest in Sf3A2-depleted S2 cells expressing histone-GFP and tubulin mCherry.
https://doi.org/10.7554/eLife.40325.010
Video 3
Prolonged metaphase arrest in Prp31-depleted S2 cells expressing histone-GFP and tubulin mCherry.
https://doi.org/10.7554/eLife.40325.011
Video 4
Mitotic division in mock-injected (control) embryos expressing histone RFP and tubulin-GFP; imaging begins before NEB.
https://doi.org/10.7554/eLife.40325.018
Video 5
Mitotic division in α-Sf3A2-injected embryos expressing histone RFP and tubulin-GFP; imaging begins before NEB.
https://doi.org/10.7554/eLife.40325.019
Video 6
Mitotic division in α-Prp31-injected embryos expressing histone RFP and tubulin-GFP; imaging begins before NEB.
https://doi.org/10.7554/eLife.40325.020
Video 7
Mitotic division in α-Sf3A2-injected embryos expressing histone RFP and tubulin-GFP; imaging begins after NEB.
https://doi.org/10.7554/eLife.40325.021
Video 8
Mitotic division in α-Prp31-injected embryos expressing histone RFP and tubulin-GFP; imaging begins after NEB.
https://doi.org/10.7554/eLife.40325.022
Video 9
Metaphase delay in Ndc80-depleted S2 cells expressing histone-GFP and tubulin mCherry.
https://doi.org/10.7554/eLife.40325.036Additional files
-
Supplementary file 1
Lists of proteins whose abundance is significantly reduced (1 SD) in Prp31, Sf3A2 or Sf3A1 RNAi cells, normalized against control.
Proteins with Gene Ontologies (GOs) of mitotic cell cycle, cell division or chromosome segregation are highlighted in grey.
- https://doi.org/10.7554/eLife.40325.043
-
Transparent reporting form
- https://doi.org/10.7554/eLife.40325.044
Download links
A two-part list of links to download the article, or parts of the article, in various formats.
Downloads (link to download the article as PDF)
Open citations (links to open the citations from this article in various online reference manager services)
Cite this article (links to download the citations from this article in formats compatible with various reference manager tools)
Splicing factors Sf3A2 and Prp31 have direct roles in mitotic chromosome segregation
eLife 7:e40325.
https://doi.org/10.7554/eLife.40325


