Impact of seasonal variations in Plasmodium falciparum malaria transmission on the surveillance of pfhrp2 gene deletions
- Imperial College London, United Kingdom
- World Health Organization, Switzerland
- University of Kinshasa, Democratic Republic of the Congo
- University of North Carolina at Chapel Hill, United States
Figures
Figure 1 with 2 supplements
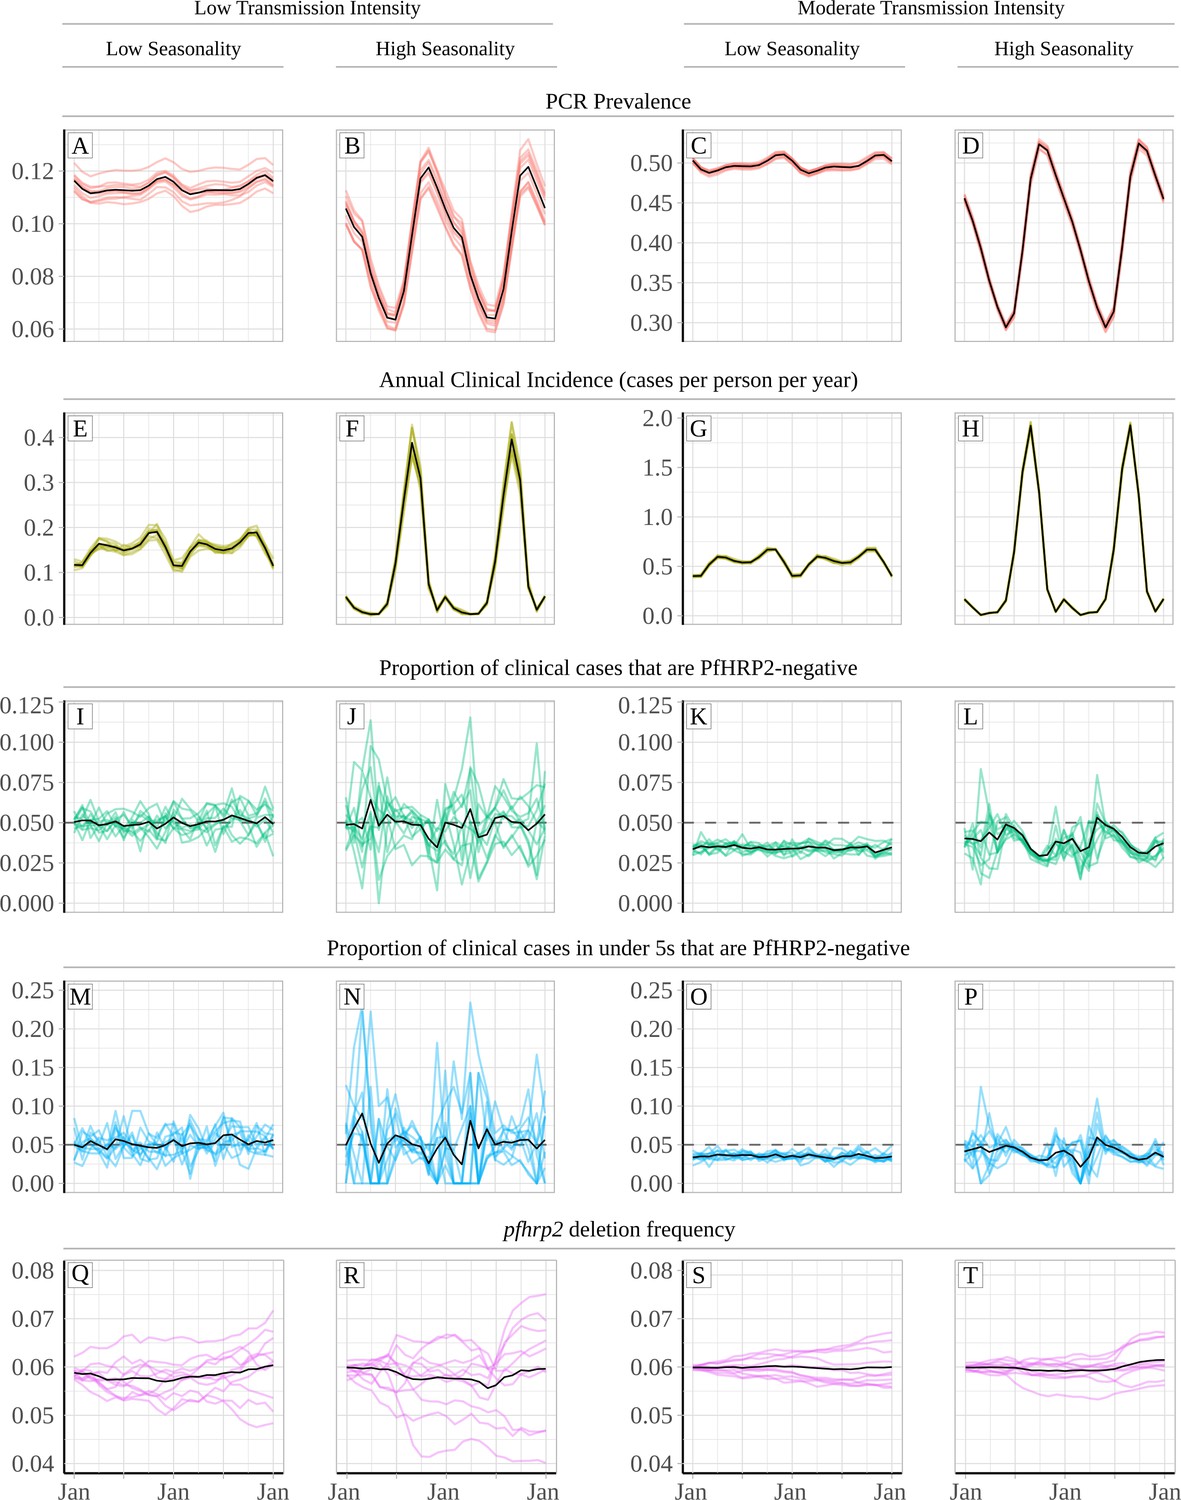
Relationship between seasonality, transmission intensity and proportion of clinical cases that are infected with only pfhrp2-deleted parasites.
Graphs show in (A – D) and (E - H) the model predicted PCR prevalence and annual clinical incidence respectively at both a low and a moderate transmission intensity. In (I – L) and (M - P) the proportion of clinical cases only infected with pfhrp2-negative parasites is shown for both the whole population and in children under 5 years old, respectively. Lastly, graphs (Q - T) show the population allele frequency of pfhrp2 gene deletions, which was set equal to 6% at the beginning of each simulation. 10 simulation realisations are shown in each graph, with the mean shown with by the black line. Lastly, the 5% threshold for switching RDT provided by the WHO is shown with the dashed horizontal line in plots (I – P).
Figure 1—figure supplement 1
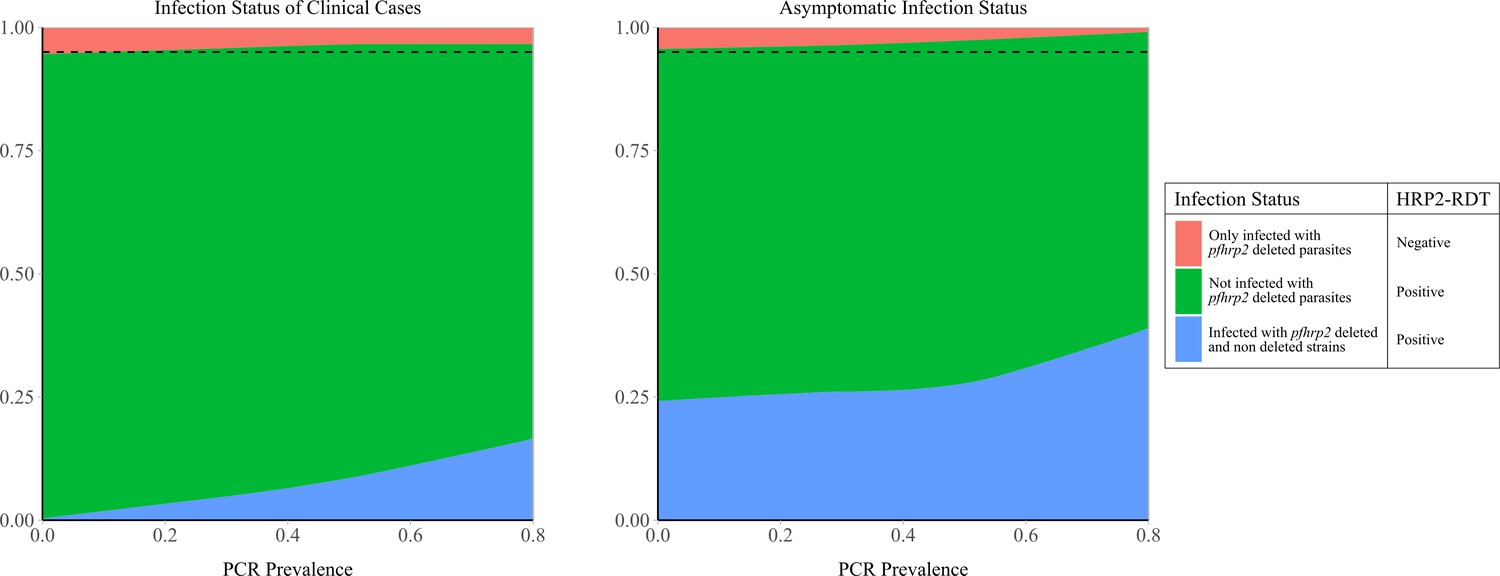
Model predicted relationship between clonality of infection in asymptomatic and clinical cases against prevalence of malaria.
The graphs show the proportion of (A) clinical cases of malaria and (B) asymptomatic individuals that are infected with only pfhrp2-deleted parasites, not infected with pfhrp2-deleted parasites or polyclonally infected (infected with both pfhrp2-deleted parasites and wild-type parasites). These proportions are shown with respect to increasing prevalence of malaria, identifying the increased proportion of individuals that are polyclonally infected at high transmission intensities. For both plots, the population frequency of pfhrp2 gene deletions in the population is 5%, which is shown by the dashed black line. Consequently, at very low PCR prevalence, when the majority of infections contain only one infecting strain and the proportion of polyclonal infections tends to zero, the observed prevalence of the deletions will tend to the population frequency of 5%.
Figure 1—figure supplement 2
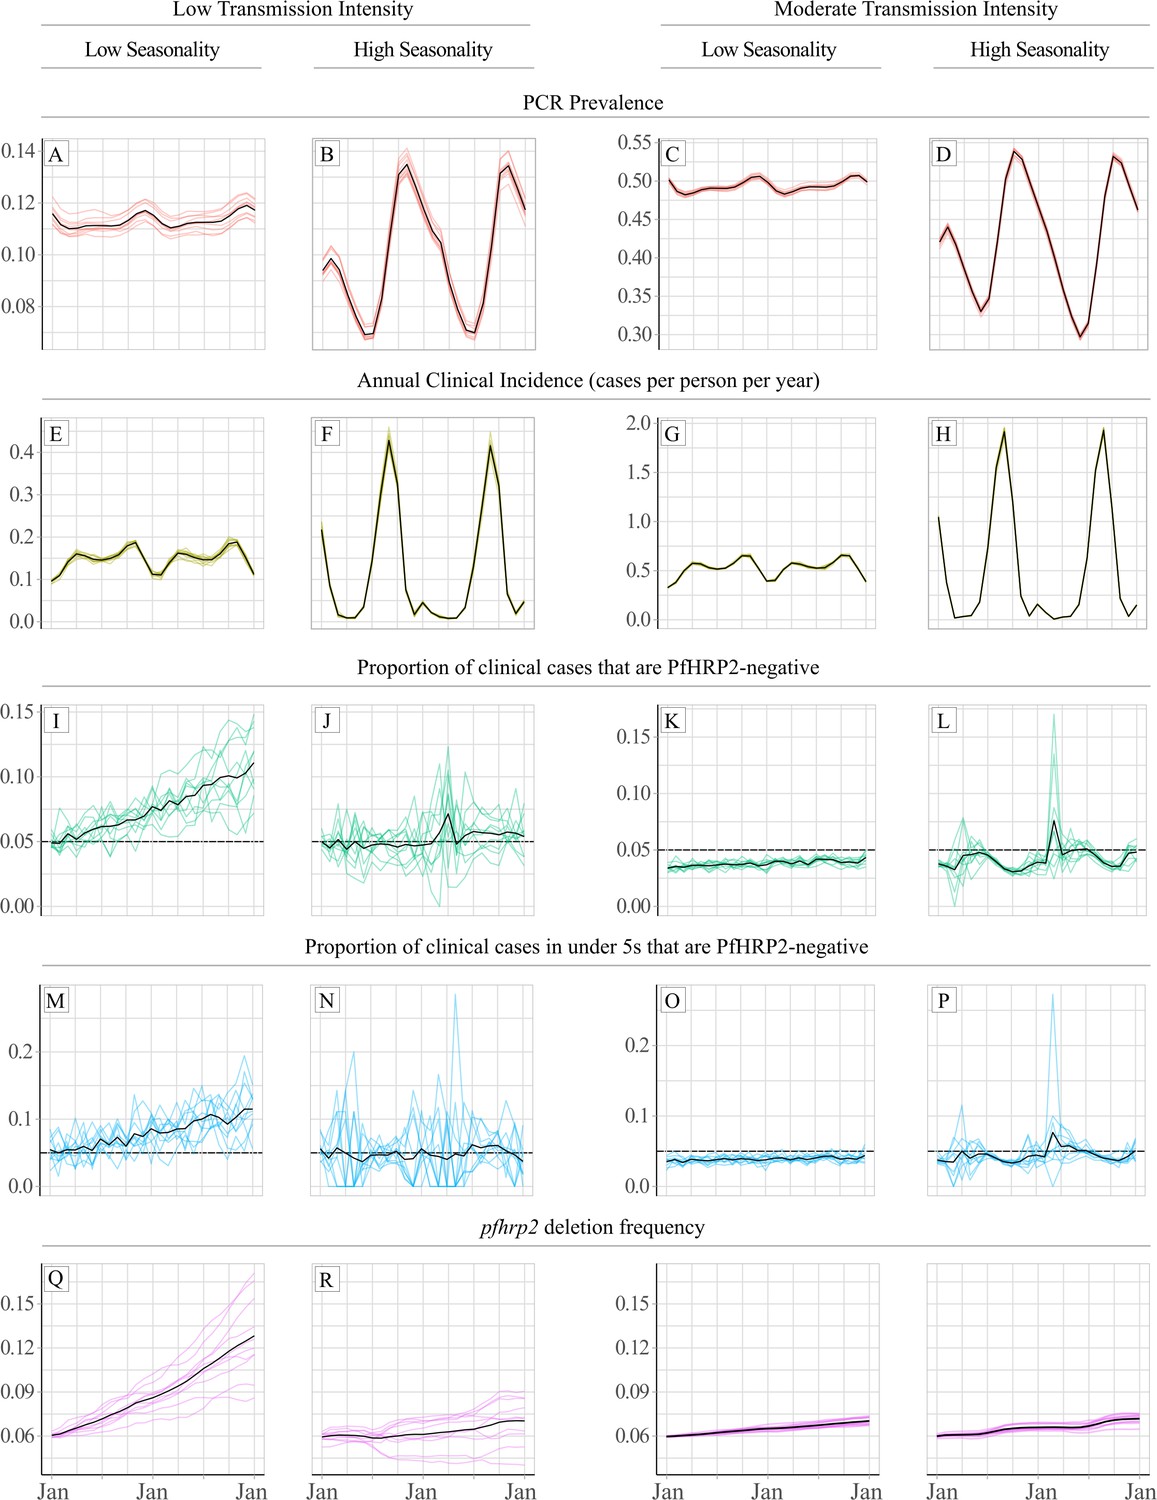
Impact of a selective advantage for pfhrp2-deleted parasites on the relationship between seasonality, transmission intensity and proportion of clinical cases that are infected with only pfhrp2-deleted parasites.
Graphs show in A – D and E - H, the model predicted PCR prevalence and annual clinical incidence respectively at both a low and a moderate transmission intensity. In I – L and M - P the proportion of clinical cases only infected with pfhrp2-negative parasites is shown for both the whole population and in children under 5 years old, respectively. Lastly, graphs Q - T show the population allele frequency of pfhrp2 gene deletions, which was set equal to 6% at the beginning of each simulation before increasing due to selection. 10 simulation realisations are shown in each graph, with the mean shown with by the black line. Lastly, the 5% threshold for switching RDT provided by the WHO is shown with the dashed horizontal line in plots I – P.
Figure 2 with 1 supplement
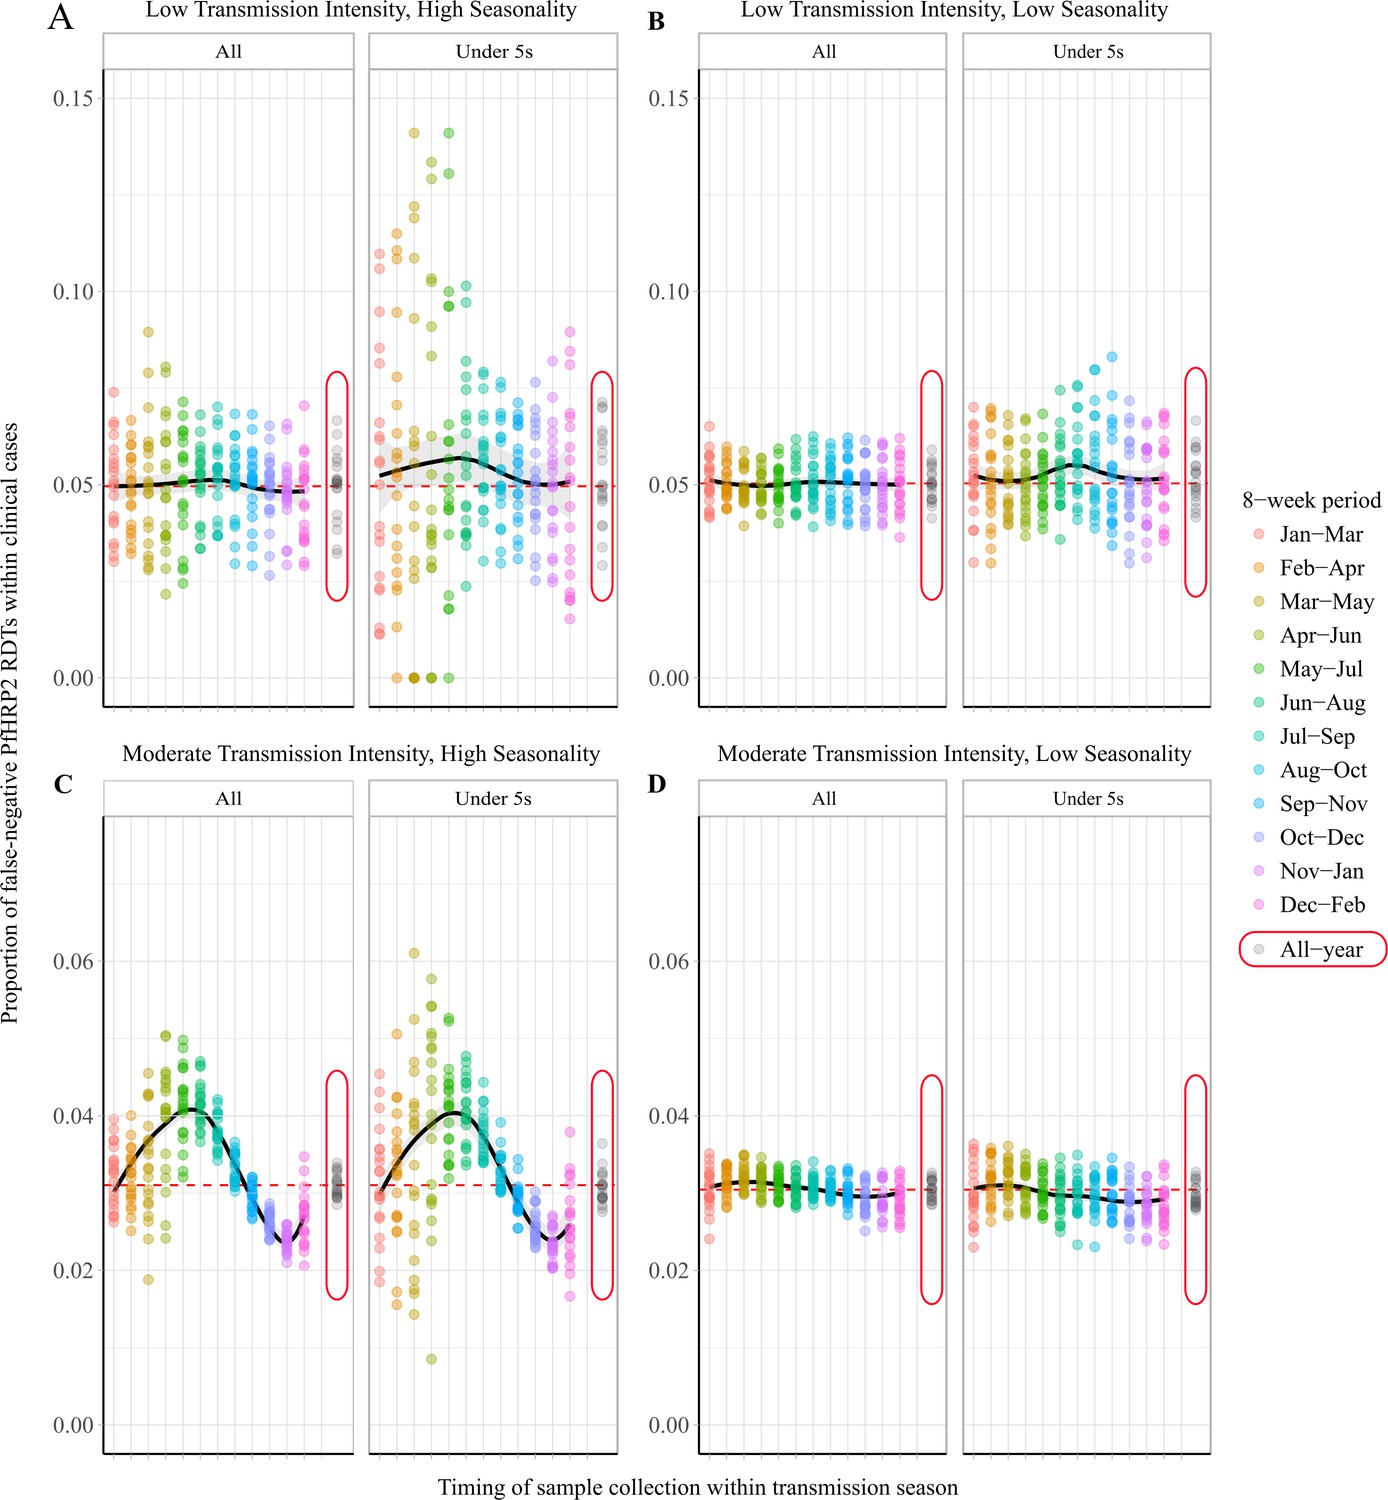
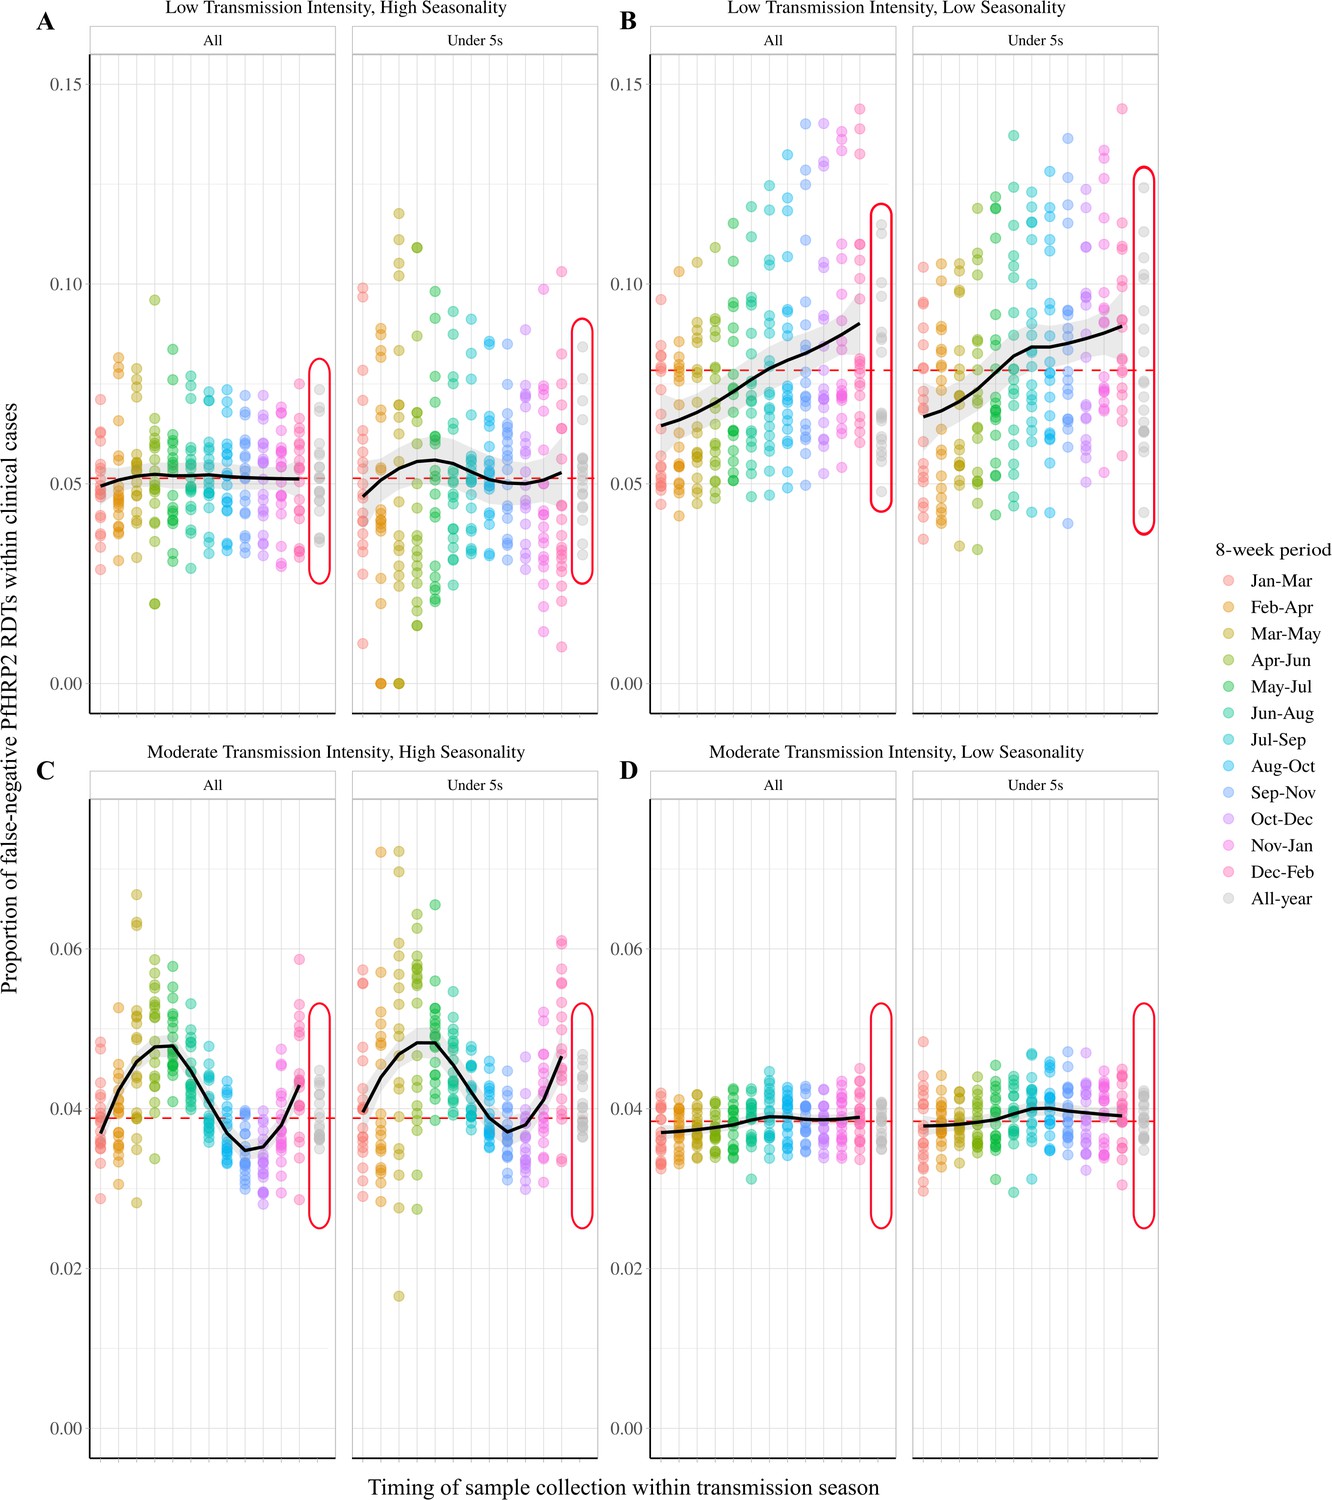
Observed proportion of false-negative PfHRP2 RDTs within clinical cases during 8-week intervals.
Graphs show the proportion of clinical cases yielding false-negative PfHRP2 RDTs at 8-week intervals within a transmission season for both moderate (C, D) and low (A, B) transmission settings and high (A, C) and low (B, D) seasonality. In each panel, the observed proportion pfhrp2-negative clinical cases is shown for the whole population and within children aged under 5 years old. Ten stochastic realisations are represented by the points in each plot, with the mean relationship throughout the transmission shown in black with a locally weighted scatterplot smoothing regression (loess). The annual average proportion of false-negative RDTs due to pfhrp2 gene deletions is shown with the horizontal dashed red line, and a sampling scheme that occurs throughout the year, with samples collected proportionally to clinical incidence, is shown with grey points circled in red.
Figure 2—figure supplement 1
Impact of a selective advantage for pfhrp2-deleted parasites on the observed proportion of false-negative PfHRP2 RDTs within clinical cases during 8-week intervals.
Graphs show the proportion of clinical cases yielding false-negative PfHRP2 RDTs at 8-week intervals within a transmission season for both moderate (C, D) and low (A, B) transmission settings and high (A, C) and low (B, D) seasonality. In each panel the observed proportion pfhrp2-negative clinical cases is shown for the whole population and within children aged under 5 years old. Ten stochastic realisations are represented by the points in each plot, with the mean relationship throughout the transmission shown in black with a locally weighted scatterplot smoothing regression (loess). The annual average proportion of false-negative RDTs due to pfhrp2 gene deletions is shown with the horizontal dashed red line, and a sampling scheme that occurs throughout the year, with samples collected proportionally to clinical incidence, is shown with grey points circled in red.
Figure 3
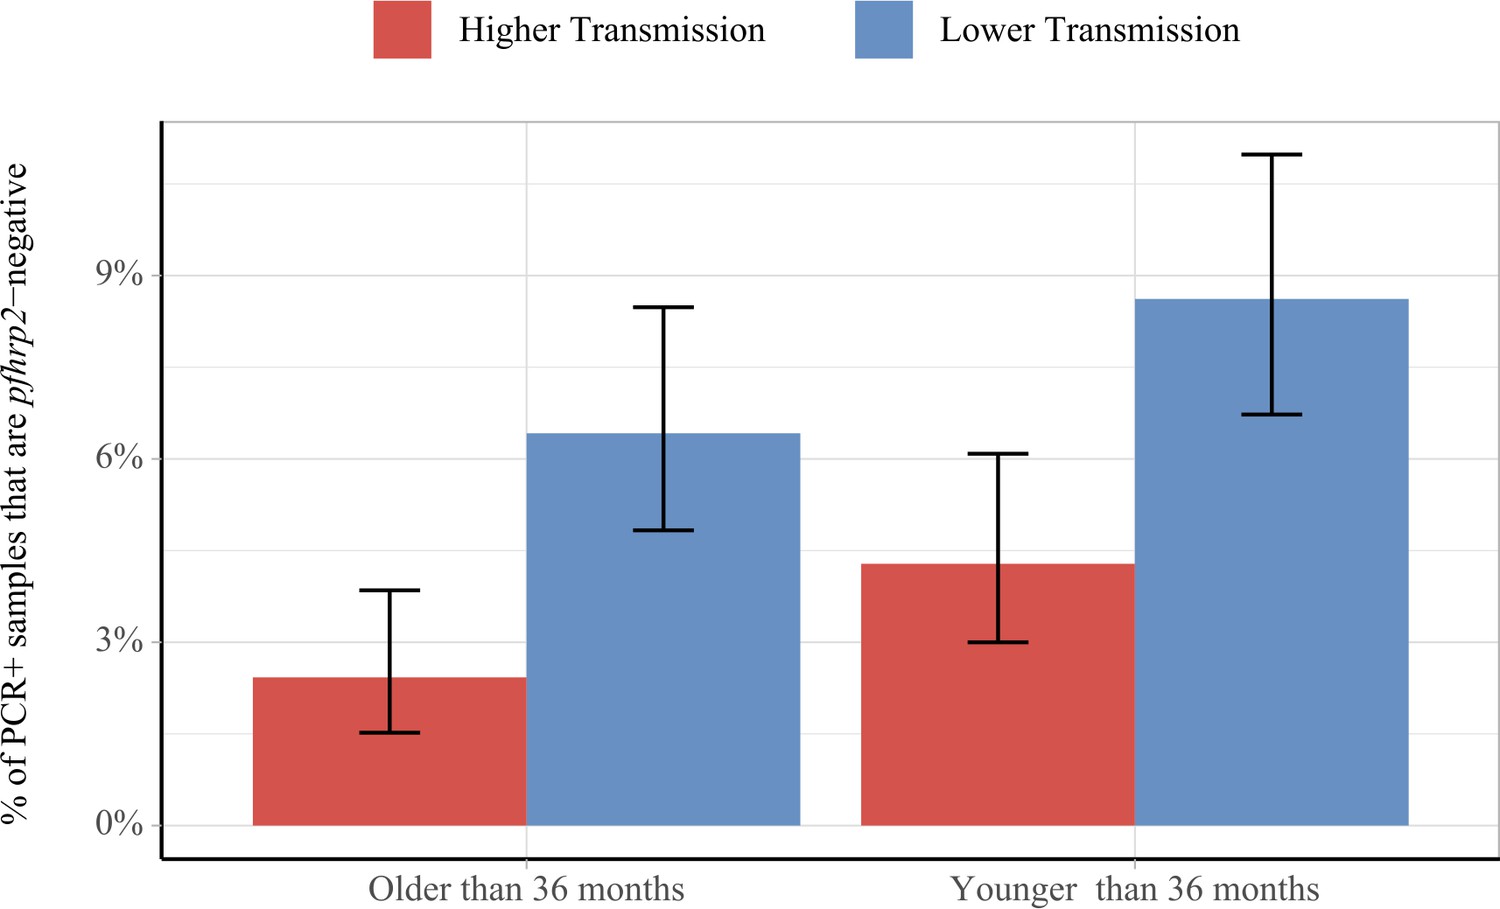
Impact of age and transmission intensity upon pfhrp2 deletion in the Democratic Republic of the Congo (DRC), 2013–2014.
Graphs show the percentage of PCR-positive P. falciparum samples taken from children under the age of 5 years from the 2013–2014 Demographic and Health Survey in DRC that are pfhrp2-negative. Children who are younger than the median age in the 2752 samples are grouped within the younger category. In addition, samples are classified as lower transmission if the incidence of malaria in the month prior to sample collection is lower than the median clinical incidence. The 95% binomial confidence intervals are indicated with the vertical error bars.
Figure 4
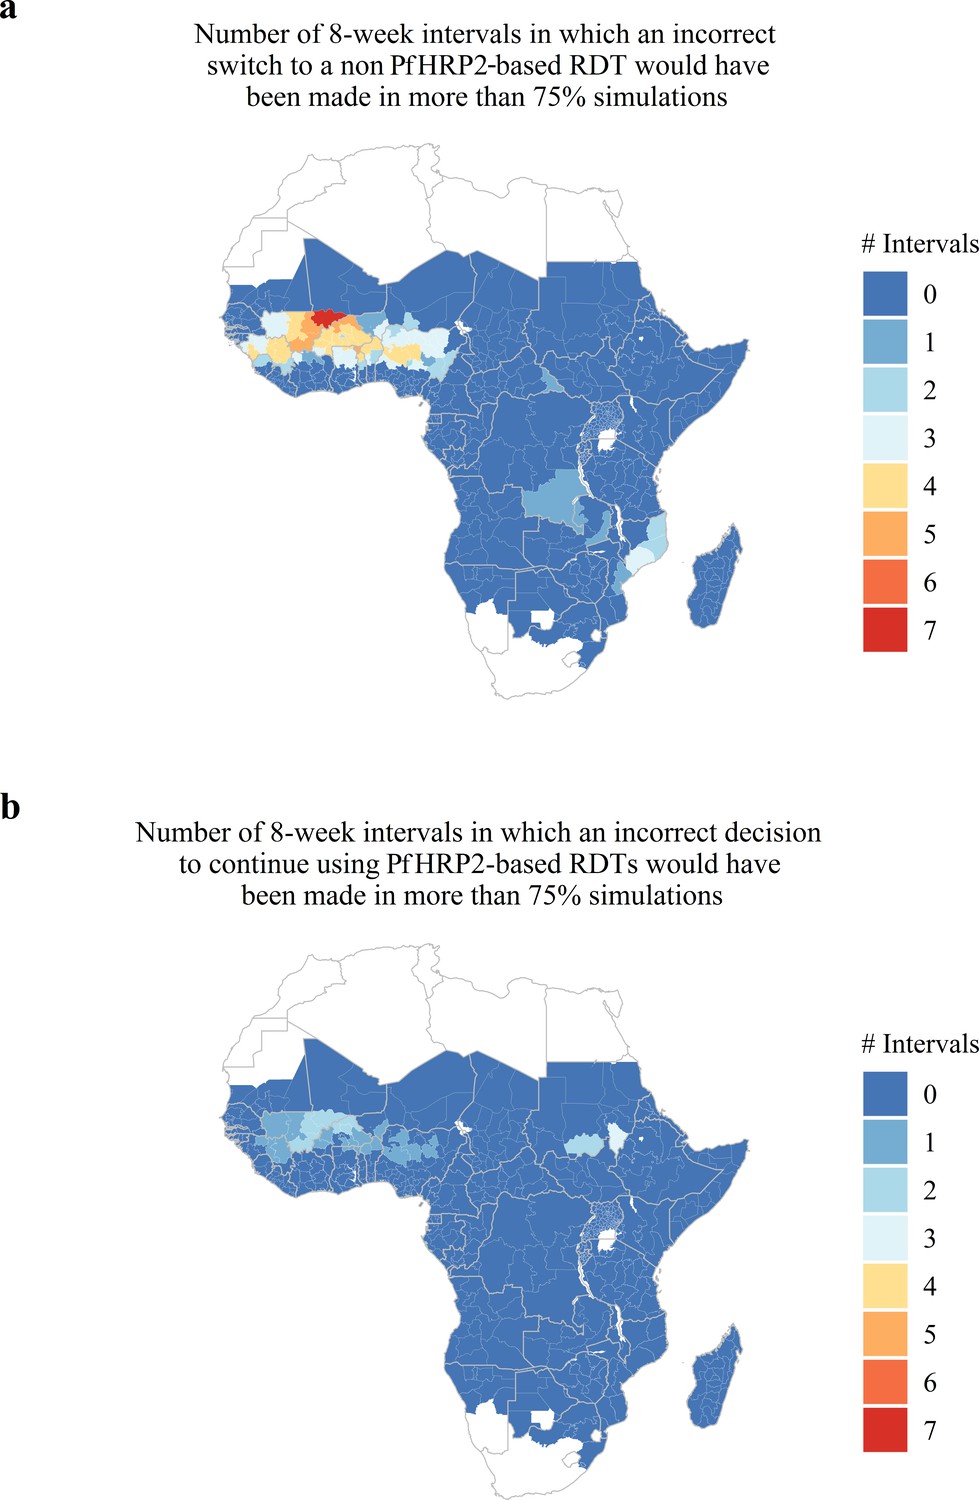
Predicted areas with the potential for collected estimates of the proportion of false-negative PfHRP2 RDTs due to pfhrp2 deletions to be unrepresentative of the annual average.
The maps show (A) the number of 8-week intervals at which an administrative region would prematurely swap to a non PfHRP2-based RDT due to overestimating the proportion of false-negative PfHRP2 RDTs due to pfhrp2 gene deletions in more than 75% of simulations. In (A) the opposing trend is shown, with the number of 8-week intervals at which an administrative region would prematurely continue to use PfHRP2-based RDTs due to underestimating the proportion of false-negative PfHRP2 RDTs due to pfhrp2 gene deletions in more than 75% of simulations.
Figure 5
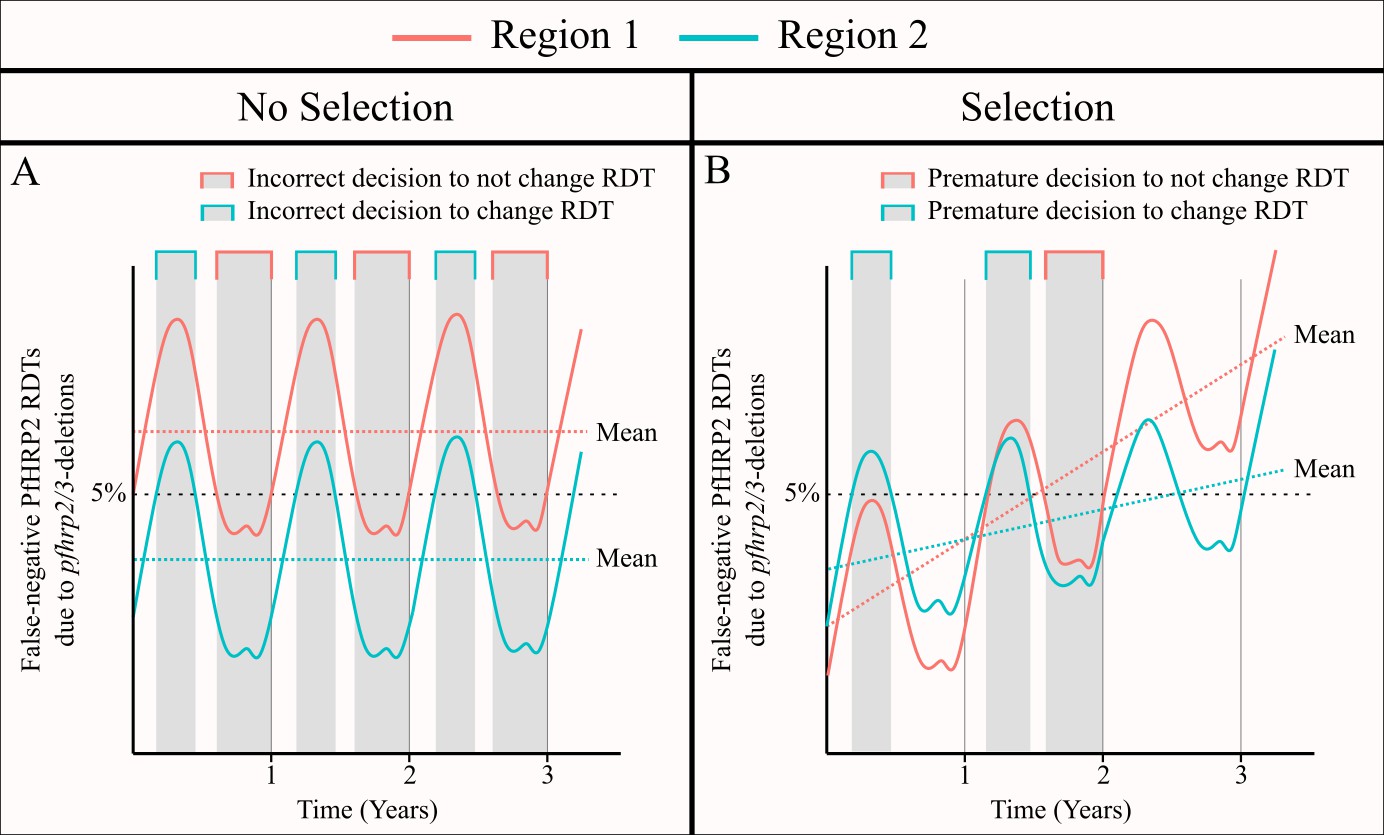
The impact of an assumed selective pressure for pfhrp2/3-deleted parasites on the decision to switch RDT.
The graphs show two hypothetical scenarios with two different regions shown in red and blue for each region. In (A) there are strong seasonal dynamics but no selective pressure. The absence of a selective pressure causes that the mean proportion of false-negative RDTs due to pfhrp2/3 deletions over a 1 year period to be constant and is shown with a horizontal dashed line. Consequently, there are time periods in which an incorrect decision to switch RDT could be made for the region in blue, and an incorrect decision to not switch RDT could be made for the region in red. In (B), there are both seasonal dynamics and a selective pressure, which results in an increasing annual mean proportion of false-negative RDTs due to pfhrp2/3 deletions over time. As in (A), there are periods in which the observed proportion of false-negative RDTs due to pfhrp2/3 deletions is both higher and lower than the rolling mean shown. However, decisions made in these periods are premature rather than definitively incorrect as the selection pressure would eventually cause the proportion to be greater than 5%.
Additional files
-
Supplementary file 1
Simulation model pseudocode.
Mathematical style pseudocode description of the simulation model.
- https://doi.org/10.7554/eLife.40339.010
-
Transparent reporting form
- https://doi.org/10.7554/eLife.40339.011
Download links
A two-part list of links to download the article, or parts of the article, in various formats.
Downloads (link to download the article as PDF)
Open citations (links to open the citations from this article in various online reference manager services)
Cite this article (links to download the citations from this article in formats compatible with various reference manager tools)
Impact of seasonal variations in Plasmodium falciparum malaria transmission on the surveillance of pfhrp2 gene deletions
eLife 8:e40339.
https://doi.org/10.7554/eLife.40339


