Molecular mechanisms that stabilize short term synaptic plasticity during presynaptic homeostatic plasticity
- Kavli Institute for Fundamental Neuroscience, University of California San Francisco, California
Figures
Figure 1 with 1 supplement
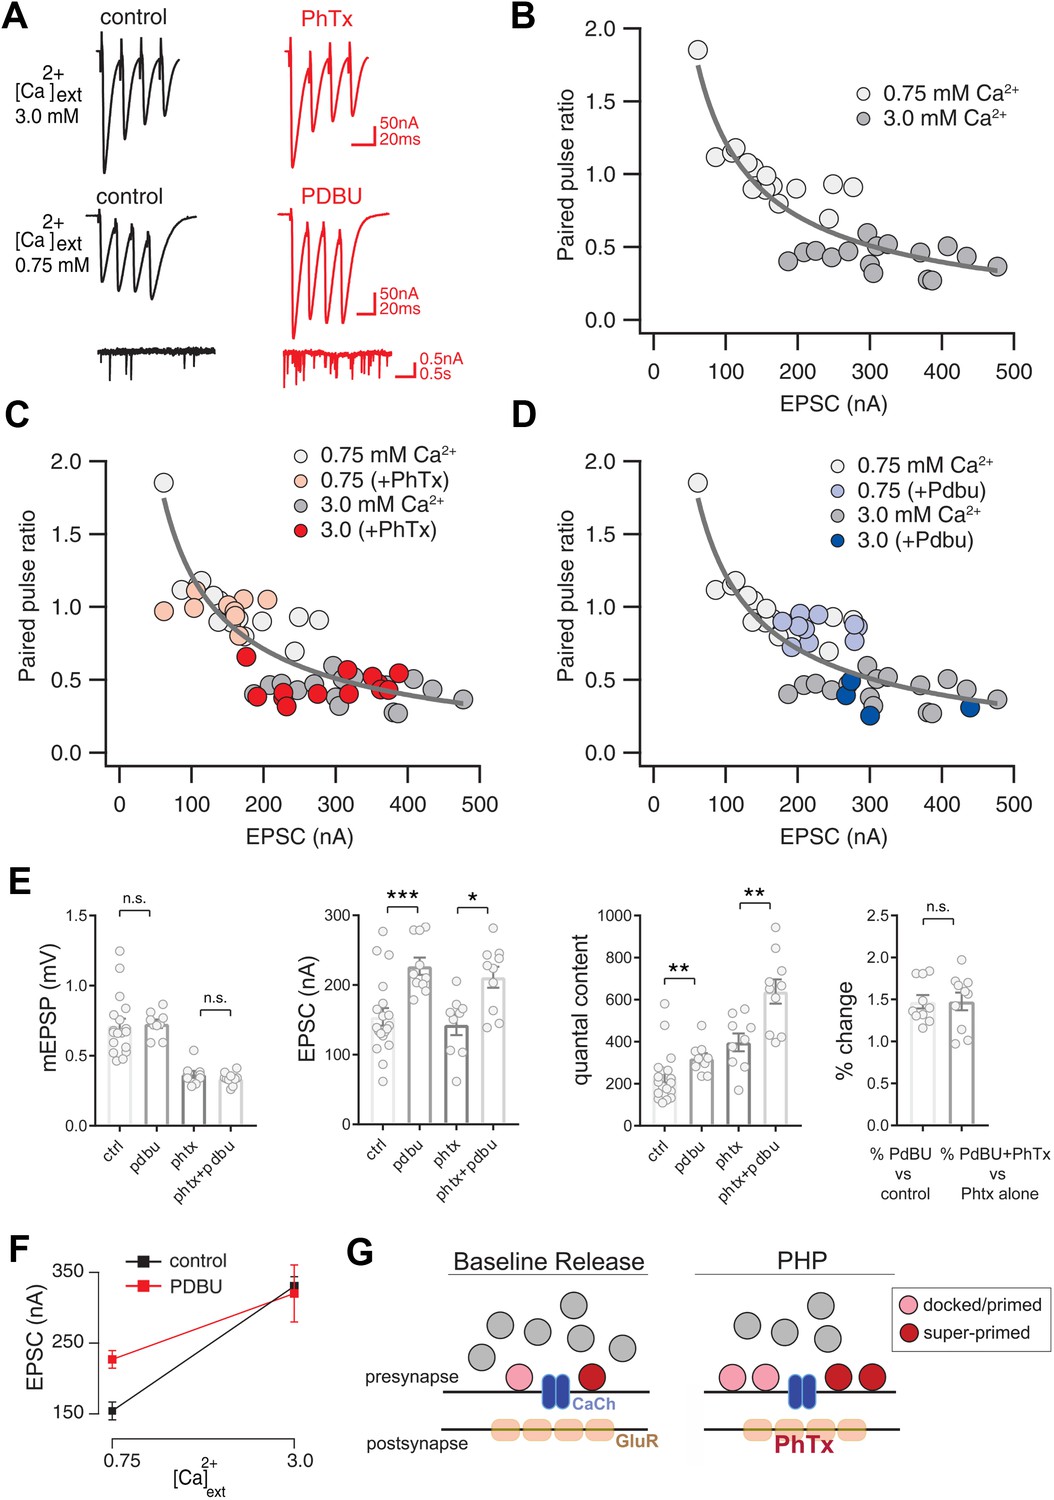
Preservation of Release Dynamics During Presynaptic Homeostatic Plasticity.
(A) Example traces at the indicated external calcium concentration in the presence or absence of PhTx and PdBu. (B) Paired-pulse ratio (EPSC4/EPSC1) versus initial EPSC amplitude (EPSC1) at two external calcium concentrations as indicated. (C) Data from (B) re-plotted (gray) with the addition of data recorded in the presence of PhTx (light and dark red) for indicated external calcium concentrations. (D) Data from (B) re-plotted (gray) with the addition of data recorded in the presence of PdBu (light and dark blue) for indicated external calcium concentrations. (E) Data for mEPSP, EPSC and quantal content for control (ctrl), control in the presence of PdBu (PdBu), control in the presence of PhTx (PhTx) and control synapses incubated in PhTx followed by PdBU (PhTx +PdBu). At right, percent change is calculated as quantal content recorded in the presence of PdBu versus control in the absence of PdBu. (F) EPSC amplitude in the presence (red) and absence (black) of PdBu at the indicated extracellular calcium concentrations. (G) Schematic highlighting the homeostatic doubling of the pool of docked primed vesicles during presynaptic homeostatic plasticity (PHP) in the presence of PhTx. The ratio of primed (light red) to super-primed (dark red) vesicles is held constant, thereby preserving presynaptic release dynamics. ns, not significant; *p<0.05, **p<0.01, ***p<0.001; Data represent mean ±SEM. Student’s t-test, two tailed.
Figure 1—figure supplement 1
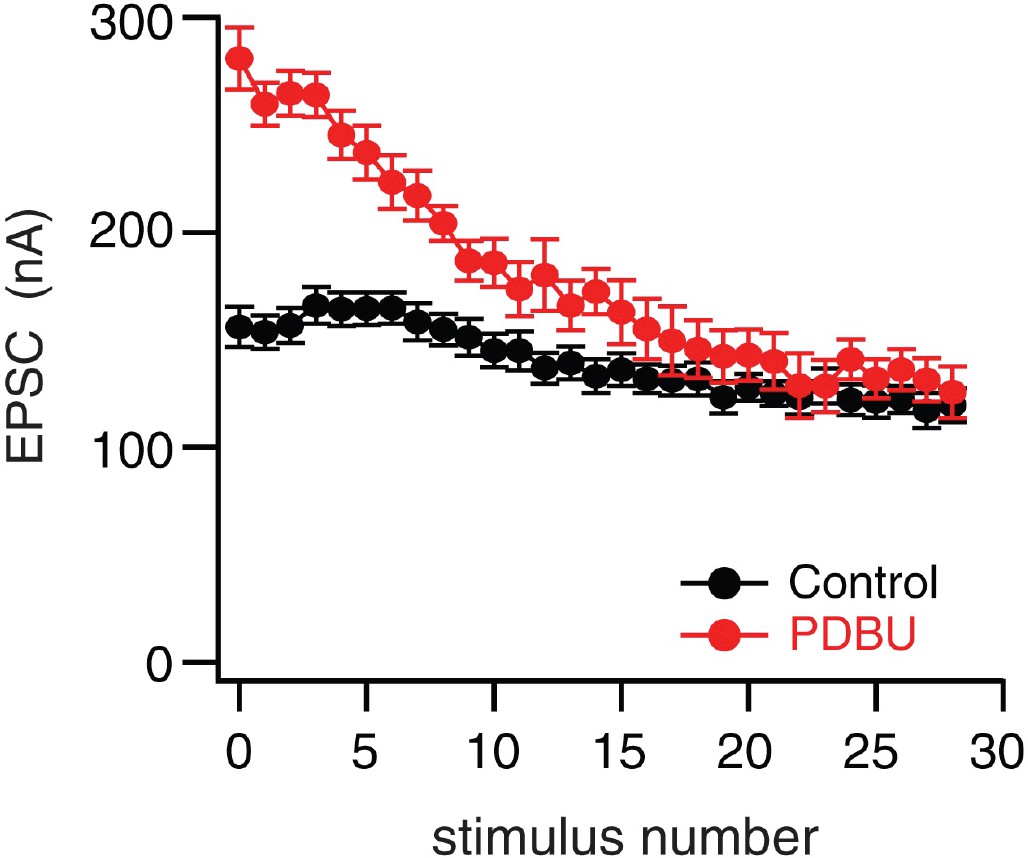
PdBu-dependent potentiation converges to wild type steady state during a prolonged stimulus train.
Average peak amplitudes of 60 Hz trains in the absence (black) and presence (red) of PdBu (n = 6 for control, n = 4 for PdBu, data are mean ±SEM). The average of the last three data points at the end of the stimulus trains are statistically similar (p>0.1; Student’s t-test, two tails).
Figure 2
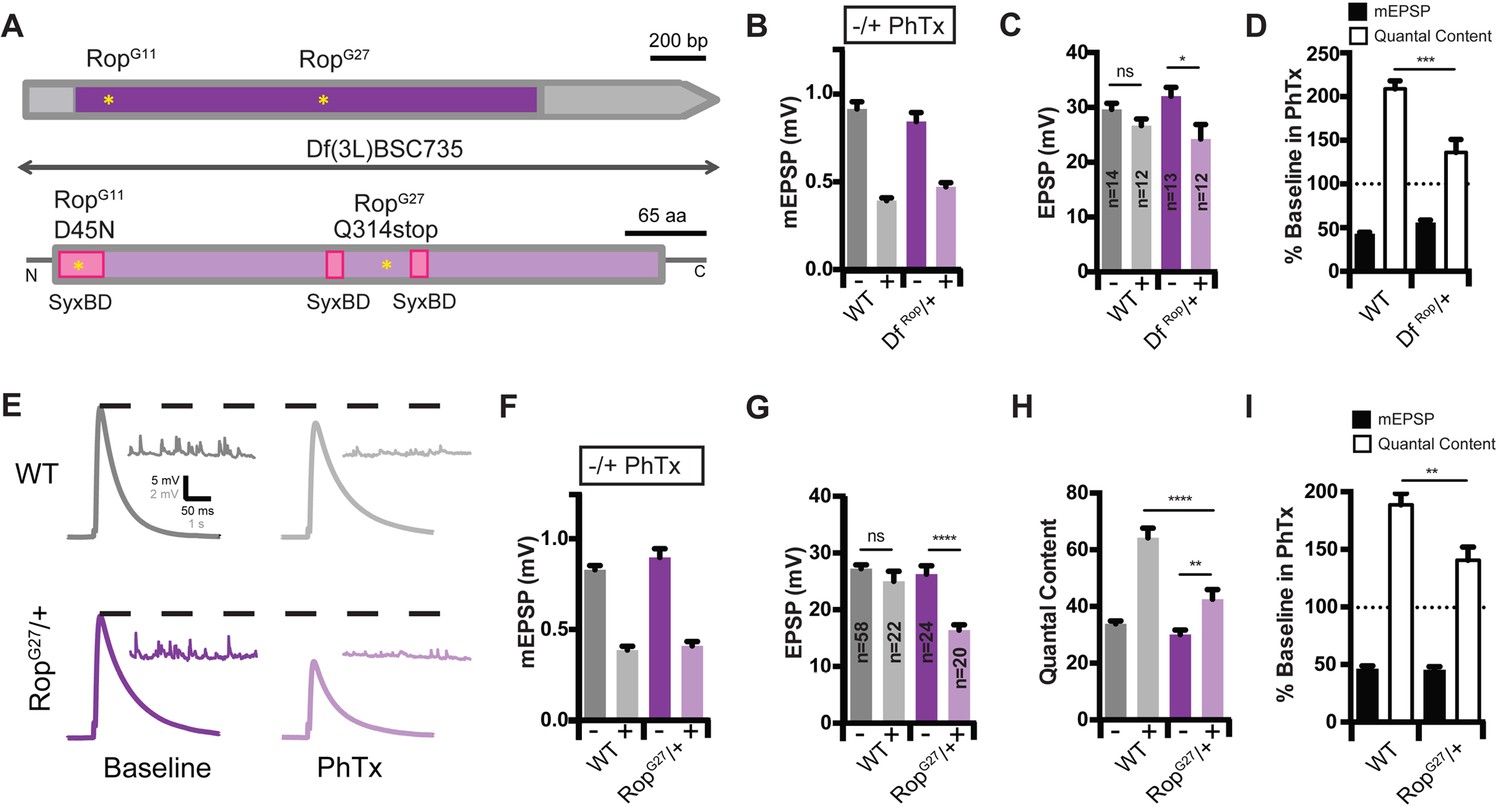
Identification of Rop as a SNARE-Associated Molecule Involved in the Rapid Induction of Presynaptic Homeostasis.
(A) Schematic of the Drosophila Rop gene locus (top) and protein (bottom). Coding exon is shown in dark purple and non-coding DNA is in gray. Protein is shown in light purple. Point mutations in Rop mutant alleles (RopG27 and RopG11) are indicated by yellow stars. Deficiency Df(3L)BSC735 uncovers the Rop gene locus as indicated. Syntaxin-binding domains (SBD) of the Rop protein are shown (pink). (B) Average data for mEPSP amplitude in the absence (baseline) and presence (PhTx) of PhTx for WT and heterozygous deficiency chromosome Df(3L)BSC735 (DfRop/+). PhTx application reduces amplitudes in all genotypes (p<0.01). Data represent mean ± SEM. (C) Average data for EPSP amplitude as in (B); sample sizes for data in (B–D) are shown on bar graph; ns, not significant; *p<0.05; Student’s t-test. (D) Average mEPSP amplitude and quantal content are normalized to values in the absence of PhTx for each genotype. ***p<0.001. (E) Sample traces showing EPSP and mEPSP amplitudes ± PhTx for indicated genotypes. (F–H) Average mEPSP (F) EPSP (G) and Quantal Content (H) for indicated genotypes; ns, not significant; ****p<0.0001; **p<0.01. (I) Average percent change in mEPSP amplitude and quantal content in PhTx compared to baseline for indicated genotypes; **p<0.01. Data are mean ±SEM for all figures. Student’s t-test, two tailed.
Figure 3
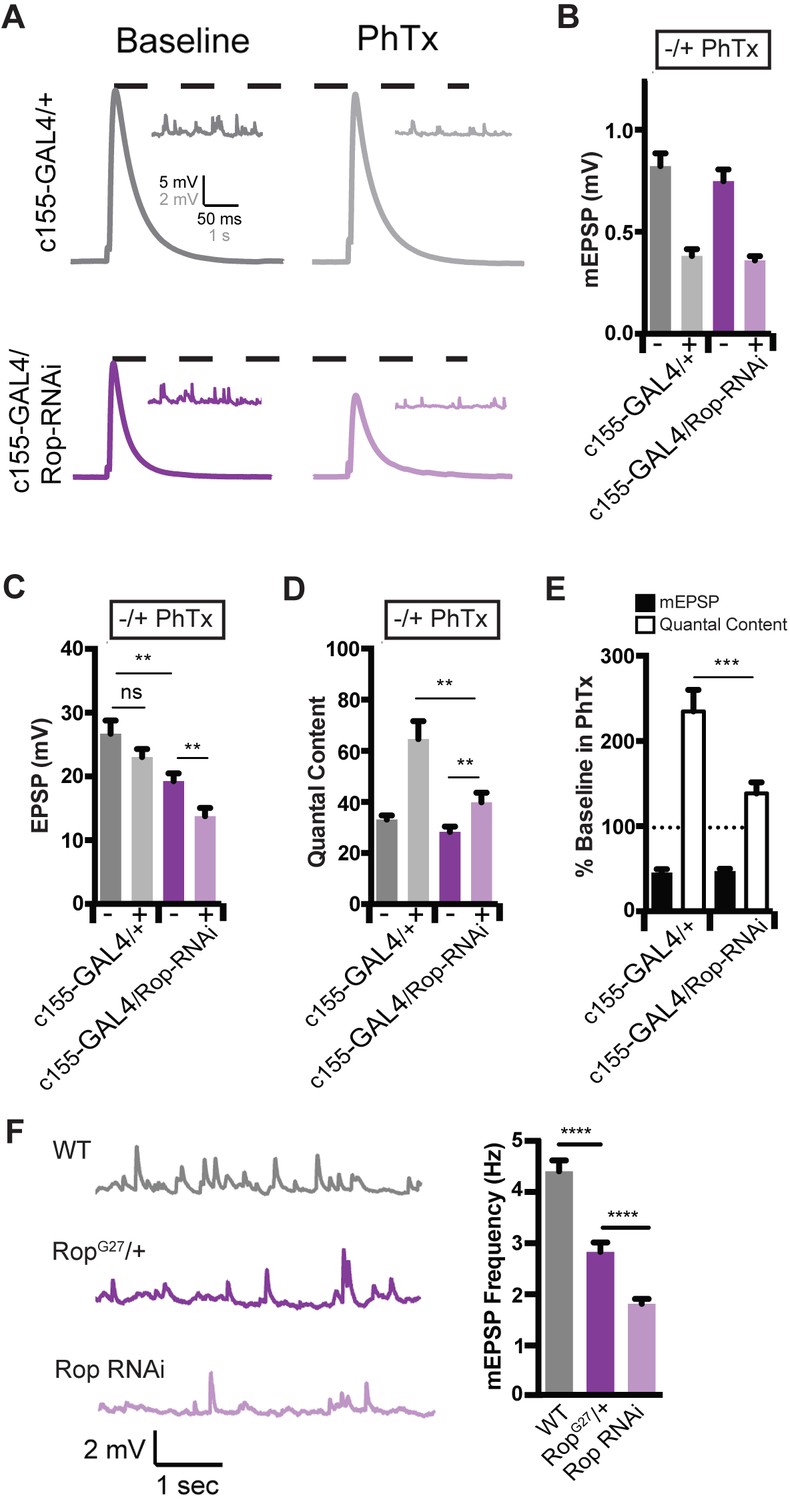
Rop is Required Neuronally During Presynaptic Homeostasis.
(A) Sample traces showing EPSP and mEPSP amplitudes ± PhTx for indicated genotypes. (B) Average data for mEPSP when UAS-Rop-RNAi is expressed pan-neuronally (c155-GAL4)±Phtx as indicated. PhTx reduces amplitudes in all genotypes; p<0.01. (C) Average data for EPSP as in B; ns, not significant; **p<0.01. (D) Average data for Quantal Content as in B; **p<0.01. (E) Average percent change in mEPSP amplitude and quantal content in PhTx compared to baseline for indicated genotypes; ***p<0.001. (F) Sample traces showing mEPSPs for indicated genotypes (left) and average mEPSP frequencies (Hz) (right). Student’s t-test, two tailed.
Figure 4
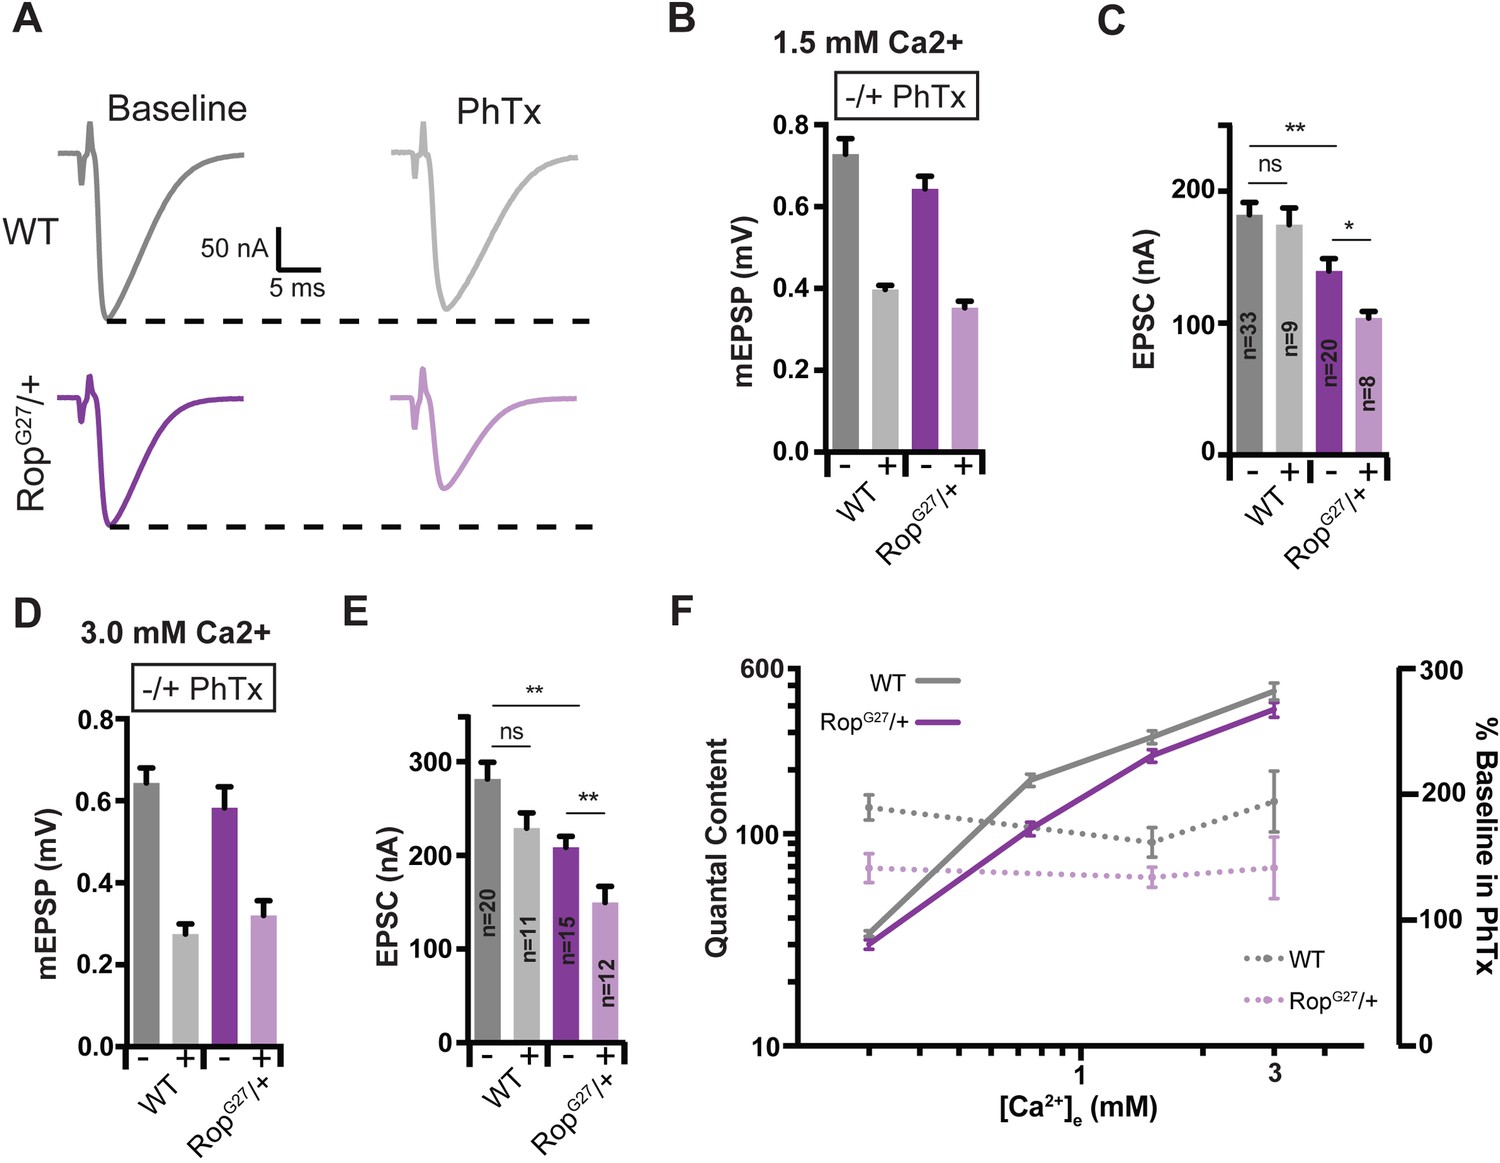
Suppression of Presynaptic Homeostasis is maintained with increased [Ca2+]e in Rop mutants.
(A) Sample EPSC traces in the absence (baseline) and presence (PhTx) of PhTx for WT and heterozygous RopG27 mutant at 1.5 mM extracellular calcium [Ca2+]e. (B) Average data for mEPSP amplitude ± PhTx for indicated genotypes. PhTx application reduces amplitude in all genotypes (p<0.01). Data represent mean ± SEM. (C) Average data for EPSC amplitude as in (B); ns, not significant; **p<0.01, *p<0.05; Student’s t test, two tailed. Sample sizes indicated on bar graph. (D–E) Average mEPSP (D) EPSC (E) ± PhTx for each genotype at 3.0 mM extracellular calcium [Ca2+]e; ns, not significant; **p<0.01; Data represent mean ±SEM. Student’s t-test, two tailed. (F) Relationship between mean quantal content and [Ca2+]e (left axis) and relationship between quantal content normalized to values in the absence of PhTx and [Ca2+]e (right axis) for WT and RopG27 heterozygous mutants.
Figure 5

Decreased Release Probability in Rop Mutants.
(A) Sample EPSC traces (top) and cumulative EPSC amplitudes (bottom) ±PhTx for indicated genotypes. Experiment used 60 Hz stimulation (30 stimuli) in 1.5 mM [Ca2+]e. Red line is fit to cumulative EPSC data and back extrapolated to time zero. (B) Average cumulative EPSC amplitudes ± PhTx for indicated genotypes; ns, not significant. Student’s t-test, two tailed. (C) Average Ptrain ±PhTx for indicated genotypes. Ptrain = 1st EPSC/cumEPSC; ns, not significant; ***p<0.001. (D) Average EPSC amplitudes normalized to the first pulse are plotted against stimulus number for indicated genotypes.
Figure 6

Rop Interacts with rim during Synaptic Homeostasis.
(A) Average data for mEPSP amplitude ±PhTx for WT, heterozygous RopG27/+ mutant heterozygous rim103/+ mutant, and transheterozygous RopG27/rim103 mutant at 0.3 mM [Ca2+]e. PhTx application reduces amplitude in all genotypes (p<0.01). Data represent mean ±SEM. Student’s t test. (B) Average data for EPSP amplitude ±PhTx for indicated genotypes; statistics as in (A); *p<0.05; ***p<0.001; ****p<0.0001, Student’s t-test, two tailed. (C) Average data for Quantal Content ±PhTx for indicated genotypes as in (A); ns, not significant; **p<0.01; ****p<0.0001; Student’s t-test, two tailed. (D) Average data for mEPSP and quantal content normalized to values in the absence of PhTx for indicated genotypes. Statistical comparisons are made within each genotype to baseline in the absence of PhTx. Student’s t-test, two tailed. (E) Each point represents average data from an individual NMJ recording. For WT, recordings in the absence of PhTx are dark gray, those with PhTx are light gray. For RopG27/+, recordings in the absence of PhTx are dark purple, those with PhTx are light purple. For rim103/+, recordings in the absence of PhTx are dark blue, those with PhTx are light blue. For RopG27/rim103, recordings in the absence of PhTx are dark red, those with PhTx are light red. The black line in the WT graph is a curve fit to this control data. The same wild type curve-fit is overlaid on all other genotypes for purposes of comparison. Dotted black lines encompass 95% of wild type data points. These same lines from wild type are superimposed on the graphs for indicated genotypes. (F–H) Average percent change in mEPSP amplitude and quantal content in PhTx compared to baseline for trans heterozygous combinations: RopG27/rbpSTOP1 (F), rim103/+; dunc13P84200/+ (G), rim103/rbpSTOP1 (H); ns, not significant; *p<0.05; Student’s t-test, two tailed.
Figure 7
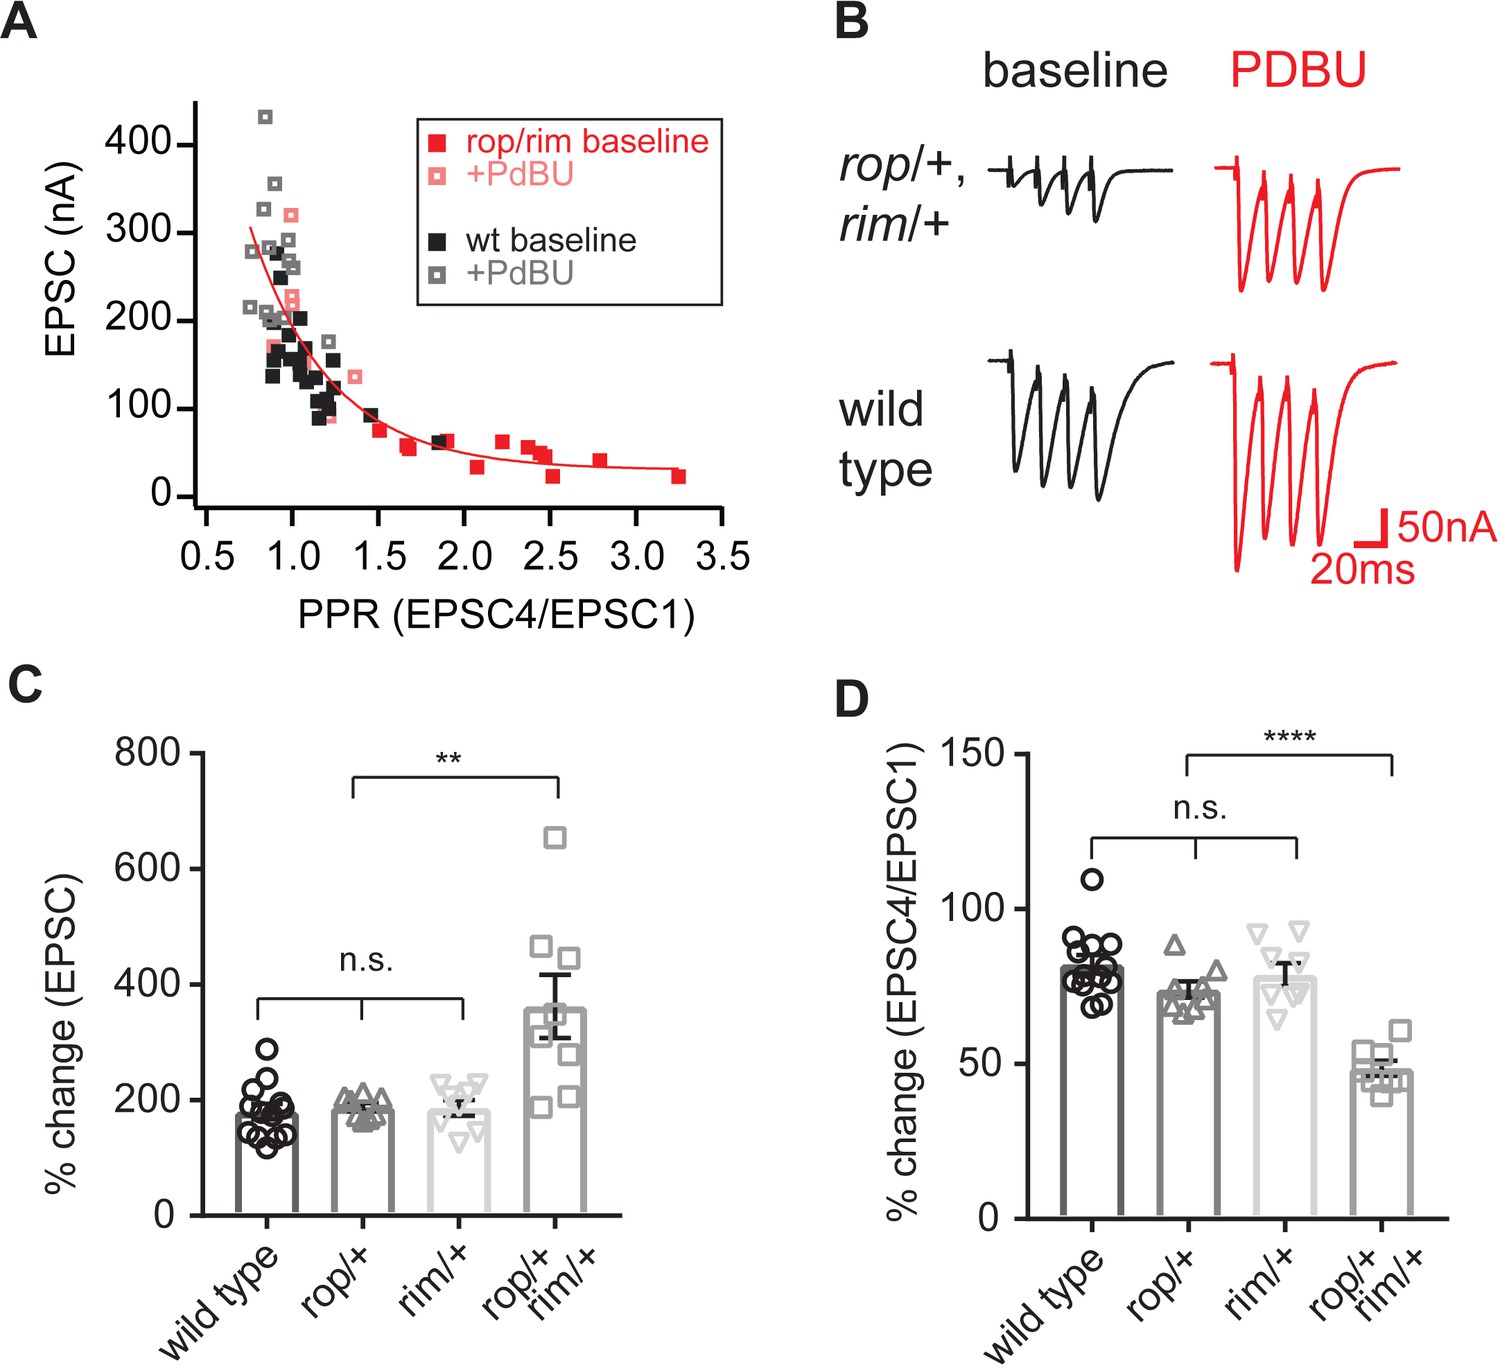
Enhanced action of PdBu at synapses depleted of both Rop and RIM.
(A) Paired-pulse ratio is plotted against initial EPSC amplitude for the indicated genotypes and conditions (in the absence and presence of PdBu). (B) Representative traces for the indicated genotypes in the absence (baseline) and presence of PdBu (PdBu, red). (C) The effect of PdBu application is plotted for wild type controls, the RopG27/rim103 double heterozygous condition and each heterozygous mutation alone. Each genotype is expressed as a percent change in the presence compared to absence of PdBu. Calculations are made on the first EPSC of the stimulus train (EPSC1). The average percent change is statistically significant only in the double heterozygous condition (p<0.01; ANOVA, One Way with Tukey Multiple Comparisons). (D) Data as in (C) plotting the ratio of EPSC4/EPSC1 as a percent change in the presence compared to absence of PdBu. The average percent change is statistically significant only in the double heterozygous condition (p<0.01; ANOVA, One Way with Tukey Multiple Comparisons).
Figure 8
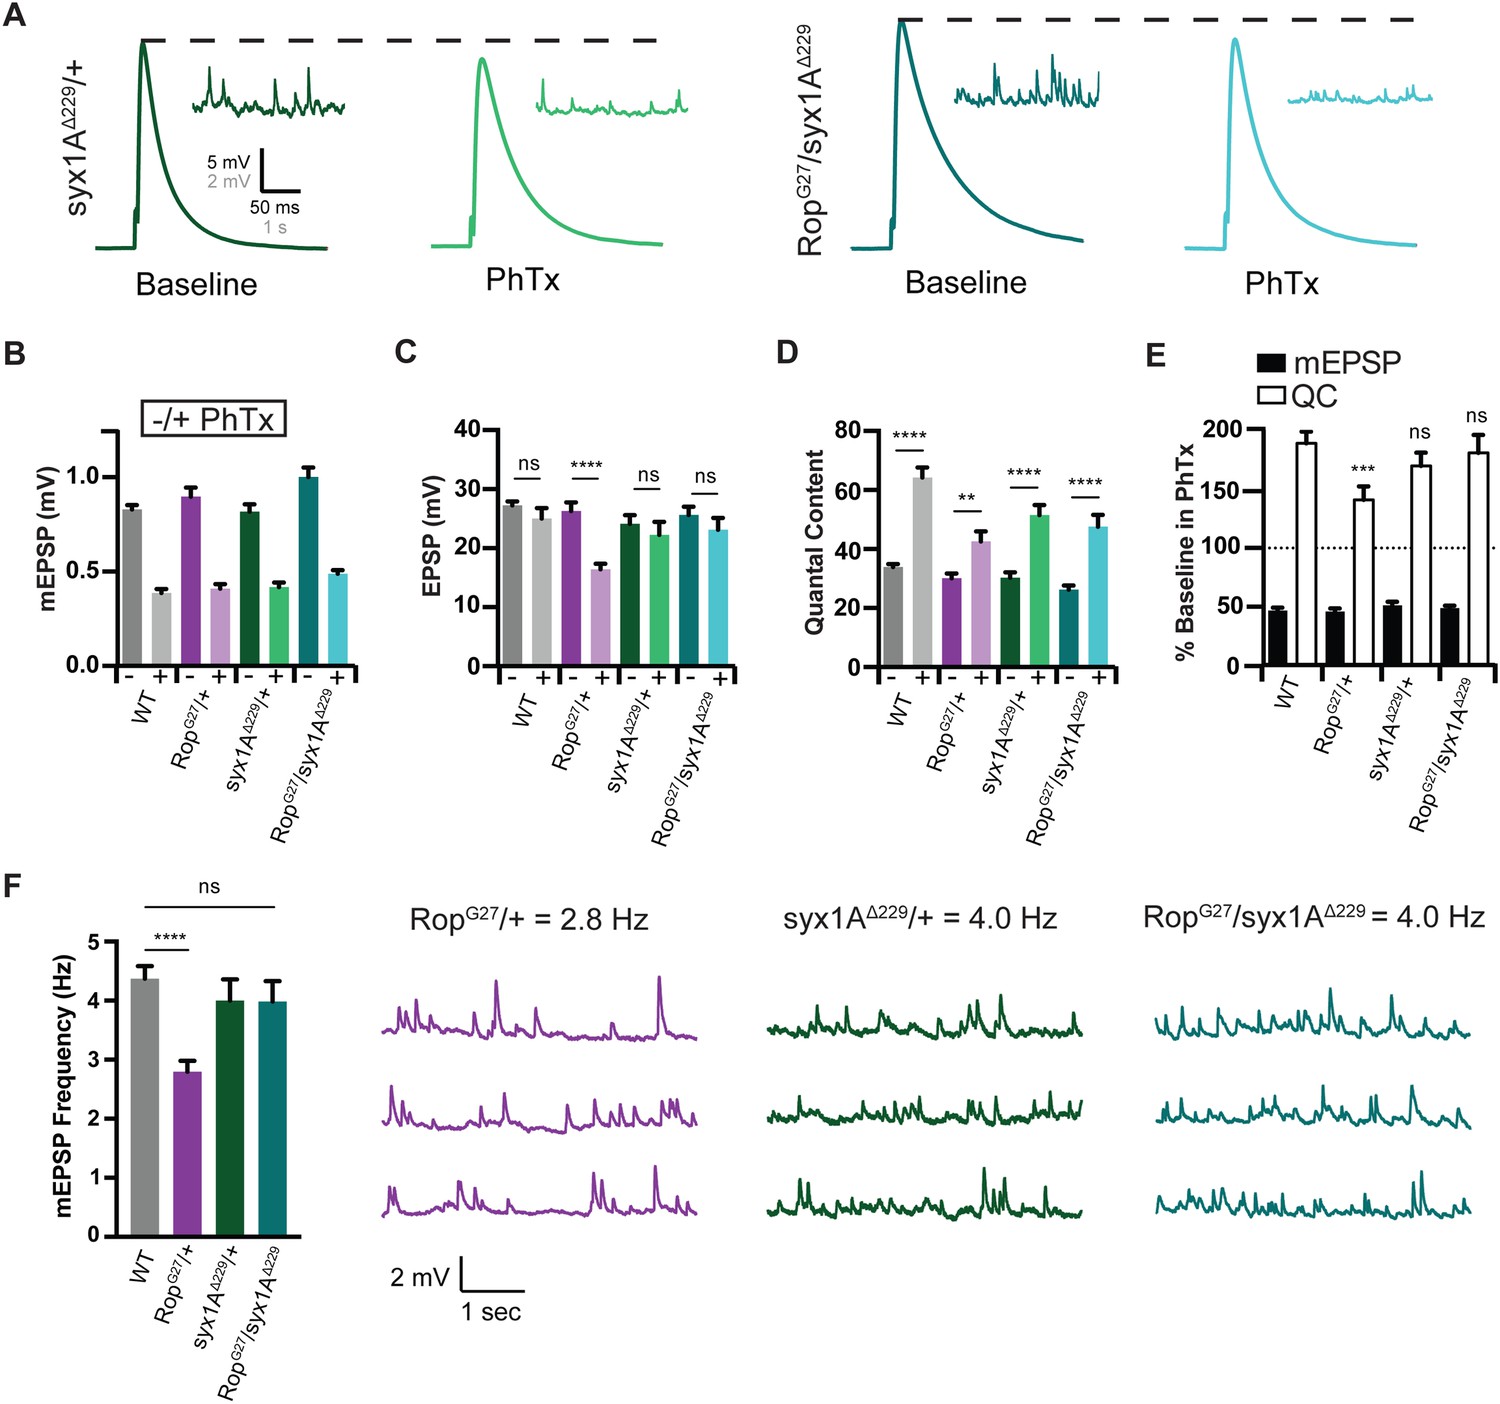
Syx rescues PHP during Synaptic Homeostasis.
(A) Sample traces showing EPSP and mEPSP amplitudes in the absence (baseline) and presence (PhTx) of PhTx for syx1A heterozygous null allele (syx1AΔ229/+) and heterozygous syx1AΔ229 placed in trans with RopG27 mutant (RopG27/syx1AΔ229). (B) Average data for mEPSP amplitude ±PhTx for indicated genotypes. PhTx application reduces amplitude in all genotypes (p<0.01). Data represent mean ±SEM. Student’s t test. (C–E) Average data for EPSP amplitude (C) Quantal Content (D) and mEPSP and quantal content normalized to values in the absence of PhTx (E) for indicated genotypes. Statistical comparisons are made to wild type for each genotype in (E). **p<0.01; ****p<0.0001, Student’s t-test, two tailed. (F) Average mEPSP frequencies (Hz) (left) and sample traces showing mEPSPs for indicated genotypes (right). Student’s t test, two tailed.
Figure 9
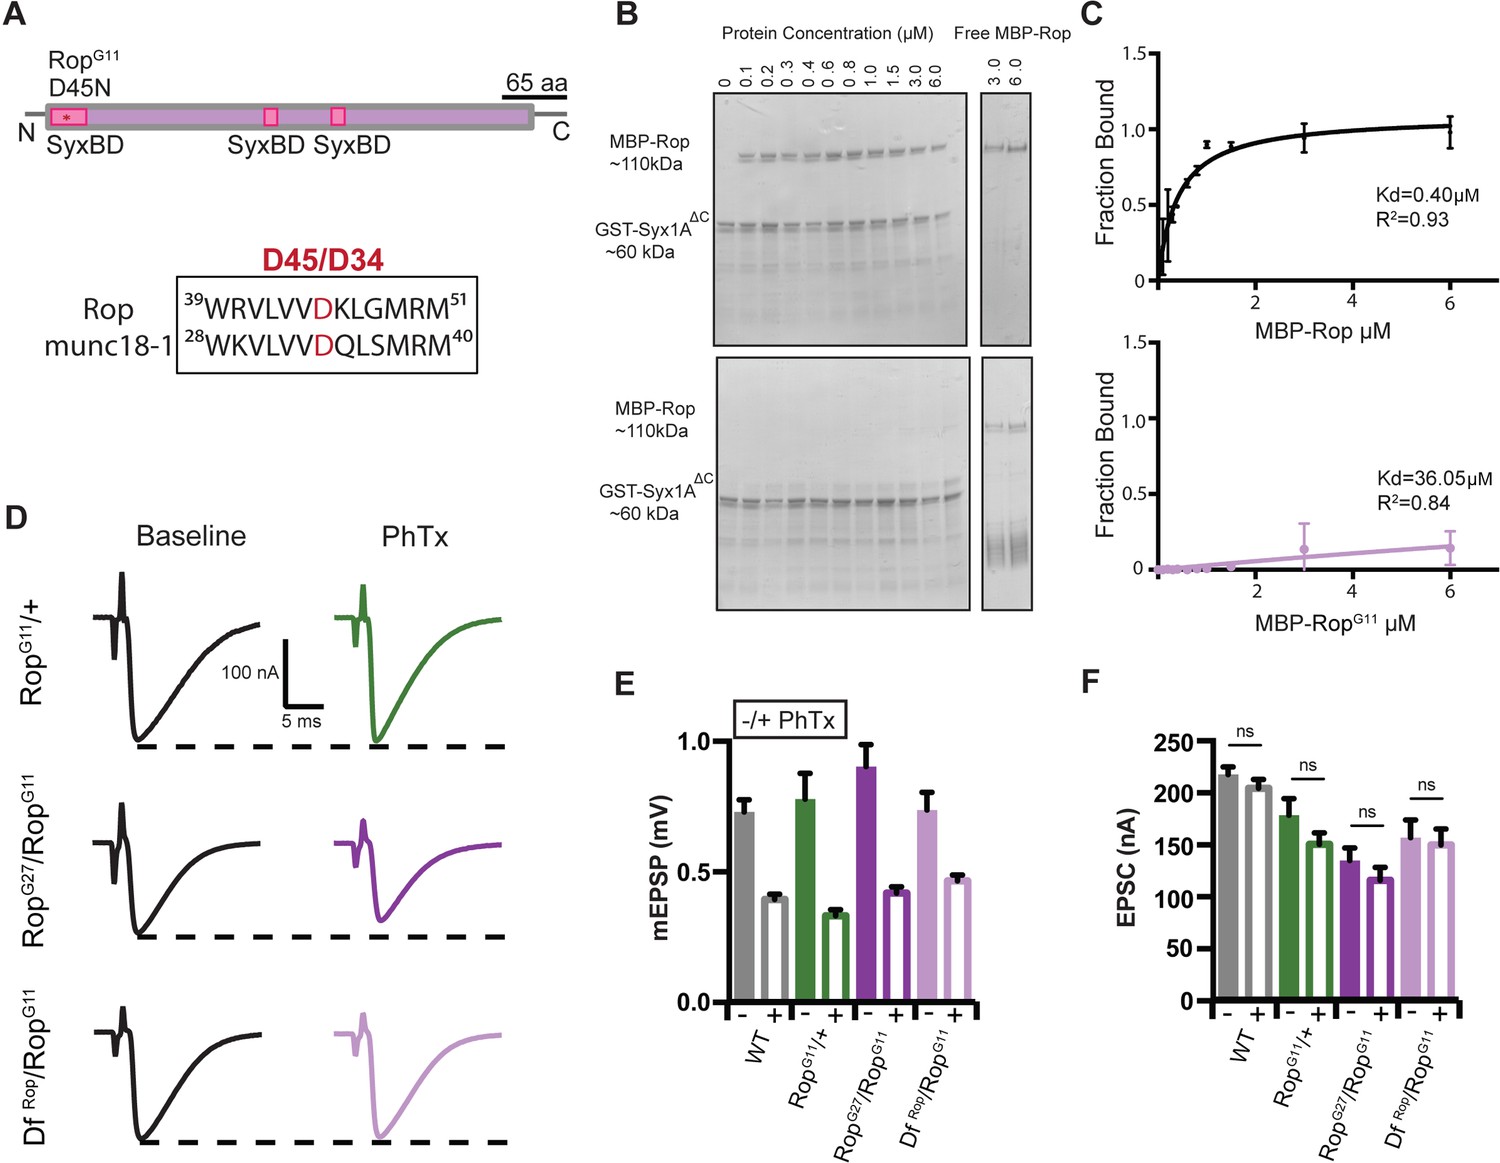
RopG11 abolishes the biochemical interaction between Rop and syx1A and rescues homeostasis defect in Rop.
(A) Schematic of the Drosophila Rop protein. Point mutation RopG11 is indicated by red star at syntaxin-binding domain (SBD) of the Rop protein shown in pink. RopG11 converts Aspartic Acid (D45) to Asparagine (N). This site is conserved in mammalian Rop (munc18-1). (B) Coomassie stains of in vitro binding assays. (left) MBP-Rop (110 kDa) coprecipitated with bead-bound GST fusions of syx1A (GST-syx1AΔC) (60 kDa). MBP-Rop does not bind to GST-syx1AΔC in the presence of single point mutation at the N-terminal of Rop (MBP-RopG11). (right) Free MBP-Rop in the absence of GST-syx1A. (C) Binding curves quantify dissociation constant (Kd) for MBP-Rop and MBP-RopG11 binding to GST-syx1AΔC; x-axis is concentration of MBP recombinant protein used (μM); y-axis is the fraction of protein bound; n = 2 (D) Sample traces showing EPSC amplitudes ± PhTx for RopG11 heterozygous null allele (RopG11/+), heterozygous RopG11 placed in trans with RopG27 mutant (RopG27/RopGG11), and heterozygous RopG11 placed in trans with DfRop (DfRop/RopGG11). (E) Average data for mEPSP amplitude ±PhTx for indicated genotypes. PhTx application reduces amplitude in all genotypes (p<0.01). Data represent mean ±SEM. Student’s t test. two tailed. (F) Average data for EPSC amplitude as in (B); ns, not significant; Student’s t test, two tailed.
Tables
Key resources table
| Reagent type (species) or resource | Designation | Source or reference | Identifiers | Additional information |
|---|---|---|---|---|
| Gene (Drosophila melanogaster) | Rop | NA | FLYB: FBgn0004574 | |
| Gene (D. melanogaster) | Rim | NA | FLYB: FBgn0053547 | |
| Gene (D. melanogaster) | Rbp | NA | FLYB: FBgn0262483 | |
| Gene (D. melanogaster) | unc-13 | NA | FLYB: FBgn0025726 | |
| Gene (D. melanogaster) | Syx1A | NA | FLYB: FBgn0013343 | |
| Strain - strain background | WT - w1118 | NA | w1118 | |
| Genetic reagent (D. melanogaster) | RopG27 | Bloomington Drosophila Stock Center | BDSC: 4381 FLYB FBst0 004381 RRID: DGGR_107715 | Flybase symbol: bw(Aravamudan et al., 1999); Rop[G27] st(Aravamudan et al., 1999)/TM6B, Tb[+] |
| Genetic reagent (D. melanogaster) | DfRop (Df(3L) BSC735) | Bloomington Drosophila Stock Center | BDSC: 26833 FLYB FBst0026833 RRID: BDSC_26833 | Flybase symbol: w[1118]; Df(3L) BSC735/TM6C, Sb (Aravamudan et al., 1999) cu(Aravamudan et al., 1999) |
| Genetic reagent (D. melanogaster) | elavC155- GAL4 | Bloomington Drosophila Stock Center | BDSC: 458 FLYB FBst0000458 RRID: BDSC_458 | Flybase symbol: P{w[+mW.hs]=GawB}elav[C155] |
| Genetic reagent (D. melanogaster) | UAS-Rop RNAi | Vienna Drosophila RNAi Center | VDRC: 19696 FLYB FBst0 453580 RRID: FlyBase_FBst0453580 | Flybase symbol: w[1118]; P{GD1523}v19696/TM3 |
| Genetic reagent (D. melanogaster) | rim103; rim | (Müller et al., 2012b) PMID: 23175813 | ||
| Genetic reagent (D. melanogaster) | rbpSTOP1 | (Liu et al., 2011) PMID: 22174254 | gift from Stephan Sigrist | |
| Genetic reagent (D. melanogaster) | dunc-13P84200 | Kyoto Stock Center | KSC: 101911 RRID: DGGR_101911 | Flybase symbol: ry[506]; P{ry11}l(4)ry16 (Aravamudan et al., 1999) /ci[D] |
| Genetic reagent (D. melanogaster) | syx1AΔ229 | Kyoto Stock Center | KSC: 107713 RRID: DGGR_107713 | Flybase symbol: Syx1A[Delta229] ry[506]/TM3, ry[RK] Sb(Aravamudan et al., 1999) Ser(Aravamudan et al., 1999) |
| Genetic reagent (D. melanogaster) | RopG11 | (Harrison et al., 1994) PMID: 7917291 | gift from Hugo Bellen | |
| Recombinant DNA reagent | PMAL- c5E (vector) | New England Biolabs | NEB: N8110 | |
| Recombinant DNA reagent | PGEX-4T1 (vector) | Addgene | 27-4580-01 | |
| Recombinant DNA reagent | Rop (cDNA) | Drosophila Genomics Resource Center | DGRC: SD04216 | |
| Recombinant DNA reagent | Syx1A (cDNA) | Drosophila Genomics Resource Center | DGRC: LD43943 | |
| Recombinant DNA reagent | PMAL-RopWT (plasmid) | This paper | Primers CGCGGATCCATGGCCTTGAAAGTGCTGGTGG and CC GGAATTCTTAGTCCTCC TTCGAGAGACTGC were used to amplify Rop, which was then cloned into PMAL-5ce vector | |
| Recombinant DNA reagent | PMAL-RopG11 (plasmid) | This paper | Generated using site-directed mutageneis with primer GGCGGGTGCTGGTGGTGAACAAGCTGGGTATGCGC | |
| Recombinant DNA reagent | PGEX-Syx1AΔC (plasmid) | This paper | Primers CGCGGATCCA TGACTAAAGA CAGATTAGCCG and TCCCCCGGG TTACATGAAATAAC TGCTAACAT were used to amplify Syx1A, which was then cloned into PGEX-4T1, site- directed mutagenesis with primer GTAAAGCCCGA CGAAAG TAGATCATGAT ACTGATC was used to remove the C-terminal tail | |
| Peptide, recombinant protein | MBP-RopWT /MBP-RopG11 | This paper | Recombinant MBP-Rop was expressed from PMAL-Rop in RosettaTM cells, purified using amylose resin, and eluted with maltose | |
| Peptide, recombinant protein | GST-Syx1AΔC | This paper | Recombinant GST-Syx1AΔC was expressed from PGEX- Syx1AΔC in RosettaTM, purified using GST resin, and eluted with glutathione | |
| Commercial assay or kit | QuikChange Lightning Site- Directed Mutagenesis Kit | Agilent | 210518 | |
| Commercial assay or kit | Coomassie Blue R-250 Solution | TekNova | C1050 | |
| Chemical compound, drug | Phorbol 12-myristate 13-acetate Phorbol Ester (PdBU) | Sigma-Aldrich | Sigma- Aldrich CAS: 16561-29-8 | Stock concentration: 10 mM Final Concentration (in HL3 saline): 1 μM |
| Chemical compound, drug | Philanthotoxin- 433 (PhTX) | Sigma-Aldrich (disc.) Santa Cruz Biotech. | Sigma Aldrich CAS: 276684-27-6 Santa Cruz Biotech. sc-255421 | Stock concentration: 5 mM Final Concentration (in HL3 saline): 10–20 μM |
| Software, algorithm | Sharp- electrode recordings | Molecular Devices | Clampex (10.3.1.5) | |
| Software, algorithm | EPSP analysis | Molecular Devices | Clampfit (10.3.1.5) | |
| Software, algorithm | EPSC and Pr analysis | Wave-Metrics | Igor Pro (6.3.4.1) RRID: SCR_000325 | custom script |
| Software, algorithm | RRP, train analysis | (Müller et al., 2015) | ||
| Software, algorithm | mEPSP analysis | Synaptosoft | Mini Analysis 6.0.7 RRID: SCR_002184 | |
| Software, algorithm | GraphPad Prism (7.0 c) | GraphPad | RRID: SCR_002798 | |
| Software, algorithm | Fiji | NIH | RRID: SCR_002285 | |
| Other | Amylose Resin | New England Biolabs | NEB: E8021 | used to purify MBP recombi nant protein |
| Other | GST Bind Resin | Novagen | 70541 | used to purify GST recombinant protein and for pull-down of recombinant protein |
Additional files
-
Supplementary file 1
Summary of raw data.
- https://doi.org/10.7554/eLife.40385.012
-
Transparent reporting form
- https://doi.org/10.7554/eLife.40385.013
Download links
A two-part list of links to download the article, or parts of the article, in various formats.
Downloads (link to download the article as PDF)
Open citations (links to open the citations from this article in various online reference manager services)
Cite this article (links to download the citations from this article in formats compatible with various reference manager tools)
Molecular mechanisms that stabilize short term synaptic plasticity during presynaptic homeostatic plasticity
eLife 7:e40385.
https://doi.org/10.7554/eLife.40385


