NLRP12 suppresses hepatocellular carcinoma via downregulation of cJun N-terminal kinase activation in the hepatocyte
- UT Southwestern Medical Center, United States
- MD Anderson Cancer Center, United States
Figures
Figure 1 with 1 supplement
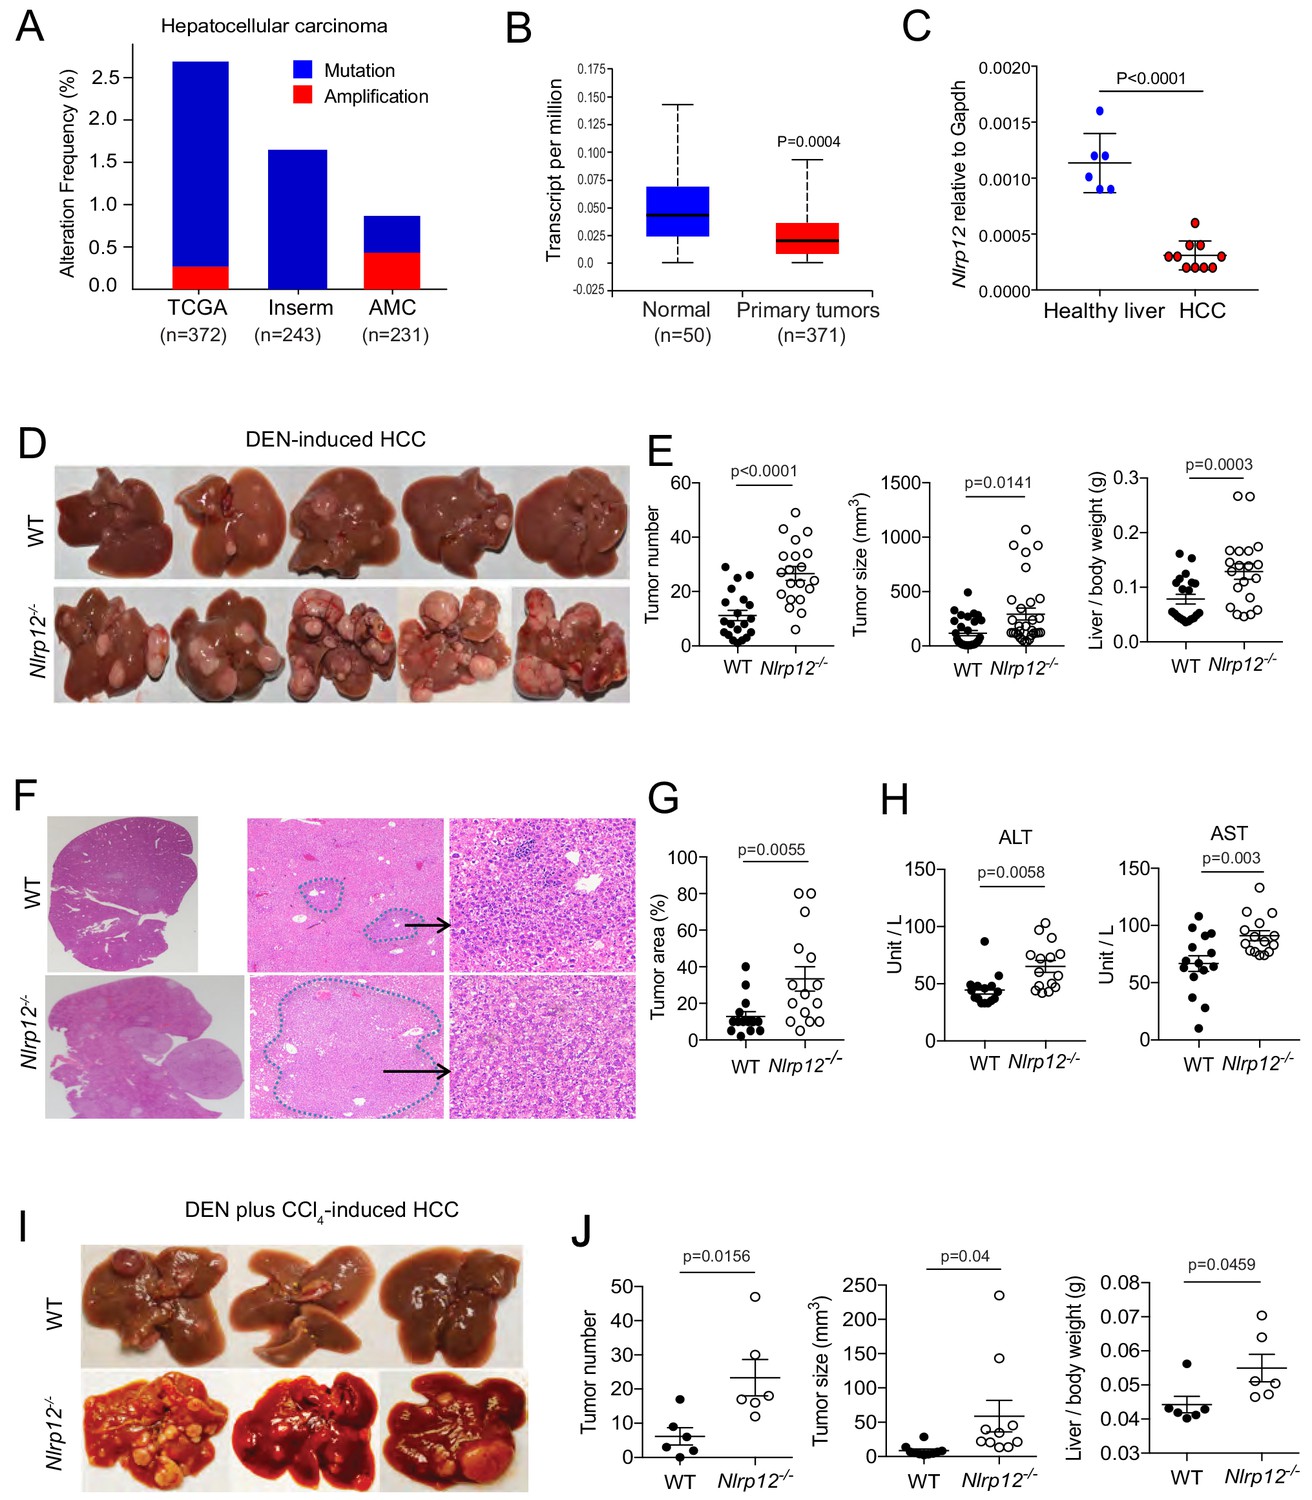
NLRP12 negatively regulates hepatocellular carcinoma.
(A) Analysis of genetic association of NLRP12 in HCC using the TCGA database through the cBioportal online platform. (B) Analysis of NLRP12 expression in human normal liver and HCC RNA-seq data in the TCGA database through the UALCAN web-portal. Data are presented in a box plot where whiskers represent maximum and minimum variables. (C) WT mice were injected with DEN (25 mg/kg i.p.) at the age of 14 days or left untreated. Livers from DEN-treated (n = 10) and untreated mice (n = 6) were analyzed for the expression of Nlrp12 by real-time qPCR. Data represent means ± SEM. (D–H) WT mice (n = 20) and Nlrp12-/- (n = 20) were injected with DEN (25 mg/kg i.p.) at the age of 14 days and sacrificed at 10 months after DEN injection. (D) Representative images of liver tumors are shown. (E) The number of tumors per liver, tumor sizes, and liver to body weight ratios were measured. Data represent means ± SEM (n = 20). Statistical difference was determined by two-tailed unpaired t-test. (F) Livers from mice described in D were stained for H and E. Representative H and E-stained sections are shown. (G) H and E-stained liver sections were histopathologically examined for adenoma development. Data represent means ± SEM (n = 15). Statistical difference was determined by two-tailed unpaired t-test. (H) Serum ALT and AST levels in tumor-bearing mice. Data represent means ± SEM (n = 15). Statistical difference was determined by two-tailed unpaired t-test. (I–J) WT (n = 6) and Nlrp12-/- (n = 6) mice were injected with DEN (25 mg/kg i.p.) at the age of 14 days followed by eight weekly injections of CCl4 (0.5 ml/kg i.p., dissolved in corn oil) starting at 10 weeks of age and euthanized at the age of 6 months. (I) Representative images of liver tumors are shown. (J) The numbers, sizes, and liver to body weight ratio were measured. Data represent means ± SEM. Statistical difference was determined by two-tailed unpaired t-test.
-
Figure 1—source data 1
NLRP12 negatively regulates hepatocellular carcinoma.
- https://doi.org/10.7554/eLife.40396.005
Figure 1—figure supplement 1

Nlrp12-deficiency doesn’t induce HCC in healthy untreated control mice.
(A) A model for DEN-induced liver carcinogenesis. Mice are injected with DEN (25 mg/kg) at the age of 14 days after birth. 10 months following DEN injection, mice were scarified to measure tumor burden. (B) A dodel for DEN plus CCl4-induced HCC. Mice were injected with DEN (25 mg/kg) at the age of 14 days followed by eight weekly injections of CCl4 (0.5 ml/kg i.p., dissolved in corn oil) starting at 10 weeks of age. Mice were euthanized at the age of 6 months. (C–E) WT and Nlrp12-/- healthy mice were sacrificed at 10 months after birth and livers were examined. (C) Representative images of the liver from healthy 10 month-old WT and Nlrp12-/- mice. (D) Liver sections were examined following H and E staining. (E) Serum ALT and AST levels of 10-month-old untreated control mice. Data represent means ± SEM (n = 5).
-
Figure 1—figure supplement 1—source data 1
Nlrp12-deficiency doesn’t alter liver fucntion in healthy mice.
- https://doi.org/10.7554/eLife.40396.004
Figure 2 with 1 supplement
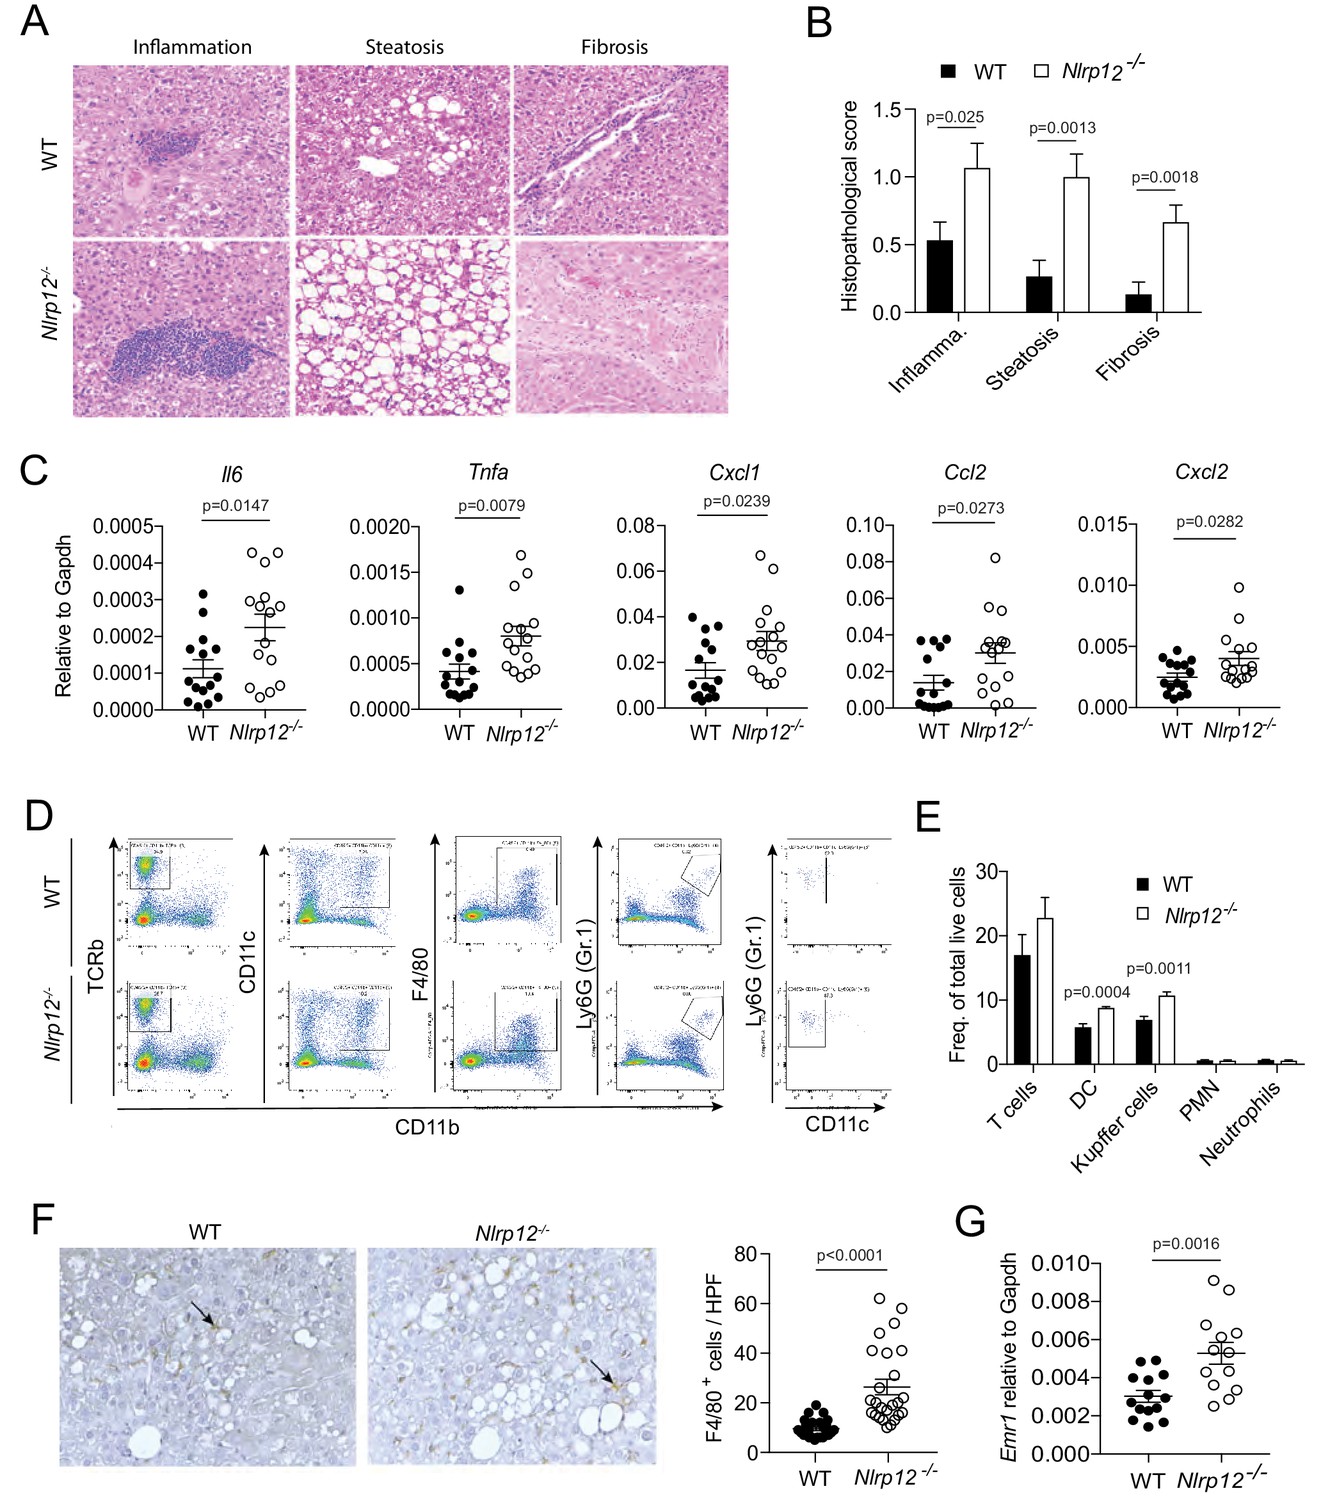
NLRP12-deficiency leads to increased inflammation in the liver.
WT and Nlrp12-/- mice were injected with DEN (25 mg/kg i.p.) at the age of 14 days and euthanized 10 months later. (A–B) H and E-stained liver sections were examined histopathologically and scored for inflammation, steatosis, and fibrosis. Representative images of inflammation, steatosis, and fibrosis are shown. Data represent means ± SEM (n = 15). Statistical difference was determined by two-tailed unpaired t-test. (C) Real-time qPCR analysis of cytokines and chemokines in the HCC tissues. Data represent means ± SEM (n = 15). Statistical difference was determined by two-tailed unpaired t-test. (D) Tumor tissues were analyzed for the quantification of T cells (CD45+, TCRb+, CD11b-), dendritic cells (CD45+, CD11b+, CD11c+high, Gr1-), Kupffer cells (CD45+, CD11b+, F4/80+, Gr1-), and neutrophils (CD45+, CD11b+, Gr1+, CD11c-) by flow cytometry. (E) Relative abundance of different immune cell types was analyzed by FlowJo software. Data represent means ± SEM (n = 5). Statistical difference was determined by two-tailed unpaired t-test. (F) Formalin-fixed and paraffin-embedded HCC sections were stained with F4/80 antibody and the number of F4/80+ cells (brown) per high power field (20X) was counted. The picture shows representative immunostaining of F4/80 (brown). Data represent means ± SEM (n = 25). Statistical difference was determined by two-tailed unpaired t-test. (G) The expression of Emr1 (F4/80) in the HCC tissues was measured by real-time PCR. Data represent means ± SEM (n = 13–14). Statistical difference was determined by two-tailed unpaired t-test.
-
Figure 2—source data 1
NLRP12-deficiency leads to increased inflammation in the liver.
- https://doi.org/10.7554/eLife.40396.009
Figure 2—figure supplement 1

NLRP12 suppresses inflammatory responses in HCC tissue.
(A–D) WT and Nlrp12-/- mice were injected with DEN (25 mg/kg i.p.) at the age of 14 days followed by eight weekly injections of CCl4 (0.5 ml/kg i.p., dissolved in corn oil) starting at 10 weeks of age and sacrificed at the age of 6 months. (A) Formalin-fixed liver sections were stained with H and E. Representative images showing adenoma, inflammation, steatosis, and fibrosis. (B) Percentage of area covered by adenoma. Data represent means ± SEM (n = 5). *p<0.05. **p<0.01. Statistical difference was determined by two-tailed unpaired t-test. (C) Histopathological scorings for inflammation, steatosis and fibrosis. Data represent means ± SEM (n = 5). *p<0.05. **p<0.01. Statistical difference was determined by two-tailed unpaired t-test. (D) The expression of indicated genes in HCC tissues was measured by real-time qPCR. Data represent means ± SEM (n = 6). *p<0.05. **p<0.01. Statistical difference was determined by two-tailed unpaired t-test. (E–F) WT and Nlrp12-/- mice were injected with DEN (25 mg/kg i.p.) at the age of 14 days and euthanized at 10 months. (E) The levels of IL-6, TNFα, and KC (CXCL1) in HCC lysates were measured by ELISA. Data represent means ± SEM (n = 9). Statistical difference was determined by two-tailed unpaired t-test. (F) Real-time qPCR analysis of IL-17, IFNγ, and IL-4 in HCC tissues. Data represent means ± SEM (n = 15). (G) Livers from untreated WT and Nlrp12-/- mice at 10 months after birth were collected and the expression of F4/80 gene was measured by real-time qPCR. Data represent means ± SEM (n = 5).
-
Figure 2—figure supplement 1—source data 1
NLRP12 suppresses inflammatory responses during HCC.
- https://doi.org/10.7554/eLife.40396.008
Figure 3 with 1 supplement
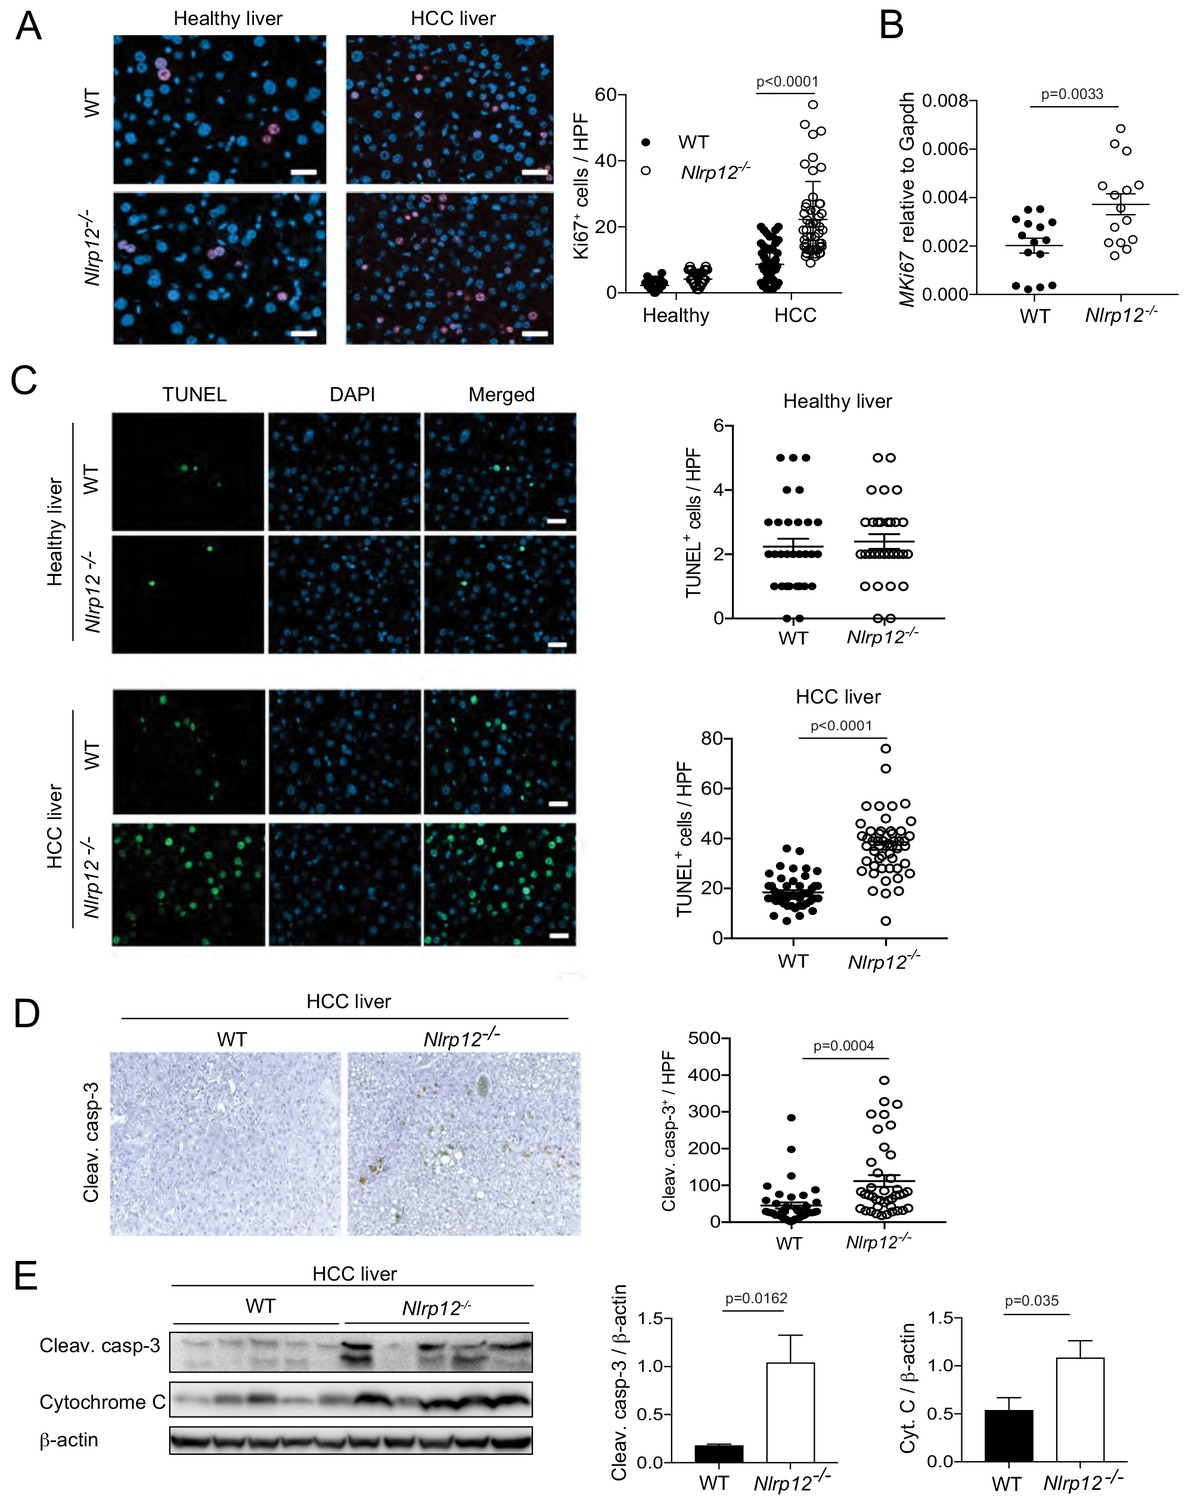
Increased HCC in Nlrp12-/- mice is associated with increased cell death and proliferation in the livers.
WT and Nlrp12-/- were injected with DEN (25 mg/kg i.p.) or PBS (healthy control) at the age of 14 days and sacrificed at 10 months after DEN administration. (A) Liver tissue sections from healthy controls and DEN-treated mice were immunostained with Ki67 antibody and the number of Ki67-positive cells was counted under 20X objective. Data were collected from at least 10 fields per liver section and three mice/group. Data represent means ± SEM (n = 50). Statistical difference was determined by two-tailed unpaired t-test. (B) The expression of Ki67 in tumor tissues was measured by real-time qPCR. Data represent means ± SEM (n = 15; each sample represents individual mouse). Statistical difference was determined by two-tailed unpaired t-test. (C) Apoptosis in the healthy and HCC livers were measured by TUNEL assay. The number of TUNEL-positive cells (green) under 20X objective was counted and plotted as individual values. Data were collected from at least 10 fields per liver section and three mice/group. Data represent means ± SEM. Statistical difference was determined by two-tailed unpaired t-test. (D) Liver sections from DEN-treated mice (n = 3) were immunostained for cleaved caspase-3 (brown). Cleaved caspase-3 positive cells were counted under 20X objective. Data represent means ± SEM (n = 40). Statistical difference was determined by two-tailed unpaired t-test. (E) Liver tumor lysates were immunoblotted with anti-cleaved caspase-3, cytochrome c, and β-actin. The band intensities of caspase-3 and cytochrome c were measured. Data represent means ± SEM (n = 5; each sample represents individual mouse). Statistical difference was determined by two-tailed unpaired t-test.
-
Figure 3—source data 1
Measurement of cell death and proliferation in WT and Nlrp12-deficient HCC.
- https://doi.org/10.7554/eLife.40396.013
Figure 3—figure supplement 1
NLRP12 regulates hepatocyte death and proliferation during HCC.
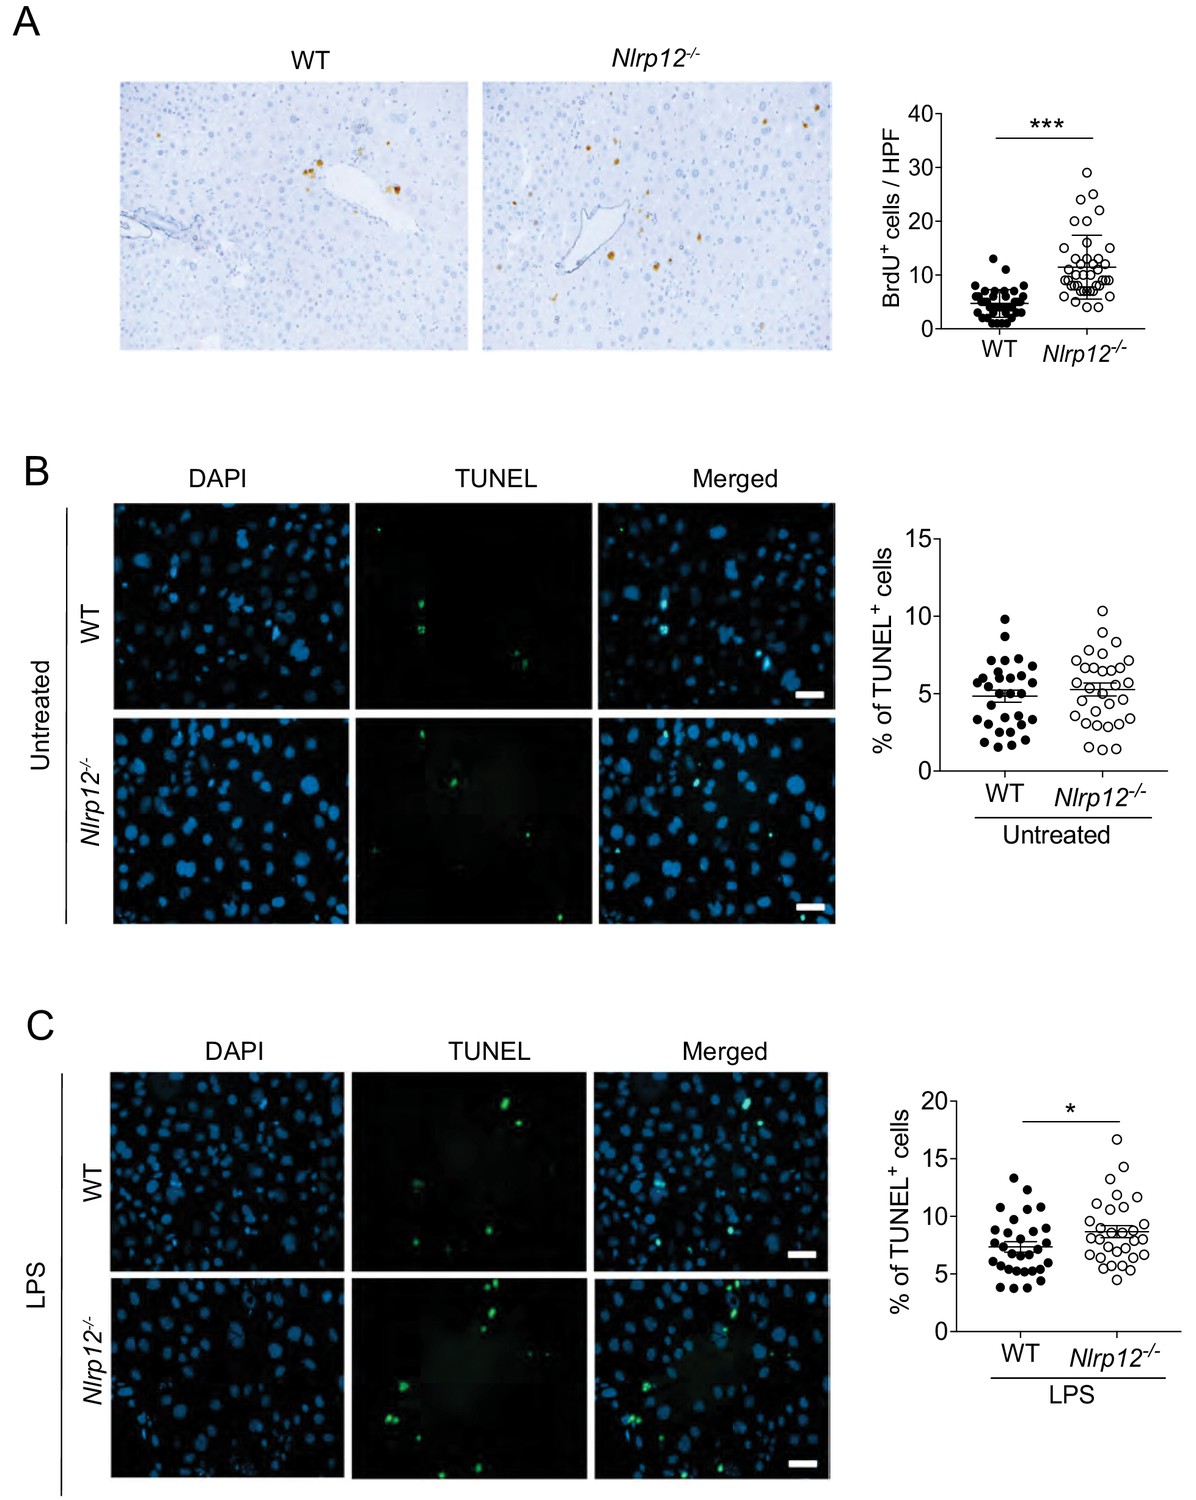
(A) DEN-treated mice at 10 months were injected with BrdU at 2 hr before sacrifice (n = 5/group) via i.p. Formalin-fixed liver sections were immunostained with BrdU antibody. The number of BrdU-positive cells (brown) per HPF was counted. The analysis includes counting from 10 to 15 fields/section (under 20X objective) and three mice/group. Data represent means ± SEM. *p<0.05. **p<0.01. Statistical difference was determined by two-tailed unpaired t-test. (B and C) Primary hepatocytes were grown on cover slip, treated with or without LPS for 24 hr, and stained for TUNEL (green). The number of TUNEL-positive cells were counted from 30 fields. Data are representative of three independent experiments. Data represent means ± SEM. *p<0.05. **p<0.01. Statistical difference was determined by two-tailed unpaired t-test.
-
Figure 3—figure supplement 1—source data 1
NLRP12 regulates hepatocyte death and proliferation.
- https://doi.org/10.7554/eLife.40396.012
Figure 4 with 1 supplement
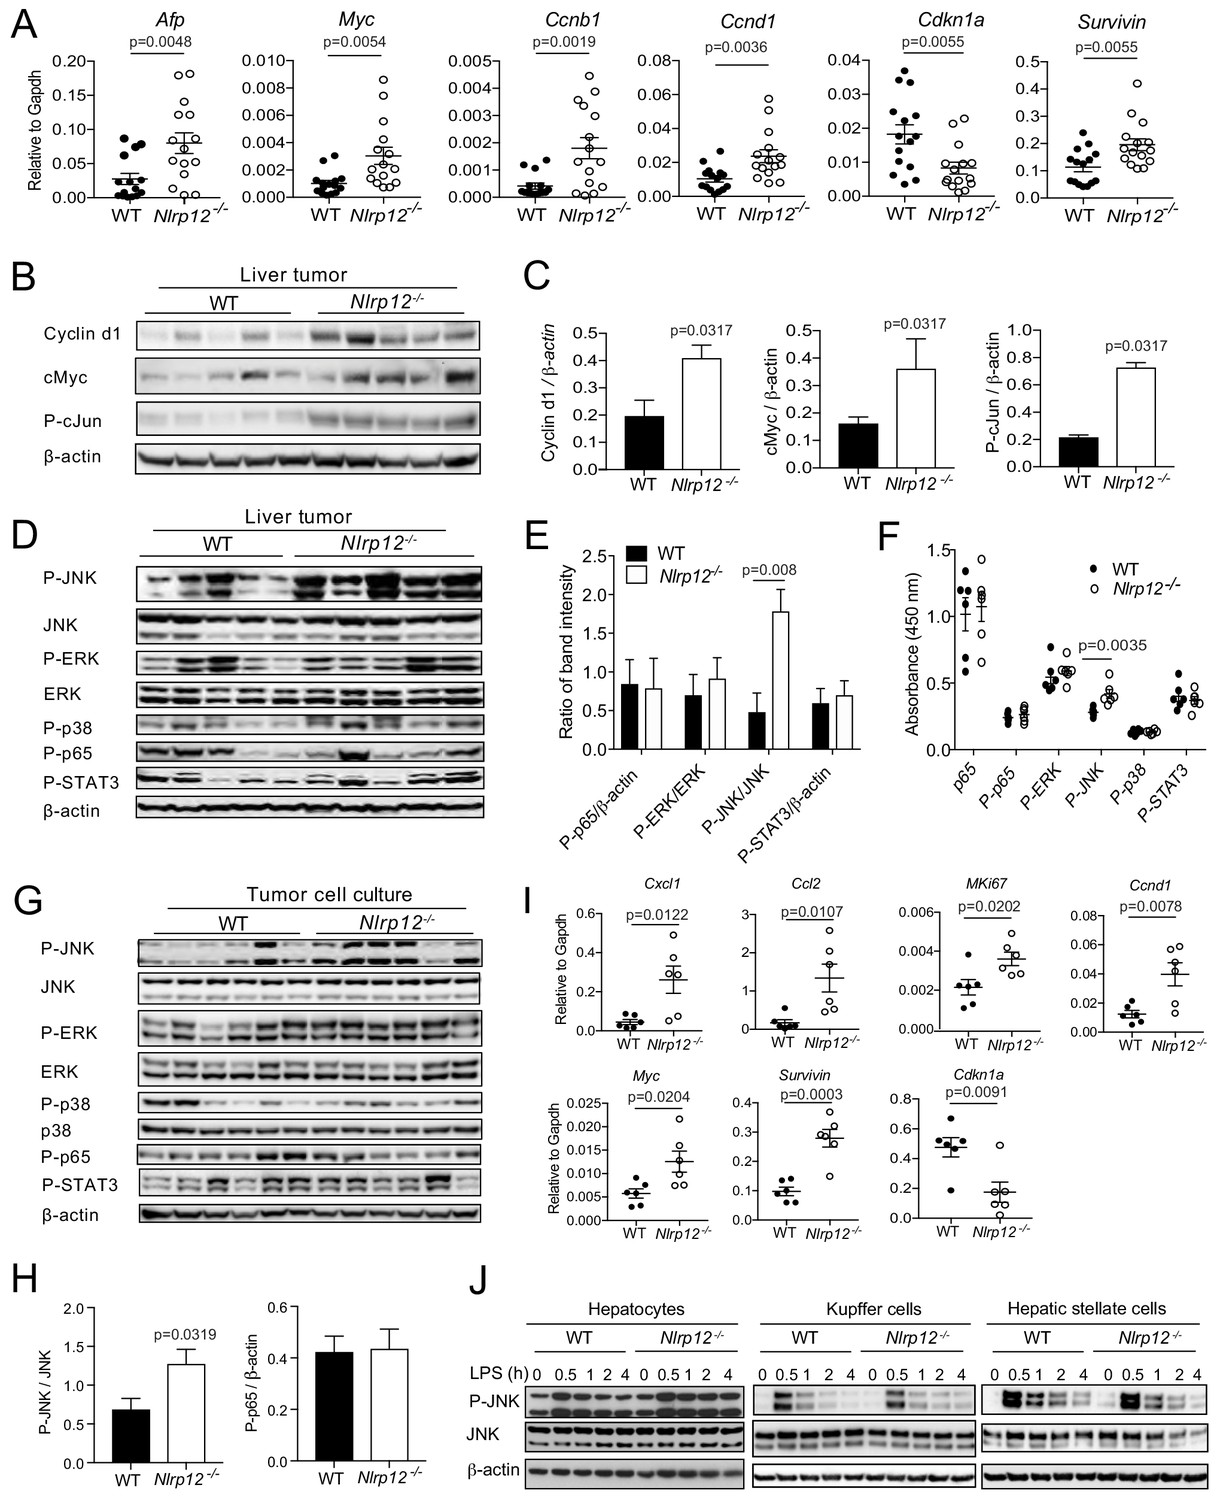
NLRP12-deficiency leads to increased expression of proliferative genes and activation of the JNK pathway.
WT (n = 15) and Nlrp12-/- (n = 15) mice were injected with DEN (25 mg/kg i.p.) at the age of 14 days and euthanized at 10 months later. (A) Liver tumor tissues were analyzed for the expression of the indicated genes by real-time qPCR. Data represent means ± SEM (n = 15; each sample represents individual mouse). Statistical difference was determined by two-tailed unpaired t-test. (B) Liver tumor lysates were immunoblotted for Cyclin d1, cMyc, and P-cJun. β-actin was used as a loading control. (C) Band intensities of Cyclind1, cMyc, and P-cJun were measured. Data represent means ± SEM (n = 5, each sample represents individual mouse). Statistical difference was determined by two-tailed unpaired t-test. (D) Liver tumor lysates were analyzed for the activation of JNK, ERK, p38, p65, and STAT3 by Western blotting. β-actin was used as a loading control. Each lane represents individual mouse. (E) Band intensities of P-JNK, P-ERK, P-p65, and P-STAT3 shown in D were measured. Data represent means ± SEM (n = 5). Statistical difference was determined by two-tailed unpaired t-test. (F) The levels in p65, P-p65, P-ERK, P-JNK, P-p38, and P-STAT3 in tumor lysates (0.5 mg/ml) from different mice were measured by ELISA. Data represent means ± SEM (n = 6). Statistical difference was determined by two-tailed unpaired t-test. (G) Hepatocytes were isolated from liver tumors and analyzed for the activation of JNK, ERK, p38, p65, and STAT3 by Western blotting. Each lane represents individual mouse sample. (H) Densitometric analysis of P-JNK, and P-p65 immunoreactive bands are shown. Data represent means ± SEM (n = 6). Statistical difference was determined by two-tailed unpaired t-test. (I) RNA isolated from the tumor hepatocytes was analyzed for the expression of chemokines and proliferative genes. Data represent means ± SEM (n = 6, each sample represents individual mouse). Statistical difference was determined by two-tailed unpaired t-test. (J) Hepatocytes, Kupffer cells, and hepatic stellate cells were isolated from liver tumors and stimulated with LPS (1 ug/ml). Activation of JNK was measured by Western blotting.
-
Figure 4—source data 1
NLRP12 suppresses activation of JNK and expression of tumor-promoting molecules during HCC.
- https://doi.org/10.7554/eLife.40396.017
Figure 4—figure supplement 1
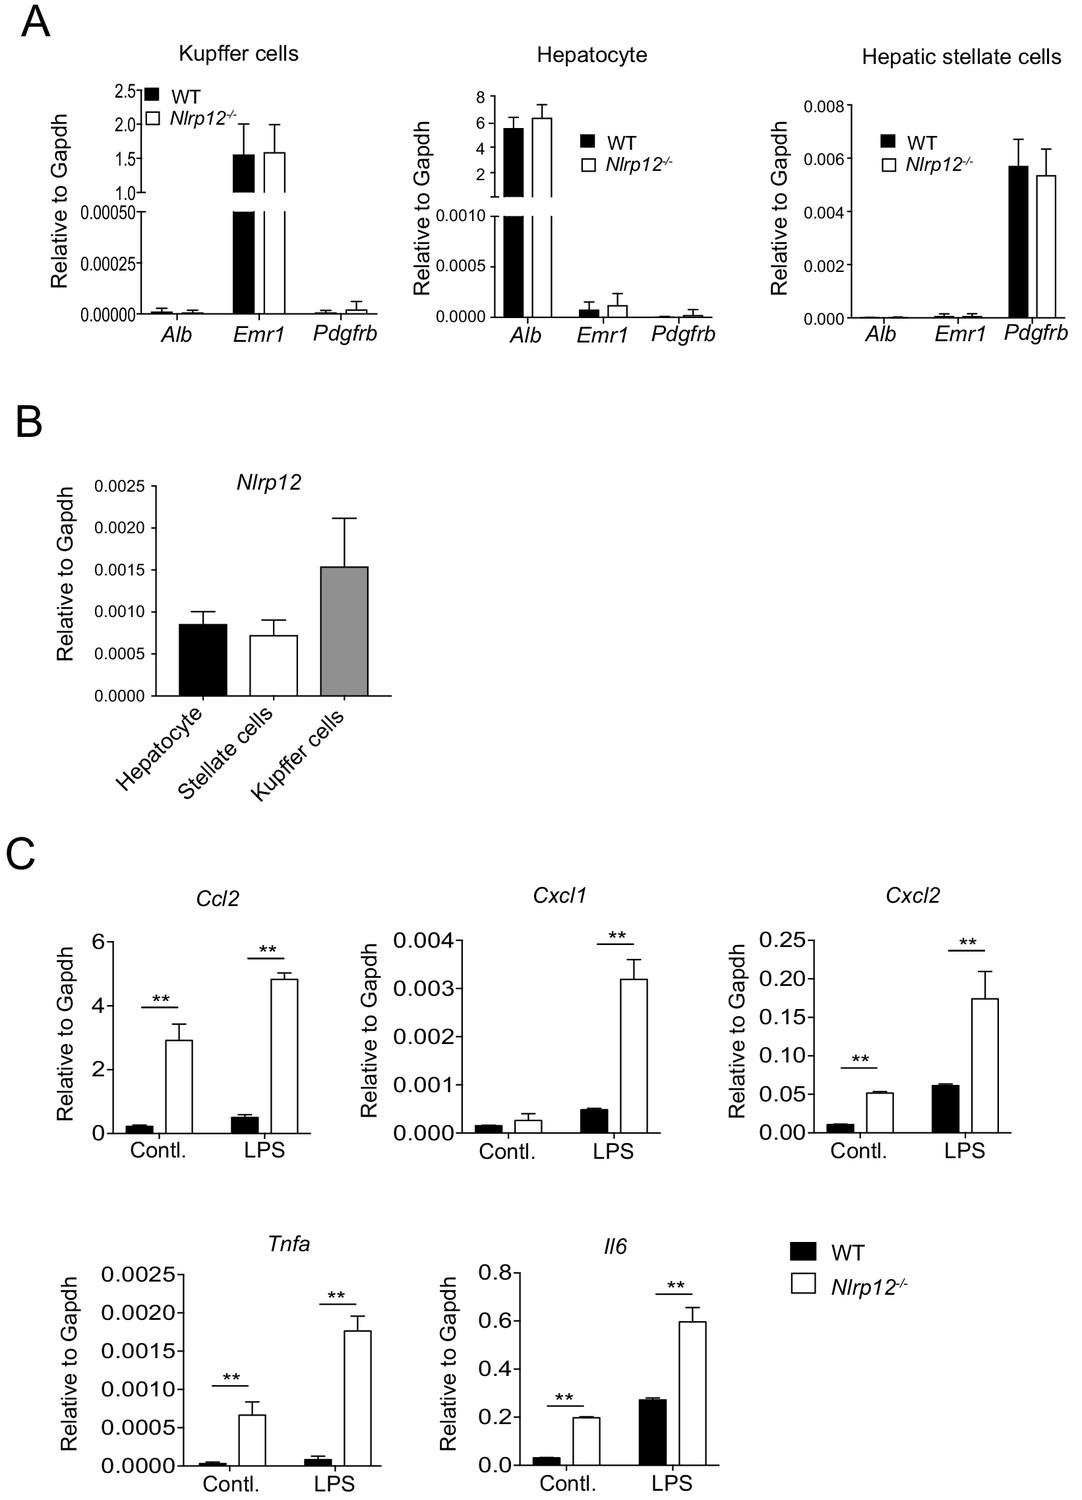
NLRP12 downregulates induction of inflammatory molecules in tumor hepatocytes.
WT and Nlrp12-/- mice were injected with DEN (25 mg/kg i.p.) at the age of 14 days and euthanized at 10 months later. (A) Hepatocytes, Kupffer cells, and hepatic stellate cells were isolated from liver tumor tissues. The expression of albumin (Alb), Emr1, and Pdgfr-b in the isolated cell population was measured real-time qPCR. Data represent means ± SD (n = 3). (B) The expression of Nlrp12 in hepatocytes, Kupffer cells, and hepatic stellate cells was measured by real-time qPCR. Data represent means ± SD (n = 3). (C) Hepatocytes isolated from liver tumors at 10 months following DEN administration were cultured and stimulated with LPS for 4 hr. The expression of indicated genes was measured by real-time qPCR. Data represent means ± SD (n = 3). *p<0.05. **p<0.01, ***p<0.001. Statistical difference was determined by two-tailed unpaired t-test.
-
Figure 4—figure supplement 1—source data 1
NLRP12 regulates inflammatory responses in tumor hepatocytes.
- https://doi.org/10.7554/eLife.40396.016
Figure 5 with 1 supplement
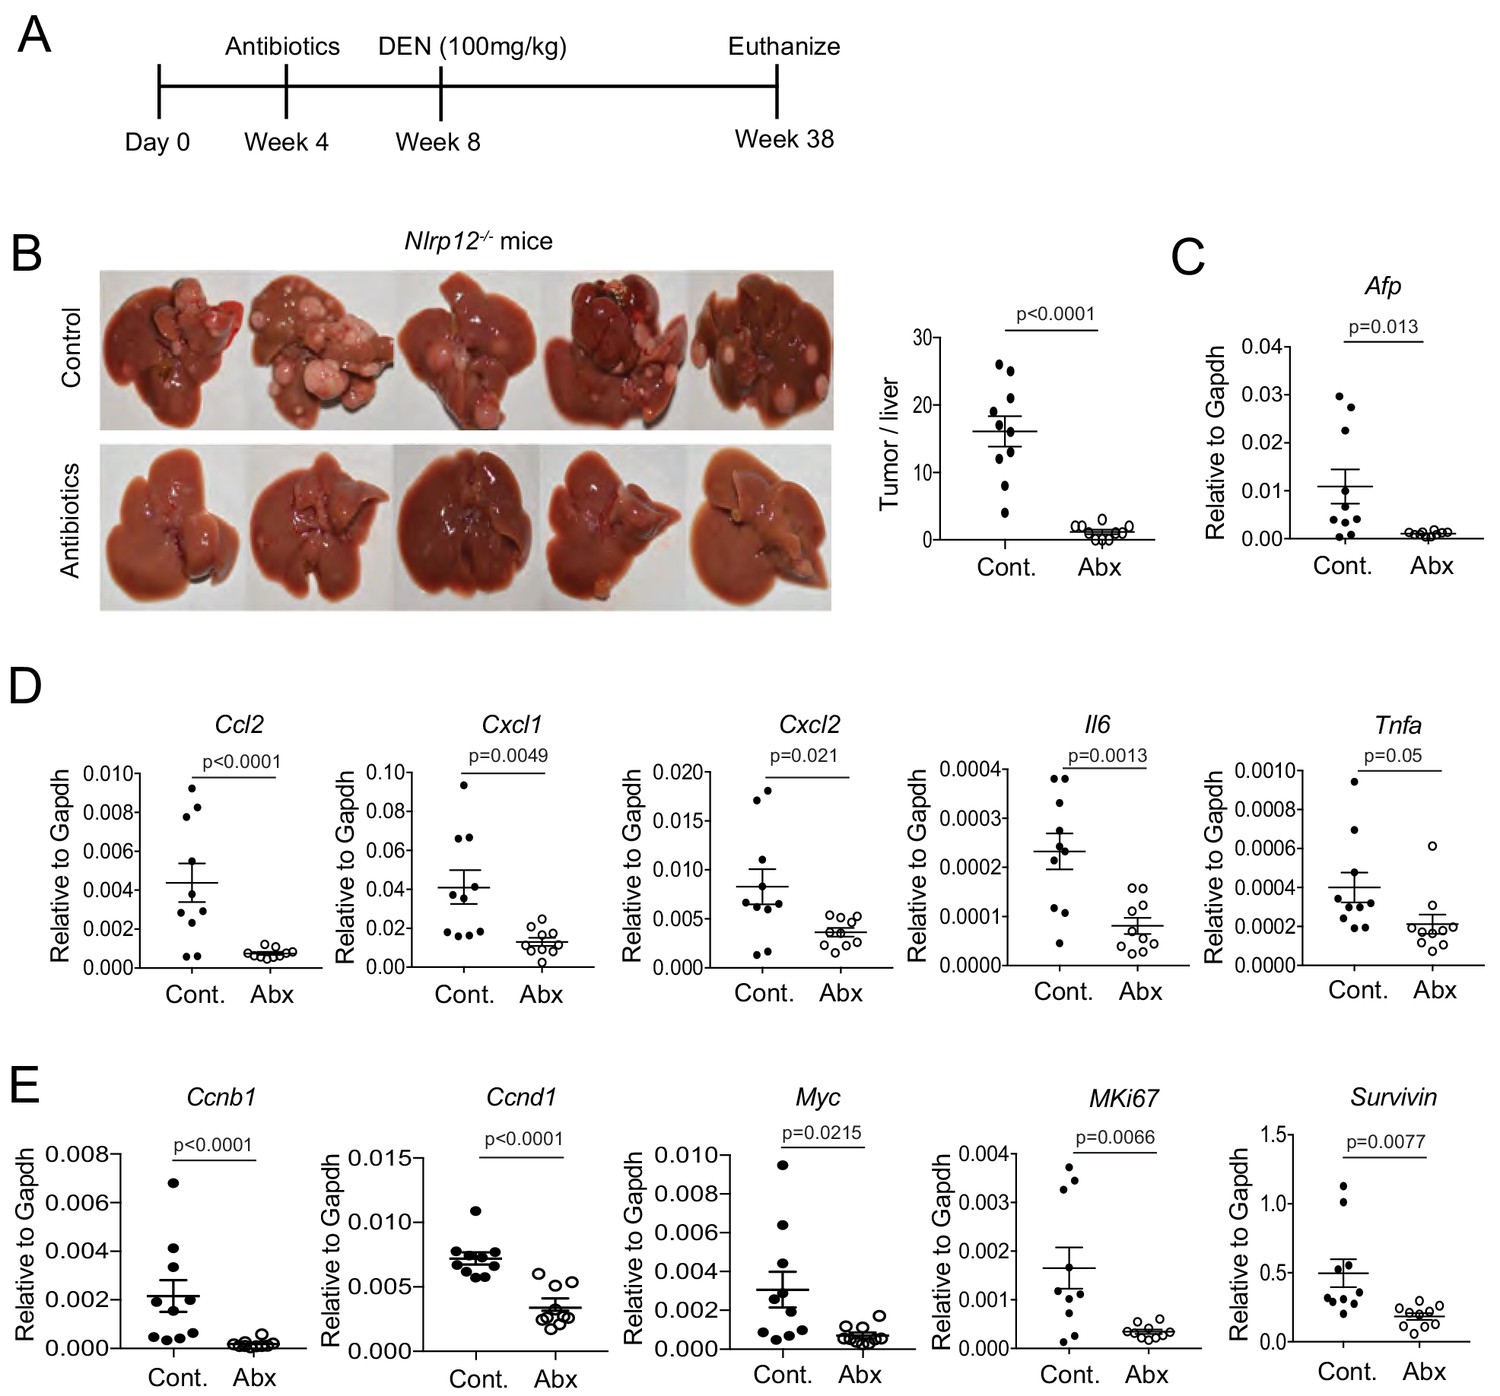
NLRP12 suppresses gut microbiota-dependent inflammatory responses and HCC pathogenesis.
(A) Nlrp12-/- mice were treated with antibiotics in their drinking water starting at 4 weeks after birth and continued until the end of the experiment. Control groups were left untreated. At 4 weeks following antibiotics treatment, all mice (n = 10/group) were injected with DEN (100 mg/kg body weight). (B) At 38 weeks, mice were sacrificed and liver tumor development was monitored. Representative images of DEN-treated mouse livers are shown here. Number of tumors were counted. Data represent means ± SEM (n = 10). Statistical difference was determined by two-tailed unpaired t-test. (C) The expression of HCC marker AFP in the liver was measured by real-time qPCR. Data represent means ± SEM (n = 10). Statistical difference was determined by two-tailed unpaired t-test. (D–E) Liver tissues were analyzed for the expression of cytokines and chemokines (D) and pro-proliferative genes (E) by real-time qPCR. (D–F) Data represent means ± SEM (n = 10). Statistical difference was determined by two-tailed unpaired t-test.
-
Figure 5—source data 1
Measurement of liver tumorigenesis and inflammatory responses following antibiotic treatment.
- https://doi.org/10.7554/eLife.40396.021
Figure 5—figure supplement 1
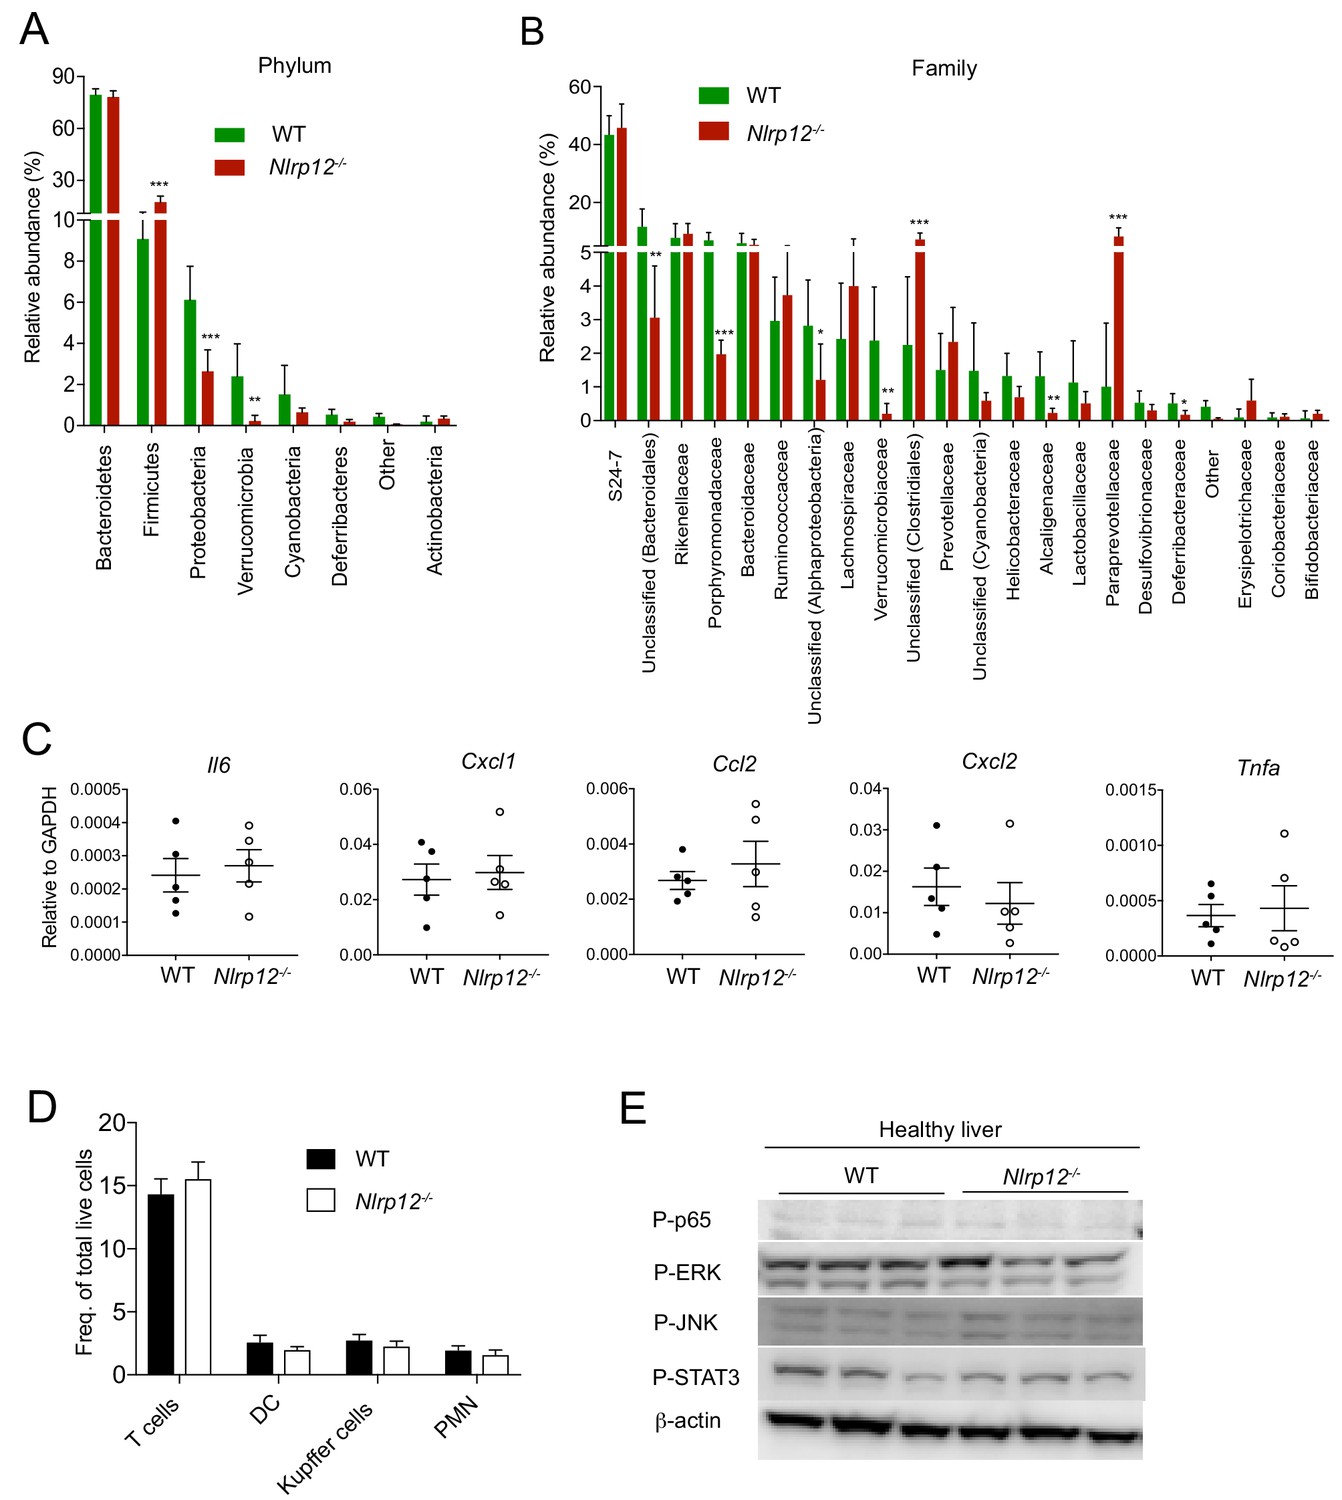
Altered gut microbiota of Nlrp12-/- mice doesn’t influence immune responses in healthy livers.
(A and B) Fecal DNA isolated from 10 months old untreated WT (n = 6) and Nlrp12-/- (n = 7) mice were analyzed for 16S rRNA gene sequence. Relative distribution of bacterial composition at phylum (A) and family (B) levels are shown. Data represent means ± SEM. *p<0.05. **p<0.01, ***p<0.001. Statistical difference was determined by two-tailed unpaired t-test. (C) The expression of cytokines and chemokines as indicated in the liver of healthy mice (10 months old) were analyzed by real time qPCR. Data represent means ± SEM (n = 5). Statistical analysis was performed by two-tailed unpaired t-test. (D) Single cell suspension of healthy WT and Nlrp12-/- mouse livers collected at 10 months after birth were stained with antibodies for CD3, CD11b, CD11c, F4/80, and Gr-1 and analyzed by flow cytometry for the quantification of T cells (CD45+, TCRb+, CD11b-), dendritic cells (CD45+, CD11b+, CD11c+high, Gr1-), kupffer cells (CD45+, CD11b+, F4/80+, Gr1-), and neutrophils (CD45+, CD11b+, Gr1+, CD11c-) by flow cytometry. Data represent means ± SEM (n = 4). Statistical analysis was performed by two-tailed unpaired t-test. (E) Liver lysates from healthy mice were analyzed for P-JNK, P-p65, P-ERK, P-STAT3, and β-actin by Western blotting.
-
Figure 5—figure supplement 1—source data 1
Analyses of gut microbiota composition and inflammatory responses in healthy WT andNlrp12-/-mouse livers.
- https://doi.org/10.7554/eLife.40396.020
Figure 6 with 1 supplement
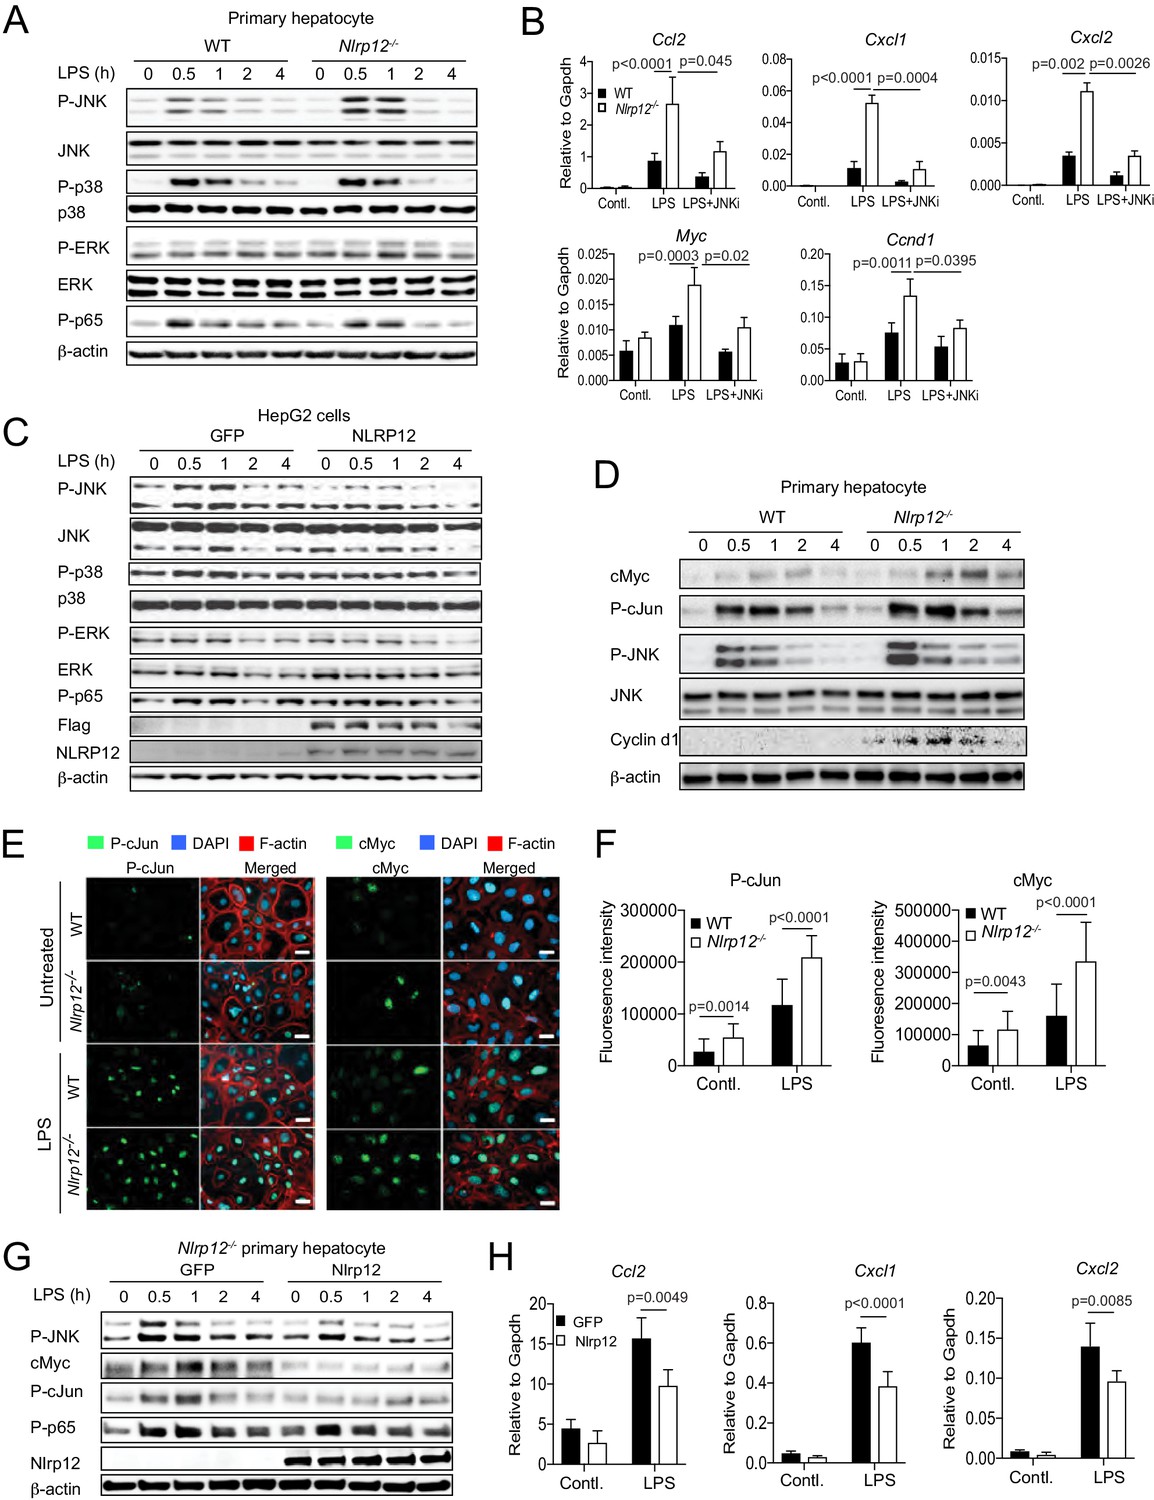
NLRP12 downregulates JNK activation in hepatocytes.
(A) Primary hepatocytes from healthy WT and Nlrp12-/- mouse livers were isolated and cultured. Hepatocytes were stimulated with LPS for the indicated time and analyzed for the activation of JNK, p38, ERK, and p65 by Western blotting. (B) Primary hepatocytes from healthy WT and Nlrp12-/- mouse livers were stimulated with LPS in the presence of absence of JNK inhibitor. The expression of inflammatory and proliferative molecules was measured by real-time qPCR. Data represent means ± SD (n = 3 replicates). Statistical difference was determined by two-tailed unpaired t-test. (C) HepG2 cells stably expressing either GFP or NLRP12 were stimulated with LPS and analyzed for the activation of JNK, p38, ERK, and p65 by Western blotting. (D) Primary hepatocytes isolated from untreated WT and Nlrp12-/- mouse livers were stimulated with LPS for the indicated time periods and analyzed for cMyc, P-cJun, Cyclin d1, and P-JNK by Western blotting. (E–F) Primary hepatocytes grown on coverslip were treated with or without LPS for 1 hr and immunostained for P-cJun (green) and cMyc (green). Cellular morphology was visible with filamentous actin (F-actin) staining (red). DAPI (blue) was used for nuclear staining. (F) P-cJun and cMyc fluorescence intensities were measured by Image J software. Data represent means ± SD (n = 20) and is representative of three independent experiments. Statistical difference was determined by two-tailed unpaired t-test. (G–H) Nlrp12-/- primary hepatocytes were transiently transfected with either GFP or Nlrp12 constructs followed by stimulation with LPS. The levels of P-JNK, cMyc, P-cJun, and P-p65 were measured by Western blotting (G) and the expression KC (Cxcl1), MIP2 (Cxcl2), and MCP1 (Ccl2) was analyzed by real-time qPCR (H). Data represent means ± SD (n = 3 replicates) and is representative of three independent experiment. Statistical difference was determined by two-tailed unpaired t-test.
-
Figure 6—source data 1
NLRP12 negatively regulates JNK activation and production of inflammatory molecules in hepatocytes.
- https://doi.org/10.7554/eLife.40396.025
Figure 6—figure supplement 1
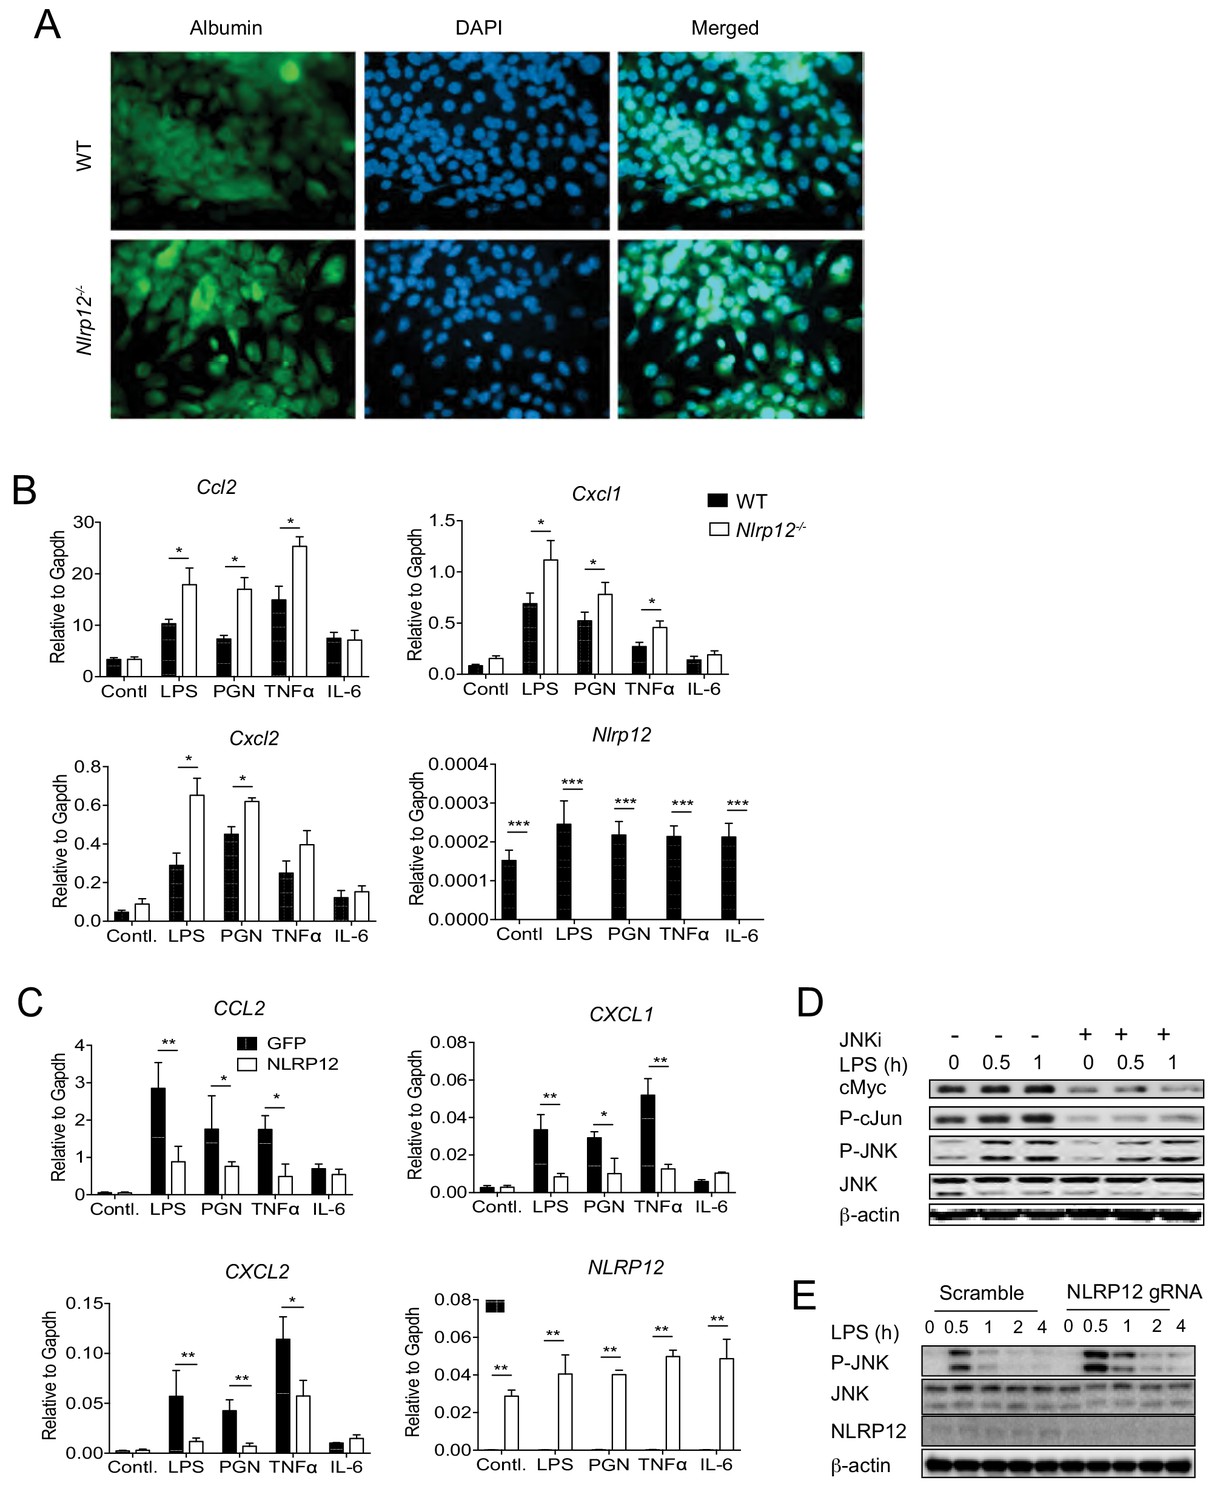
NLRP12 downregulates multiple JNK activating pathways in hepatocytes.
(A) For checking the purity of primary hepatocytes, hepatocytes isolated from healthy WT and Nlrp12-/- mouse livers were immunostained with antibody for hepatocyte-specific marker Albumin and counterstained with DAPI. (B) Primary hepatocytes from WT and Nlrp12-/- healthy mouse livers were cultured and stimulated with LPS (1 μg/mL), PGN (10 μg/mL), TNFα (20 ng/mL), and IL-6 (20 ng/mL) for 4 hr. The expression of indicated genes was analyzed by real-time qPCR. Data represent means ± SD (n = 3) and representative of three independent experiments. *p<0.05. **p<0.01, ***p<0.001. Statistical difference was determined by two-tailed unpaired t-test. (C) HepG2 cells stably expressing either GFP or NLRP12 were stimulated with LPS (1 μg/mL), PGN (10 μg/mL), TNFα (20 ng/mL), and IL-6 (20 ng/mL) for 4 hr, and the expression of indicated genes was analyzed by real-time qPCR. Data represent means ± SD (n = 3) and representative of three independent experiments. *p<0.05. **p<0.01, ***p<0.001. Statistical difference was determined by two-tailed unpaired t-test. (D) Nlrp12-/- primary hepatocytes were stimulated with LPS in the presences or absence of JNK inhibitor. The levels of cMyc, P-cJun, and P-JNK were measured by Western blotting. (E) NLRP12 was knocked down in HepG2 cells using CRISPR/Cas9 technology. Cells were then stimulated with LPS (1 ug/ml) and the activation of JNK was measured by Western blotting.
-
Figure 6—figure supplement 1—source data 1
NLRP12 downregulates inflammatory responses in hepatocytes in responses to multiple stimuli.
- https://doi.org/10.7554/eLife.40396.024
Figure 7 with 1 supplement

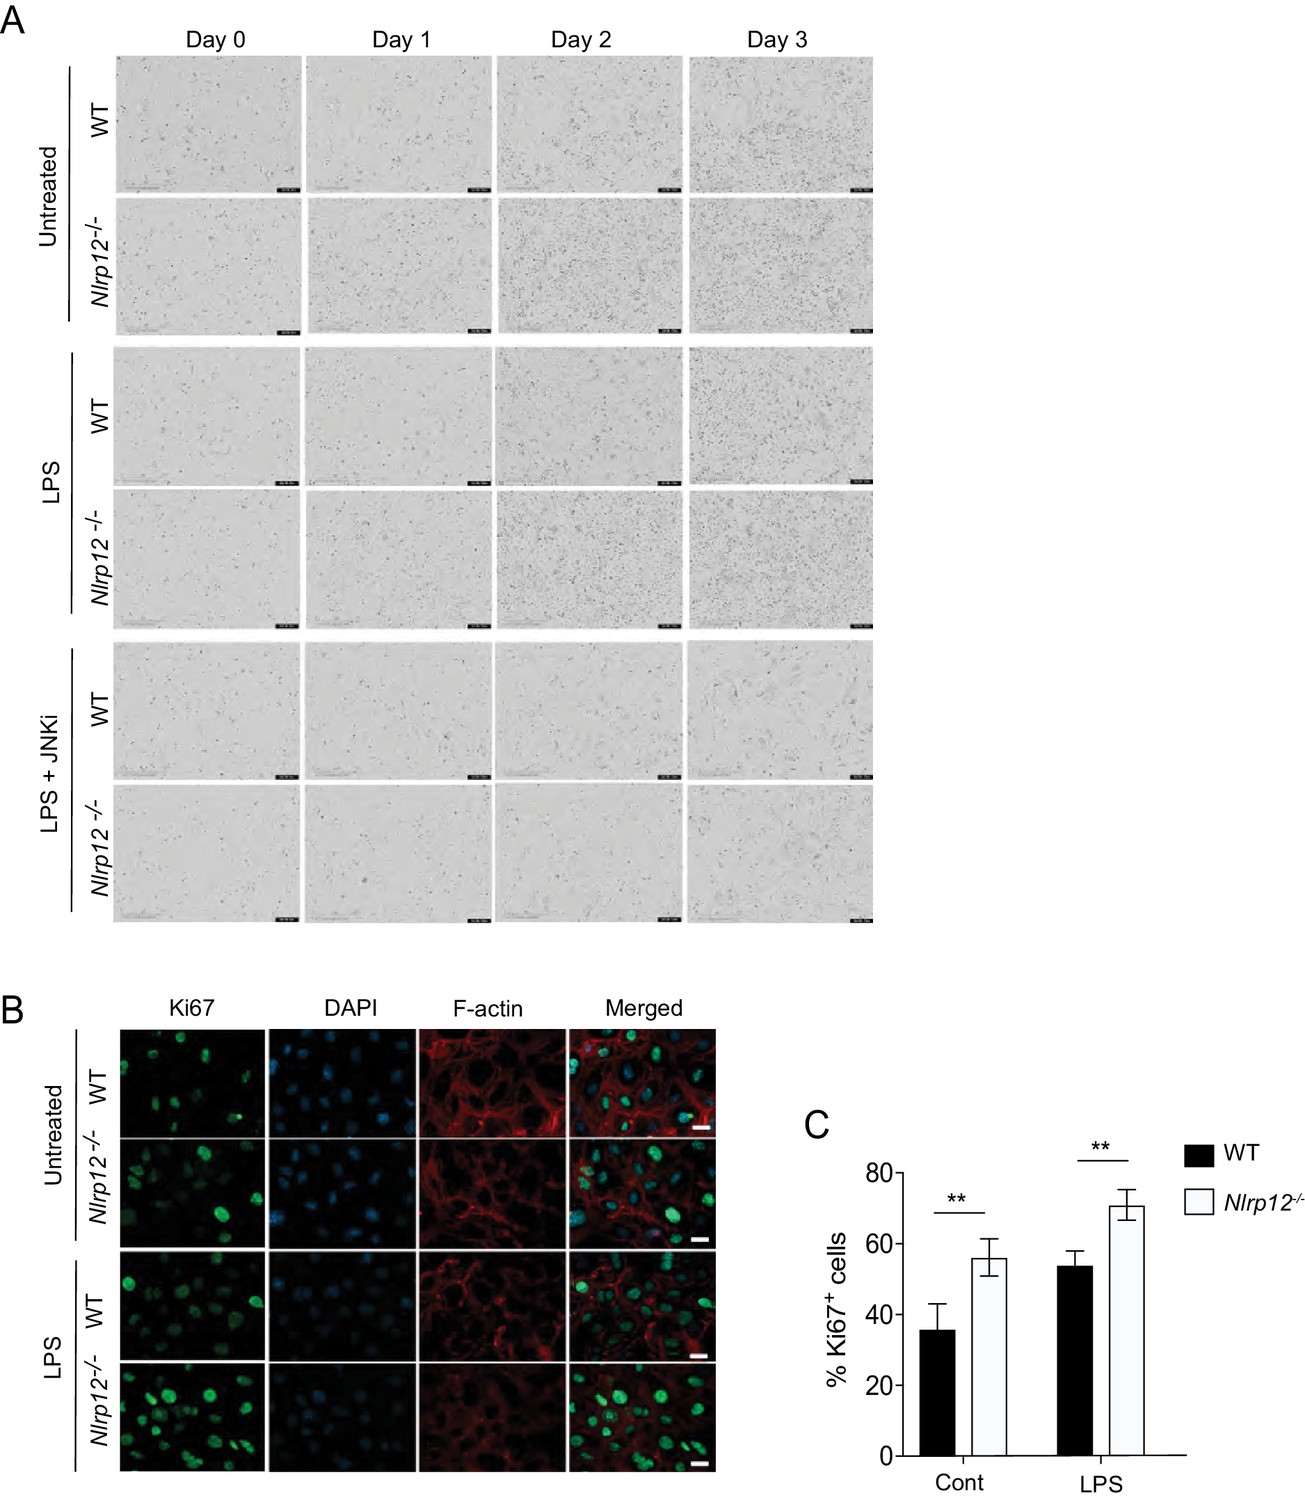
NLRP12 regulates hepatocyte proliferation via JNK activation.
(A–B) Primary hepatocytes from WT and Nlrp12-/- mouse livers were treated with LPS in the presence or absence of a JNK inhibitor. The proliferation of hepatocytes was monitored in real-time by IncuCyte live cell image analyzer. (A) Representative images of hepatocytes captured by IncuCyte are shown. (B) The changes in cell confluence were used as a surrogate marker of cell proliferation. Data represent means ± SD (n = 5 replicates) and is representative of three independent experiments. Statistical difference was determined by two-tailed unpaired t-test. (C) WT and Nlrp12-/- hepatocytes were treated with LPS for 24 hr followed by 1 hr incubation with BrdU. Cells were then immunostained with anti-BrdU antibody and BrdU incorporation (S phase) was analyzed by flow cytometry. (D) Percentage of S phase cells as analyzed by flow cytometry was quantitatively analyzed. Data represent means ± SD (n = 3 replicates) and is representative of two independent experiments. Statistical difference was determined by two-tailed unpaired t-test. (E–F) Hepatocytes stained with anti-BrdU (green) were observed and counted under the 20X microscopic objective. DAPI (blue) was used for nucleus staining. Data represent means ± SD (n = 30 replicates) and is representative of two independent experiments. Statistical difference was determined by two-tailed unpaired t-test. (G) The proposed mechanism of NLRP12-mediated regulation of HCC.
-
Figure 7—source data 1
Assesment of the role of Nlrp12 in hepatocyte proliferation.
- https://doi.org/10.7554/eLife.40396.029
Figure 7—figure supplement 1
JNK-dependent hepatocyte proliferation is regulated by NLRP12.
(A) Primary hepatocytes from WT and Nlrp12-/- mouse livers were treated with LPS in the presence or absence of JNK inhibitor. The cellular proliferation was monitored in real time with the continuous presence of indicated treatments until the end of each experiment by IncuCyte live cell image analyzer. Representative images of hepatocytes captured by IncuCyte. (B) The hepatocytes from healthy WT and Nlrp12-/- mice were cultured and treated with LPS for 24 hr in the presence or absence of JNK inhibitor. Hepatocytes were immunostained for Ki67 (green) and F-actin (red), and counterstained with DAPI (blue). (C) Percentage of Ki67-positive cells per field under 20X objective. 10 independent fields were counted from each experiment and representative of three independent experiments. Data represent means ± SD (n = 10). *p<0.05. **p<0.01, ***p<0.001. Statistical difference was determined by two-tailed unpaired t-test.
-
Figure 7—figure supplement 1—source data 1
Analysis of Ki67-positive cells in LPS-stimulated hepatocytes.
- https://doi.org/10.7554/eLife.40396.028
Author response image 1

Analysis of gene alterations of different innate immune genes using cBioportal.
Author response image 2

Gross anatomy of DEN and DEN plus CCL4-treated mice.
Tables
Key resources table
| Reagent type or resource | Designation | Source or reference | Identifiers | Additional information |
|---|---|---|---|---|
| Genetic reagent (M. musculus) | C57BL/6J | Jackson Lab | RRID:MGI:3028467 JAX:000664 | |
| Genetic reagent (M. musculus) | Nlrp12-/- C57BL/6J | PMID:12563287 | RRID: MGI:2676630 | |
| Cell line (Homo Sapiens) | HepG2 | ATCC | RRID:CVCL_0027 | |
| Recombinant DNA reagent | pcDNA4/TO | Invitrogen | Cat#V1020-20 | |
| Recombinant DNA reagent | pcDNA4/TO-Nlrp12 | This paper | Full length Nlrp12 (mouse) cDNA was cloned into pcDNA4/TO | |
| Recombinant DNA reagent | pcDNA4/TO-NLRP12 | This paper | Full length NLRP12 (human) cDNA was cloned into pcDNA4/TO | |
| Recombinant DNA reagent | NLRP12 sgRNA CRISPR/Cas9 All-in-One Lentivector (Human) | ABM Inc | Cat # K1434706 | |
| Recombinant DNA reagent | Scrambled sgRNA CRISPER/Cas9 All-in-one Lentivector | ABM Inc | Cat # K010 | |
| Antibody | Rabbit polyclonal anti-NLRP12 | Aviva Systems Biology | RRID:SCR_001456 Cat # OAAB04256 | WB: 1:500 |
| Antibody | Rabbit monoclonal anti-p44/42 (Erk1/2) | Cell Signaling | RRID:AB_390779 Cat # 4695, | WB: 1:2000 |
| Antibody | Rabbit monoclonal anti-Phospho- SAPK/JNK | Cell Signaling | RRID:AB_823588 Cat # 4668 | WB: 1:1000 |
| Antibody | Rabbit monoclonal anti-p38 MAPK | Cell Signaling | RRID:AB_10999090 Cat # 8690 | WB: 1:1000 |
| Antibody | Rabbit monoclonal anti-Phospho-AKT | Cell Signaling | RRID:AB_2315049 Cat # 4060 | WB: 1:1000 |
| Antibody | Rabbit monoclonal anti-cMyc | Cell Signaling | RRID:AB_1903938 Cat # 5605 | WB: 1:1000, IF:1:100 |
| Antibody | Mouse monoclonal anti b-actin | Sigma | RRID:AB_476697. Cat # A2228 | WB: 1:10000 |
| Antibody | Rabbit polyclonal anti-SAPK/JNK | Cell Signaling | RRID:AB_2250373 Cat # 9252 | WB: 1:5000 |
| Antibody | Rabbit monoclonal anti-Phospho-p44/42 (ERK1/2) | Cell Signaling | RRID:AB_2315112 Cat # 4370 | WB: 1:2000 |
| Antibody | Rabbit monoclonal anti-Phospho-cJun | Cell Signaling | RRID:AB_2129575 Cat # 3270 | WB: 1:1000, IF:1:100 |
| Antibody | Rabbit monoclonal anti-Phospho-p38 MAPK | Cell Signaling | RRID:AB_331762 Cat # 9215 | WB: 1:1000 |
| Antibody | Rabbit monoclonal anti-Phospho-STAT3 | Cell Signaling | RRID:AB_2491009 Cat # 9145 | WB: 1:1000 |
| Antibody | Rabbit monoclonal Phospho-NF-kB p65 | Cell Signaling | RRID:AB_331284 Cat # 3033 | WB: 1:2000 |
| Antibody | Rabbit monoclonal anti-Cyclin d1 | Cell Signaling | RRID:AB_2259616 Cat # 2978 | WB: 1:1000 |
| Antibody | Rabbit polyclonal anti-Akt | Cell Signaling | RRID:AB_329827. Cat # 9272 | WB: 1:1000 |
| Antibody | Rabbit monoclonal anti-Ki67 | abcam | RRID:AB_302459 Cat # ab16667 | IF:1:100 |
| Antibody | Rat monoclonal anti-F4/80 (Clone CI:A3-1) | BioRad | RRID:AB_323806 Cat # MCA497GA | IF:1:100 |
| Antibody | Mouse monoclonal anti-FlagM2 | Sigma | RRID:AB_262044 Cat # F1804 | WB: 1:10000 |
| Antibody | Mouse monoclonal anti-α-BrdU | Cell signaling | RRID:AB_10548898 Cat # 5292 | IF: 1:200 |
| Antibody | Rat monoclonal anti-CD16/CD32 (clone 2.4G2) | BioLegend | RRID:AB_394656 clone 2.4G2 | 1 μg/ 106 cells |
| Antibody | Mouse monoclonal Pacific Blue anti-CD45.2 Antibody | BioLegend | RRID:AB_492873 Cat # NC0123437 | 1:100 |
| Antibody | Rat monoclonal PerCP-Cyanine5.5 Anti-Human/Mouse CD11b (M1/70) | Tonbo Bioscience | RRID:AB_2621885 Cat# 65–0112 | 1:100 |
| Antibody | Rat monoclonal APC Anti-Mouse F4/80 Antigen (BM8.1) | Tonbo Bioscience | RRID:AB_2621602 Cat # 20–4801 | 1:100 |
| Antibody | Rat monoclonal In Vivo Ready Anti-Mouse Ly-6G (Gr-1) (RB6-8C5) | Tonbo Bioscience | RRID:AB_2621463 Cat # 40–5931 | 1:100 |
| Antibody | Monoclonal Anti-CD11c conjugated with PE | Tonbo Bioscience | RRID:AB_2621747 Cat # 50–0114 | 1:100 |
| Antibody | Monoclonal PE/Cy7 anti-mouse TCR β chain | Biolegend | RRID:AB_893627 Cat # 109221 | 1:100 |
| Chemical compound | Zeocin | Invivogen | Cat # ant-zn-1 | (100 μg/ml) |
| Chemical compound | Lipofectamine 3000 | Thermo Fisher | Cat # L3000015 | |
| Chemical compound | Mycoplasma Kit | Sigma | Cat#11663925910 | |
| Chemical compound | Ultrapure Escherichia coli-derived LPS | Invivogen | Cat # tlrl-smlps | |
| Chemical compound | PGN | Invivogen | Cat # tlrl-pgnsa | |
| Recombinant protein | Recombinant Human IL-6 | Peprotech | Cat # 200–06 | |
| Recombinant protein | Recombinant Murine TNFα | Peprotech | Cat # 315-01A | |
| Commercial kit | In Situ Cell Death Detection Kit-Fluorescein | Roche | Cat # 11684795910 | |
| Commercial kit | Pathscan Inflammation Multi-target ELISA kit | Cell Signaling Technology | Cat # 7276 | |
| Commercial kit | Pathsan Phospho-p44/42 MAPK ELISA kit | Cell Signaling Technology | Cat # 7177C | |
| Software, algorithm | BD FACS Diva software | BD Bioscience | ||
| Software, algorithm | Flowjo v10 | Treestar, Inc | RRID:SCR_008520 | |
| Software, algorithm | GraphPad Prism | graphpad.com | RRID:SCR_002798 | |
| Software, algorithm | QIIME 1.8.0 | Qiime.org | RRID:SCR_008249 PMC3156573 |
Additional files
-
Supplementary file 1
List of primers of mouse and human genes.
All primers used in this study to measure the expression of mouse genes (Supplemental Table 1) and of human genes (Supplemental Table 2) by real-time qPCR analysis.
- https://doi.org/10.7554/eLife.40396.030
-
Transparent reporting form
- https://doi.org/10.7554/eLife.40396.031
Download links
A two-part list of links to download the article, or parts of the article, in various formats.
Downloads (link to download the article as PDF)
Open citations (links to open the citations from this article in various online reference manager services)
Cite this article (links to download the citations from this article in formats compatible with various reference manager tools)
NLRP12 suppresses hepatocellular carcinoma via downregulation of cJun N-terminal kinase activation in the hepatocyte
eLife 8:e40396.
https://doi.org/10.7554/eLife.40396


