LncEGFL7OS regulates human angiogenesis by interacting with MAX at the EGFL7/miR-126 locus
- Tulane University, United States
- Boston Children’s Hospital, Harvard Medical School, United States
- Xavier University, United States
- University of Rochester School of Medicine and Dentistry, United States
- Oklahoma Medical Research Foundation, United States
Figures
Figure 1 with 2 supplements
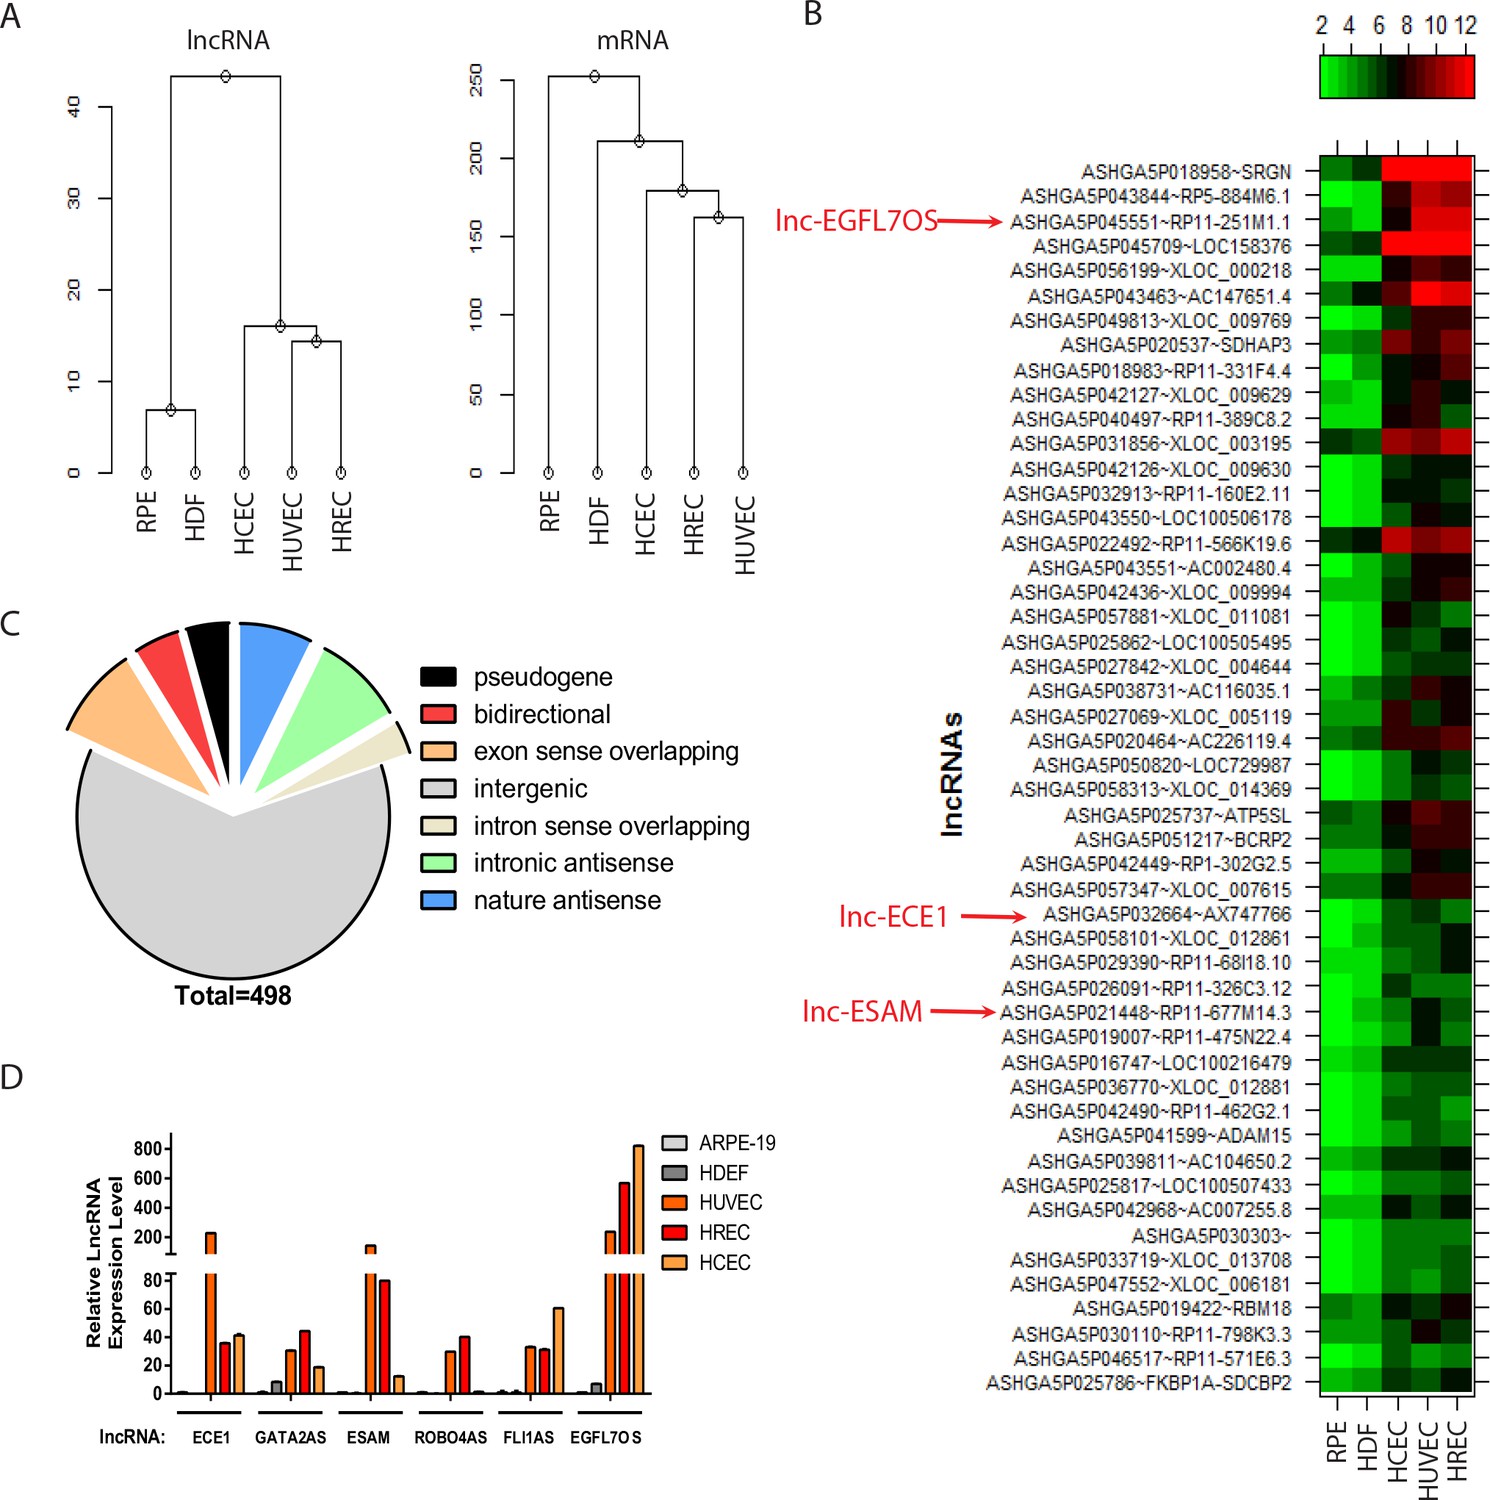
lncRNA profiling in ECs.
(A) Hierarchy cluster analysis of lncRNA and mRNA expression data from five different cell lines. (B) Heatmap showing the top-50 enriched lncRNAs in three EC lines compared to the two non-EC lines. Several highlighted lncRNAs were used in the subsequent qRT-PCR confirmation in Figure 1D. (C) A pie chart showing different classes of annotated lncRNAs that are enriched more than two folds in ECs compared to non-ECs. (D) Quantitative (q) RT-PCR confirmation of candidate EC-enriched lncRNAs. n = 3. Error bars represent the standard error from three technical repeats from each line. GAPDH was used as normalization control.
-
Figure 1—source data 1
Figure 1D source data.
- https://doi.org/10.7554/eLife.40470.006
Figure 1—figure supplement 1
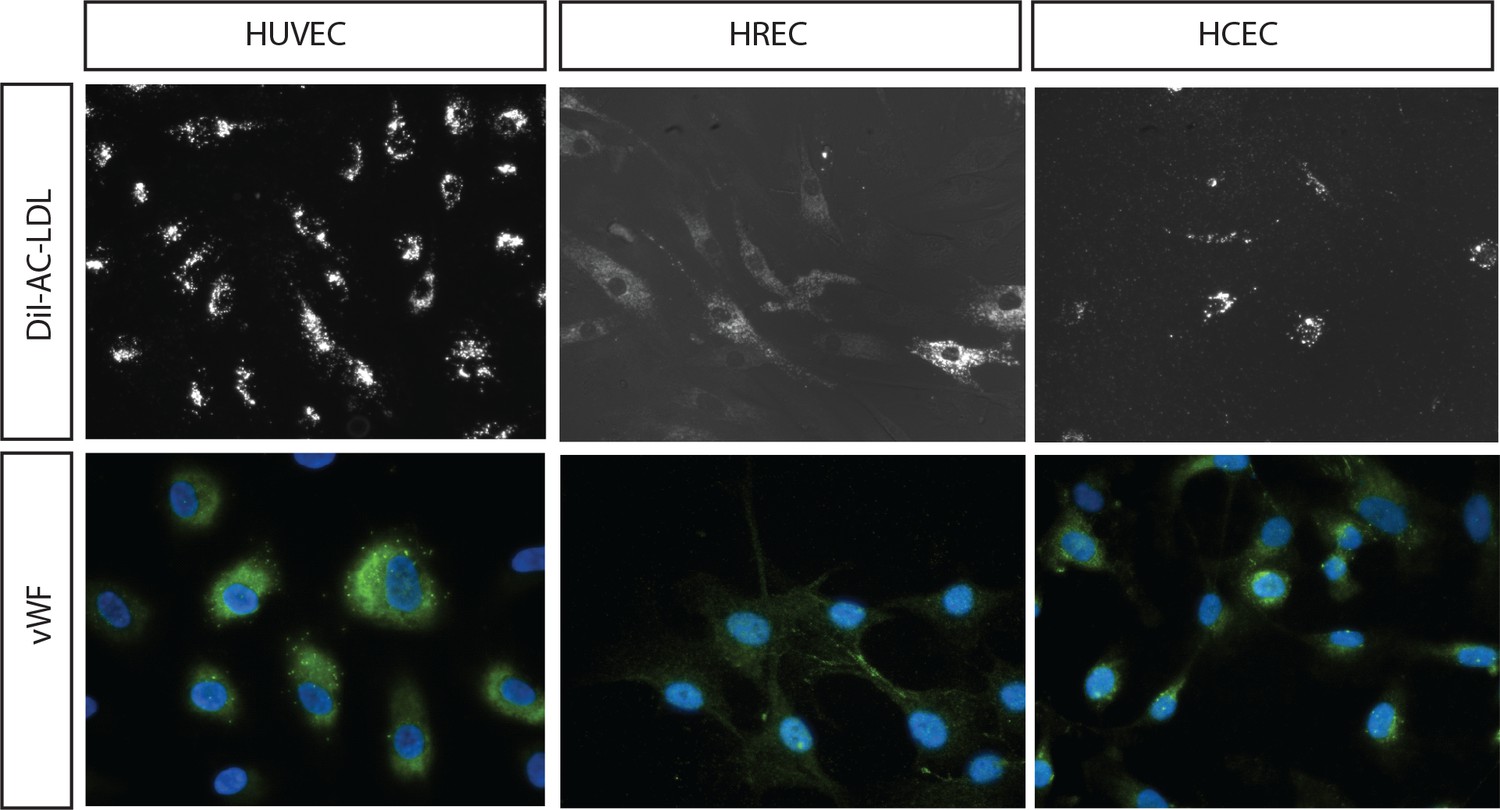
EC Marker staining of the EC cells used.
A (Upper panels). Uptake of DiI labeled Acetyl-LDL in the EC lines (HUVEC, HREC and HCEC); B (lower panels). Staining of the EC lines with antibody to EC marker vWF.
Figure 1—figure supplement 2
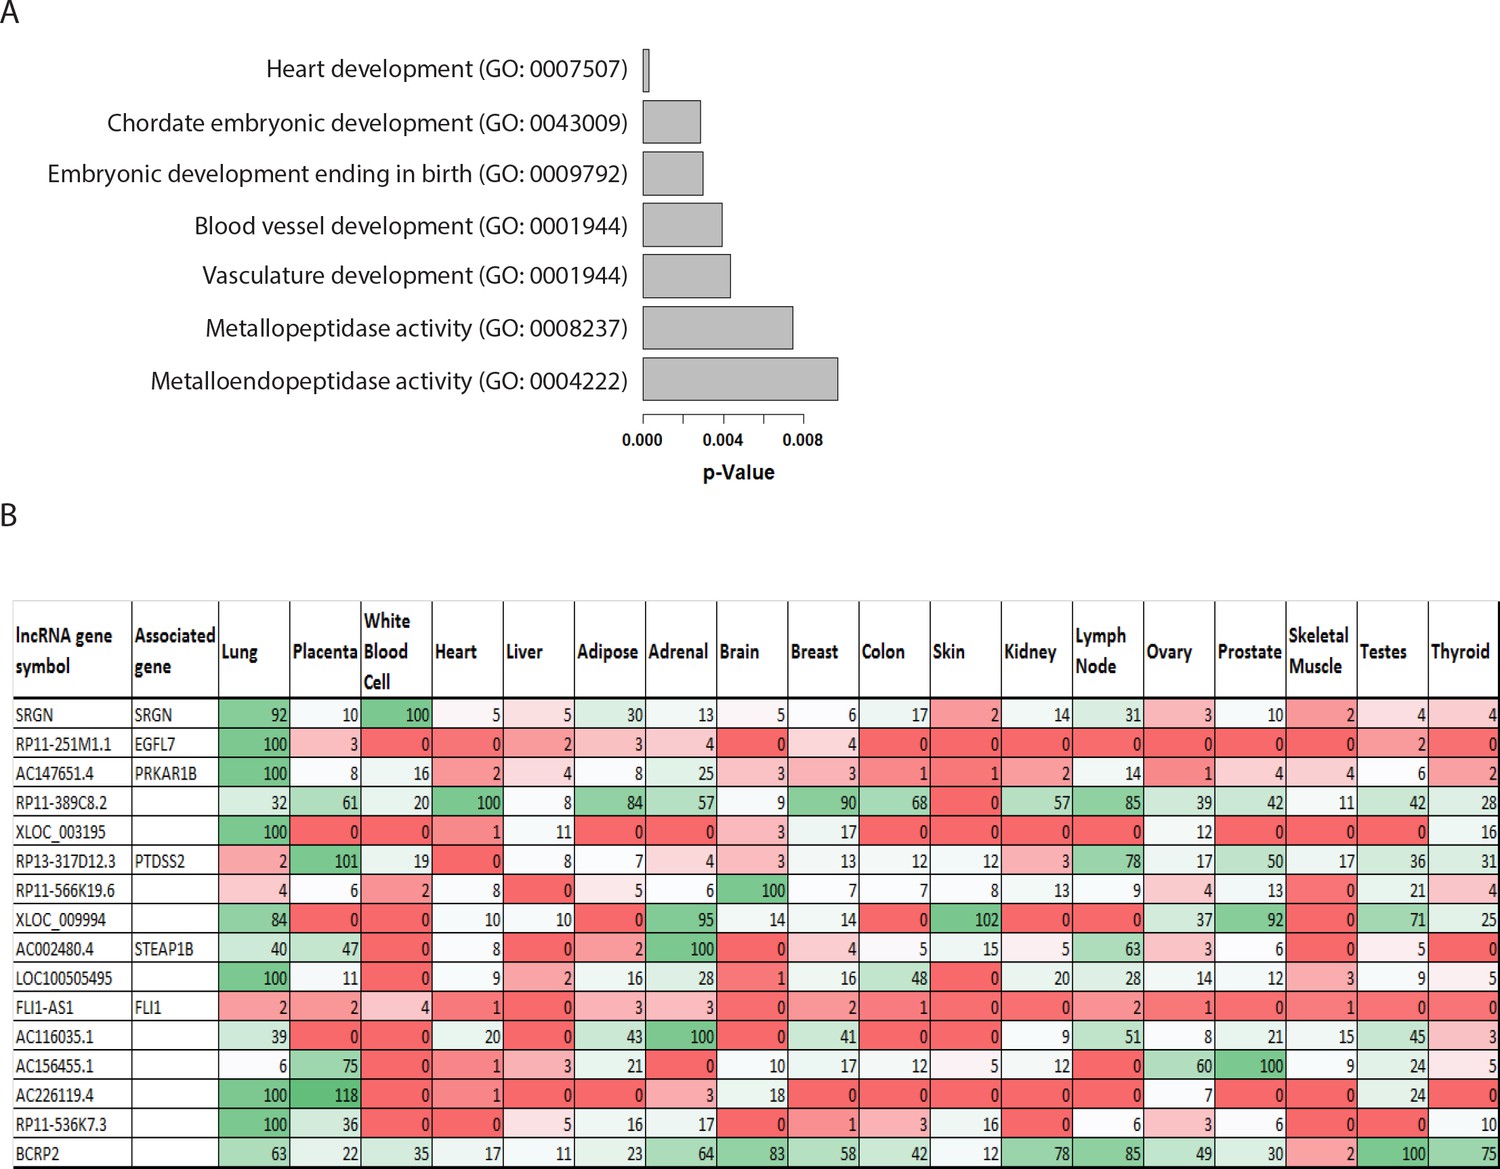
Functional encrichment analysis and tissue distribution of the EC-enriched lncRNAs.
(A) Functional enrichment analysis of EC-enriched lncRNAs and their associated genes. P-values are indicated. (B) Tissue distribution of the candidate lncRNAs from the top-50 EC-enriched lncRNA lisCt based on bioinformatics data. The tissue expression data of the top-50 EC-enriched lncRNAs were searched from the Stanford Source database, and the available information was shown in the table. Expression level was shown and was visualized artificially with heat-map (green represents high expression and red represents low expression).
Figure 2 with 2 supplements

Expression, regulation and subcellular localization of lncEGFL7OS, as well as its regulation in DCM patients.
(A) Genomic organization of lncEGFL7OS and its host gene EGFL7/miR-126. Exons are shown in orange and the introns are shown in blue. Direction of gene transcription is indicated by arrows. Scale = 1 kb; (B) Relative lncEGFL7OS expression level in different human tissues. GAPDH served as the normalization control. (C) Expression of lncEGFL7OS in the nucleus and cytoplasm of HUVECs shown by semi-quantitative RT-PCR. RT-PCR showing nuclear and cytoplasmic expression of lncEGFL7OS. SENCR was used a marker for cytoplasmic-enriched lncRNA, while NEAT-1 was used as a marker for nuclear-enriched lncRNA. (D) Expression of lncEGFL7OS in the nucleus and cytoplasm of HUVECs shown by high-resolution RNA FISH analysis (a–c). RNaseA-treated samples were used as negative control (a) and Ad-lncEGFL7OS-overexpressed HUVECs were used as positive control (b). Scale Bar equals 10 µm. (E) Upregulation of lncEGFL7OS, EGFL7B and C, and pri-miR-126 om the hearts of DCM patients. *p<0.05; **p<0.01. N = 6 for control samples and N = 7 for DCM samples. (F) Schematic potential promoter region (boxed) for EGFL7/lncEGFL7OS. Exons are shown in orange and the introns are shown in blue. Direction of gene transcription is indicated by red arrows. The peaks show regions with elevated H3K4Me1, H3K4Me3 and H3K27Ac binding as predicted by ENCODE, respectively. The boxed region was shown by ENCODE to bind MAX, MYC, ETS1, RNA PolR II, H3K4Me1, H3K4Me3 and H3K27Ac (https://genome.ucsc.edu). Eight cell types were tracked in the image. Light blue indicates HUVEC cells, while dark color indicates H7-ES cells. Scale = 1 kb. (G) Testing bidirectional lncEGFL7OS promoter. LncEGF7OS promoter was fused to a promoter-less Luciferase vector in forward (F) and reverse (R) directions, and tested for Luciferase activity with or without co-transfection of ETS1 or ETS1 mutant expression plasmid in 293 T cells. Shown here is the representative results from three repeats. (H) qRT-PCR showing that silencing of ETS1/2 result in the downregulation of lncEGFL7OS and pri-miR-126 (n = 3). *p<0.05; ***p<0.001.
-
Figure 2—source data 1
Figure 2 source data.
- https://doi.org/10.7554/eLife.40470.011
Figure 2—figure supplement 1
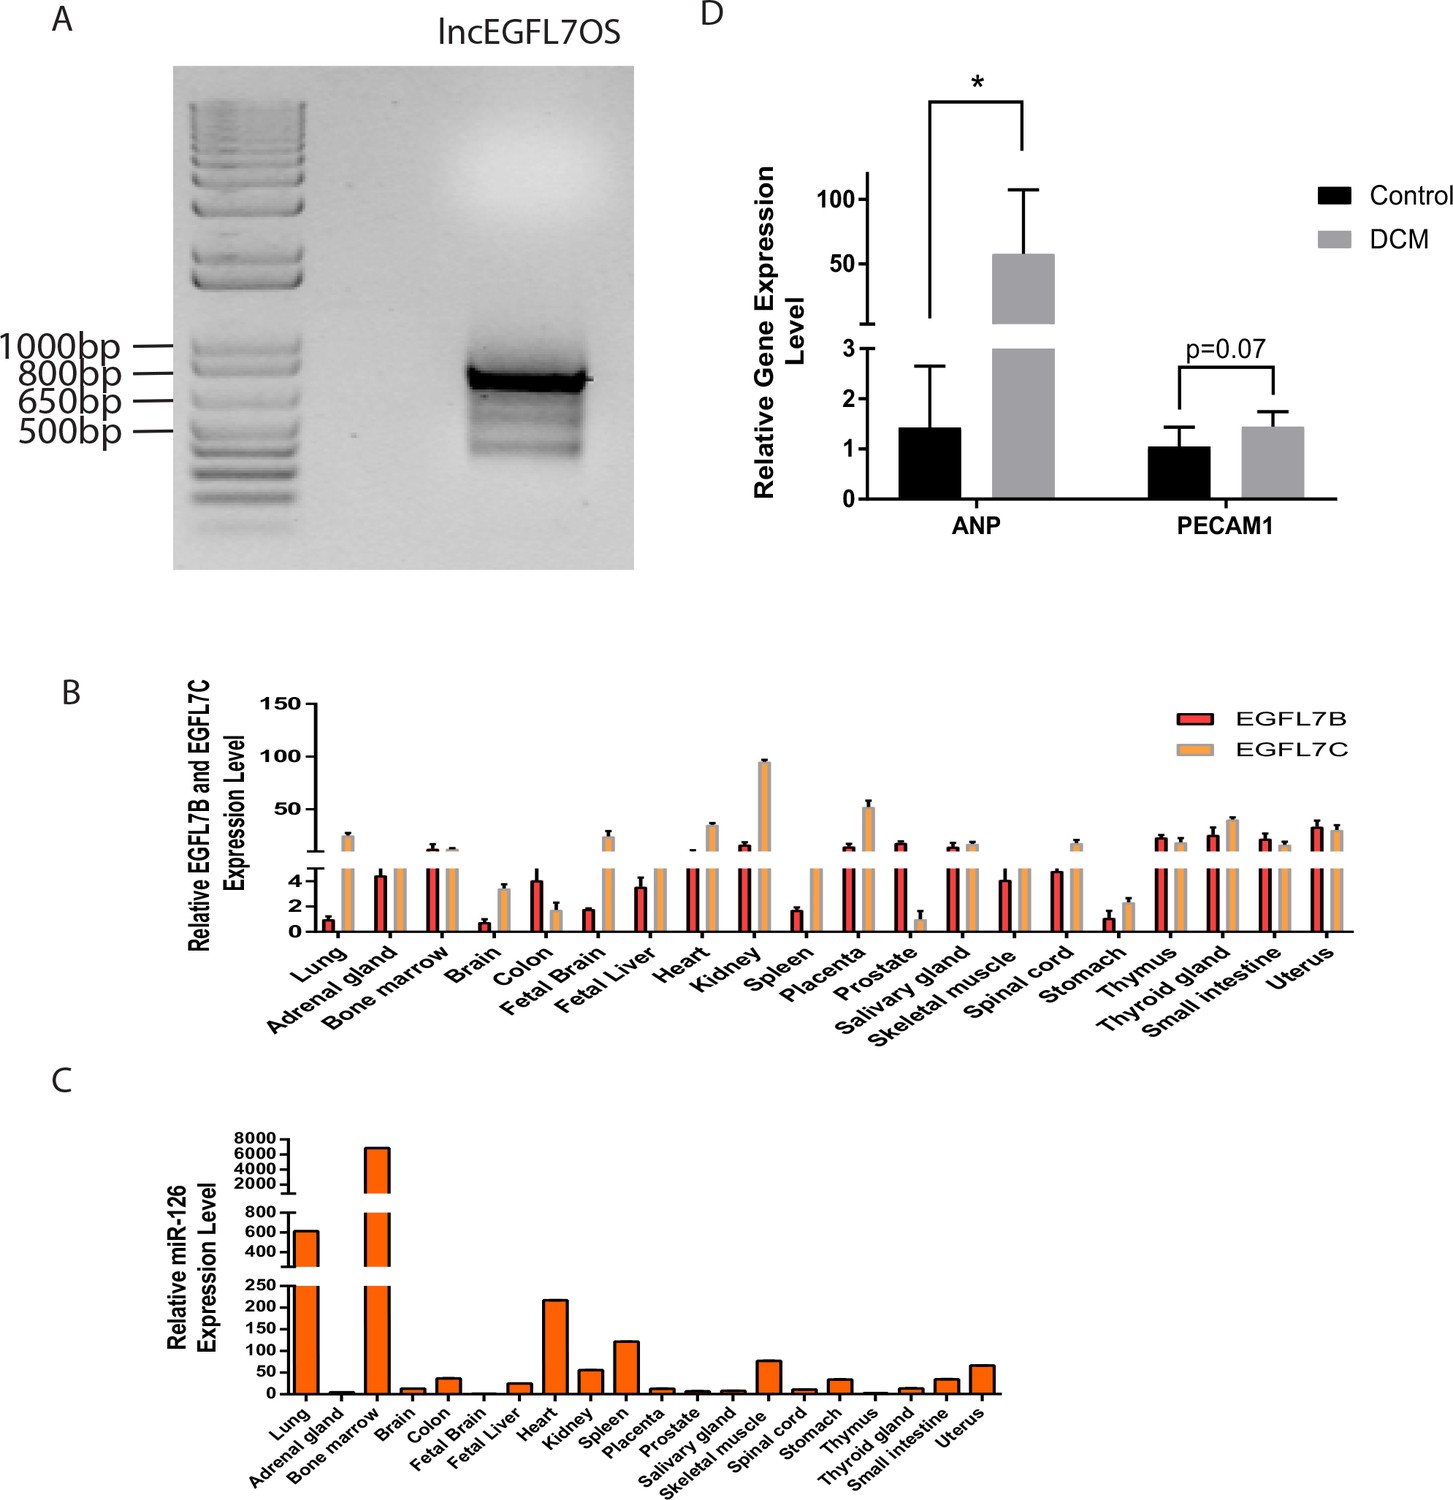
lncEGFL7OS RACE-PCR data and Real-time PCR data of ANP, PECAM1, EGFL7 and miR-126 in different tissues.
(A) Gel picture of RACE-PCR product of lncEGFL7OS from RACE-ready human placenta cDNA. Marker size was shown. (B) Expression of EGFL7B and EGFL7C by qRT-PCR in different human tissues. GAPDH served as the normalization control; (C) Relative miR-126 expression level in different human tissues. U6 served as normalization control; (D) qRT-PCR detection of ANP and PECAM-1 in the hearts of DCM patients. 5 controls and 7 DCM patients were used in the study. *p<0.05.
-
Figure 2—figure supplement 1—source data 1
Figure 2—figure supplement 1 source data.
- https://doi.org/10.7554/eLife.40470.009
Figure 2—figure supplement 2
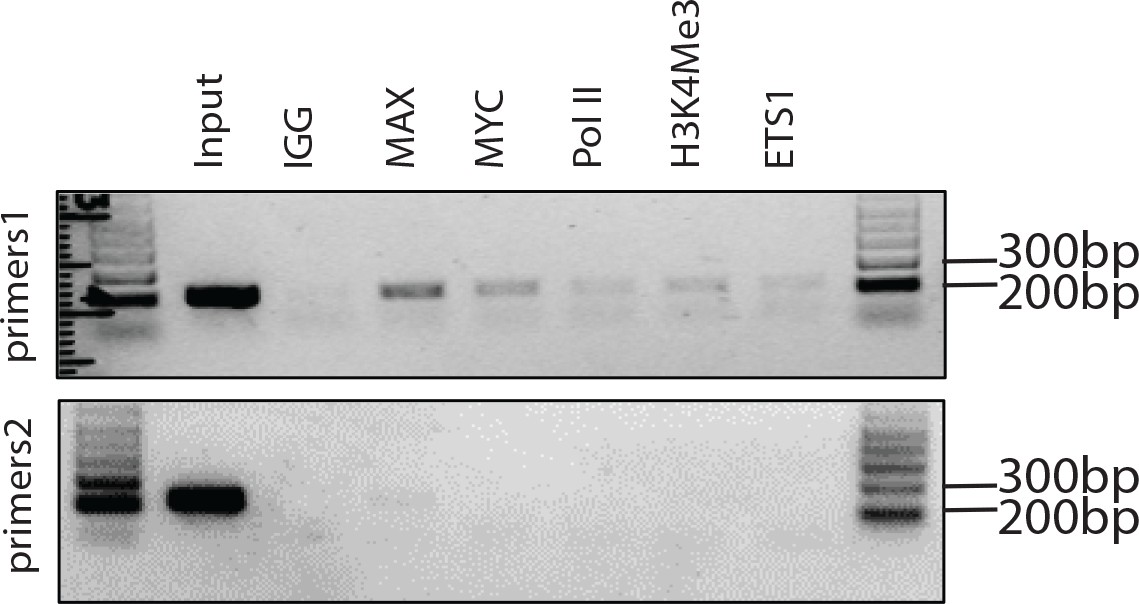
ChIP assay showing binding for the indicated factors to the promoter region (n = 3 each).
IgG was used as control. The positions for PCR primers are shown in Figure 2F. Size of the marker was shown.
Figure 3 with 2 supplements
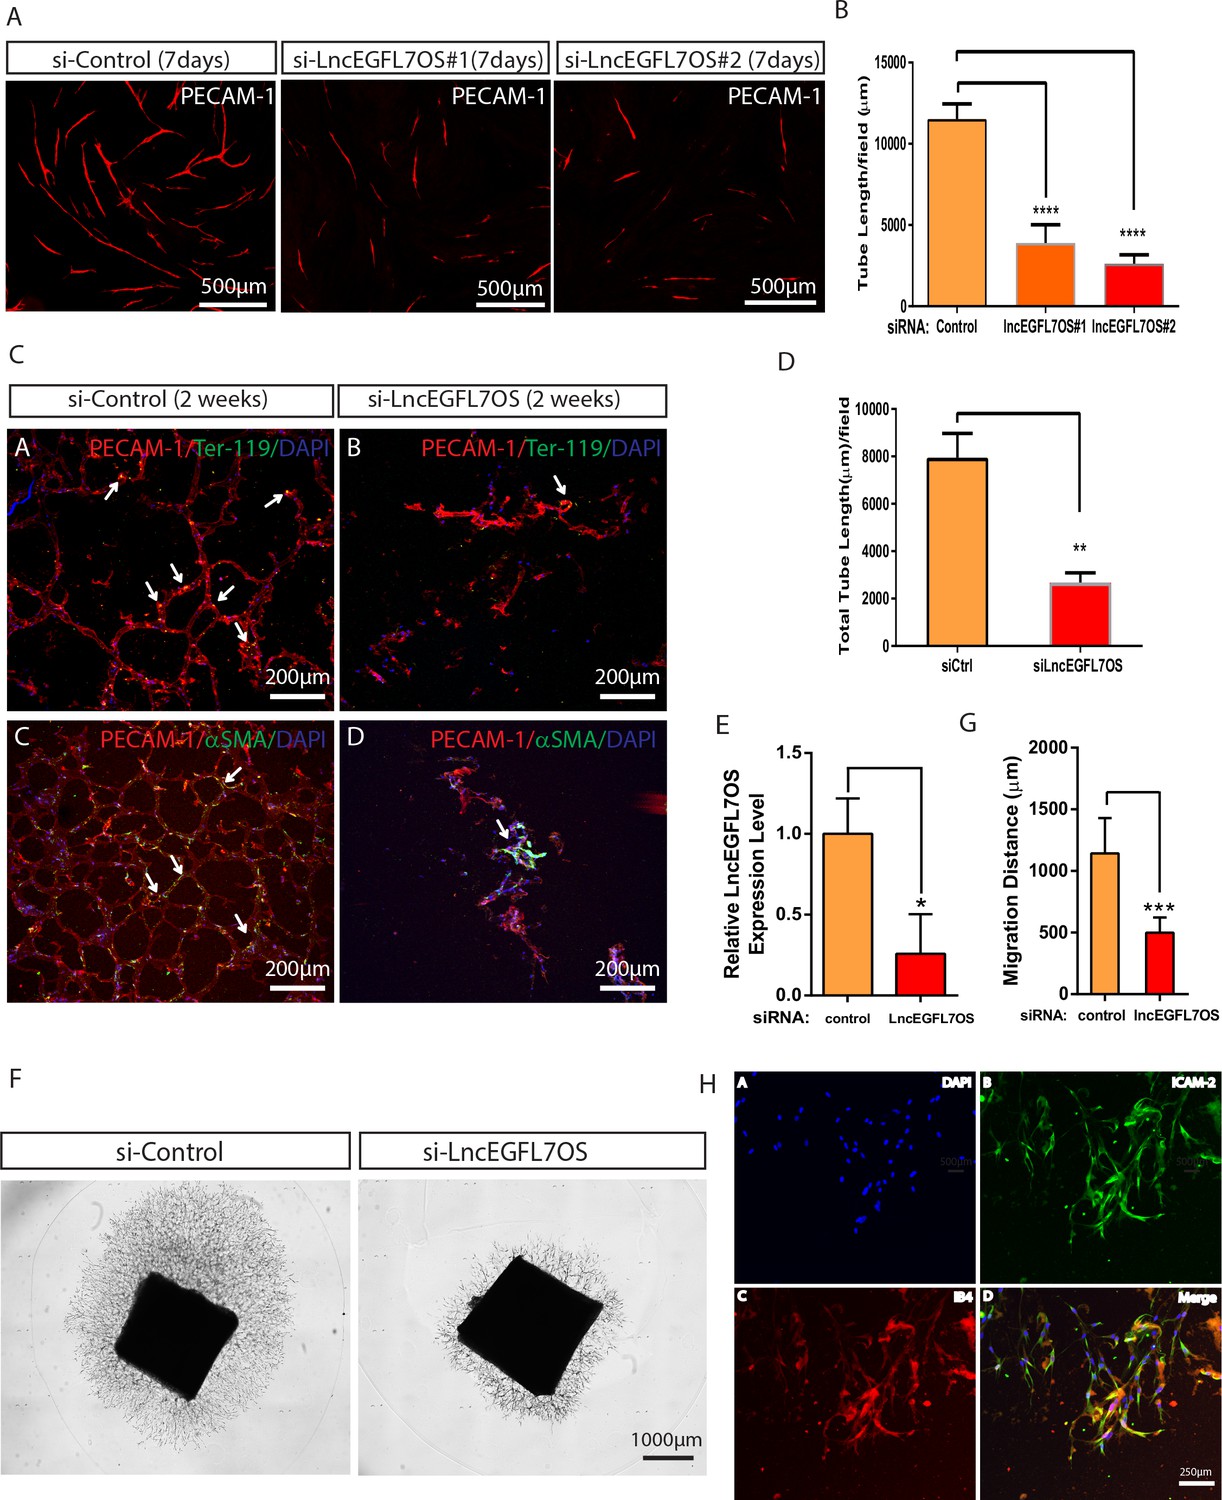
Regulation of angiogenesis by lncEGFL7OS in vitro, ex vivo and in vivo.
(A) Decreased capillary tube formation at 7 days after lncEGFL7OS silencing in HUVECs in an EC-fibroblast co-culture assay. The capillaries are stained with PECAM-1 antibody. Scale bar equals to 500 µm. (B) Quantification of total tube length in A (n = 3 each). Two independent lncEGFL7OS siRNAs were used for quantification. ****p<0.0001. (C) Defective EC networking at 14 days after lncEGFL7OS silencing in an in vivo Matrigel implantation model. A mix of si-linEGFL7OS#1 and si-lncEGFL7OS#2 was used for the experiments. HUVEC cells in the Matrigel were stained with human PECAM-1 antibody (Red), mouse red blood cells were stained with mouse Ter-119 (Green) antibody and mouse smooth muscle cells were stained with α-SMA (Green) antibody. Arrows label the representative areas with overlapping staining in the Matrigel. DAPI was used to stain nucleus. Scale bar equals to 200 µm. (D) Quantification of tubule length in C (n = 3 mice each). **p<0.01. (E) Inhibition of lncEGFL7OS expression by si-lncEGFL7OS-1/2 in human choroids cultured ex vivo, as revealed by qRT-PCR. (n = 3) (F) Representative picture of human choroid sprouting angiogenesis after lncEGFL7OS knockdown; G) Quantification of choroid sprouting distance in F. (n = 6) (H) Representative ICAM2 (green) and Isolectin B4 (red) staining of the choroid sprouts in F. Scale bar equals to 250 µm.
-
Figure 3—source data 1
Figure 3 source data.
- https://doi.org/10.7554/eLife.40470.016
Figure 3—figure supplement 1
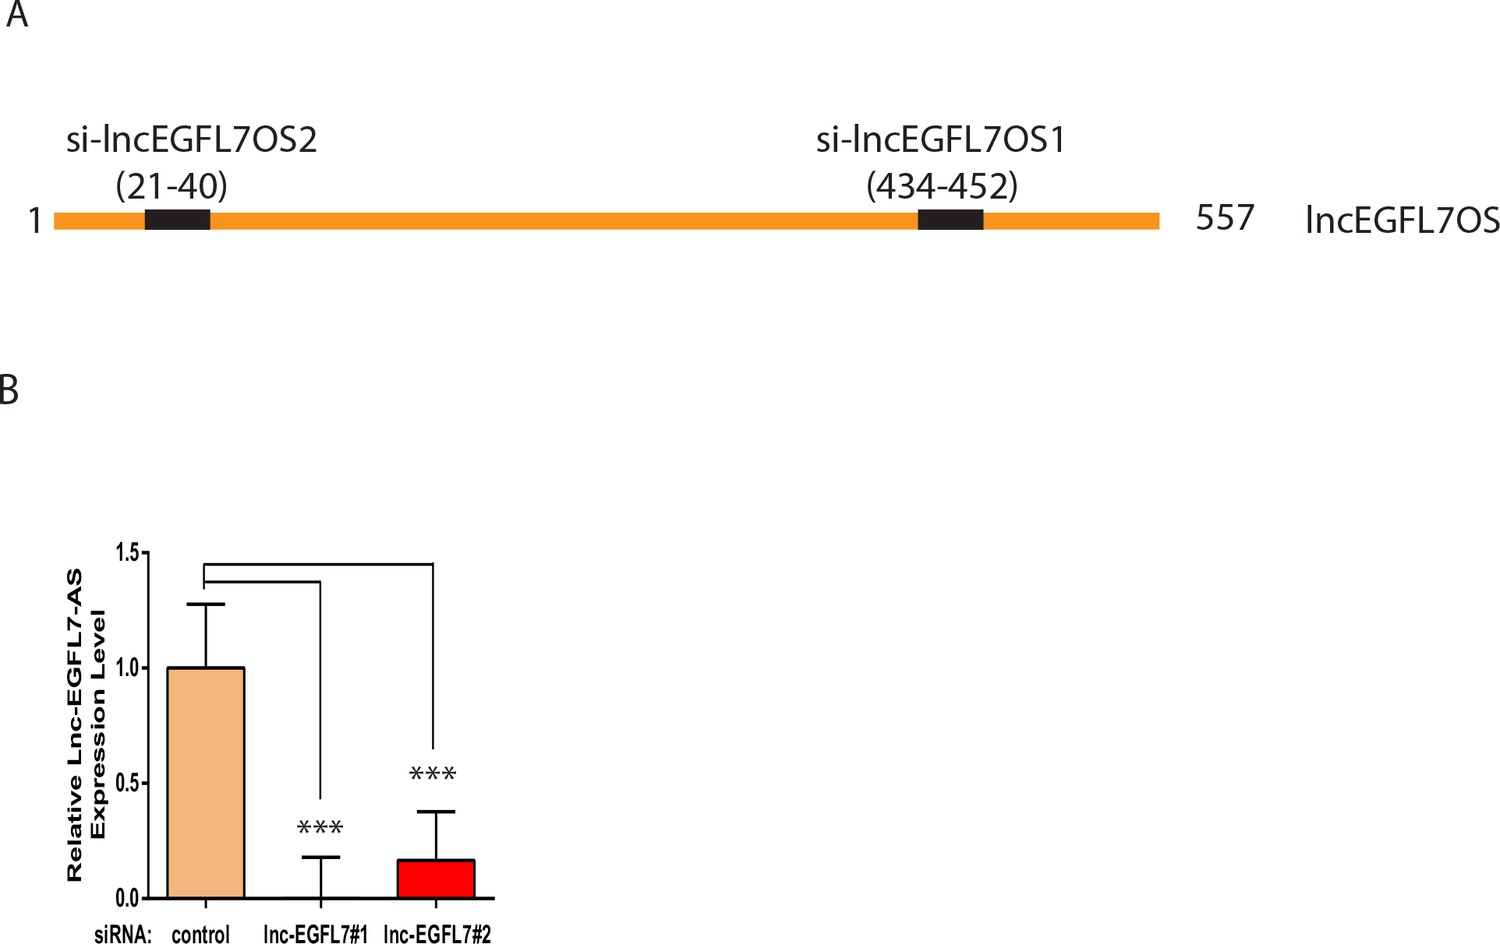
Schemetics of lncEGFL7OS siRNA localization and siRNA knockdown efficiency.
(A) Schematics of the siRNA locations in lncEGFL7OS. (B) Silencing of lncEGFL7OS by siRNAs as shown by qRT-PCR (n = 3). ***, p<0.001.
-
Figure 3—figure supplement 1—source data 1
Figure 3 source data.
- https://doi.org/10.7554/eLife.40470.014
Figure 3—figure supplement 2
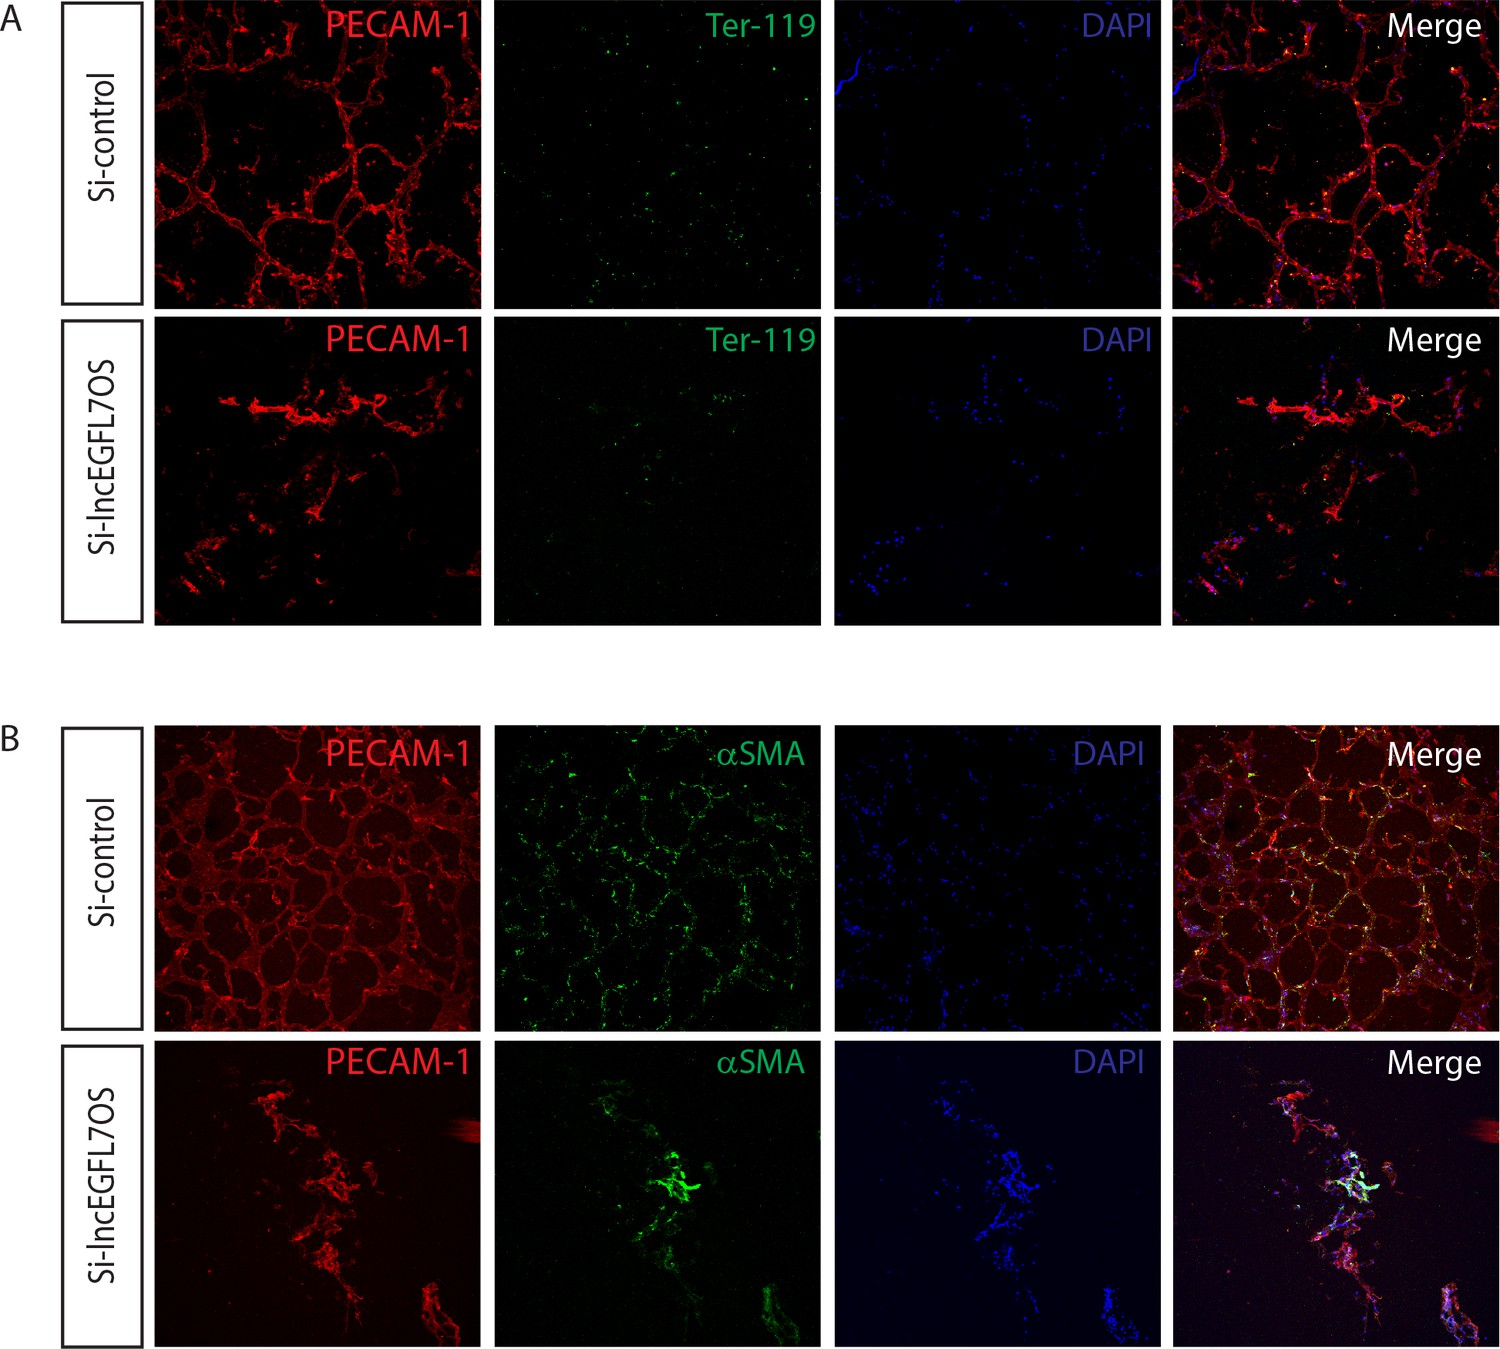
Immunostaining of the Matrigel assay in Figure 3C.
(A) Single channel image of the Matrigel assay in Figure 3C. HUVEC cells were stained with human PECAM-1 antibody (Red) and mouse red blood cells were stained with mouse Ter-119 (Green) antibody. DAPI was used to stain nucleus. (B) Single channel image of the Matrigel assay in Figure 3C. HUVEC cells were stained with human PECAM-1 antibody (Red) and mouse smooth muscle cells were stained with α-SMA (Green) antibody. DAPI was used to stain nucleus.
Figure 4 with 2 supplements
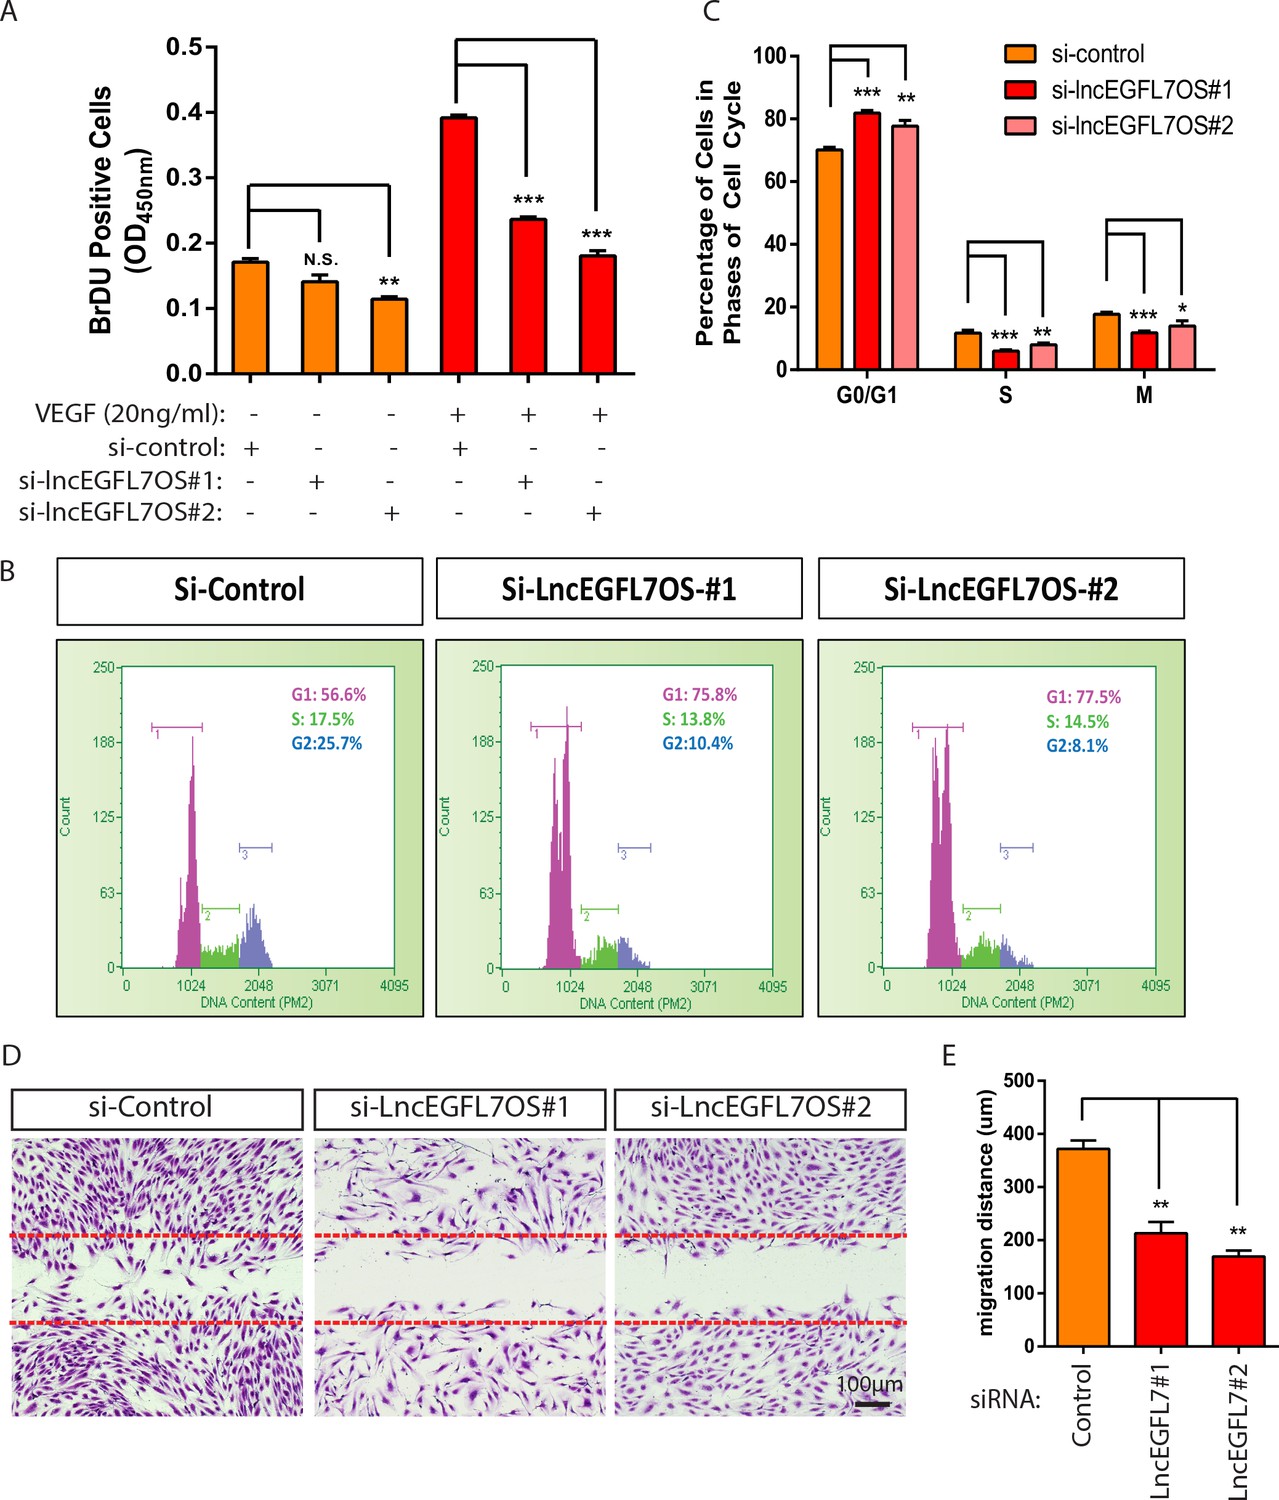
Regulation of EC proliferation and migration by lncEGFL7OS.
(A) Quantification of EC proliferation in response to VEGF-A as indicated by BrDU incorporation after lncEGFL7OS silencing (n = 3). (B) Representative ell cycle profile in ECs after lncEGFL7OS silencing. (C) Statistics of the percentage of cells in different phases of cell cycle after lncEGFL7 silencing. (n = 3) *p<0.05; **p<0.01; ***p<0.001. (D) Repression of cell migration in a scratch wound assay in ECs after lncEGFL7OS silencing. Dashed lines indicate the initial position of cells. Scale bar equals to 100 µm. (E) Quantification of EC migration in D (n = 3). **p<0.01.
-
Figure 4—source data 1
Figure 4 source data.
- https://doi.org/10.7554/eLife.40470.022
Figure 4—figure supplement 1
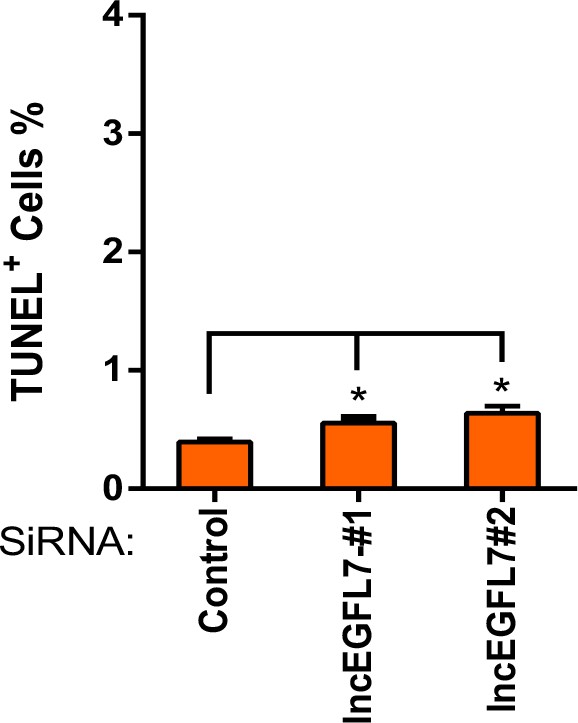
Quantification of TUNEL positive cells in ECs transfected siRNAs for lncEGFL7OS (n = 3).* p<0.05.
https://doi.org/10.7554/eLife.40470.018-
Figure 4—figure supplement 1—source data 1
Figure 4—figure supplement 1 source data.
- https://doi.org/10.7554/eLife.40470.019
Figure 4—figure supplement 2
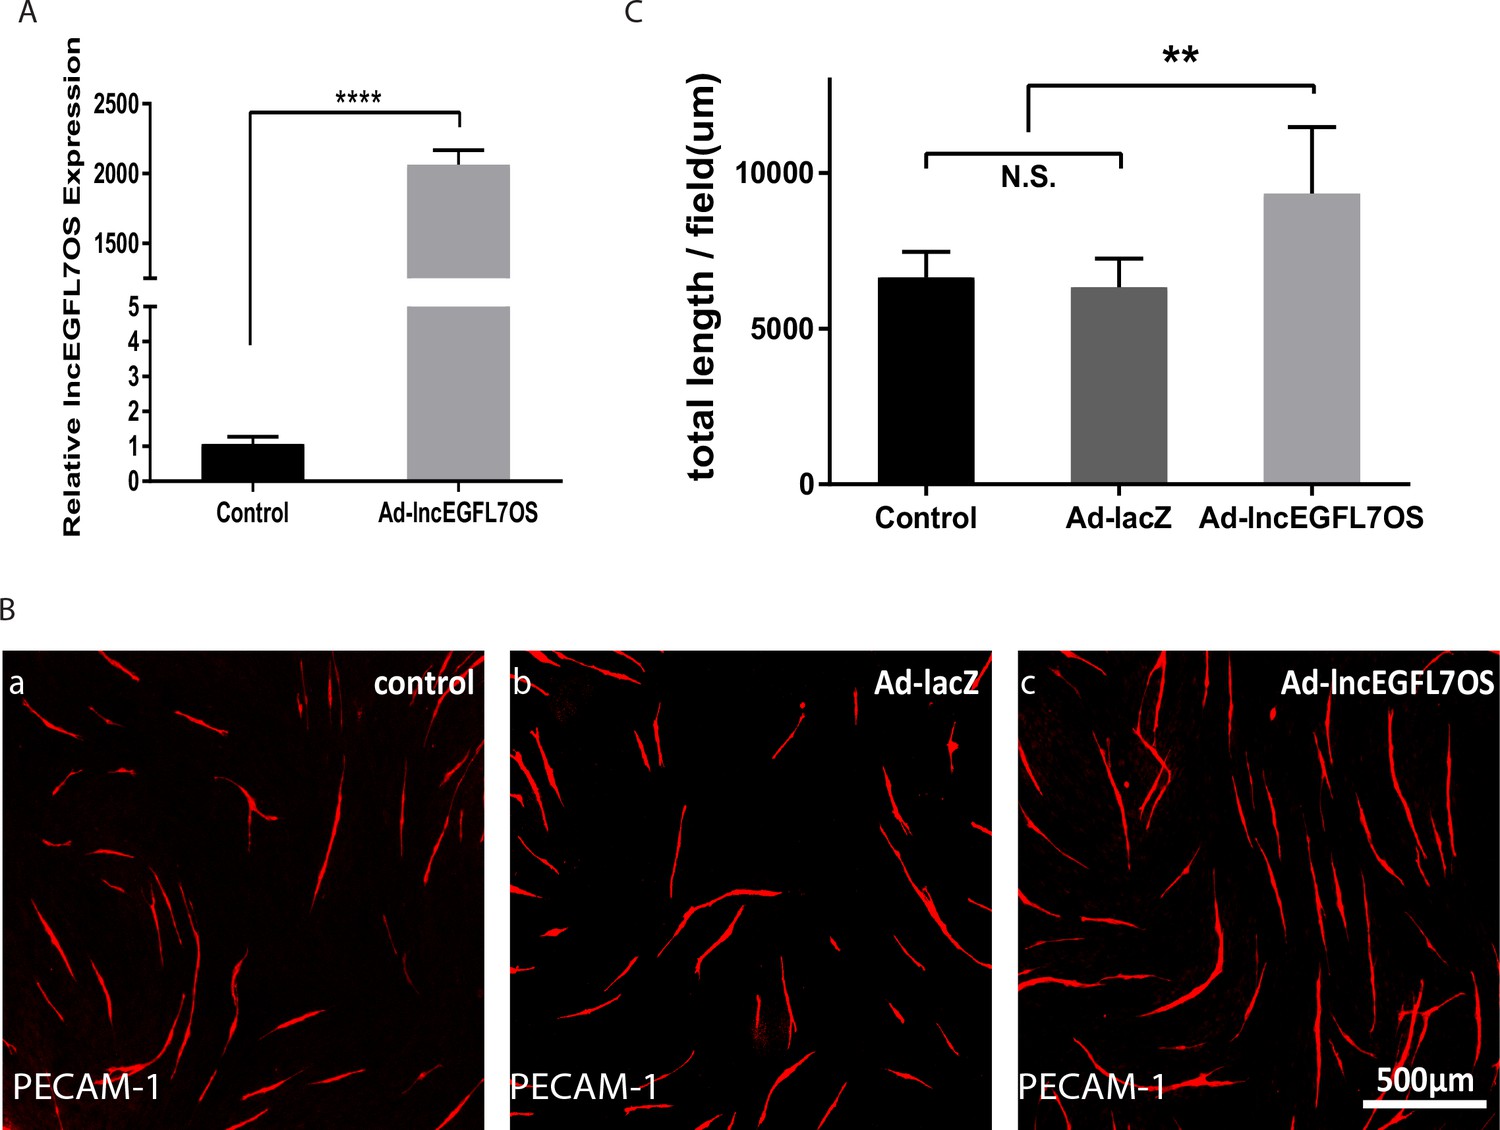
Effect of lncEGFL7OS oeverexpression in angiogenesis.
(A) qRT-PCR showing overexpression of lncEGFL7OS in ECs infected with lncEGFL7OS expressing adenovirus. LacZ expression virus was used as control; (B) Representative images showing enhanced angiogenesis at 7 days after lncEGFL7OS overexpression in an EC-fibroblast co-culture assay. LacZ or noninfection samples were used as controls. Scale bar equals to 500 µm; (C) Quantification of tube length/area in B (n = 3). **p<0.01.
-
Figure 4—figure supplement 2—source data 1
Figure 4—figure supplement 2 source data.
- https://doi.org/10.7554/eLife.40470.021
Figure 5 with 2 supplements
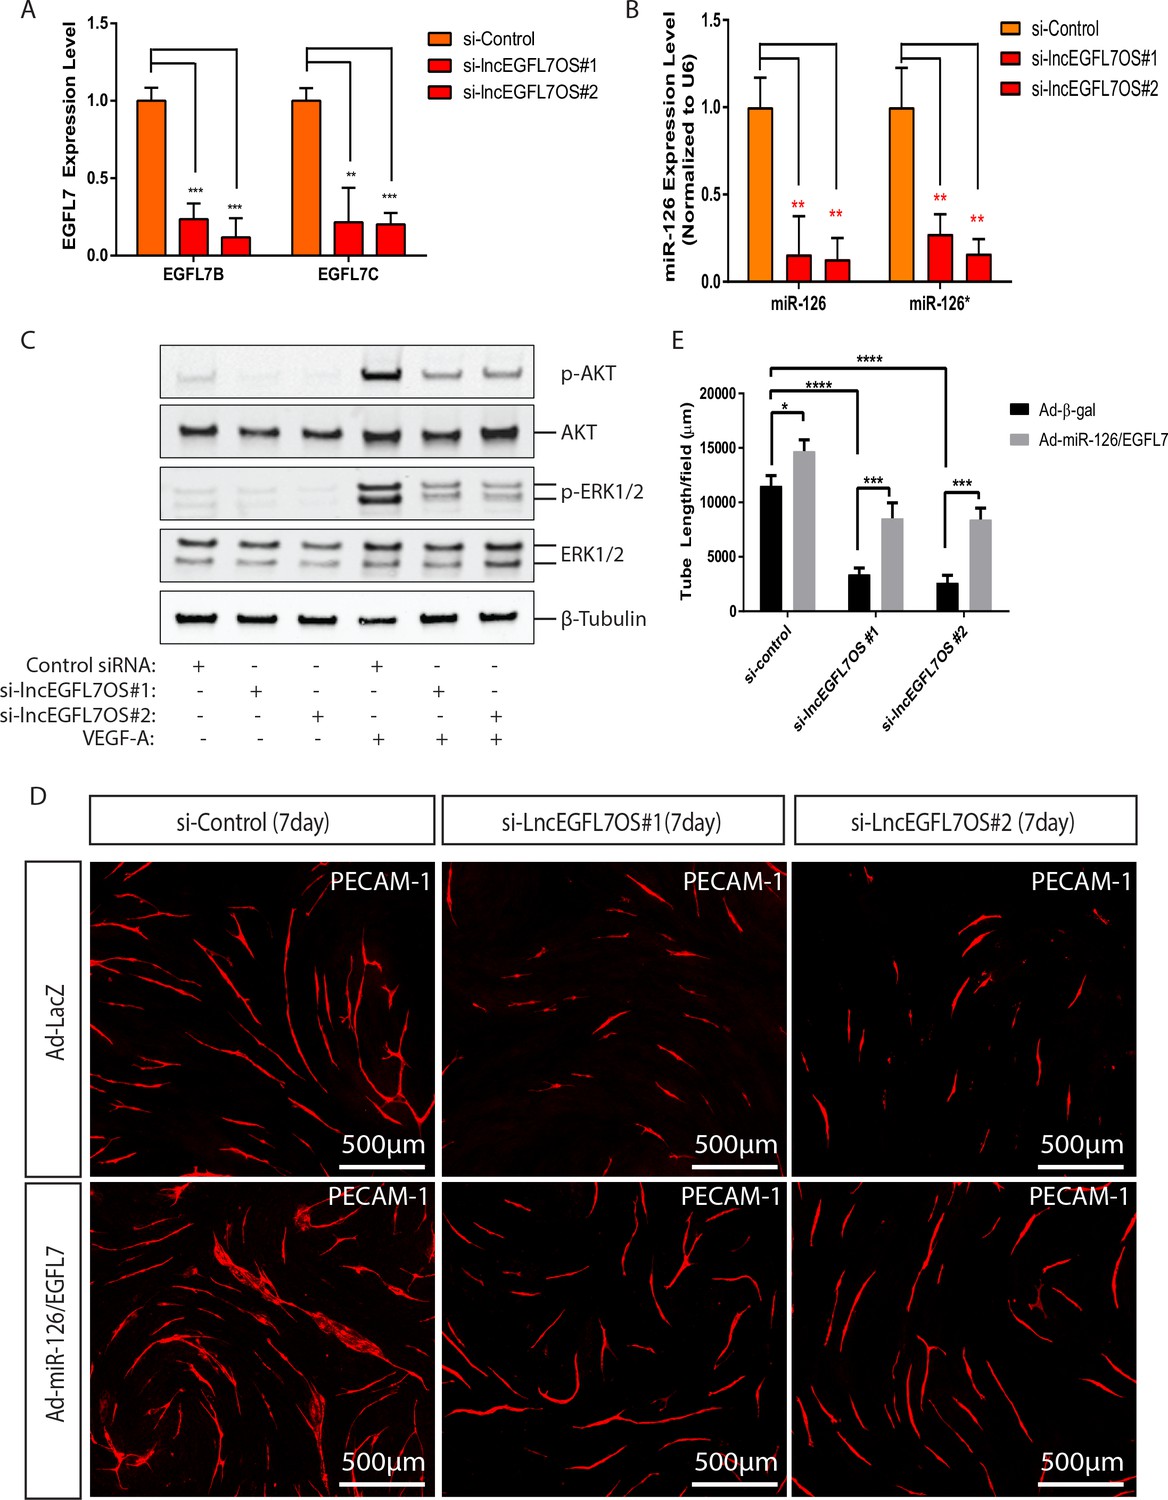
Regulation of EGFL7/miR-126 and angiogenic signaling by lncEGFL7OS.
(A) Expression of EGFL7 B and EGFL7C by qRT-PCR after lncEGFL7OS knockdown in ECs (n = 3). GAPDH served as normalization control. (B) Expression of miR-126 and miR-126* after lncEGFL7OS knockdown in ECs (n = 3). U6 served as normalization control. (C) Regulation of ERK1/2 and AKT phosphorylation by lncEGFL7OS knockdown in ECs in response to VEGF treatment, as revealed by Western blot. Total ERK1/2 and AKT were used as controls. β-Tubulin was used as a loading control. (D) Rescue of the lncEGFL7OS-knockdown angiogenic phenotype by EGFL7 protein/Adeno-miR-126 in an EC-fibroblast co-culture assay. Scale bar equals to 500 µm. (E) Quantification of the total tube length in D (n = 3). *p<0.05. ***p<0.001, ****p<0.0001.
-
Figure 5—source data 1
Figure 5 source data.
- https://doi.org/10.7554/eLife.40470.027
Figure 5—figure supplement 1
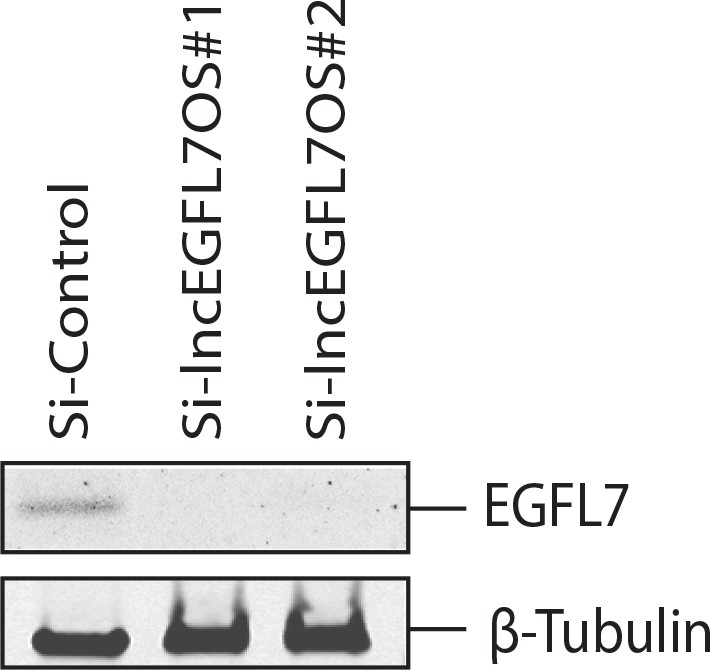
Expression of EGFL7 protein by Western blot after lncEGFL7OS knockdown in ECs (n = 3).
β-Tubulin was used as a loading control.
Figure 5—figure supplement 2
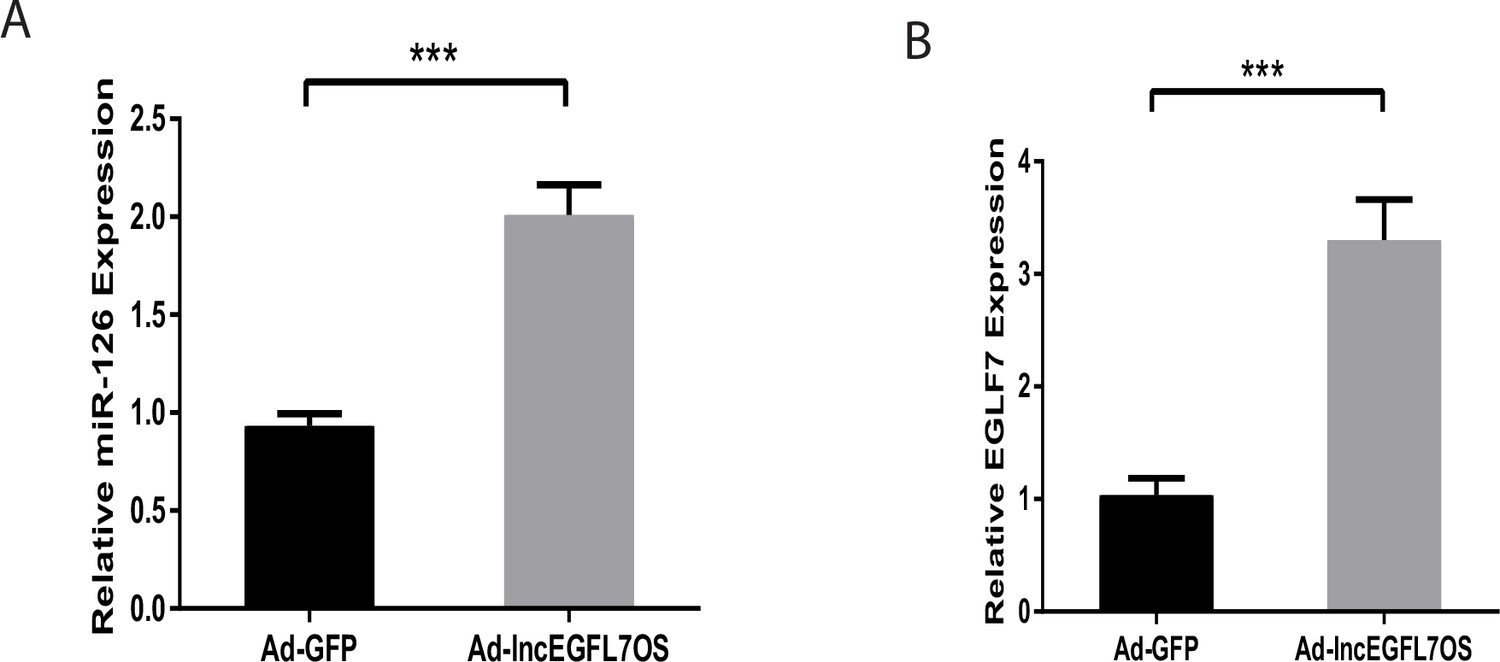
Upregulation of miR-126 and EGFL7 by lncEGFL7OS oeverexpression.
(A) qRT-PCR showing upregulation of miR-126 expression in ECs infected with lncEGFL7OS expressing adenovirus. GFP expression virus was used as control (n = 3). ***p<0.001; (B) qRT-PCR showing upregulation of EGFL7B expression in ECs infected with lncEGFL7OS expressing adenovirus. GFP expression virus was used as control (n = 3). ***p<0.001.
-
Figure 5—figure supplement 2—source data 1
Figure 5—figure supplement 2 source data.
- https://doi.org/10.7554/eLife.40470.026
Figure 6 with 1 supplement
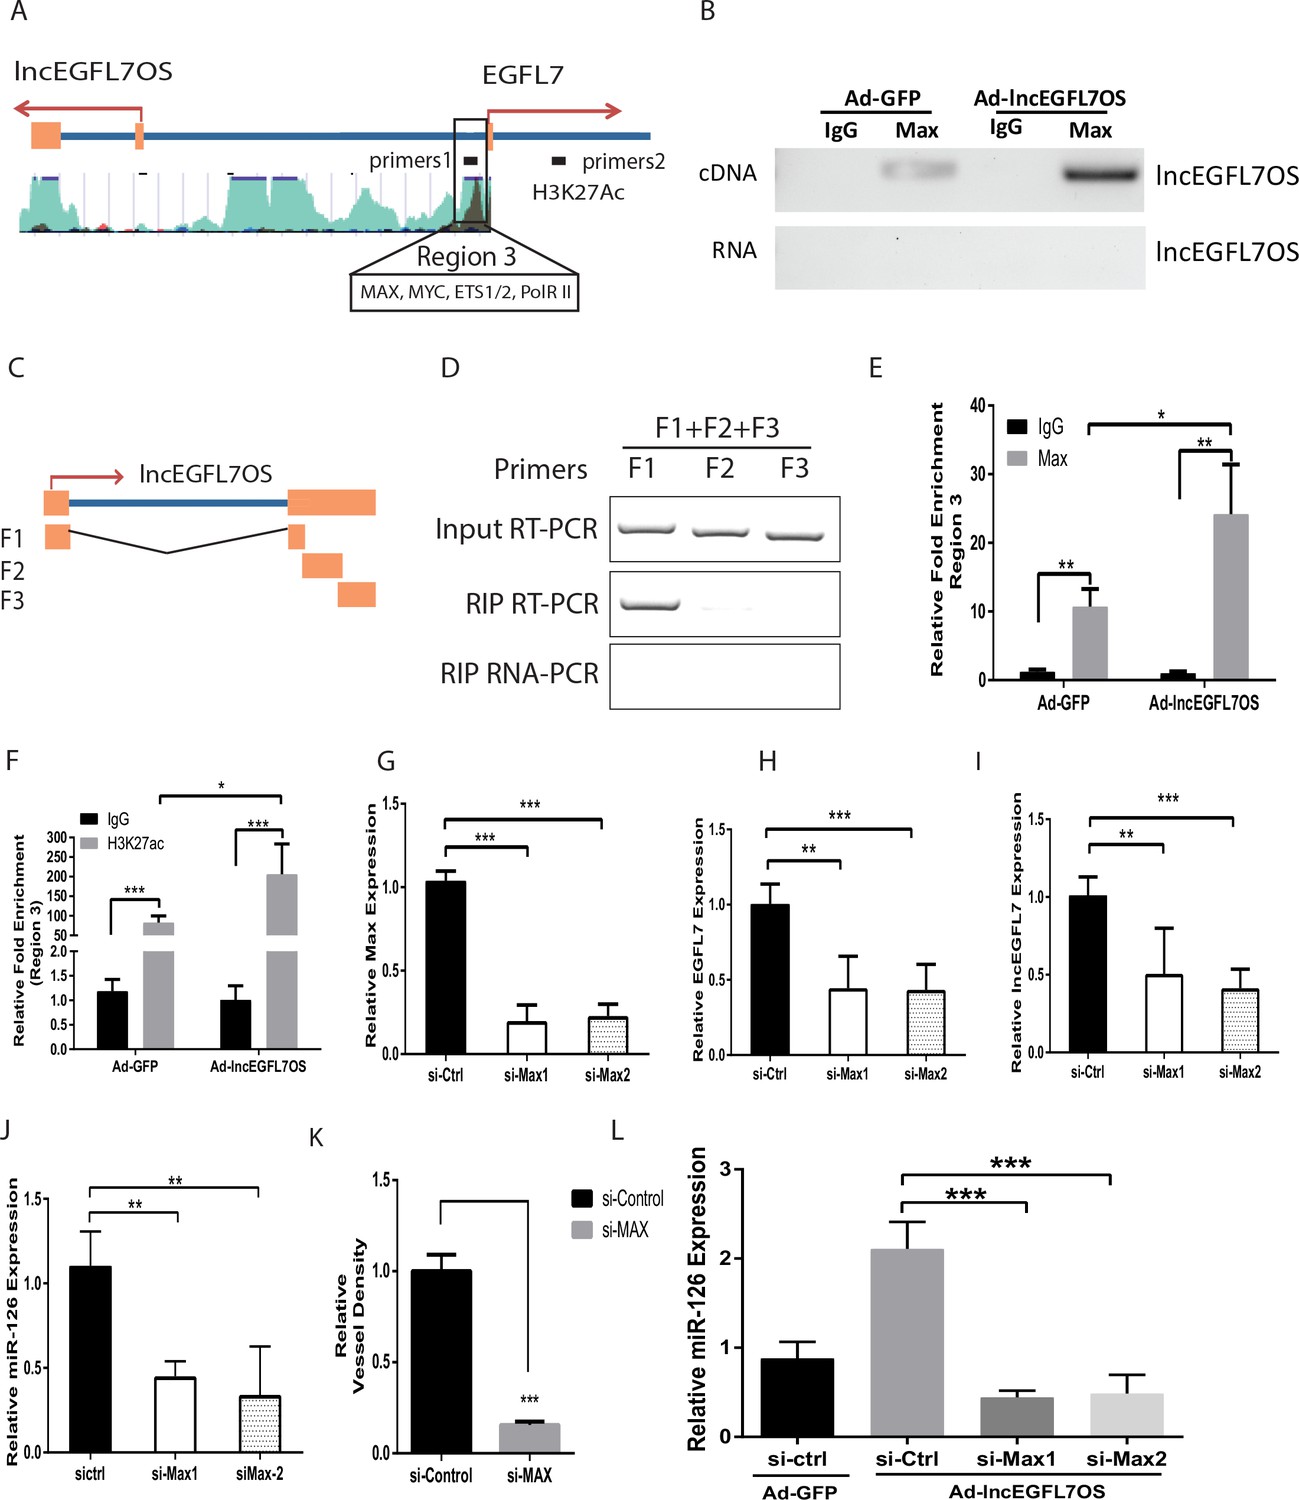
lncEGFL7OS regulates EGFL7/miR-126 transcription by interaction with MAX transcription factor.
(A) Schematic EGFL7/miR-126 enhancer/promoter region. The boxed region is predicted by ENCODE to bind MAX and H3K27Ac. (B) RIP-PCR showing binding of MAX to lncEGFL7OS in ECs. Overexpression of lncEGFL7OS by adenovirus enhances MAX binding. The bottom line shows a non-RT control for PCR. (C) Schematics of the lncEGFL7OS fragments for the MAX-binding assay. (D) RIP PCR showing specific binding of F1 fragment of lncEGFL7OS to MAX protein. Input RT-PCR showed the expression of lncEGFL7 fragments in transfected RPE-19 cells. RIP RT-PCR showed the specific binding of F1 fragment to MAX by RIP assay. RIP RNA-PCR showed the DNase I treated non reverse transcription control. (E) ChIP-PCR showing specific binding of MAX to region three in A. Overexpression of lncEGFL7OS enhances MAX binding to the region. *p<0.05; **p<0.01. (F) ChIP-PCR showing specific binding of H3K27ac to region three in A. Overexpression of lncEGFL7OS enhances H3K27ac binding to the region. *p<0.05; ***p<0.001. (G) Silencing of MAX expression by two independent siRNAs as shown by qRT-PCR. ***p<0.001. (H) Downregulation of EGFL7B by MAX silencing in ECs. **p<0.01, ***p<0.001. (I) Downregulation of lncEGFL7OS by MAX silencing in ECs. **p<0.01, ***p<0.001. (J) Downregulation of miR-126 by MAX silencing in ECs. **p<0.01. (K) Quantification of vessel density in an EC-Fibroblast co-culture assay after MAX silencing. A mix of two independent MAX siRNAs was used in the assay. **p<0.01. (L) MAX silencing blunts the induction of miR-126 by lncEGFL7OS-expressing adenovirus. ***p<0.001.
-
Figure 6—source data 1
Figure 6 source data.
- https://doi.org/10.7554/eLife.40470.031
Figure 6—figure supplement 1
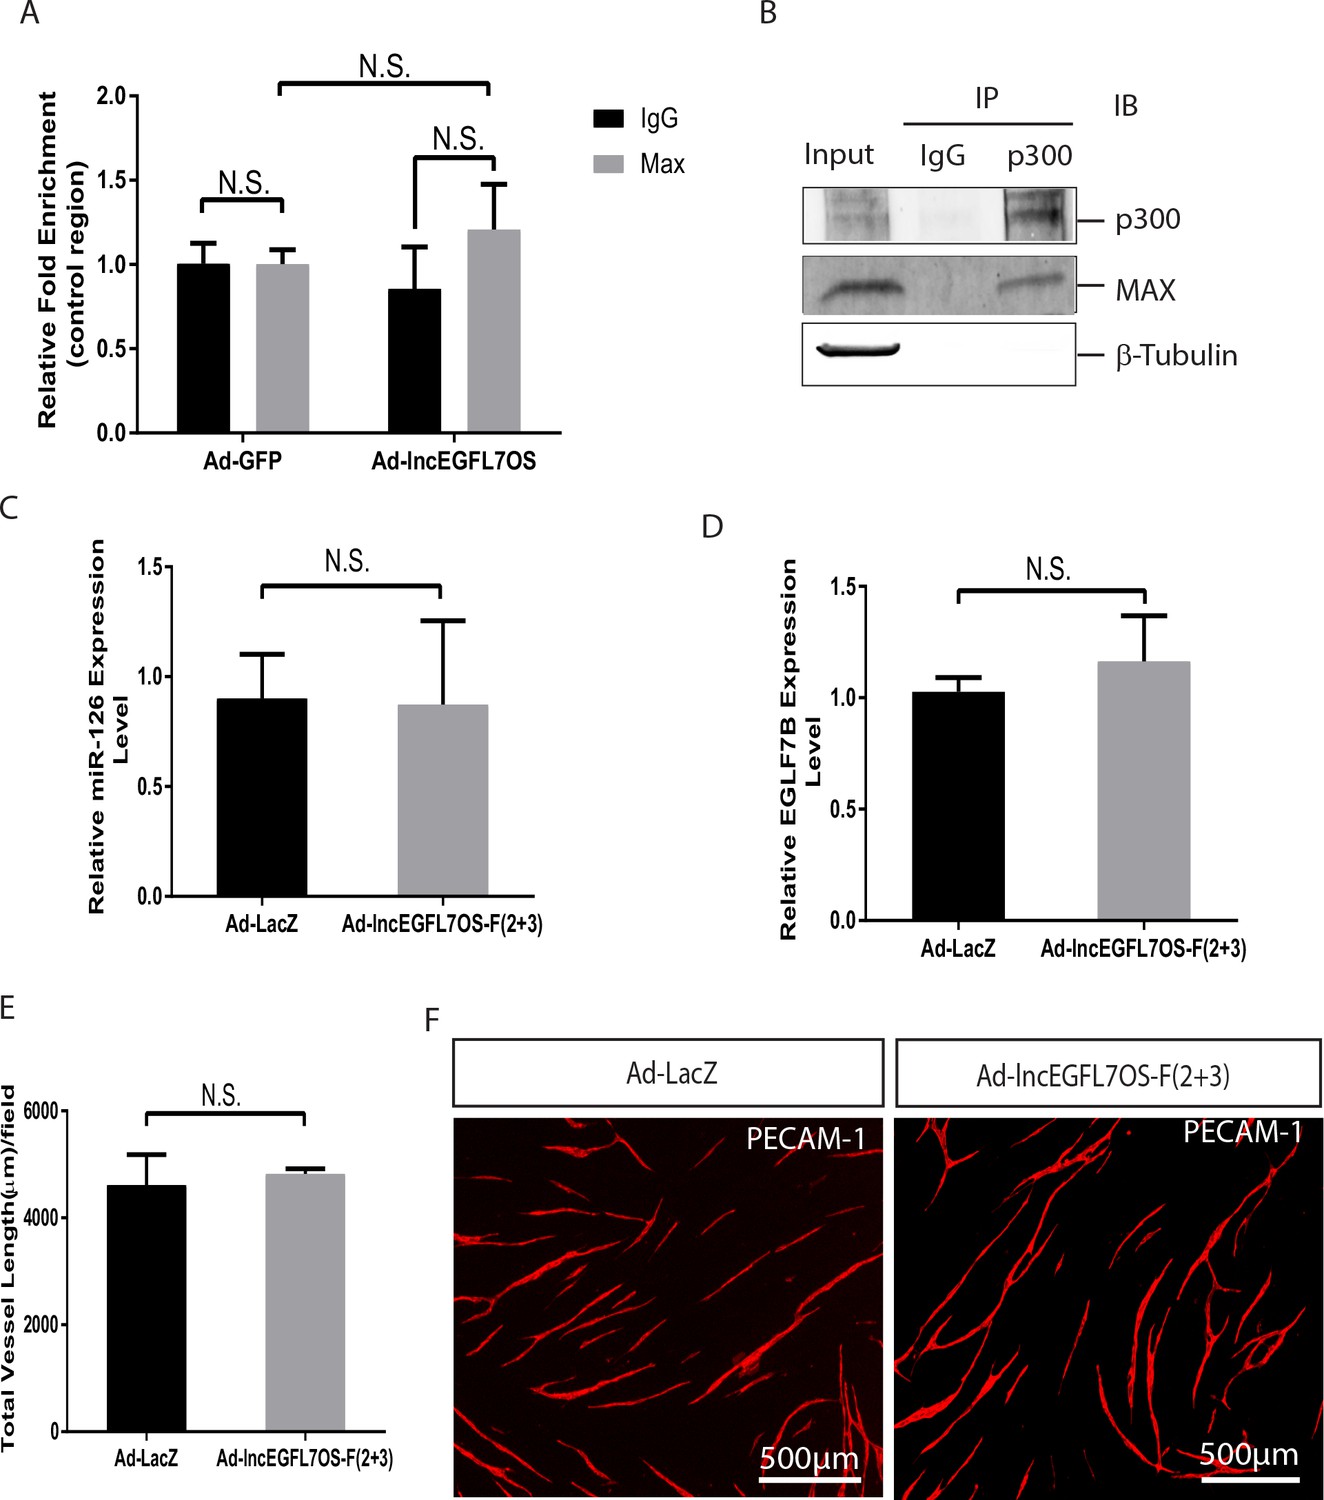
Overexpression of lncEGFL7OS(F2+3) does not affect miR-126 and EGFL7B expression.
(A) ChIP-PCR showing no specific binding of MAX to a control region (primer1 two set in material and method section). Overexpression of lncEGFL7OS does not affect MAX binding to the region (n = 3). N.S., non-significant. (B) Interaction of MAX and p300 in HUVECs by co-immunoprecipitation assay. HUVEC cell lysate was immunoprecipitated with antibody to p300, and blotted with MAX, p300, β-Tubulin antibodies. (C) qRT-PCR showing overexpression of lncEGFL7OS-F(2 + 3) does not affect miR-126 expression. ECs were infected with lncEGFL7OS-F (2 + 3)-expressing adenovirus. LacZ expression virus was used as control. N.G., non-significant. (D) qRT-PCR showing overexpression of lncEGFL7OS-F 2 + 3) does not affect EGFL7B expression. ECs were infected with lncEGFL7OS-F(2 + 3)-expressing adenovirus. LacZ expression virus was used as control. N.G., non-significant. (E) Quantification of the total vessel length in an EC-fibroblast co-culture assay showing that overexpression of lncEGFL7OS-F(2 + 3) does not affect angiogenesis in vitro (n = 3). ECs were infected with lncEGFL7OS-F(2 + 3)-expressing adenovirus. LacZ expression virus was used as control. N.G., non-significant. (F) Representative images of the experiments in E after PECAM-1 staining of ECs. Scale bar equals to 500 µm.
-
Figure 6—figure supplement 1—source data 1
Figure 6—figure supplement 1 source data.
- https://doi.org/10.7554/eLife.40470.030
Figure 7

lncEGFL7OS-dependent MAX-regulated gene expression is locus dependent.
(A) ChIP-PCR showing specific binding of MAX to region 3 (as in Figure 6A). Silencing of lncEGFL7OS decreased MAX binding to the region (n = 3). *p<0.05; ***p<0.001. (B) ChIP-PCR showing specific binding of H3K27ac to region 3 (as in Figure 6A). Silencing of lncEGFL7OS decreased H3K27ac binding to the region (n = 3). **p<0.01; ***p<0.001. (C) Repression of Cyclin D2 expression in HUVEC cells by MAX knockdown using two independent siRNAs (n = 3). *p<0.05; **p<0.01. (D) Repression of DHFR expression in HUVEC cells by MAX knockdown using two independent siRNAs (n = 3). *p<0.05; **p<0.01. (E) lncEGFL7OS overexpression enhances Cyclin D2 expression (n = 3). *p<0.05. (F) lncEGFL7OS overexpression enhances DHFR expression (n = 3). ***p<0.001. (G) ChIP-PCR showing specific binding of MAX to the Cyclin D2 promoter. Overexpression of lncEGFL7OS further enhances MAX binding to the region (n = 3). **p<0.01; ***p<0.001. (H) ChIP-PCR showing specific binding of MAX to the DHFR promoter. Overexpression of lncEGFL7OS further enhances MAX binding to the region (n = 3). *p<0.05; ***p<0.001. (I) ChIP-PCR showing increased H3K27 acetylation at the Cyclin D2 promoter. Overexpression of lncEGFL7OS further enhances H3K27 acetylation at the region (n = 3). *p<0.05; ***p<0.001. (J) ChIP-PCR showing increased H3K27 acetylation at the DHFR promoter. Overexpression of lncEGFL7OS further enhances H3K27 acetylation at the region (n = 3). **p<0.01; ***p<0.001. (K) qRT-PCR showing no effect of lncEGFL7 knockdown on Cyclin D2 expression (n = 3). N.S., non-significant. (L) qRT-PCR showing no effect of lncEGFL7 knockdown on DHFR expression (n = 3). N.S., non-significant.
-
Figure 7—source data 1
Figure 7 source data.
- https://doi.org/10.7554/eLife.40470.033
Figure 8
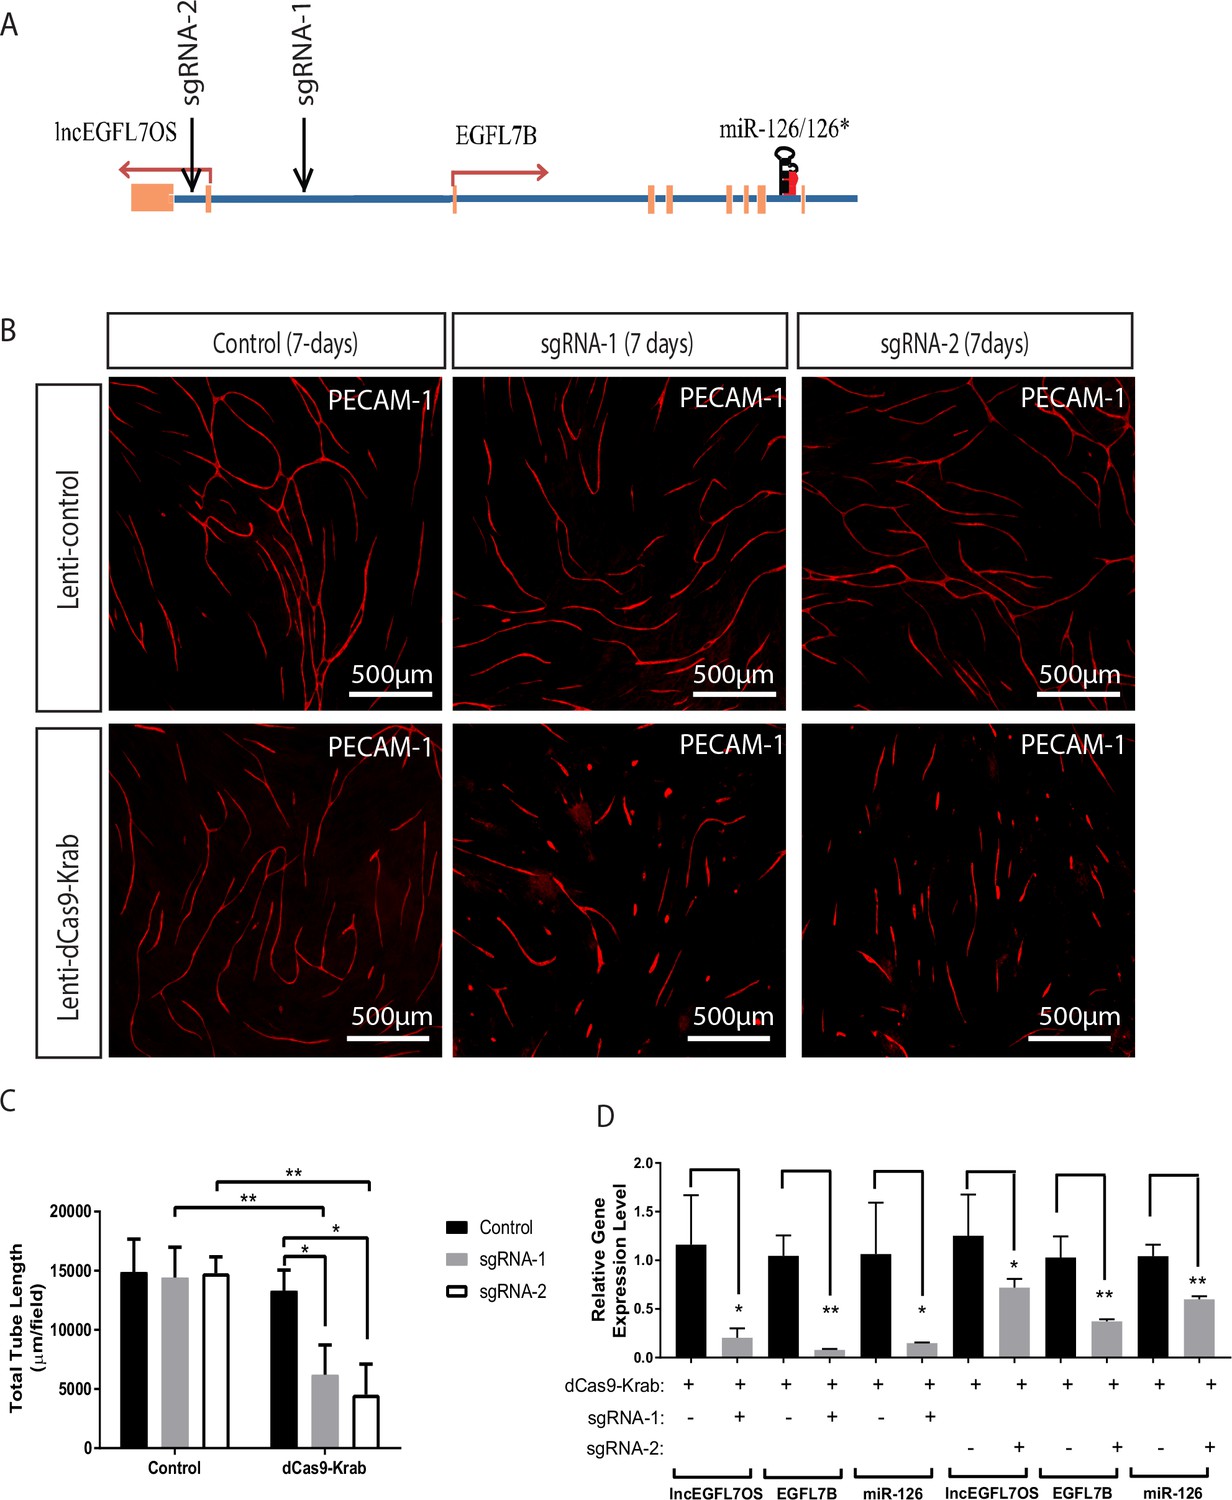
Inhibition of angiogenesis by CRISPR-mediated targeting of the EGFL7/miR-126/lncEGFL7OS locus.
(A) Schematic locations of the sgRNAs in the EGFL7/miR-126/lncEGFL7OS genes. (B) Representative images showing sgRNA mediated repression of angiogenesis in an EC-fibroblast co-culture assay. The capillaries are stained with PECAM-1 antibody. Scale bar equals to 500 µm. All constructs were made into lentivirus. Lenti-control vector: pLJM1-EGFP; Lenti-dCas9-Krab: pHR-SFFV-dCas9-BFP-KRAB; sgRNA-1: lentiGuide-gRNA1; sgRNA-2: lentiGuide-gRNA2; Control: lentiGuide-Puro. (C) Quantification of total tube length in B (n = 3 each). Two independent sgRNAs were used for quantification. *p<0.05; **p<0.01. (D) Expression of lncEGFL7OS, EGFL7B and miR-126 at 48 hr after transduction in B by qRT-PCR. *p<0.05; **p<0.01.
-
Figure 8—source data 1
Figure 8 source data.
- https://doi.org/10.7554/eLife.40470.035
Figure 9
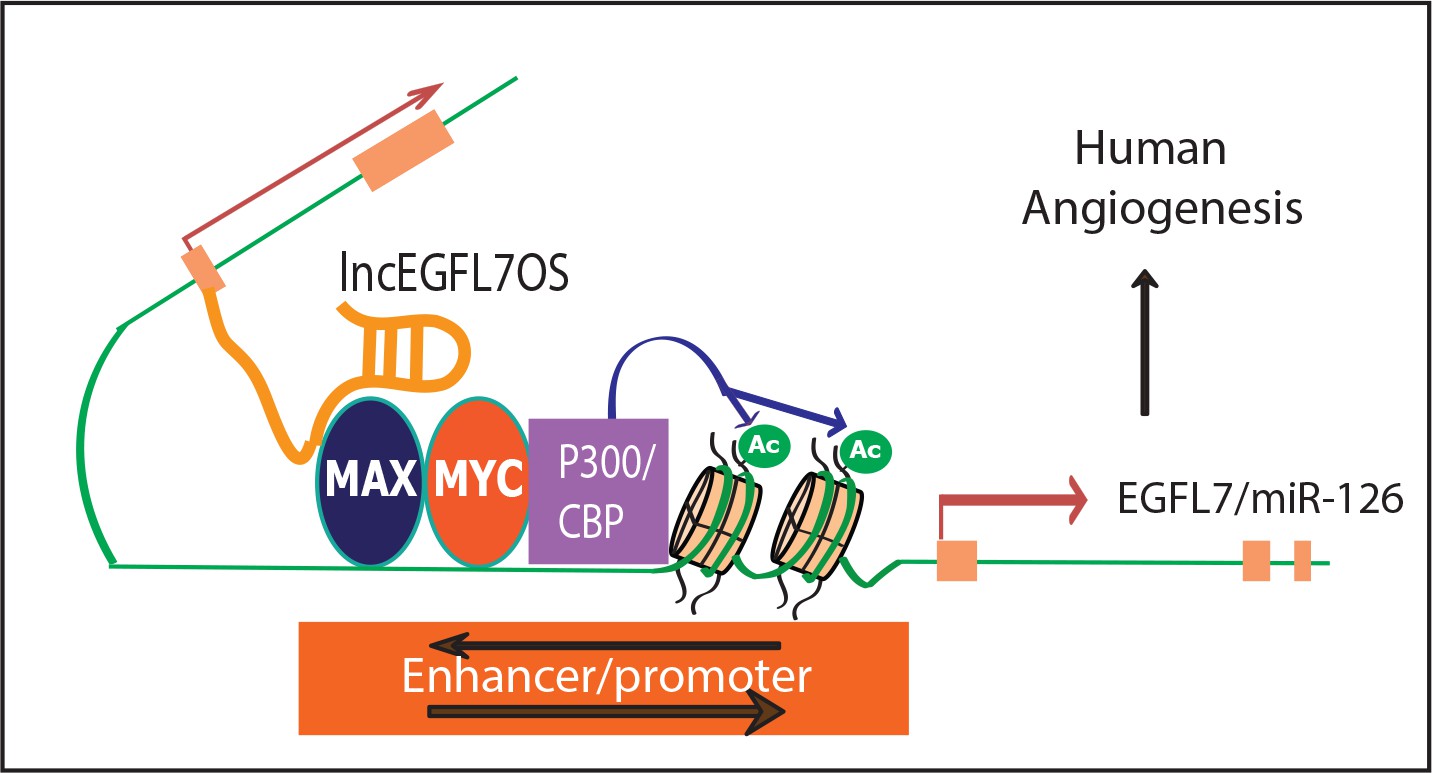
A model for lncEGFL7OS in human angiogenesis.
LncEGFL7OS is transcribed in the opposite strand of EGFL7/miR-126 gene under the control of an ETS transcription factors-regulated bidirectional promoter. In turn, lncEGFL7OS transcripts recruit MAX, which interacts with p300 and increase the acetylation of Histone H3K27. This in turn enhances the transcription of EGFL7/miR-126 gene and therefore angiogenesis through MAPK and AKT pathways in human ECs.
Additional files
-
Supplementary file 1
List of top-50 EC-enriched lncRNAs and their associated genes.
- https://doi.org/10.7554/eLife.40470.037
-
Supplementary file 2
List of EC-enriched enhancer-like lncRNAs from the array.
- https://doi.org/10.7554/eLife.40470.038
-
Supplementary file 3
List of the EC-enriched lncRNAs that have associated protein-coding genes within 10 kb, showing parallel or inverse expression pattern with their associated genes.
- https://doi.org/10.7554/eLife.40470.039
-
Supplementary file 4
(A) CT values from the PCR using standard in vitro transcribed lncEGFL7OS RNA.
The RNA was harvested at 1.85*1011 copies per µl. After reverse transcription, 1 µl the cDNA was diluted at 103, 104, 105, 106 and 107 times, respectively, as templates to carry out Real-time PCR. The copy numbers were calculated based on the dilution folds. (B) The CT values and the log10 (Copy number) were used to establish the standard curve and formulation for copy number calculation. The Log10 (copy number) and CT value relation can be modeled as: Y = −0.4438*X + 16.15. R square is 0.9415. (C) The formulation in (B) was used to calculate the copy number per well of the HUVEC cell samples. Based on the calculation that each well has ~1600 cells, the copy number per cell was calculated.
- https://doi.org/10.7554/eLife.40470.040
-
Supplementary file 5
LncEGFL7OS Stellaris FISH probes designed according to Stellaris FISH probe designer.
- https://doi.org/10.7554/eLife.40470.041
-
Transparent reporting form
- https://doi.org/10.7554/eLife.40470.042
Download links
A two-part list of links to download the article, or parts of the article, in various formats.
Downloads (link to download the article as PDF)
Open citations (links to open the citations from this article in various online reference manager services)
Cite this article (links to download the citations from this article in formats compatible with various reference manager tools)
LncEGFL7OS regulates human angiogenesis by interacting with MAX at the EGFL7/miR-126 locus
eLife 8:e40470.
https://doi.org/10.7554/eLife.40470


