Quantitative mapping of protein-peptide affinity landscapes using spectrally encoded beads
- Stanford University, United States
- University of California, San Francisco, United States
- Chan Zuckerberg Biohub, United States
Figures
Figure 1 with 4 supplements
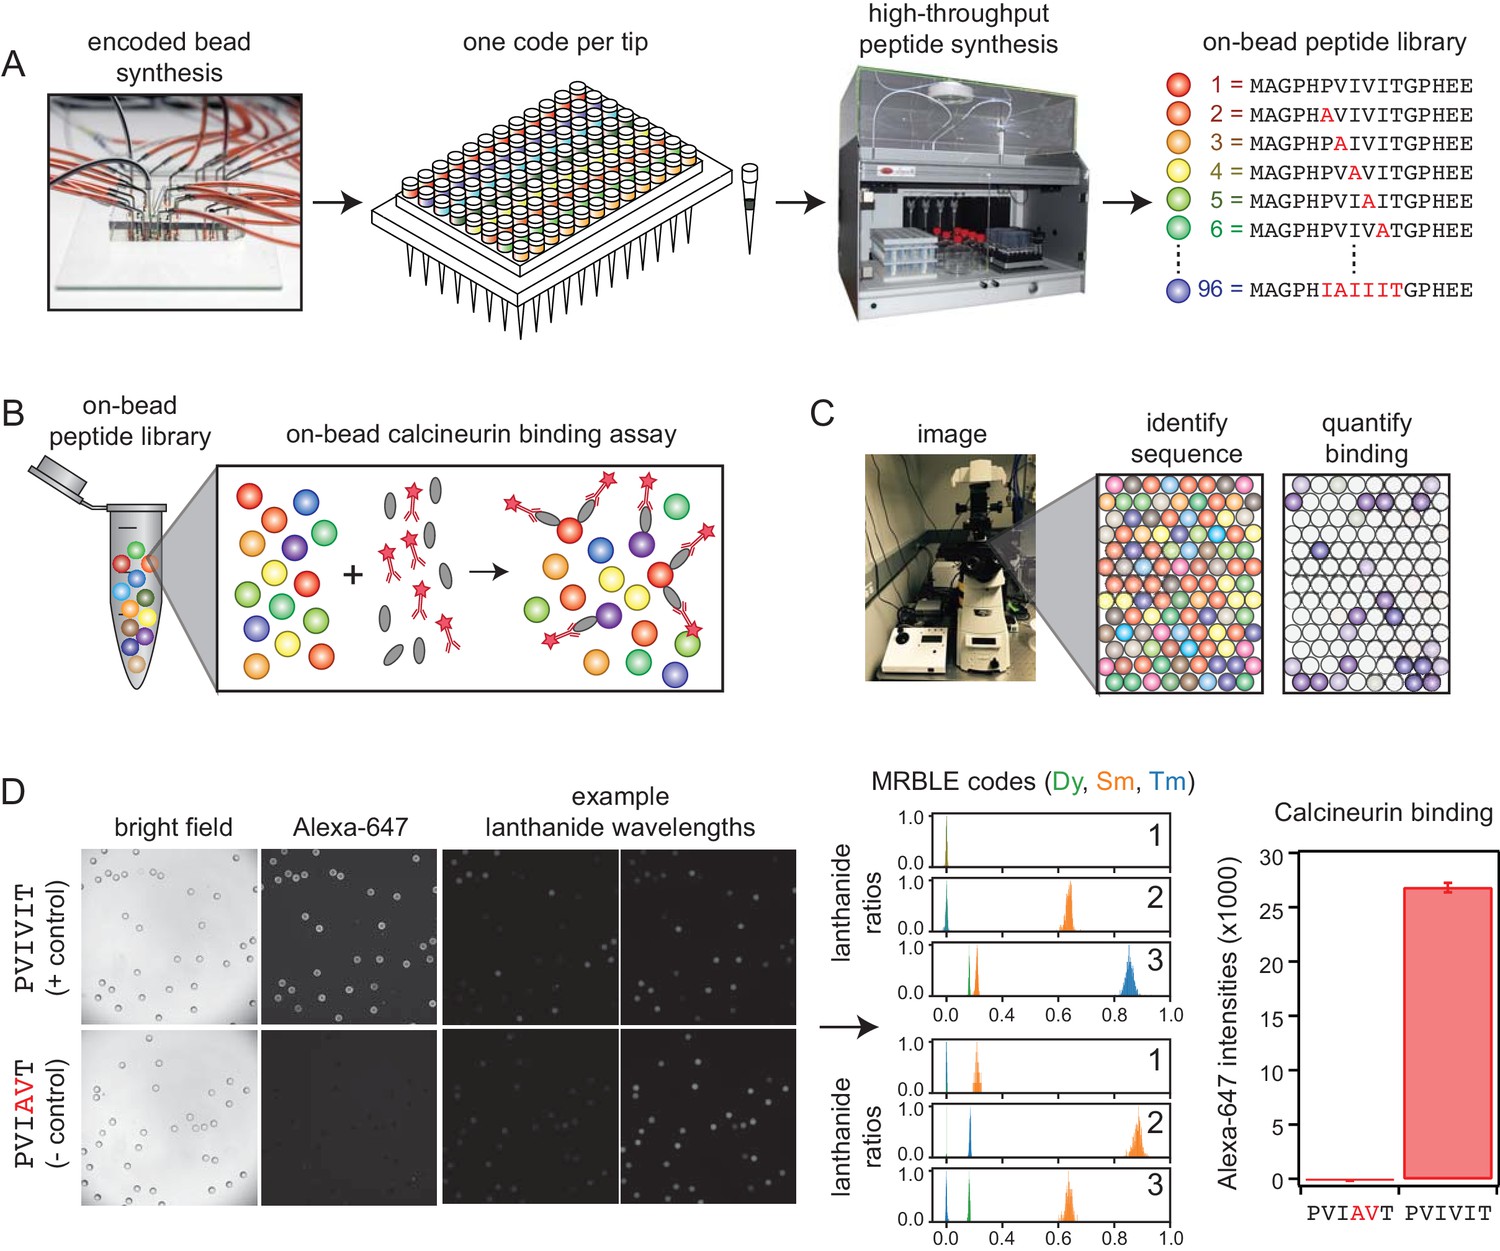
MRBLE-pep experimental pipeline for high-throughput measurement of protein-peptide interactions.
(A) Encoded beads are synthesized in a microfluidic device and output to peptide synthesis tips arrayed in a 96 well plate format with one MRBLE code per tip. Peptides are then synthesized directly on MRBLEs via solid phase peptide synthesis with a unique 1:1 linkage between peptide sequence and spectral code. (B) MRBLE-pep libraries are pooled and incubated with an epitope-tagged protein and fluorescently-labeled antibody. (C) Following incubation and washing, peptide sequence and amount of bound protein are determined via imaging. (D) Example data showing images of MRBLE-pep beads coated with a CN-bound and negative control peptide, measured lanthanide ratios, and bound antibody intensities.
-
Figure 1—source data 1
PVIVIT code ratios.
- https://doi.org/10.7554/eLife.40499.007
-
Figure 1—source data 2
‘PVIAVT code ratios.
- https://doi.org/10.7554/eLife.40499.008
Figure 1—figure supplement 1
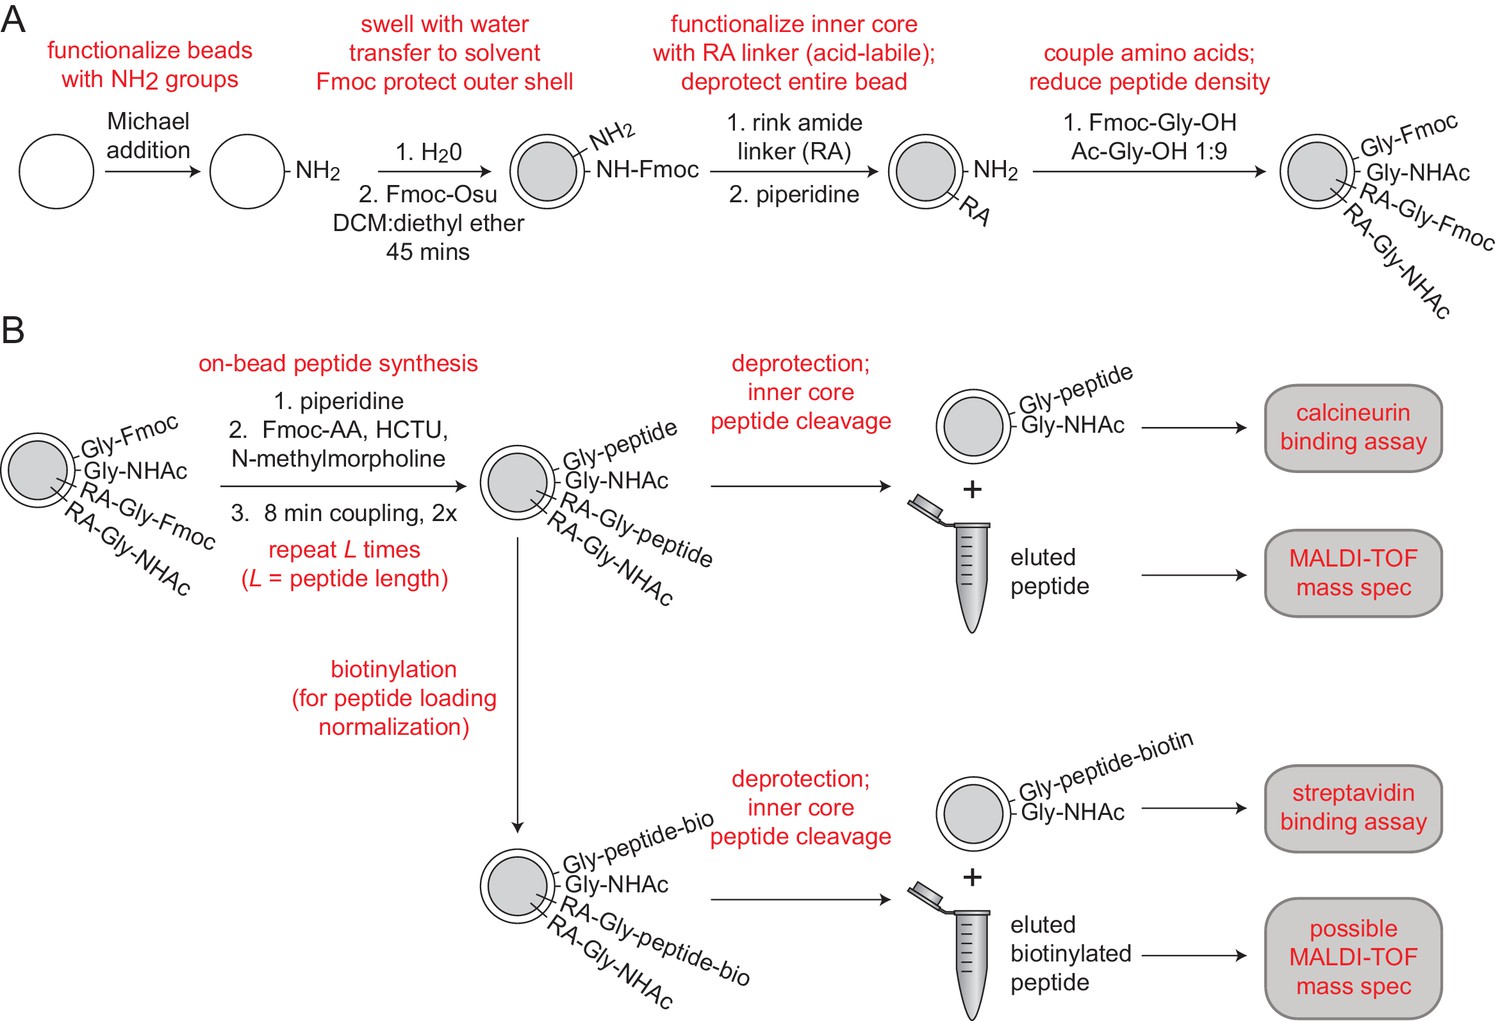
Integrated peptide quality control and quantification.
(A) Synthesis scheme for functionalizing MRBLE cores with an acid-labile rink amide linker and MRBLE shells with an acid-resistant glycine linker (Liu et al., 2002). (B) Experimental pipeline for peptide elution, quality control, and quantification.
Figure 1—figure supplement 2
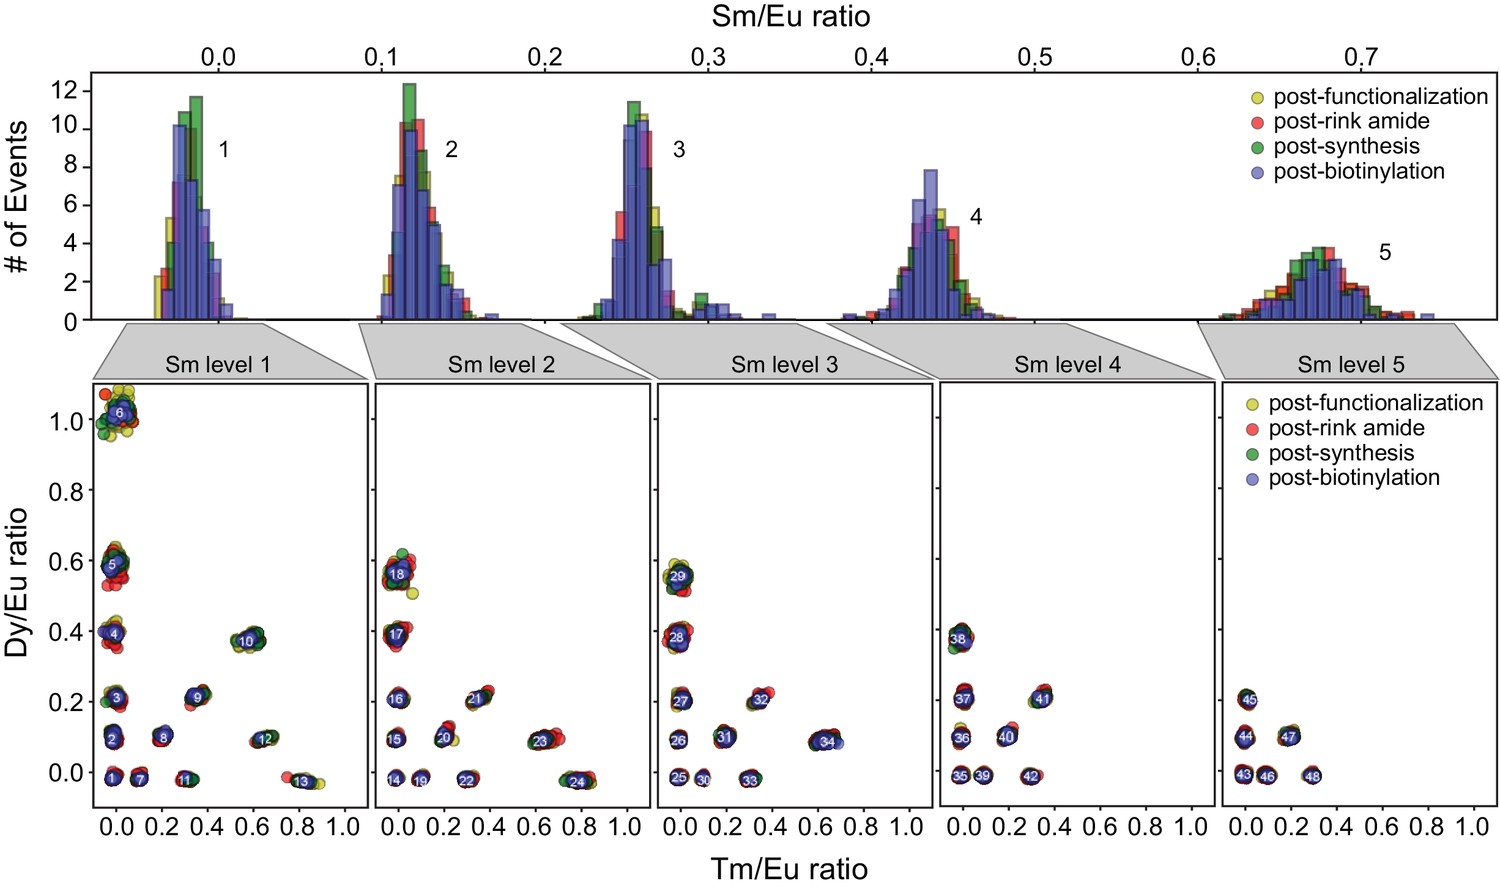
MRBLE spectral codes are unaffected by chemical reagents required for peptide synthesis.
Each embedded MRBLE code is composed of a unique combination of 4 lanthanides (Europium (Eu), Dysprosium (Dy), Samarium (Sm), and Thulium (Tm)) and expressed in terms of 3 ratios (Sm/Eu, Dy/Eu, and Tm/Eu). Histograms of Sm/Eu ratios within each bead remain unchanged after bead functionalization, rink amide coupling, peptide synthesis, and biotinylation (top). Scatter plots of Dy/Eu and Tm/Eu ratios for each of 5 possible Sm/Eu ratios demonstrate that these ratios also remain constant throughout the synthesis process (bottom).
Figure 1—figure supplement 3
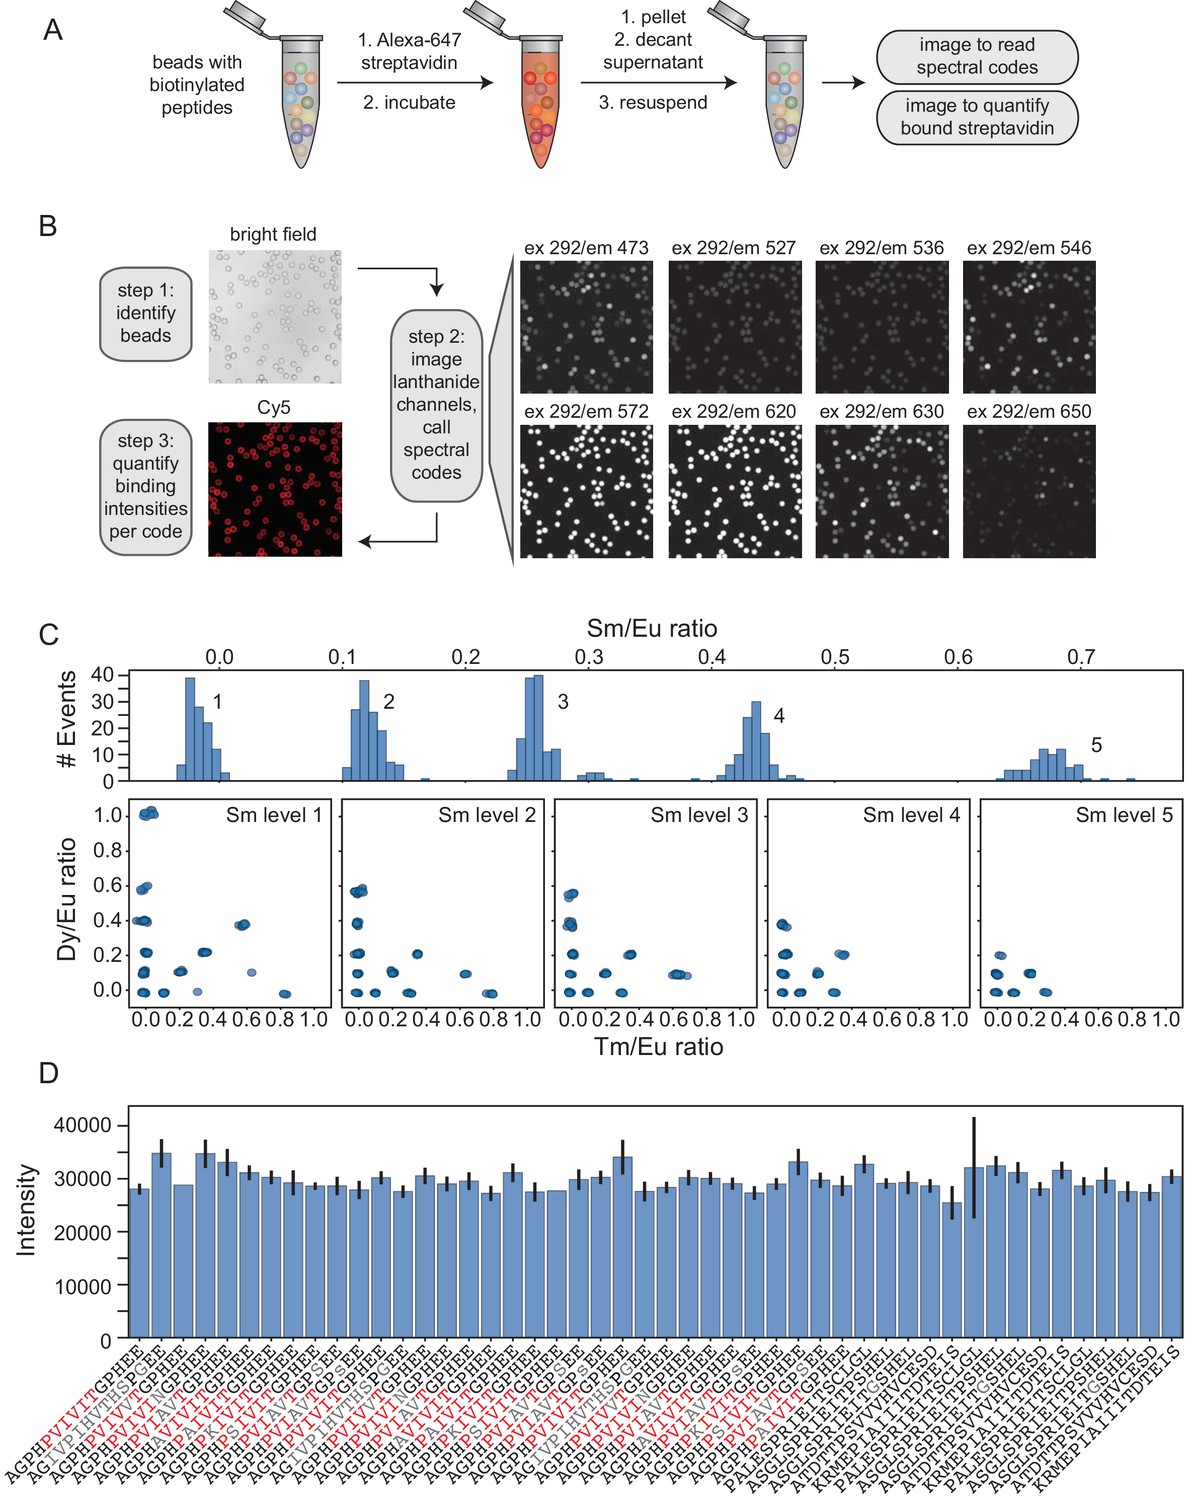
Streptavidin binding assay reveals any sequence-specific differences in peptide synthesis efficiency.
(A) Experimental pipeline for streptavidin binding assay. MRBLE peptide libraries are biotinylated, incubated with Alexa-647-labeled streptavidin, washed, and imaged to identify embedded spectral codes and peptide sequences associated with each bead as well as quantify the amount of bound streptavidin. (B) Example images showing Alexa-647-labeled streptavidin binding to biotinylated MRBLE libraries and image processing steps. (C) Histograms and scatter plots of MRBLE Sm/Eu, Dy/Eu, and Tm/Eu ratios showing 48 clearly resolved intensity clusters and resolvable spectral codes. (D) Measured bound streptavidin intensities (median ± standard error on the mean) for an example 48-code library containing multiple systematic variants of candidate calcineurin substrates.
Figure 1—figure supplement 4
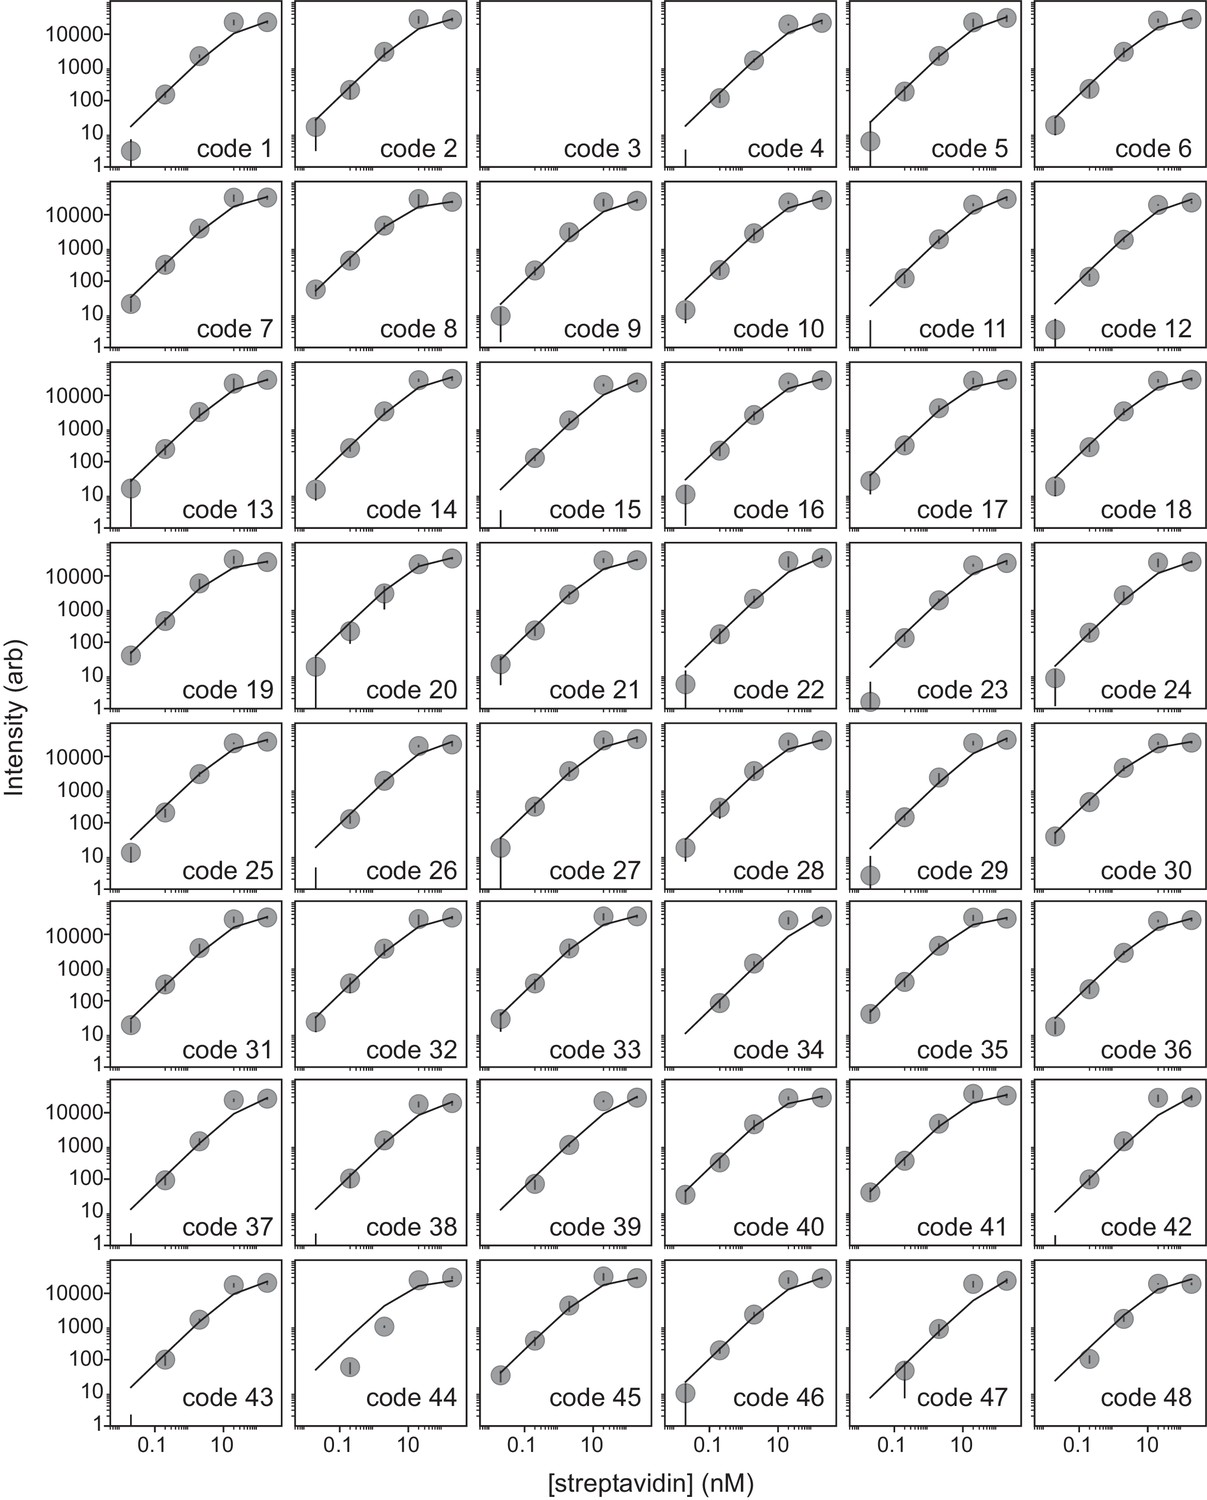
Streptavidin binding assay can be used to determine peptide loading density.
Scatter plots of measured intensity per bead (median ± s.e.m) as a function of Alexa-647-labeled streptavidin concentration demonstrate that intensities saturate at approximately 20 nM labeled streptavidin. Each reaction includes ~7000 total beads in a 100 μL volume, suggesting that each individual bead displays ∼2 × 10⁸ peptides.
Figure 2 with 3 supplements
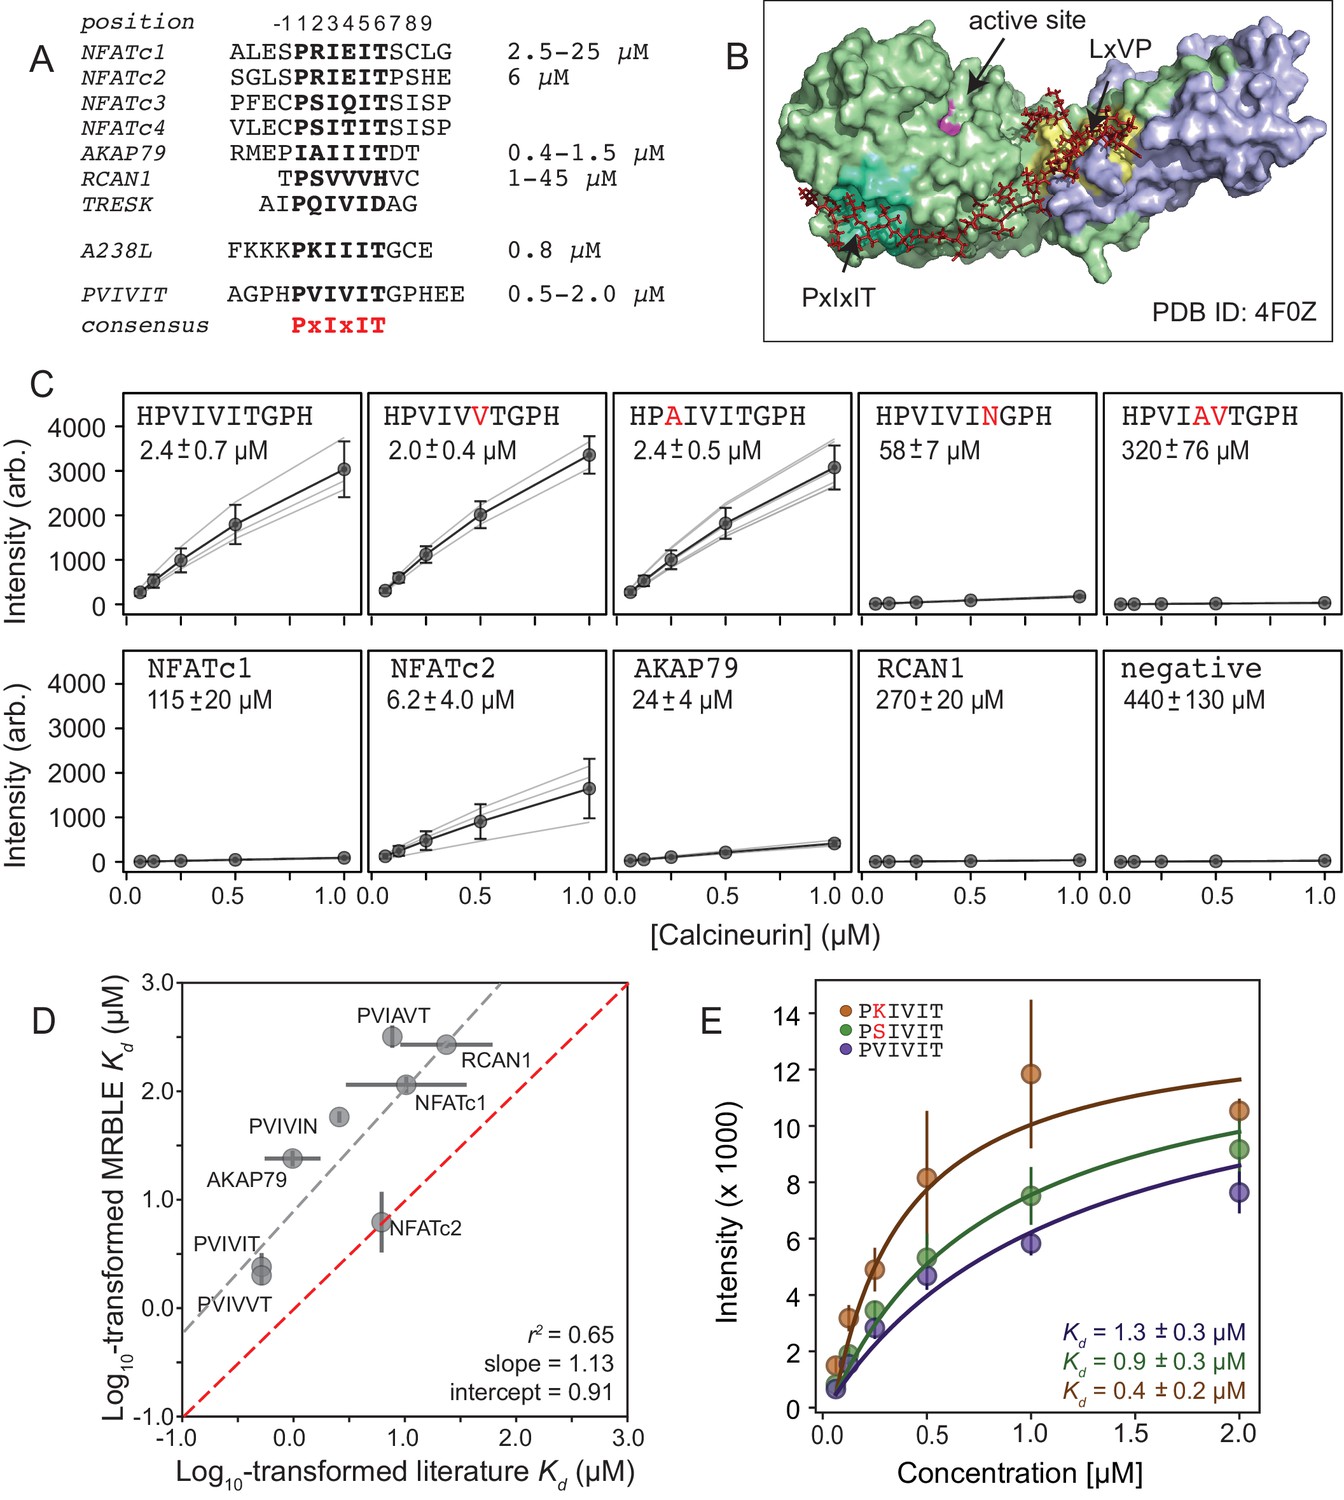
MRBLEs allow quantitative measurement of CN-SLiM interactions in high-throughput.
(A) Sequence alignment for previously identified CN PxIxIT binding sites (see Supplementary file 1 for references). (B) Crystal structure showing CN heterodimer bound to the A238L inhibitor including both PxIxIT and LxVP binding sites (PDB ID: 4F0Z). (C) Concentration-dependent binding for CN interacting with either PVIVIT variants (top), natural PxIxIT peptides (bottom), or a scrambled PxIxIT motif (bottom). Each peptide was synthesized on three different MRBLE codes (light grey lines); affinities were determined from global Langmuir isotherm fits (black) to median values at each concentration (grey circles). (D) MRBLE-derived and literature reported values for various CN-PxIxIT interactions. Grey solid line indicates linear regression between data sets; dotted line indicates expected 1:1 agreement. (E) Langmuir isotherm fits to concentration-dependent binding behavior for CN interacting with candidate high-affinity PVIVIT core variants.
-
Figure 2—source data 1
‘Triplicate low’ affinity measurements.
- https://doi.org/10.7554/eLife.40499.013
-
Figure 2—source data 2
‘Triplicate high’ affinity measurements.
- https://doi.org/10.7554/eLife.40499.014
Figure 2—figure supplement 1
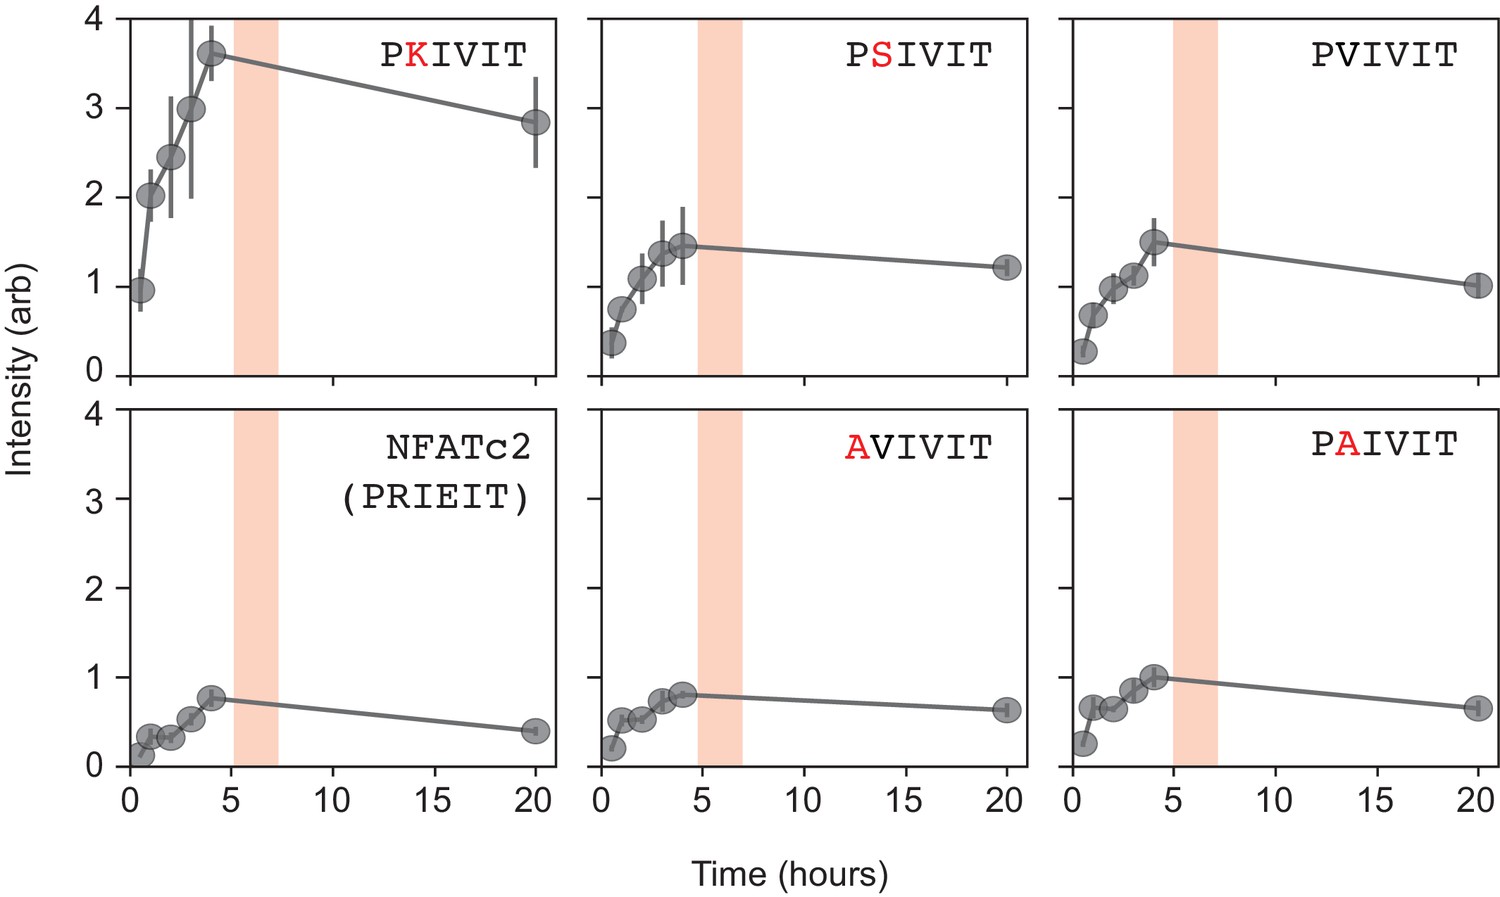
Time-dependent measurements of calcineurin binding demonstrating that calcineurin-MRBLE on-rates are slow.
Measured intensities (grey dots with interpolated line) for 6 PxIxIT variant peptides (PKIVIT, PSIVIT, PVIVIT, NFATc2, AVIVIT, and PAIVIT) as a function of time for a reaction concentration of 0.25 μM calcineurin. Intensities appear to saturate at 5–6 hr and decrease only slightly after 24 hr. Pink boxes signify the time window for all subsequent measurements.
Figure 2—figure supplement 2
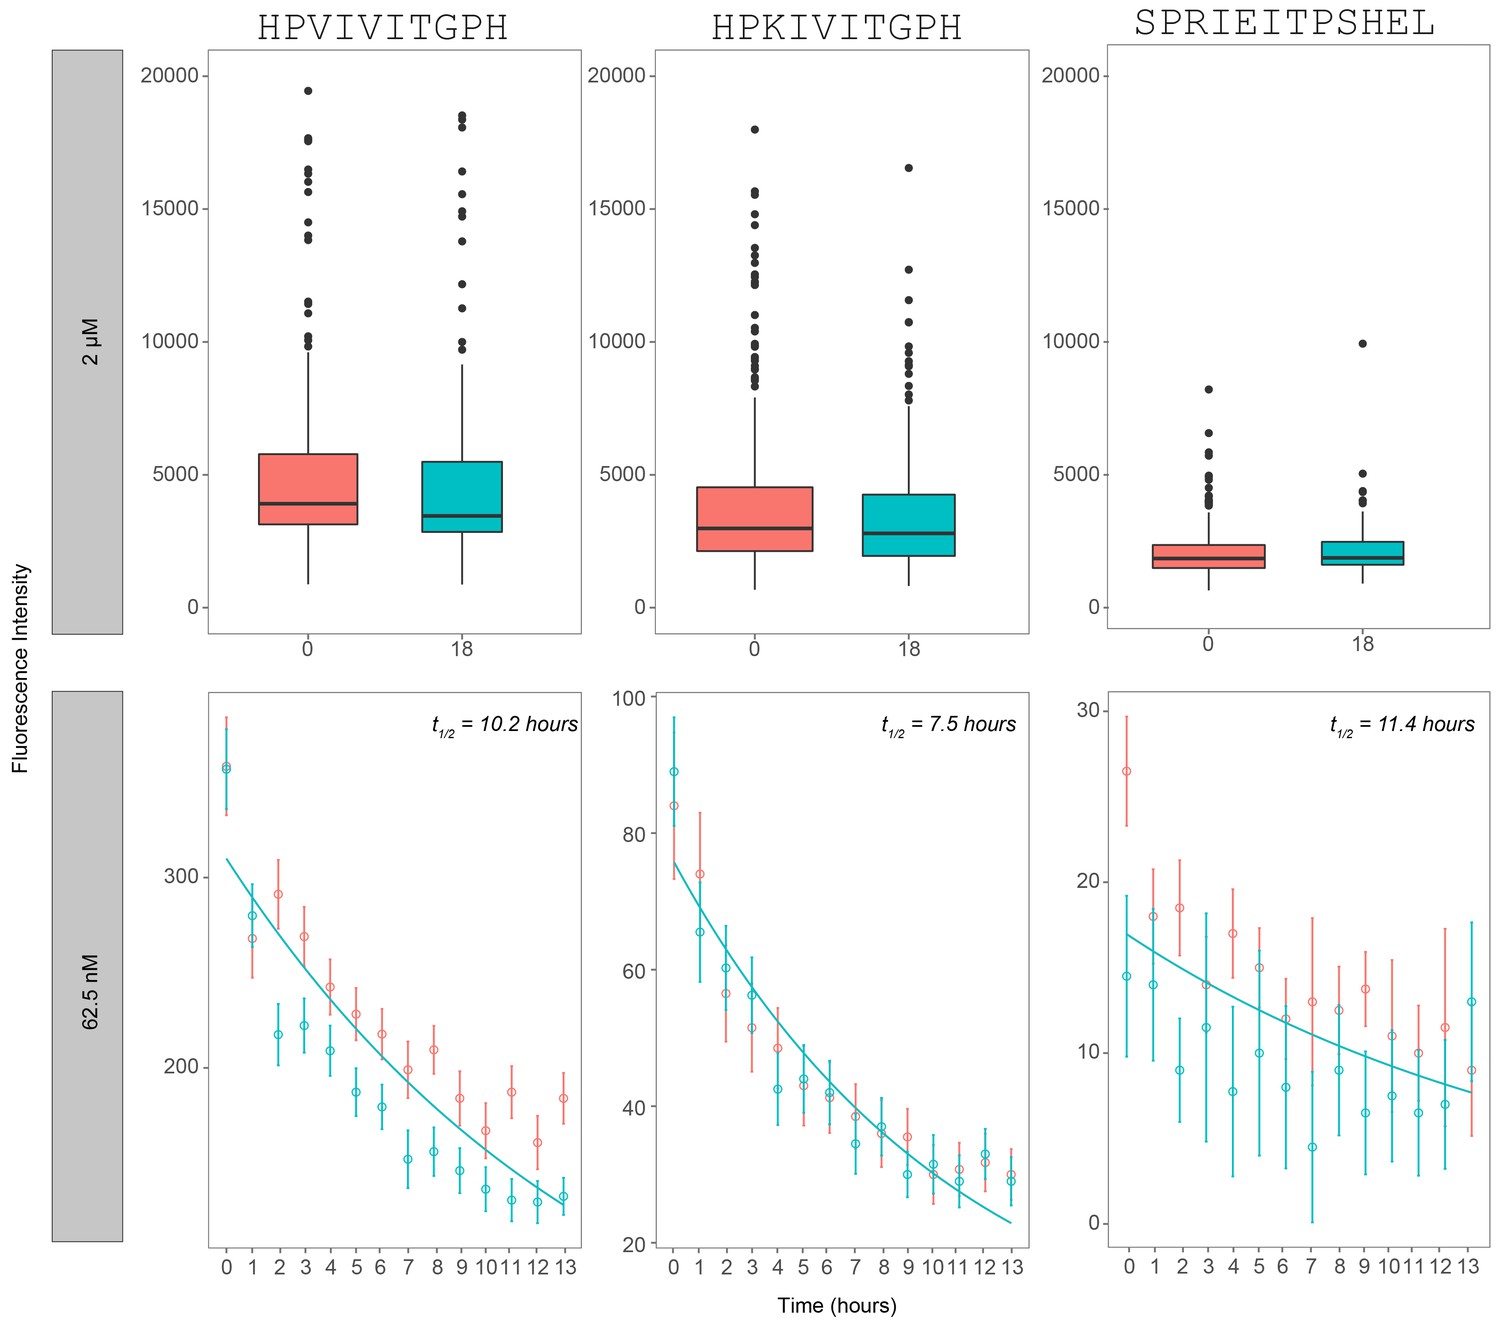
Dissociation rate of calcineurin over a time period of 13–18 hr after reaching equilibrium.
Measured intensities for 3 PxIxIT variant peptides (PKIVIT, PVIVIT, and NFATc2) as a function of time for a reaction concentration of 2 µM calcineurin (top panel) and 62.5 nM (bottom panel). Bottom panel represent replicates of the same peptide sequences on two separate codes and are indicated by different colors (blue/red).
Figure 2—figure supplement 3
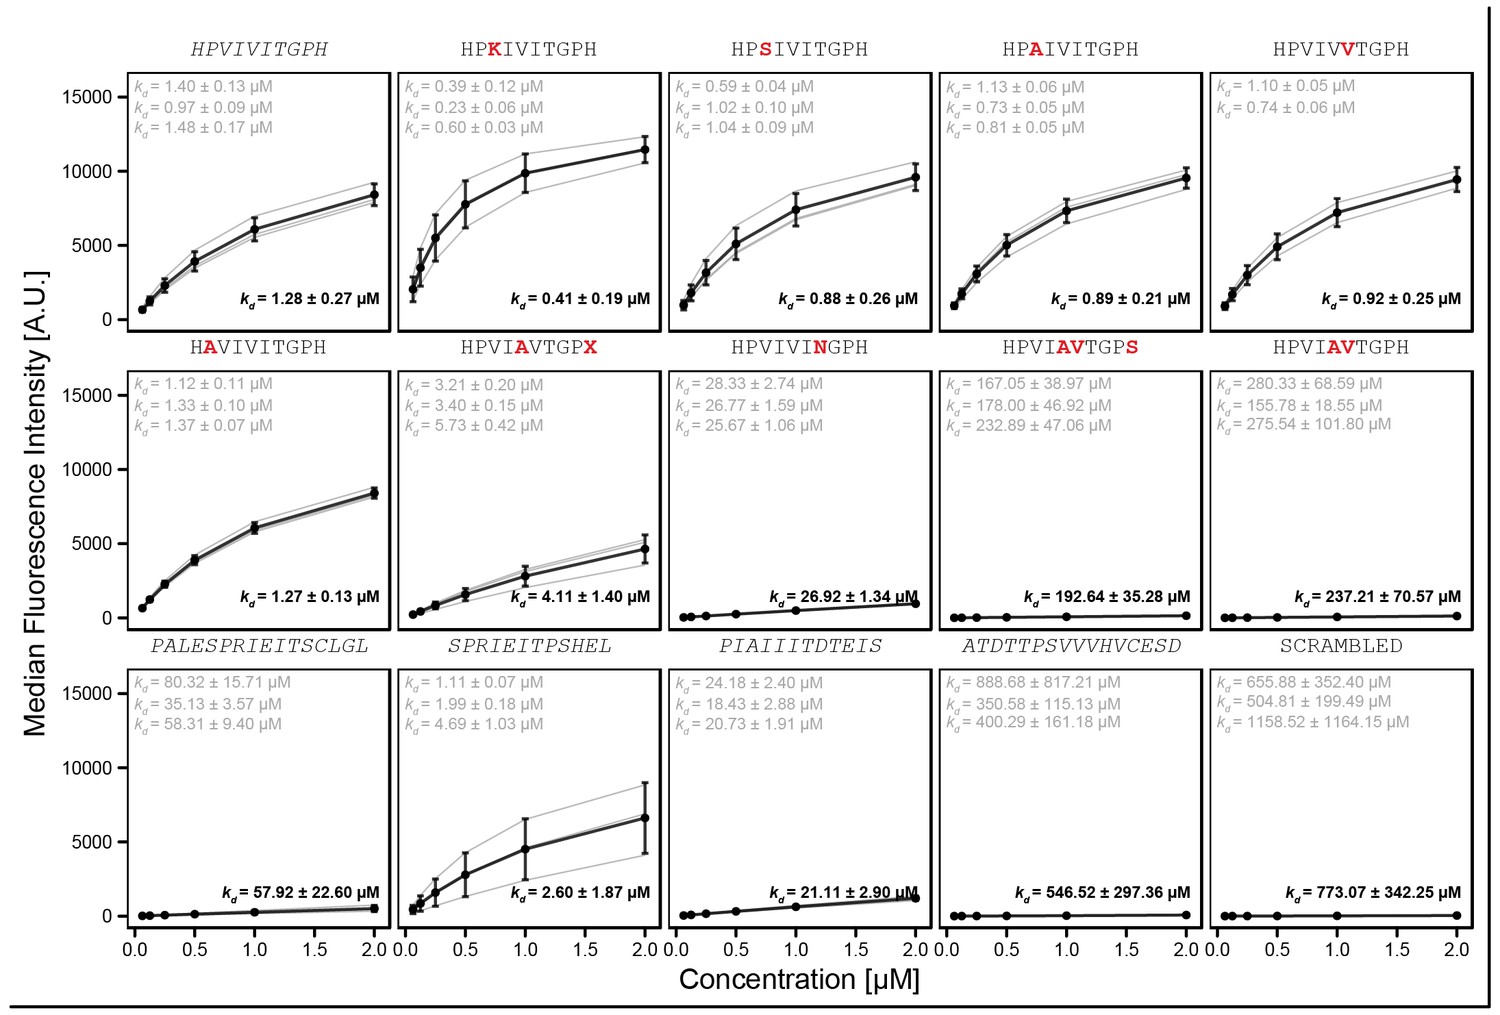
'Triplicate high' library of reported PVIVIT and natural variants.
Amino acid letter in red text indicate the mutation from WT sequence (grey). Each peptide was synthesized separately onto three different codes (with the exception of HPVIVVTGPH with only two codes). Binding curves were fit with a Langmuir isotherm model to estimate binding affinity .
Figure 3 with 23 supplements
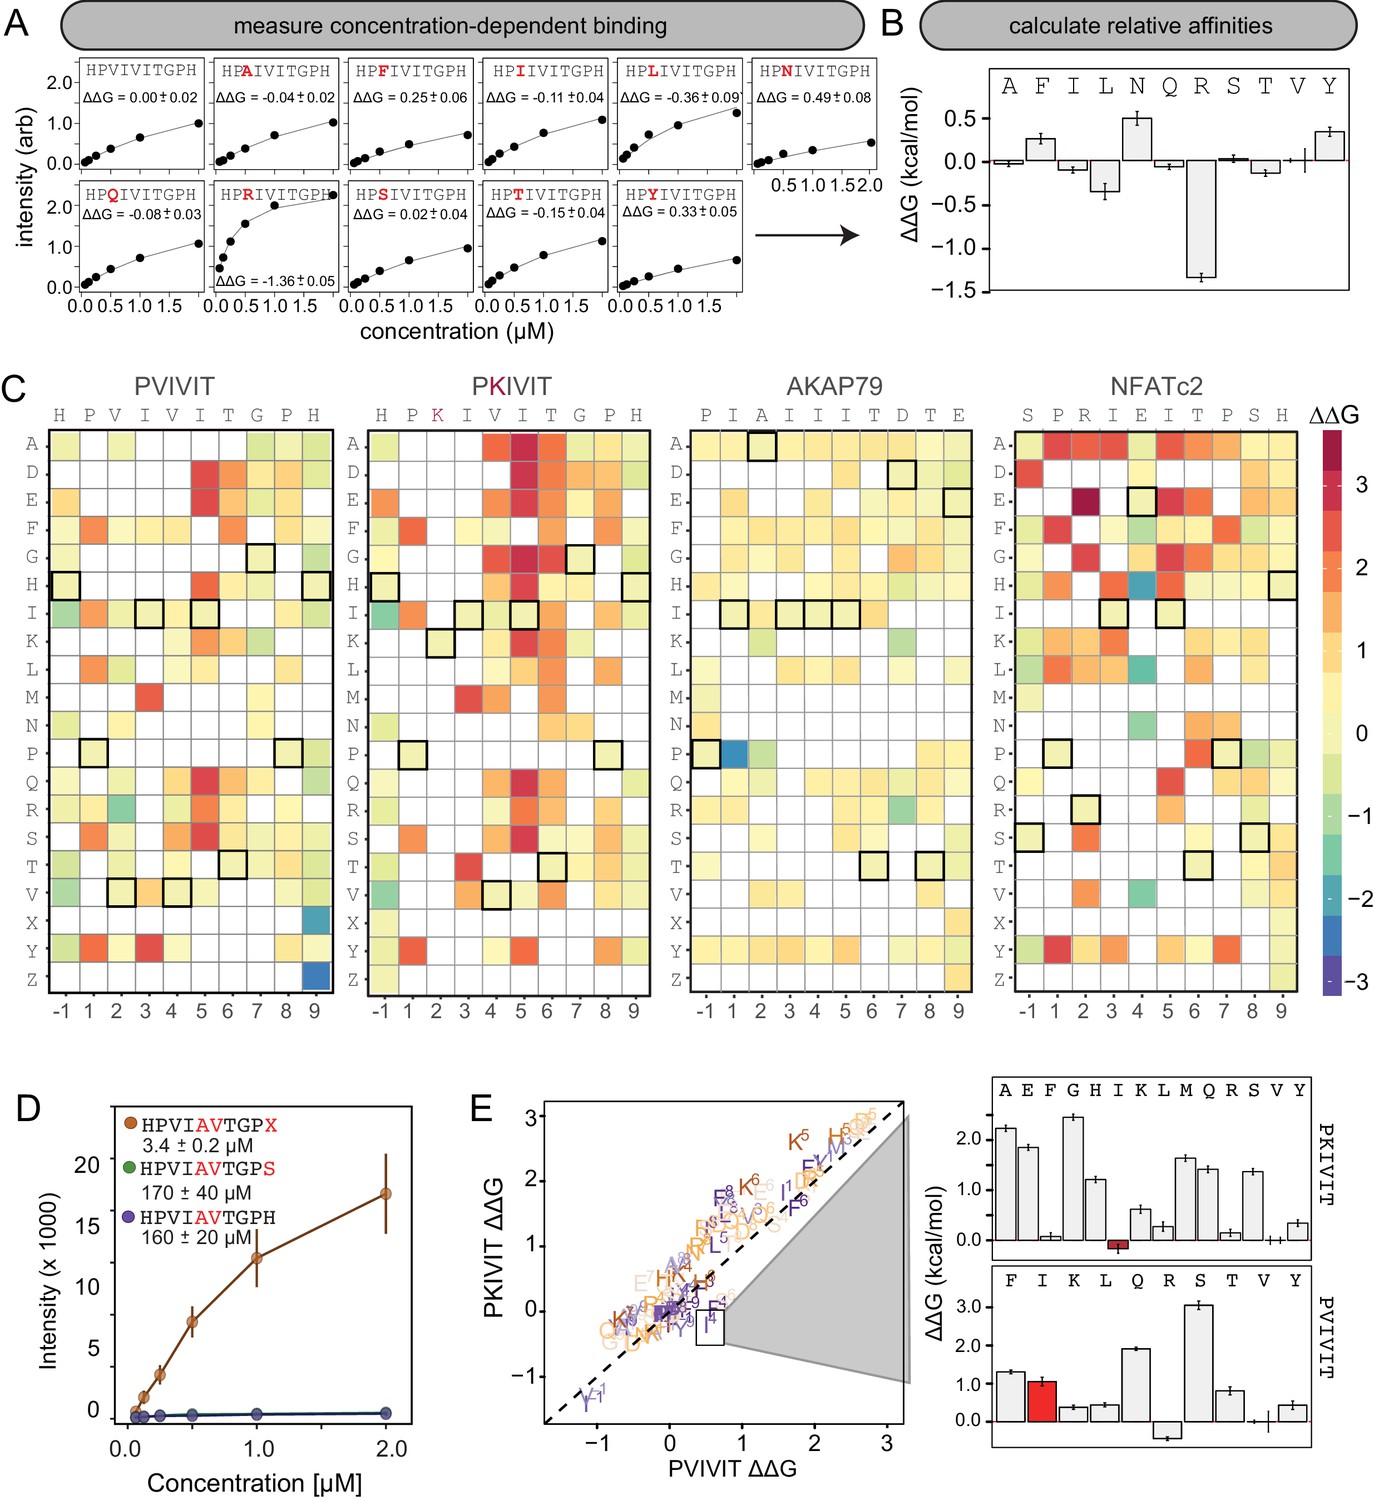
MRBLE-pep mapping of the CN-PxIxIT binding energy landscape.
(A) Langmuir isotherm fits to concentration-dependent binding behavior for CN interacting with PVIVIT variants containing systematic mutations within position 2. (B) Relative change in binding affinity for individual substitutions at position 2 (as compared to WT). (C) Heat map showing relative affinities per substitution per position for 4 PxIxIT motifs. (D) Langmuir isotherm fits to concentration-dependent binding behavior for CN interacting with a medium-affinity PVIVIT variant containing the wild type histidine, a serine, and a phosphoserine at position 9. (E) Comparison of the effect on affinity for a particular substitution at a particular position in the PKIVIT motif (y axis) vs. the PVIVIT motif (x axis). Inset shows relative effects on affinity for various substitutions at the V4 position in PKIVIT (top) and PVIVIT (bottom), highlighting differential effects of an I substitution.
-
Figure 3—source data 1
Concentration-dependent binding data for PVIVIT core library.
- https://doi.org/10.7554/eLife.40499.039
-
Figure 3—source data 2
Concentration-dependent binding data for PVIVIT flank library.
- https://doi.org/10.7554/eLife.40499.040
-
Figure 3—source data 3
Concentration-dependent binding data for PKIVIT core library.
- https://doi.org/10.7554/eLife.40499.041
-
Figure 3—source data 4
Concentration-dependent binding data for PKIVIT flank library.
- https://doi.org/10.7554/eLife.40499.042
-
Figure 3—source data 5
Concentration-dependent binding data for NFATc2 core library.
- https://doi.org/10.7554/eLife.40499.043
-
Figure 3—source data 6
Concentration-dependent binding data for NFATc2 flank library.
- https://doi.org/10.7554/eLife.40499.044
-
Figure 3—source data 7
Concentration-dependent binding data for AKAP79 core library.
- https://doi.org/10.7554/eLife.40499.045
-
Figure 3—source data 8
Concentration-dependent binding data for AKAP79 flank library.
- https://doi.org/10.7554/eLife.40499.046
-
Figure 3—source data 9
WT and mutant binding data for PVIVIT core library.
- https://doi.org/10.7554/eLife.40499.047
-
Figure 3—source data 10
WT and mutant binding data for PVIVIT, PKIVIT, NFACTc2, and AKAP79 core and flank libraries.
- https://doi.org/10.7554/eLife.40499.048
Figure 3—figure supplement 1
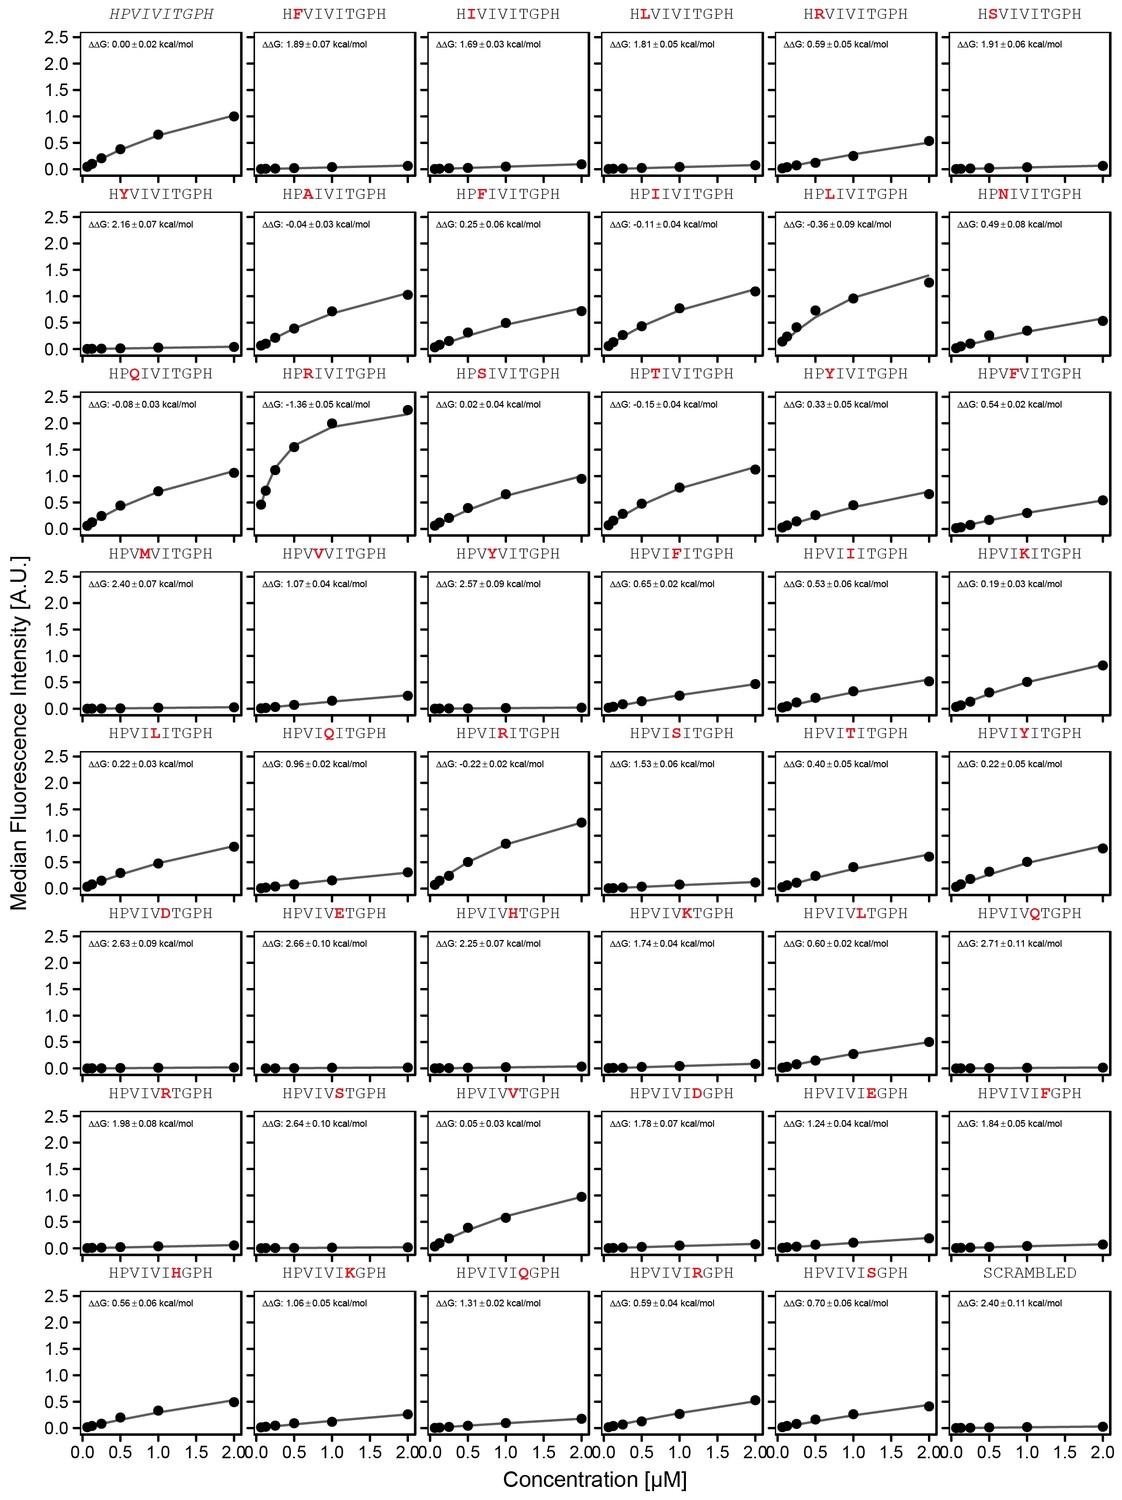
Concentration-dependent binding measurements for systematic mutations within the PVIVIT core motif.
For each sequence, measured change in binding affinity relative to the wild-type PVIVIT sequence was determined by a global fit to a single-site binding model (black line). The wild-type sequence is shown in italics and single amino acid substitutions are shown in red.
Figure 3—figure supplement 2
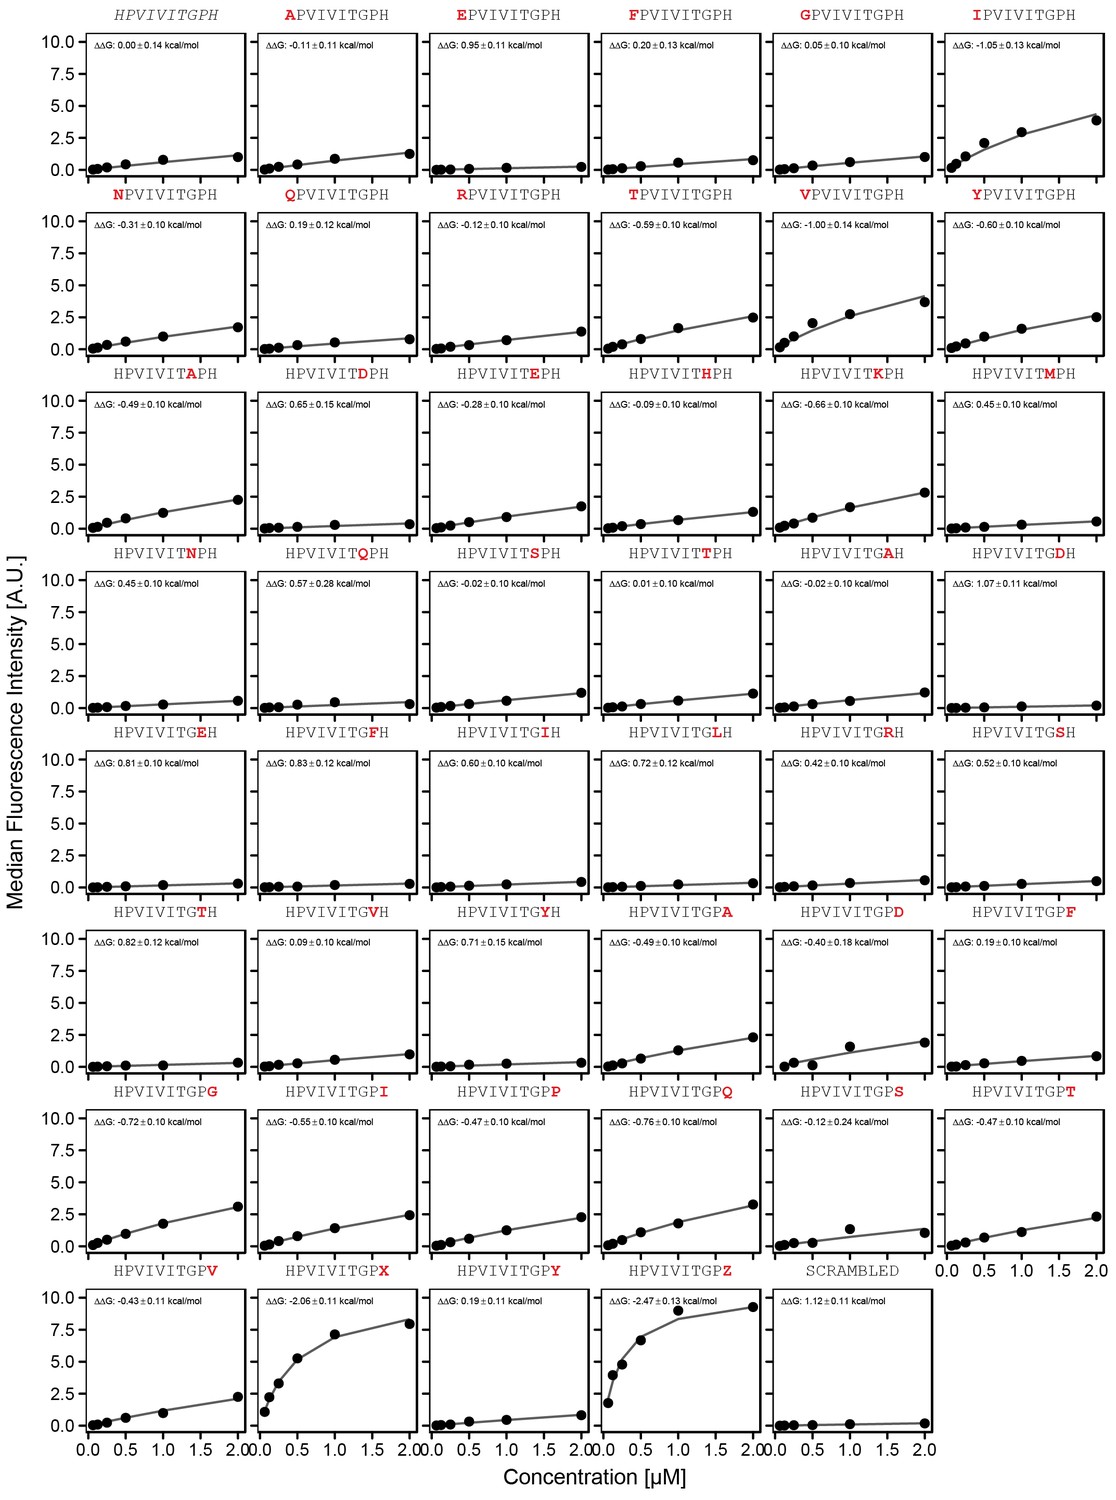
Concentration-dependent binding measurements for systematic mutations flanking the PVIVIT motif.
For each sequence, measured change in binding affinity relative to the wild-type PVIVIT sequence was determined by a global fit to a single-site binding model (black line). The wild-type sequence is shown in italics and single amino acid substitutions are shown in red.
Figure 3—figure supplement 3
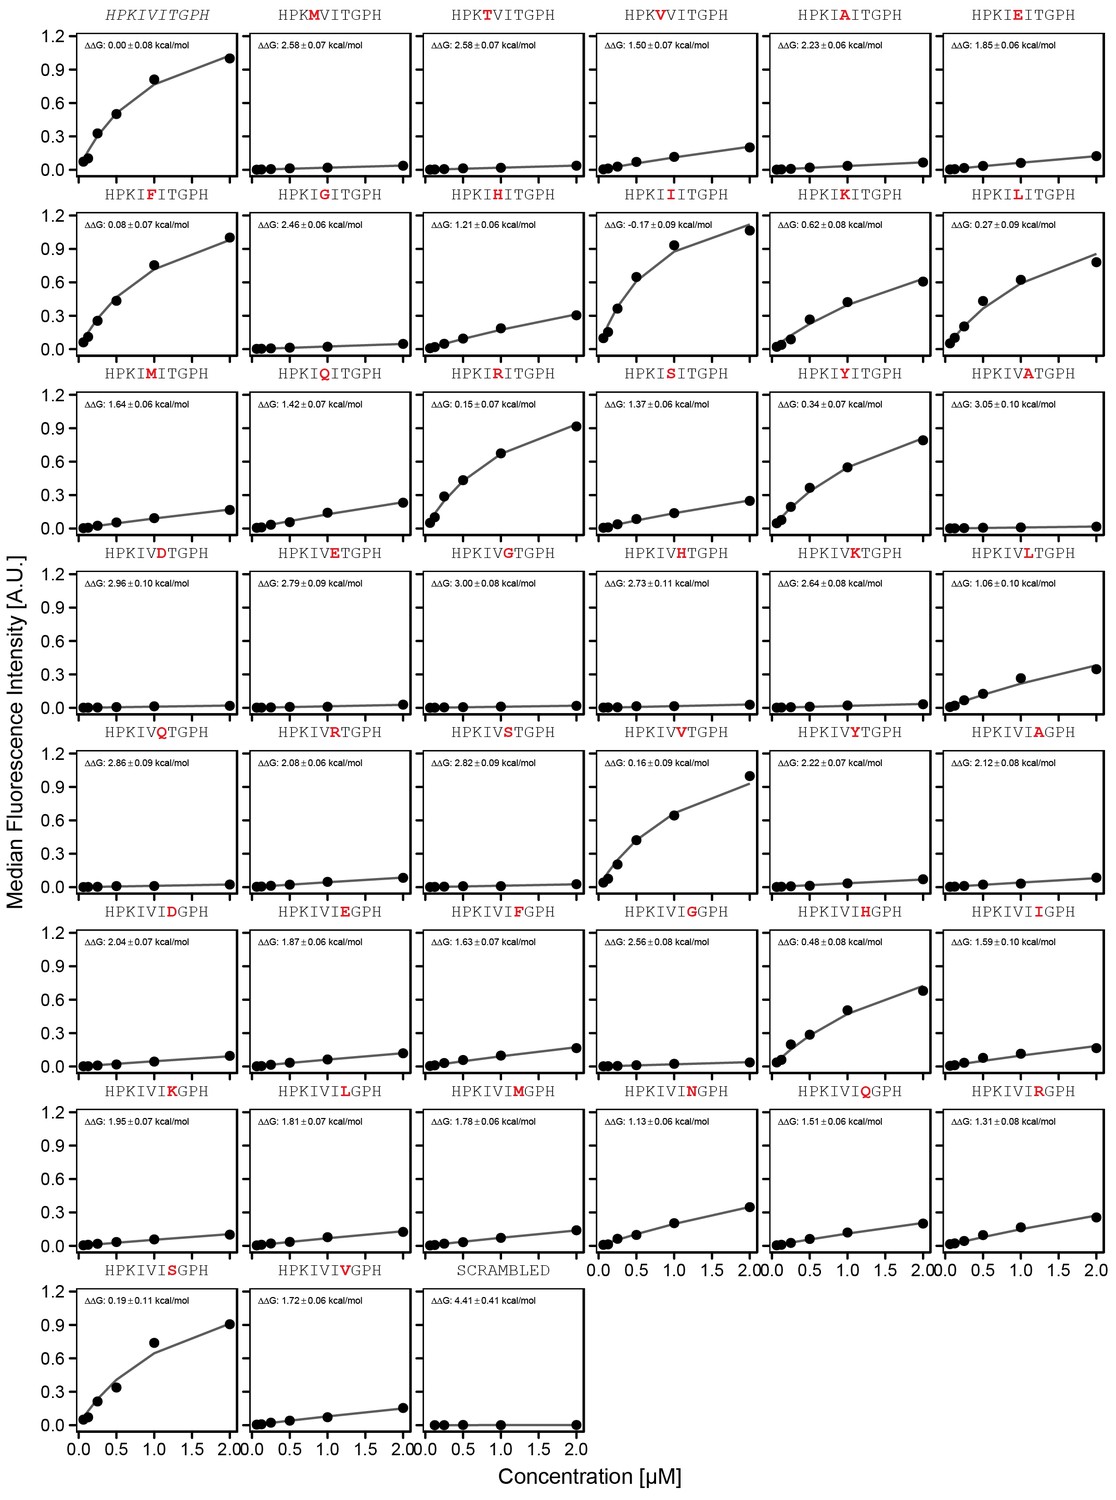
Concentration-dependent binding measurements for systematic mutations within the PKIVIT core motif.
For each sequence, measured change in binding affinity relative to the wild-type PKIVIT sequence was determined by a global fit to a single-site binding model (black line). The wild-type sequence is shown in italics and single amino acid substitutions are shown in red.
Figure 3—figure supplement 4
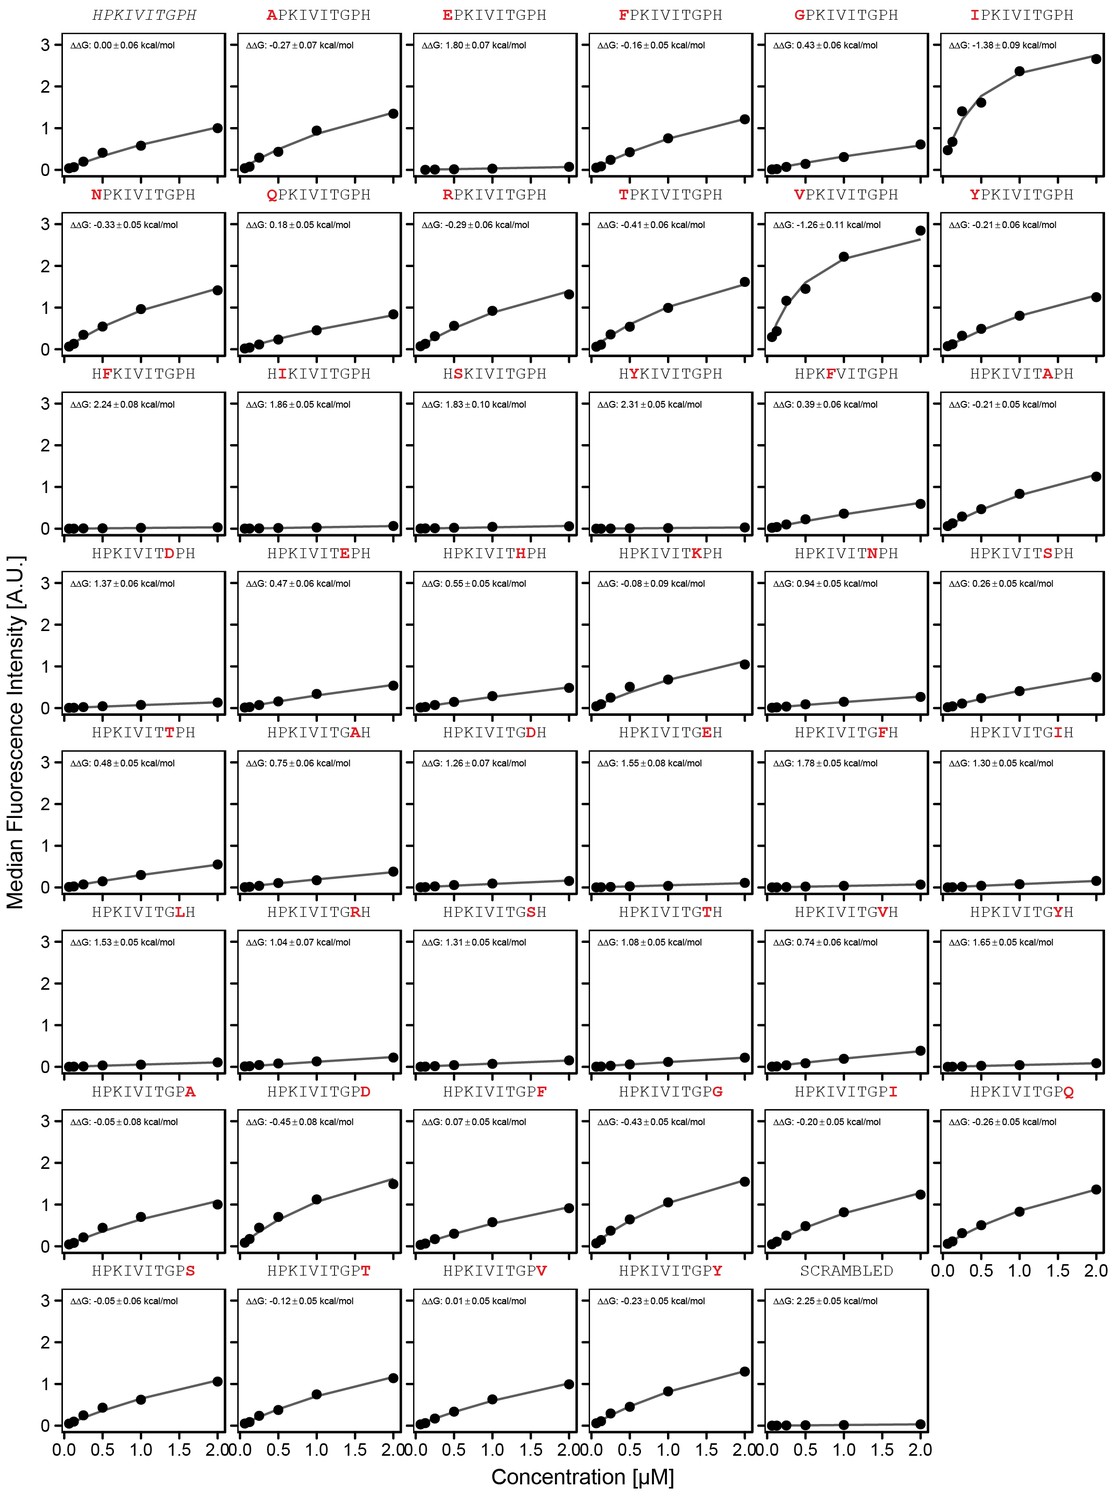
Concentration-dependent binding measurements for systematic mutations flanking the PKIVIT motif.
For each sequence, measured change in binding affinity relative to the wild-type PKIVIT sequence was determined by a global fit to a single-site binding model (black line). The wild-type sequence is shown in italics and single amino acid substitutions are shown in red.
Figure 3—figure supplement 5

Concentration-dependent binding measurements for systematic mutations within the NFATc2 core motif.
For each sequence, measured change in binding affinity relative to the wild-type PRIEIT sequence was determined by a global fit to a single-site binding model (black line). The wild-type sequence is shown in italics and single amino acid substitutions are shown in red.
Figure 3—figure supplement 6

Concentration-dependent binding measurements for systematic mutations flanking the NFATc2 motif.
For each sequence, measured change in binding affinity relative to the wild-type PRIEIT sequence was determined by a global fit to a single-site binding model (black line). The wild-type sequence is shown in italics and single amino acid substitutions are shown in red.
Figure 3—figure supplement 7

Concentration-dependent binding measurements for systematic mutations within the AKAP79 core motif.
For each sequence, measured change in binding affinity relative to the wild-type IAIIIT sequence was determined by a global fit to a single-site binding model (black line). The wild-type sequence is shown in italics and single amino acid substitutions are shown in red.
Figure 3—figure supplement 8
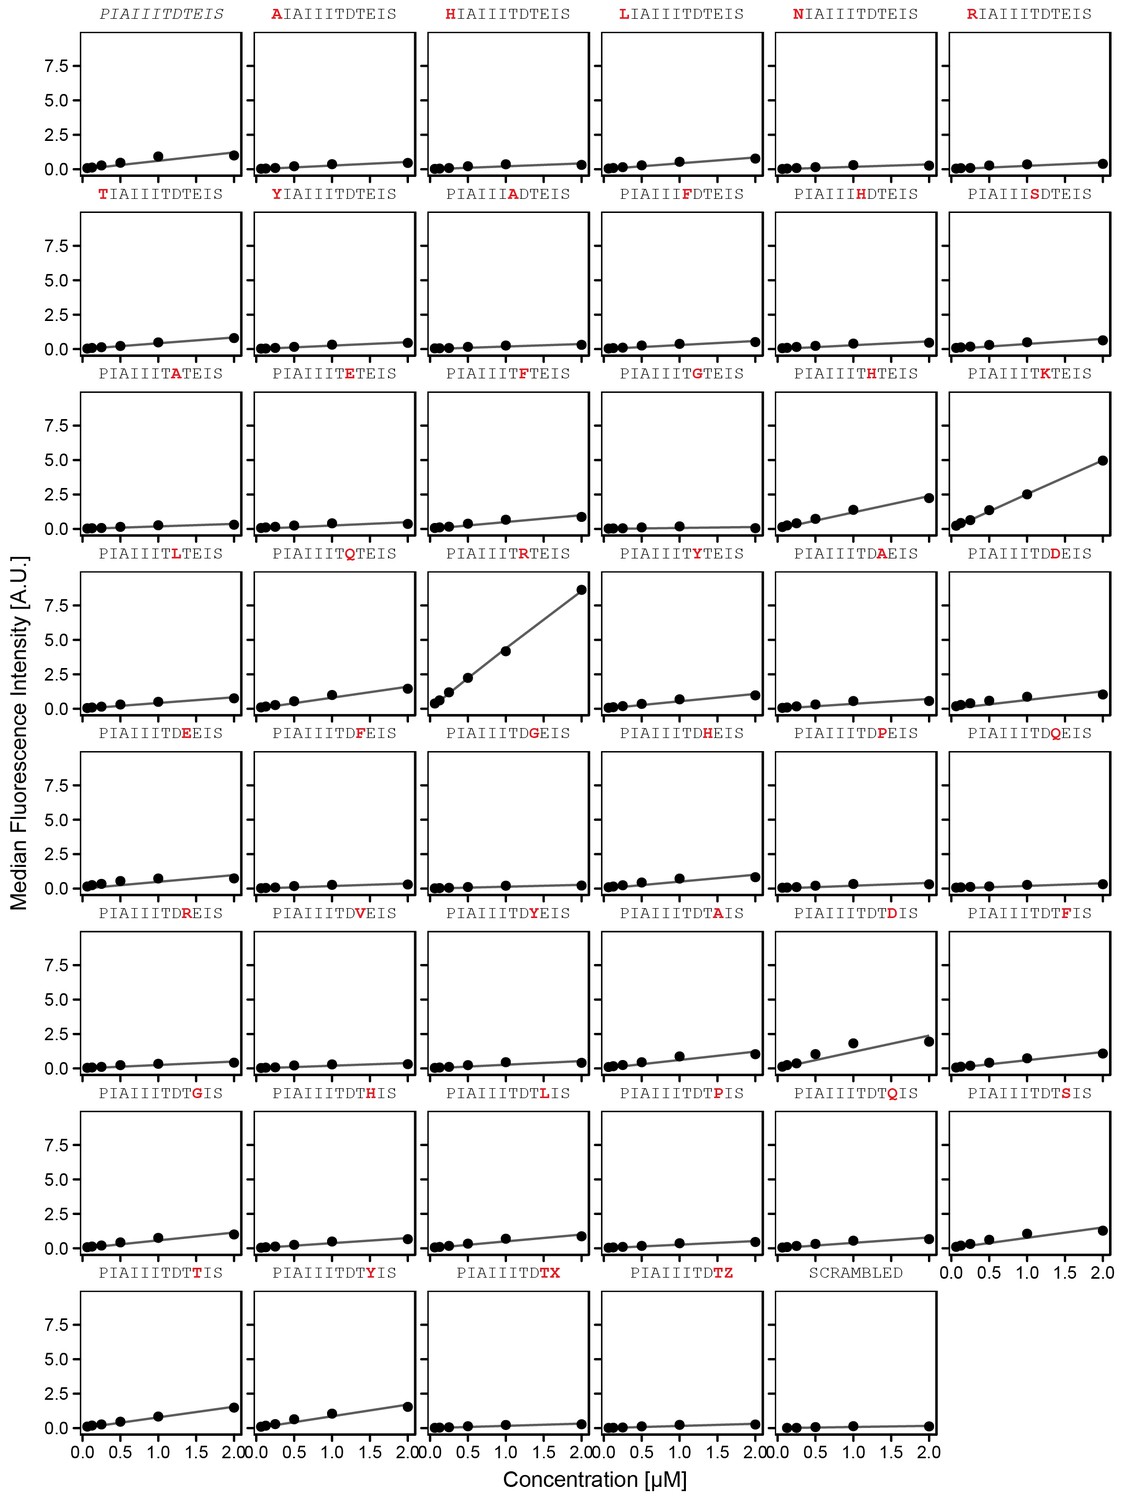
Concentration-dependent binding measurements for systematic mutations flanking the AKAP79 motif.
For each sequence, measured change in binding affinity relative to the wild-type IAIIIT sequence was determined by a global fit to a single-site binding model (black line); however, a lack of saturation precluded quantitative determination of changes in affinity. The wild-type sequence is shown in italics and single amino acid substitutions are shown in red.
Figure 3—figure supplement 9

Binding intensity comparisons for PVIVIT library.
Measured intensities for WT CN (blue), antibody alone (yellow), and a CN mutant defective in PxIxIT recognition (NIR, green) interacting with PVIVIT library peptides.
Figure 3—figure supplement 10
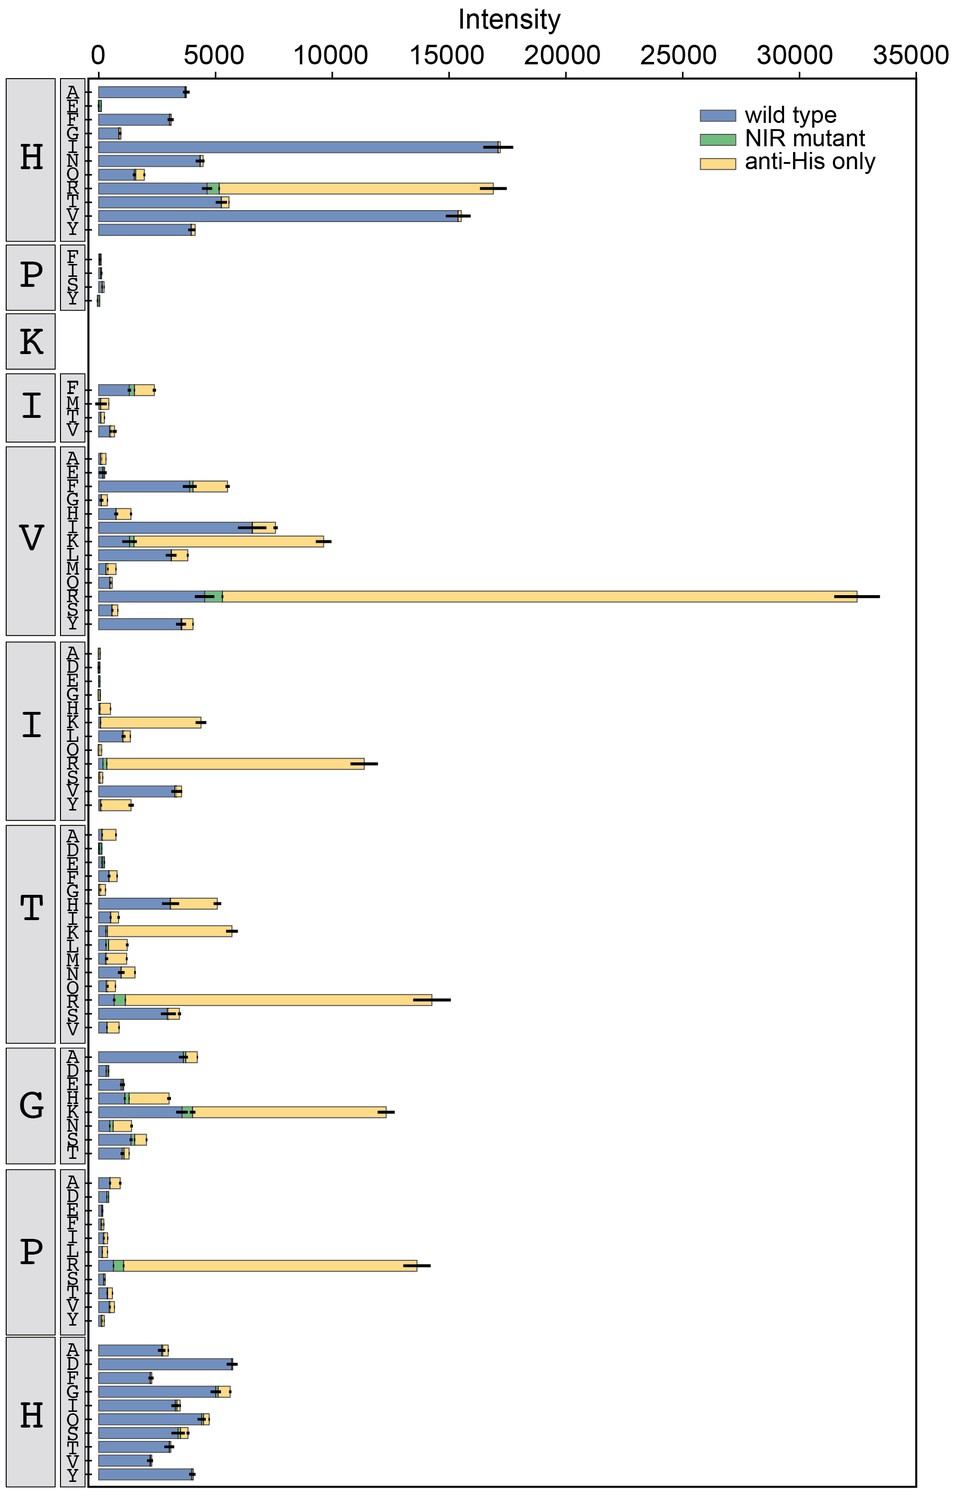
Binding intensity comparisons for PKIVIT library.
Measured intensities for WT CN (blue), antibody alone (yellow), and a CN mutant defective in PxIxIT recognition (NIR, green) interacting with PKIVIT library peptides.
Figure 3—figure supplement 11
Binding intensity comparisons for NFATc2 library.
Measured intensities for WT CN (blue), antibody alone (yellow), and a CN mutant defective in PxIxIT recognition (NIR, green) interacting with NFATc2 library peptides.
Figure 3—figure supplement 12
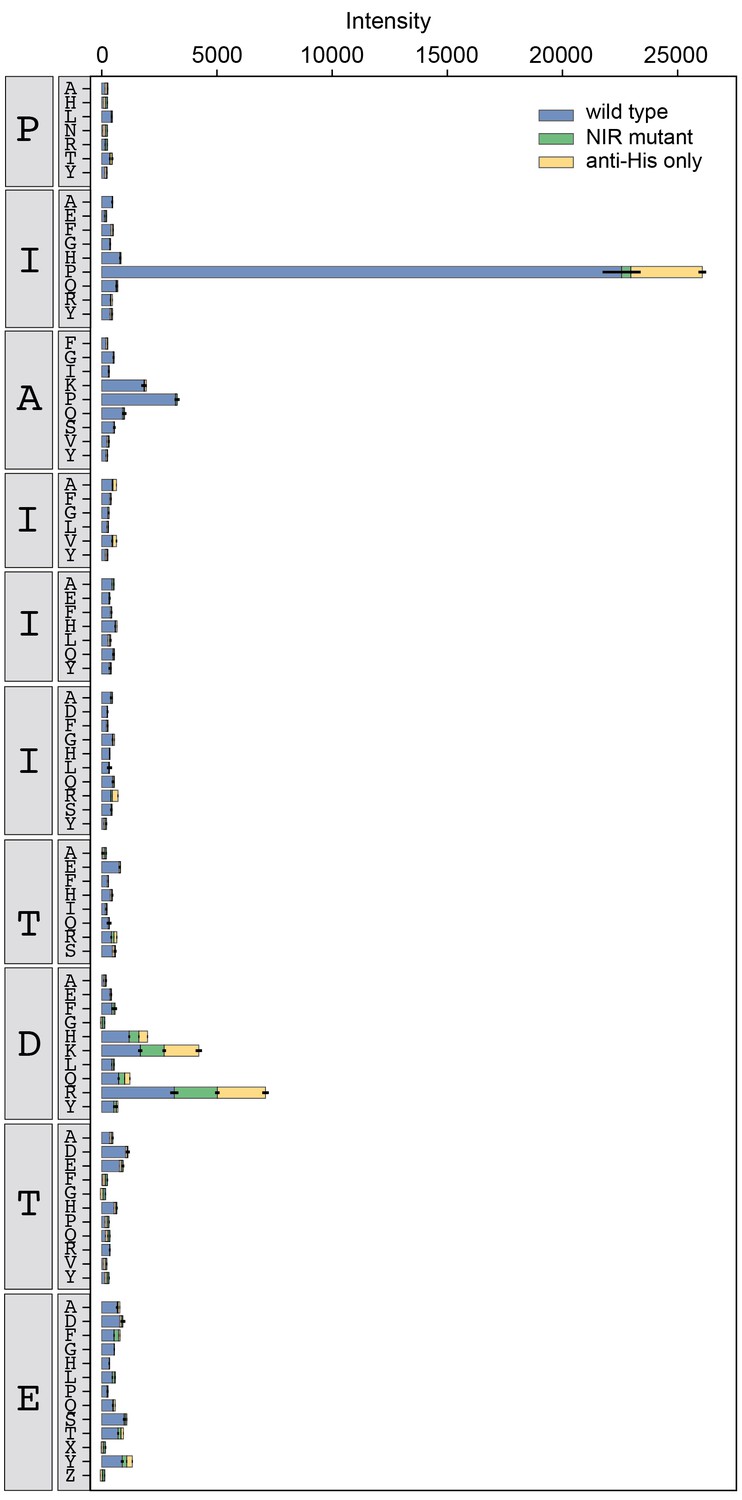
Binding intensity comparisons for AKAP79 library.
Measured intensities for WT CN (blue), antibody alone (yellow), and a CN mutant defective in PxIxIT recognition (NIR, green) interacting with AKAP79 library peptides.
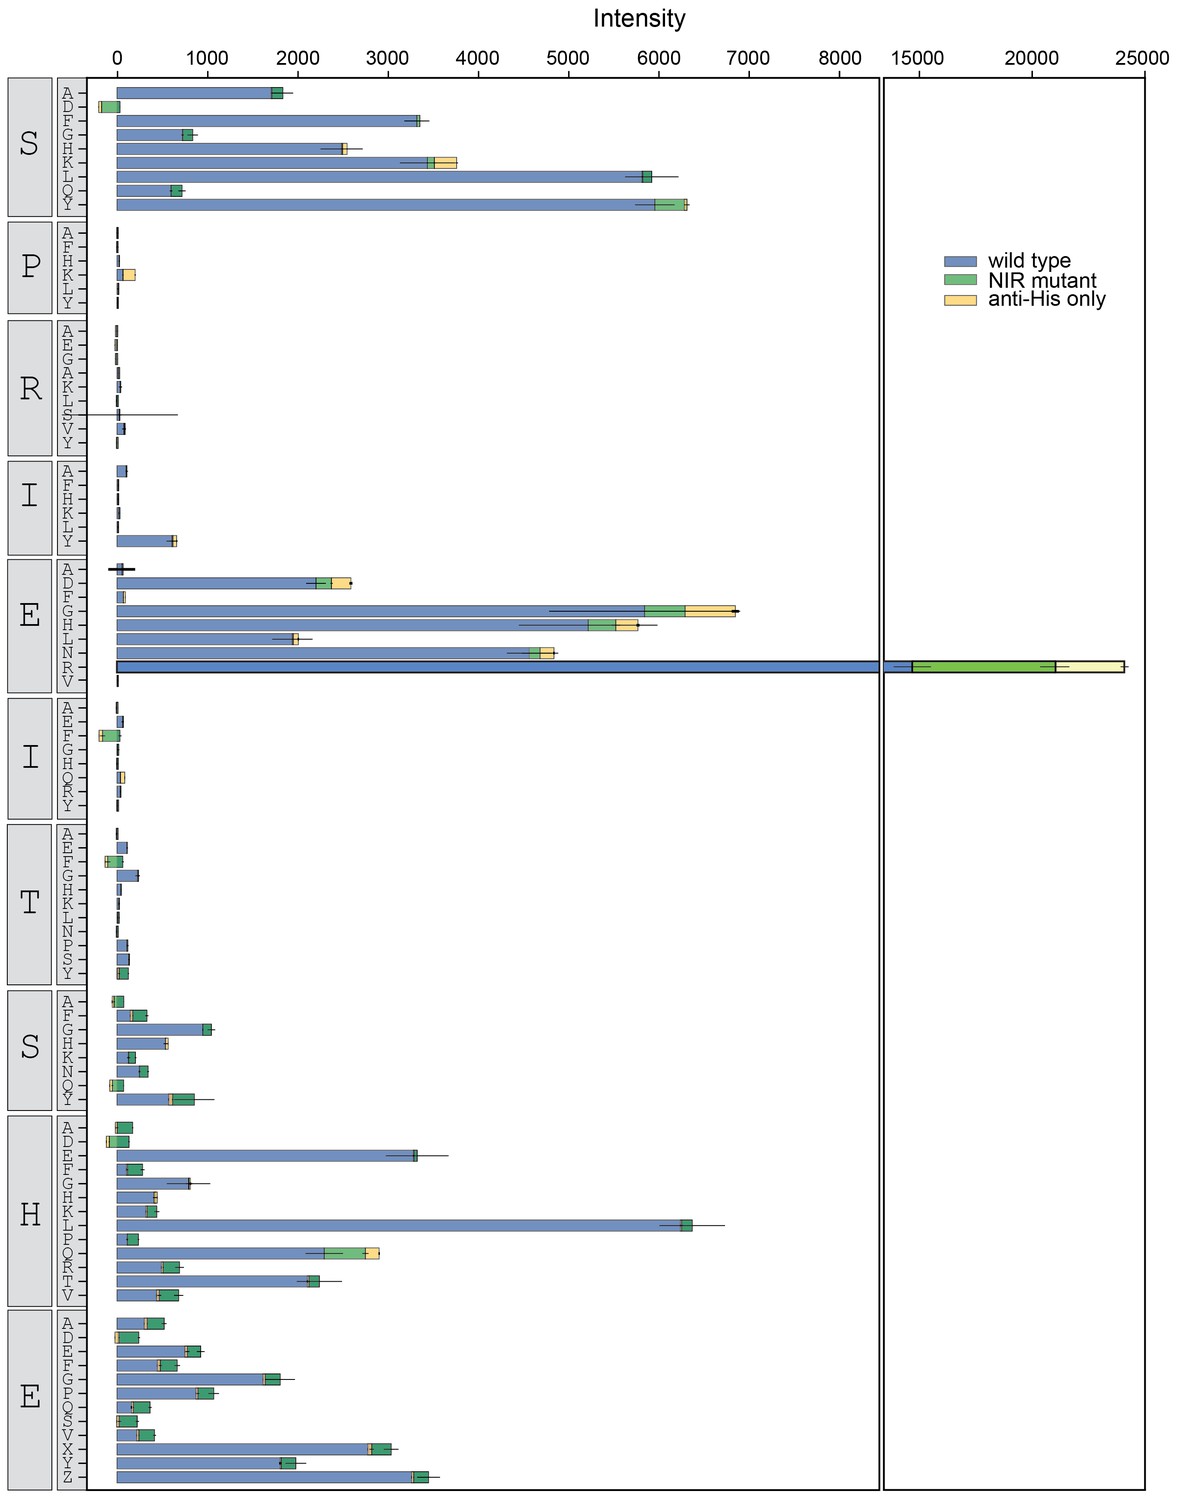
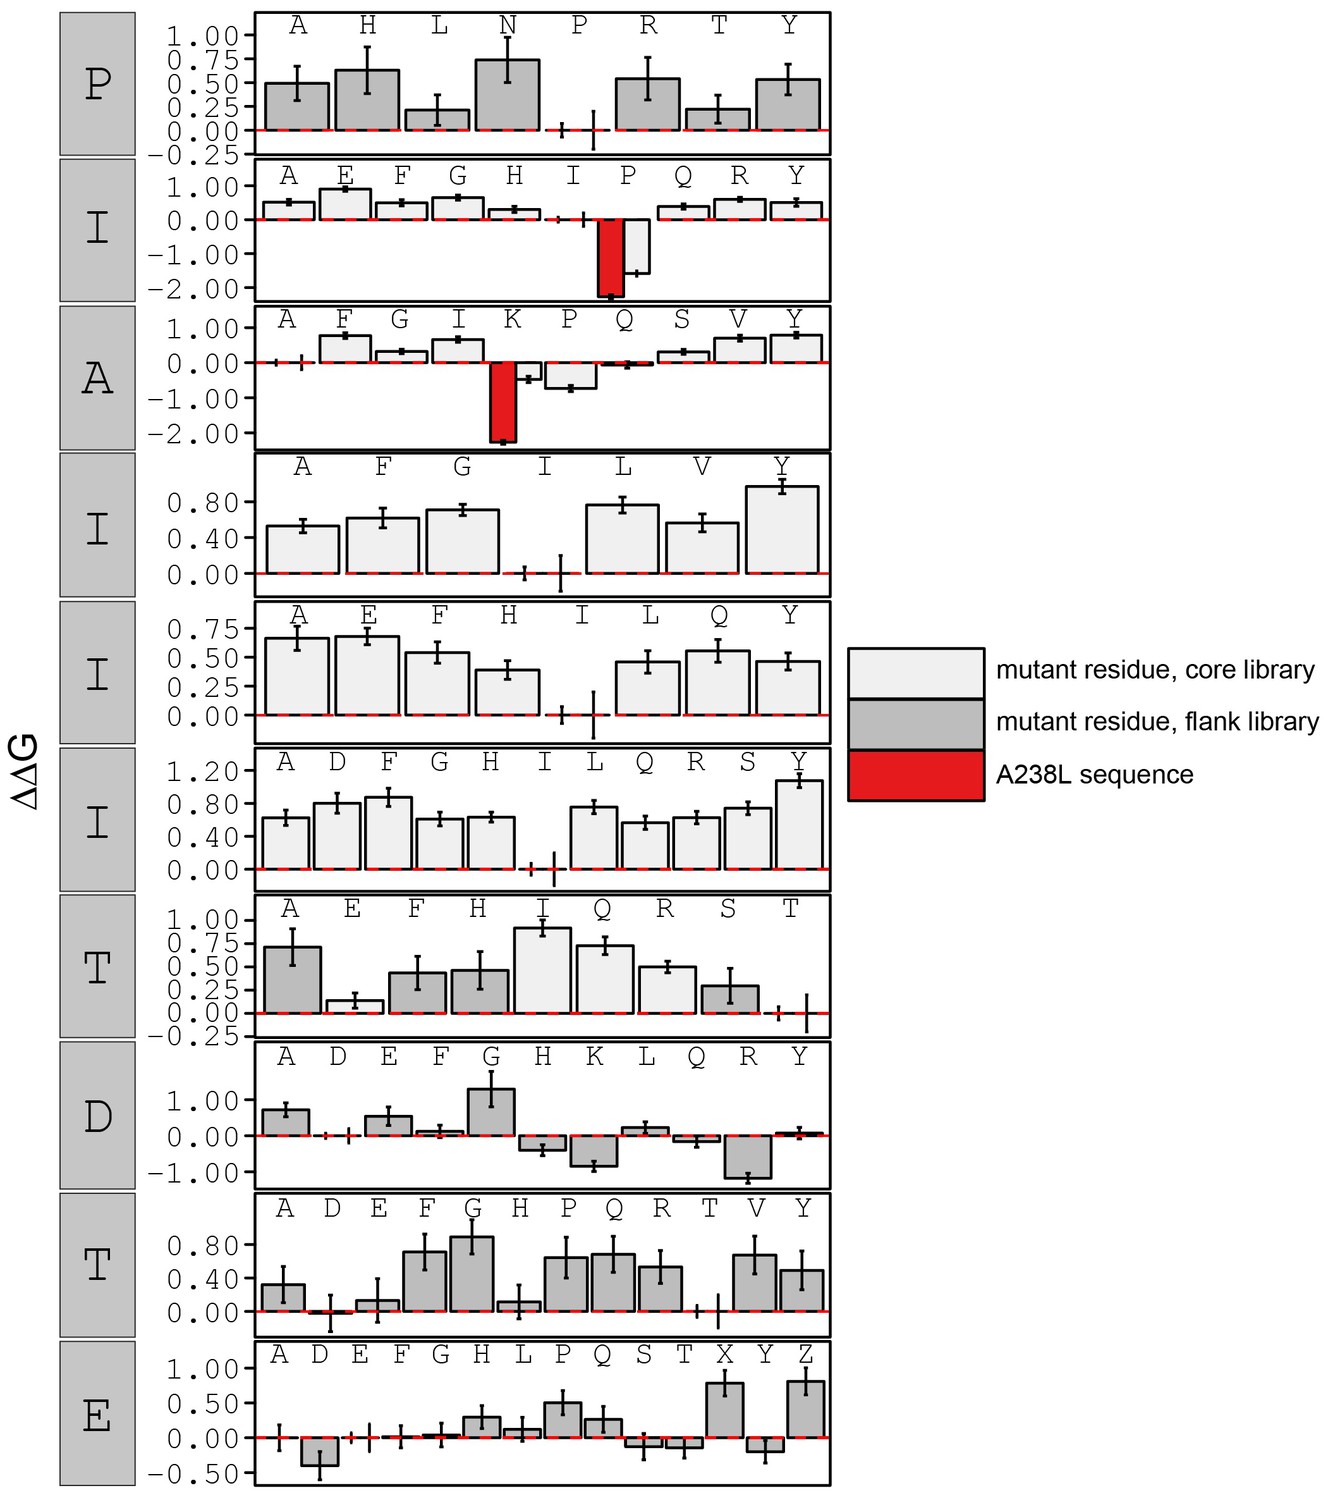
Figure 3—figure supplement 13
Bar graphs showing PVIVIT specificity.
Relative affinity was calculated by normalizing all binding affinities () to WT binding affinity (light blue: core, dark blue: flank). Phosphoserine and phosphothreonine are represented by 'X' and 'Z', respectively.
Figure 3—figure supplement 14

calculated in reference to PxIxIT WT (HPVIVITGPH).
Phosphoserine and phosphothreonine are represented by 'X' and 'Z', respectively.
Figure 3—figure supplement 15
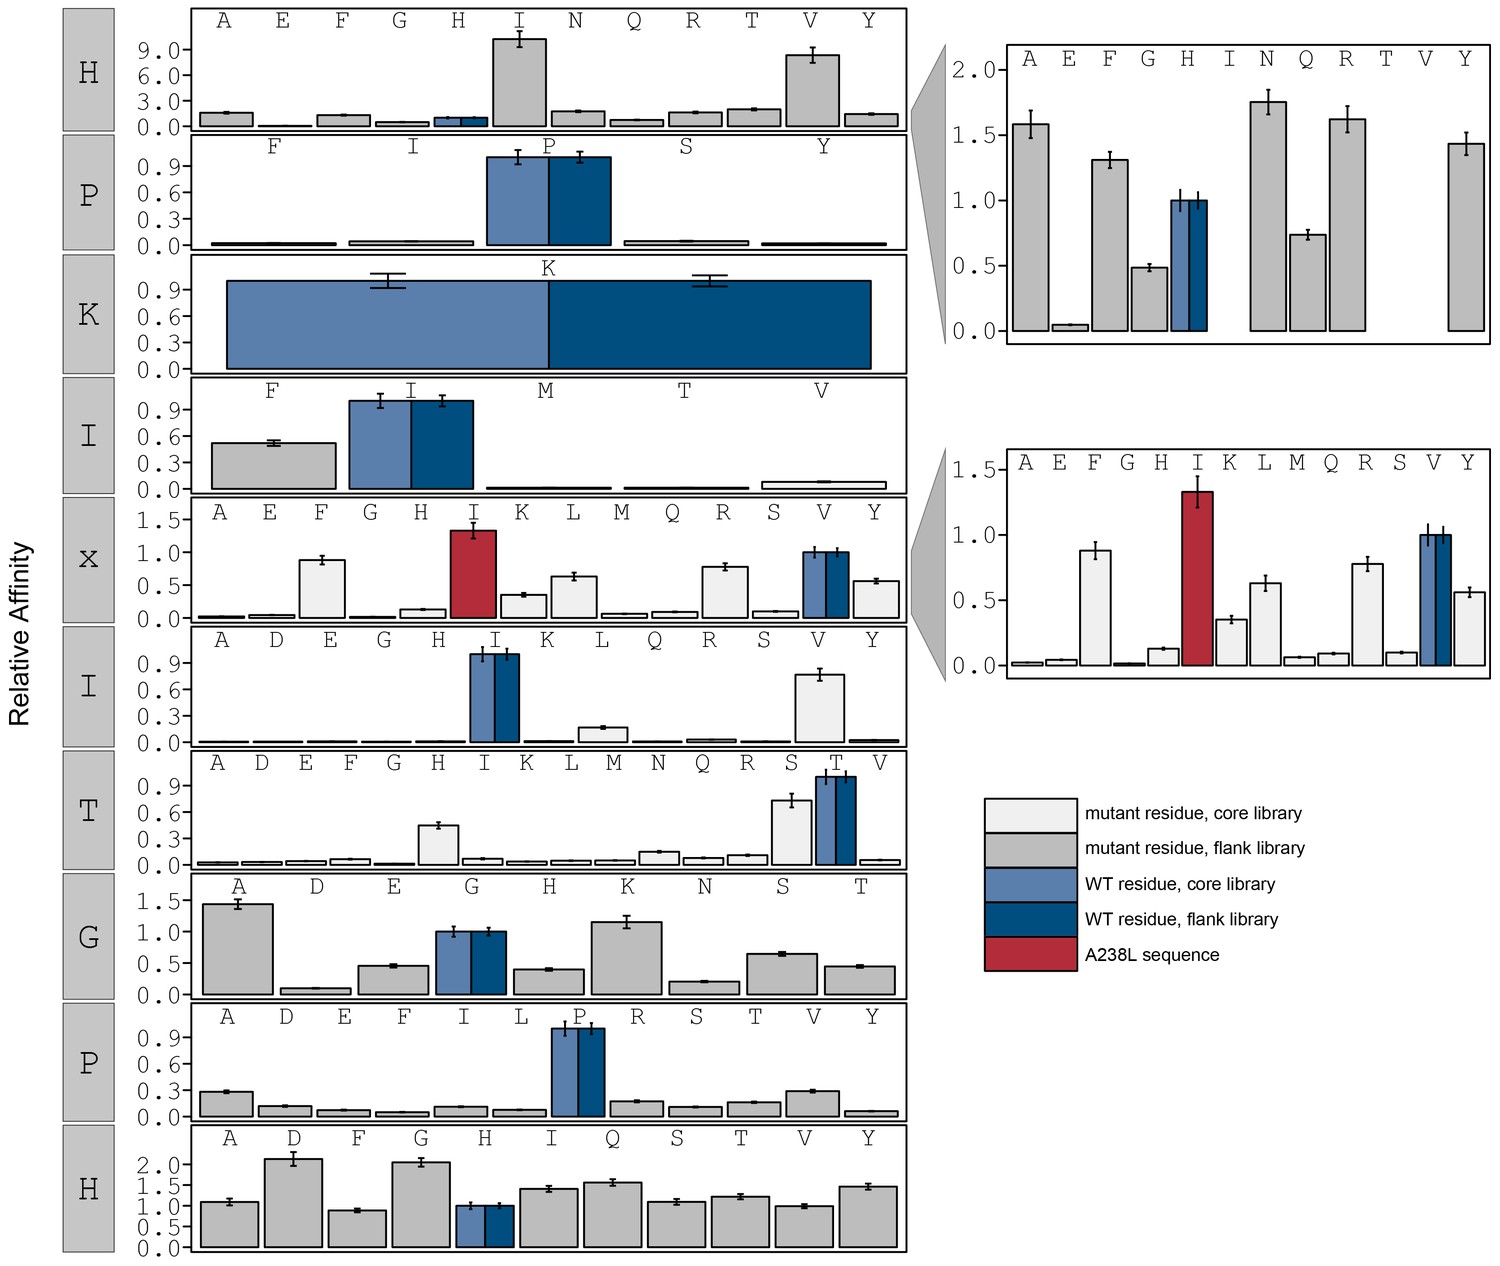
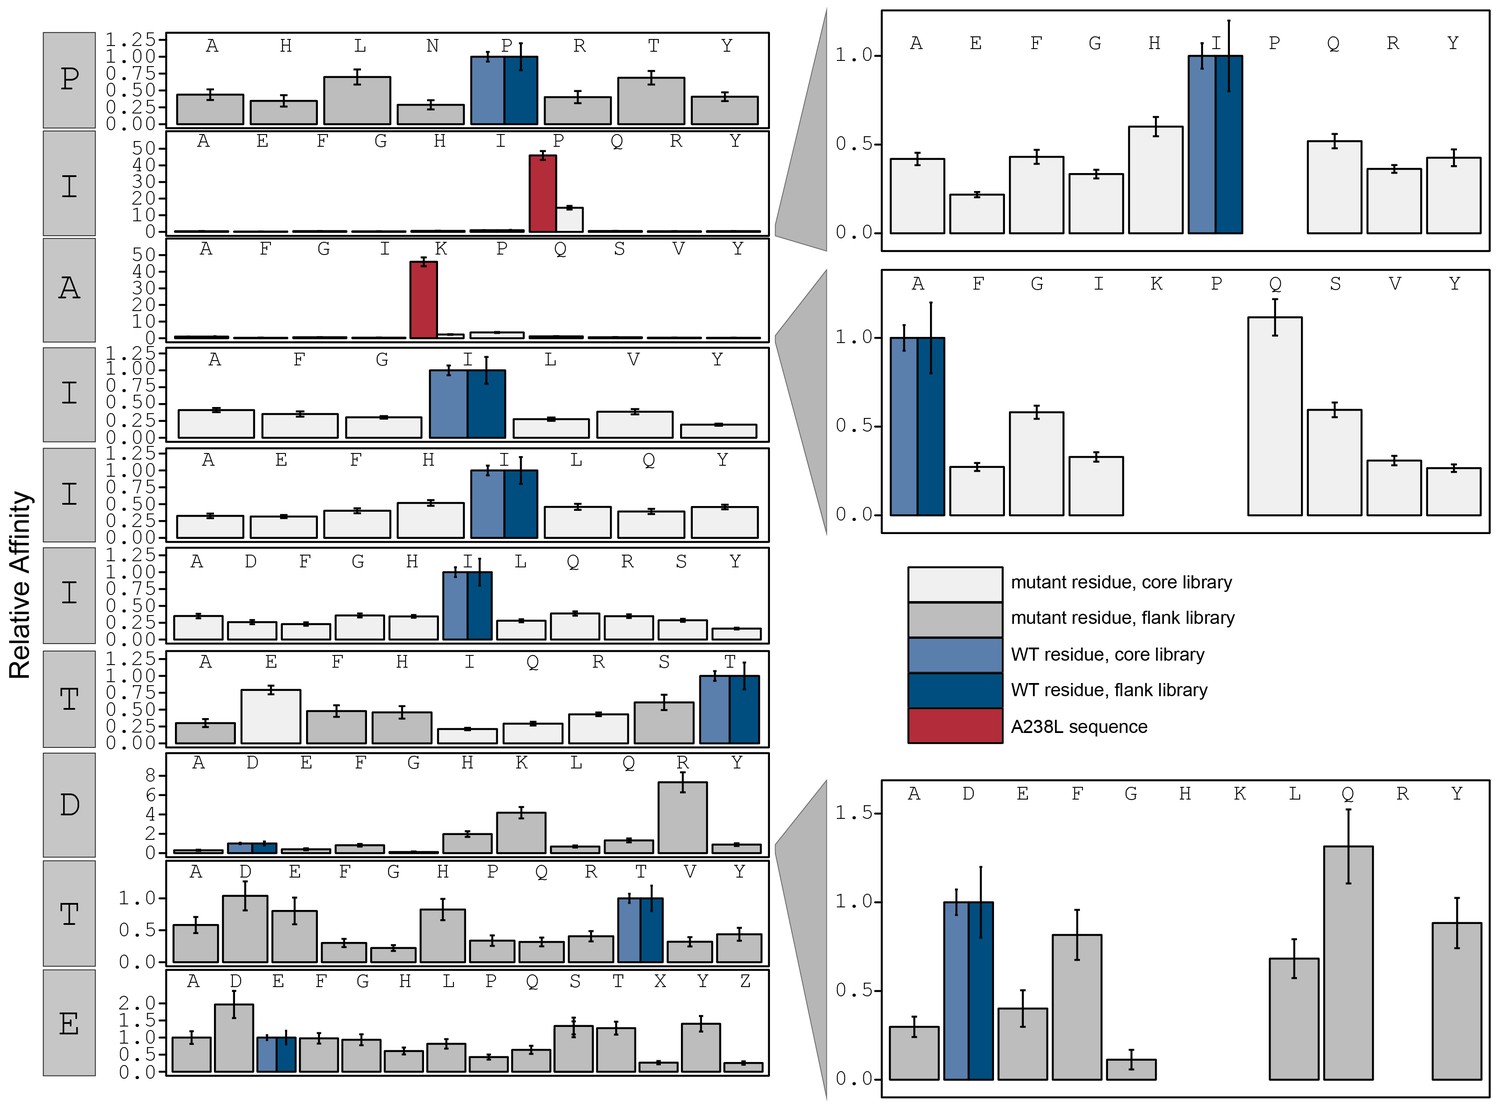
Relative affinity was calculated by normalizing all binding affinity () to WT binding affinity (light blue: core, dark blue: flank).
Peptide sequence AGPHPKIIITGPHEE (red) contains a PxIxIT motif similar to the A238L viral inhibitor.
Figure 3—figure supplement 16
calculated in reference to PKIVIT WT.
Peptide sequence AGPHPKIIITGPHEE (red) contains a PxIxIT motif similar to the A238L viral inhibitor.
Figure 3—figure supplement 17
Relative affinity was calculated by normalizing all binding affinity () to WT (SPRIEITPSH) binding affinity (light blue: core, dark blue: flank).
Phosphoserine and phosphothreonine are represented by 'X' and 'Z', respectively.
Figure 3—figure supplement 18
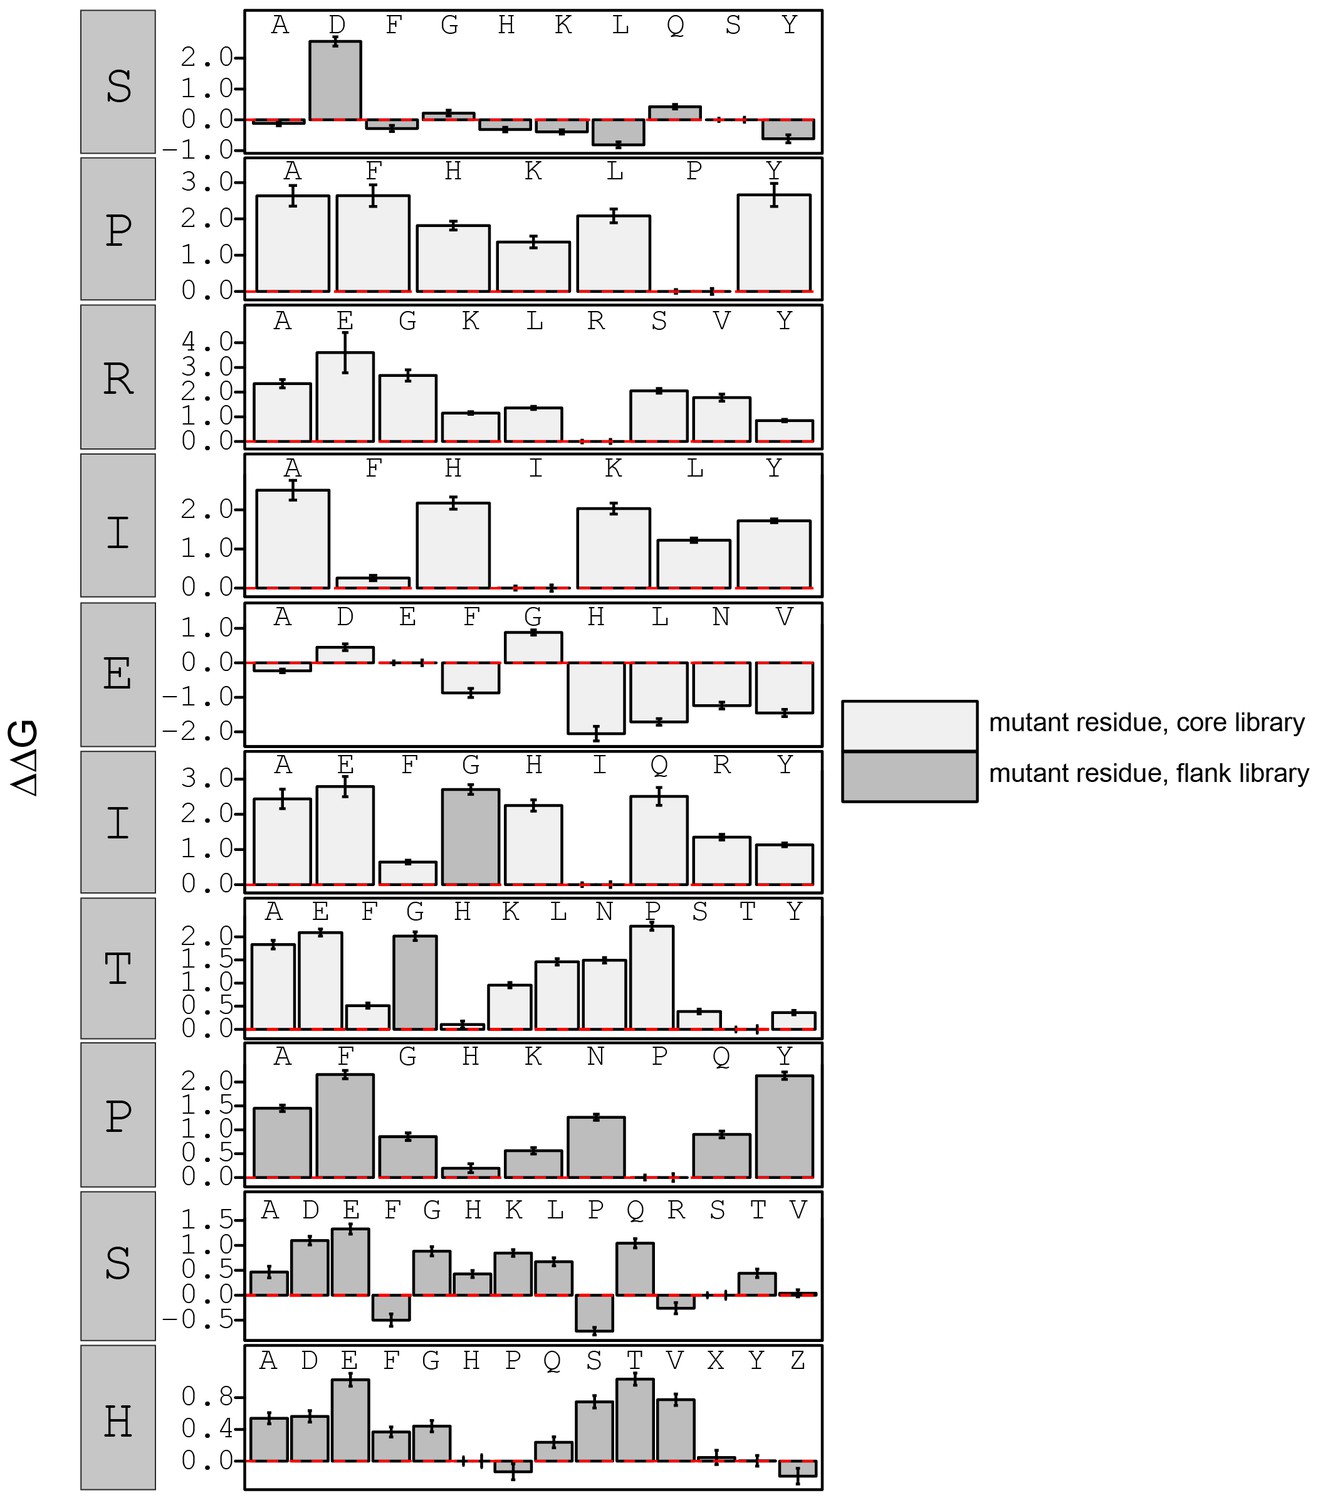
calculated in reference to WT peptide (SPRIEITPSH).
Phosphoserine and phosphothreonine are represented by 'X' and 'Z', respectively.
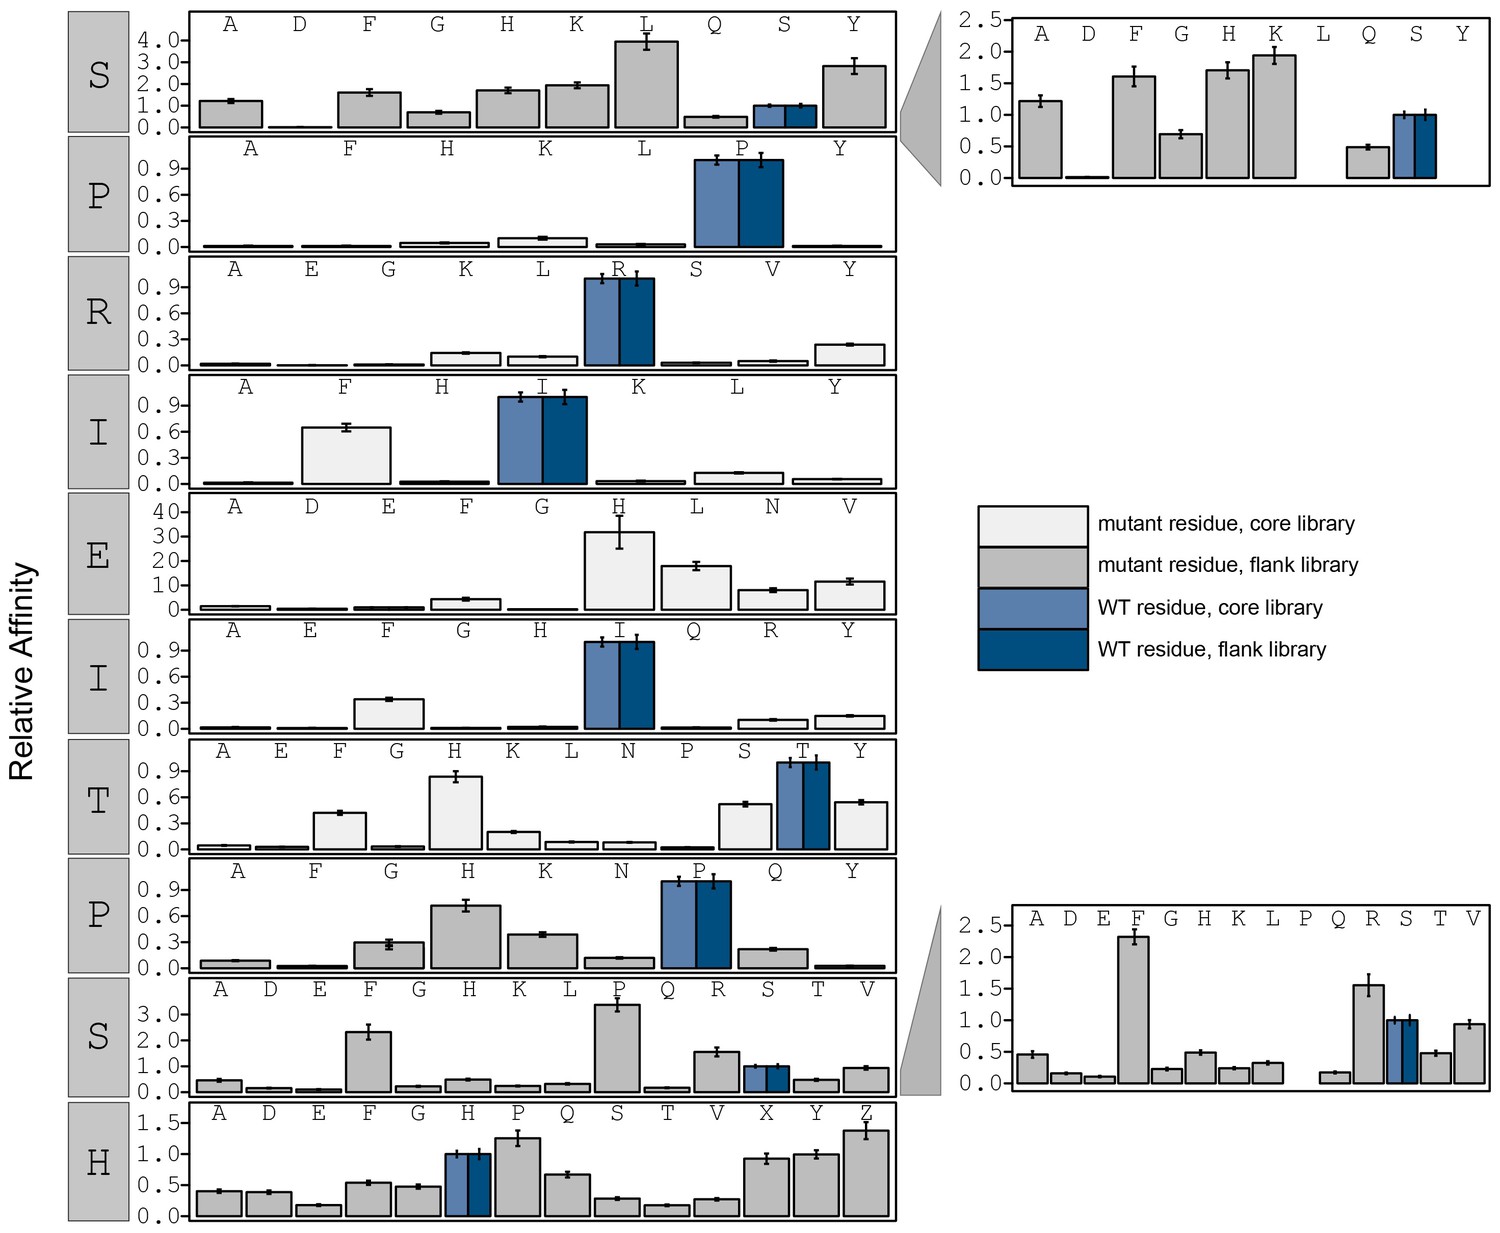
Figure 3—figure supplement 19
Relative affinity was calculated by normalizing to peptides KRMEPIAIIITDTEIS.
Peptide sequence KRMEPKIIITTDTEIS (red) contains a PxIxIT motif equivalent to the A238L viral inhibitor. Phosphoserine and phosphothreonine are represented by 'X' and 'Z' respectively.
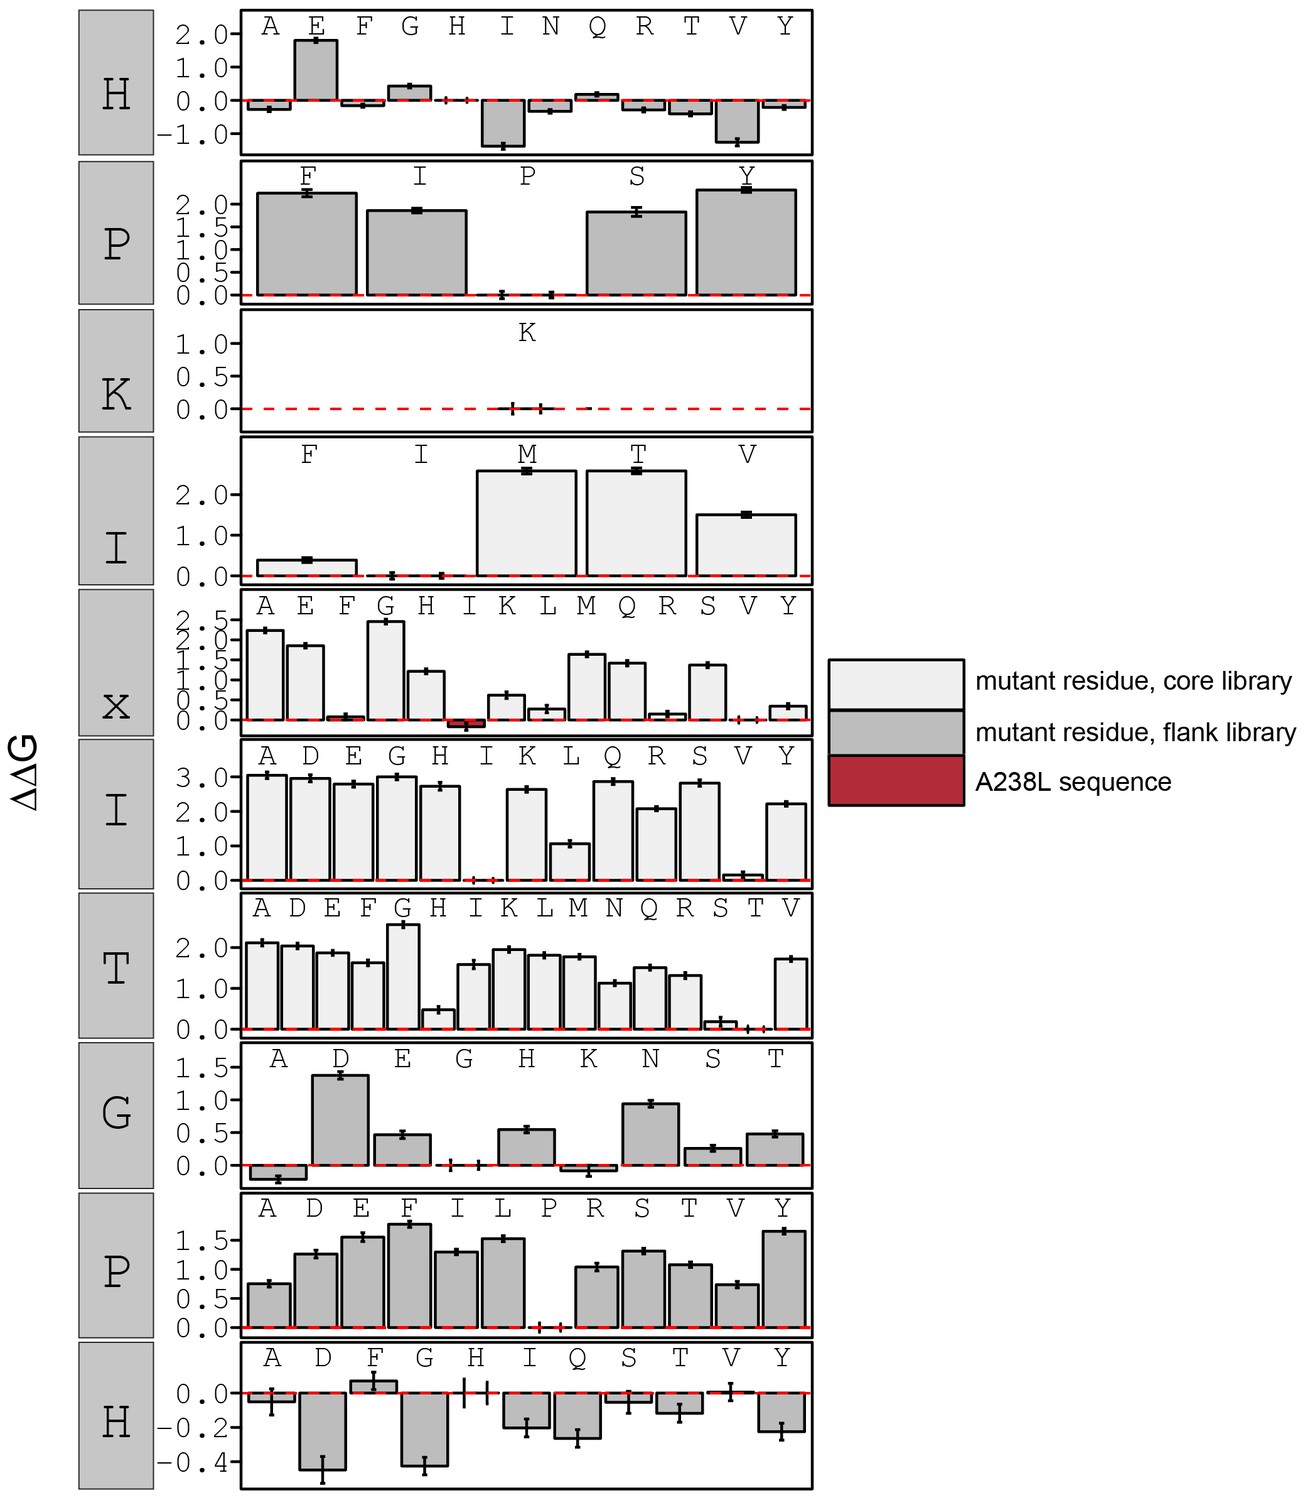
Figure 3—figure supplement 20
calculated in reference to peptide KRMEPIAIIITDTEIS.
Peptide sequence KRMEPKIIITTDTEIS (red) contains a PxIxIT motif equivalent to the A238L viral inhibitor. Phosphoserine and phosphothreonine are represented by 'X' and 'Z', respectively.
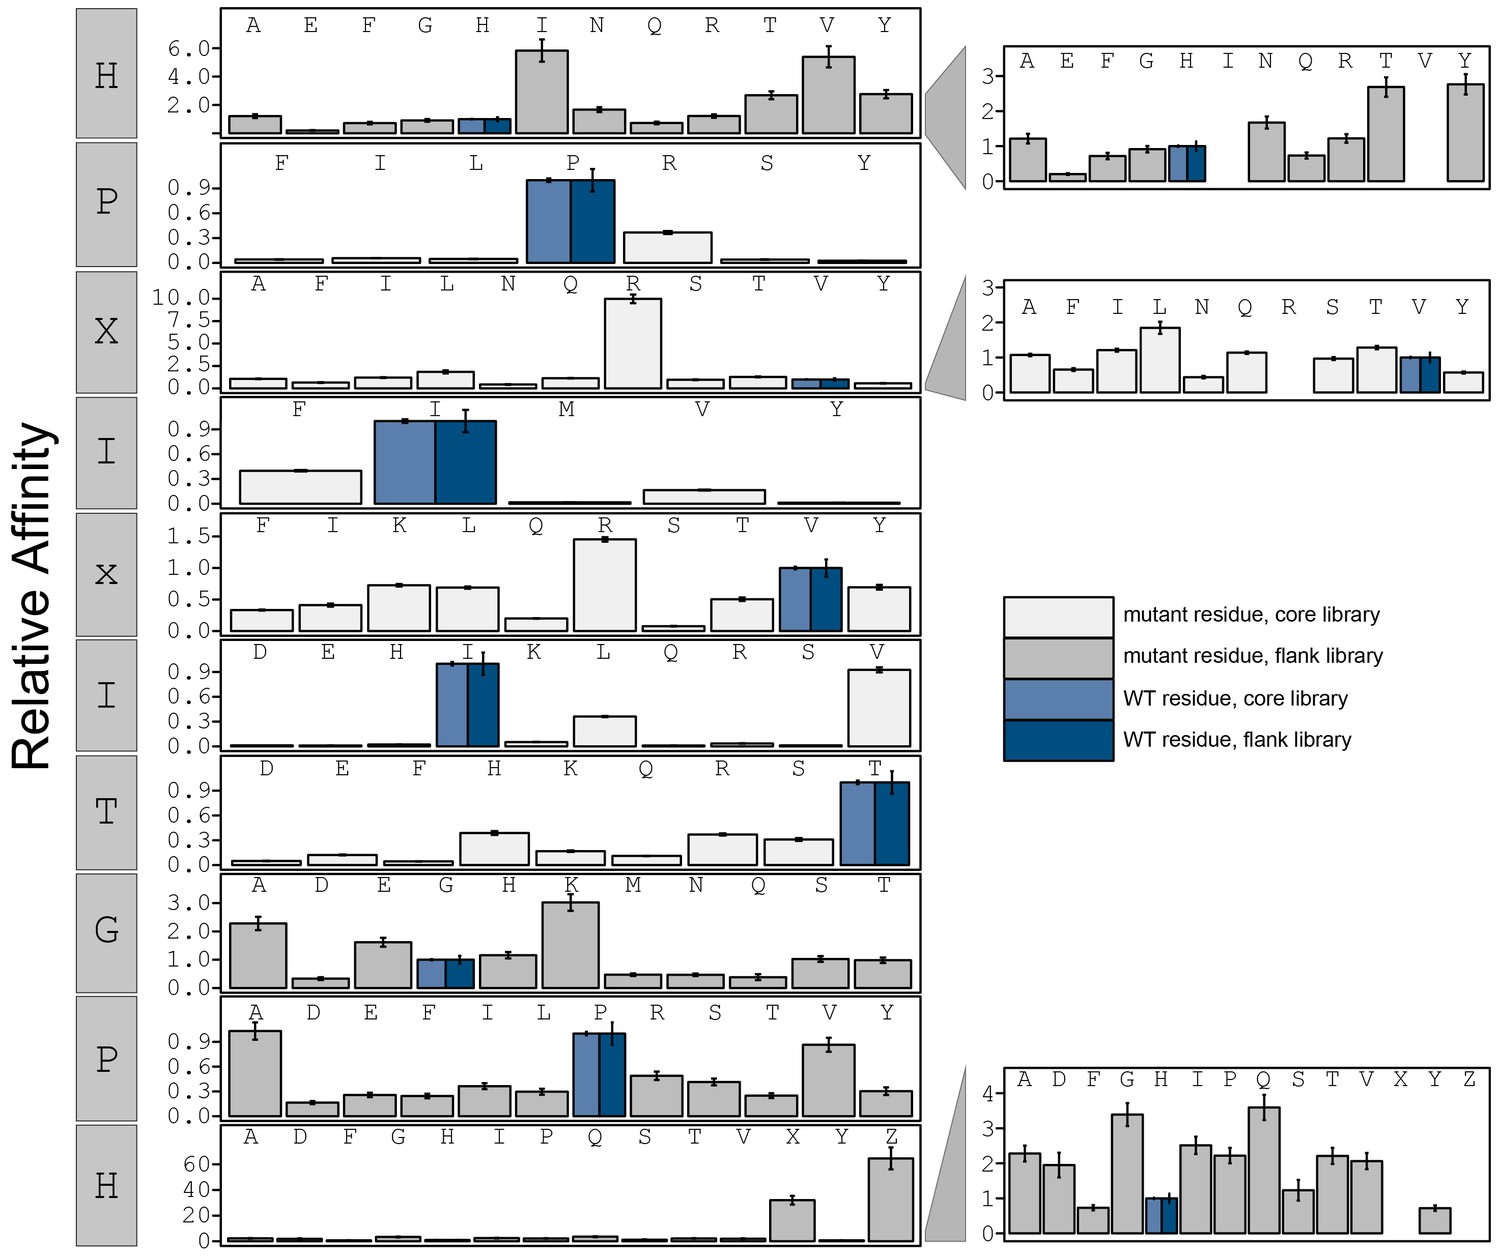
Figure 3—figure supplement 21
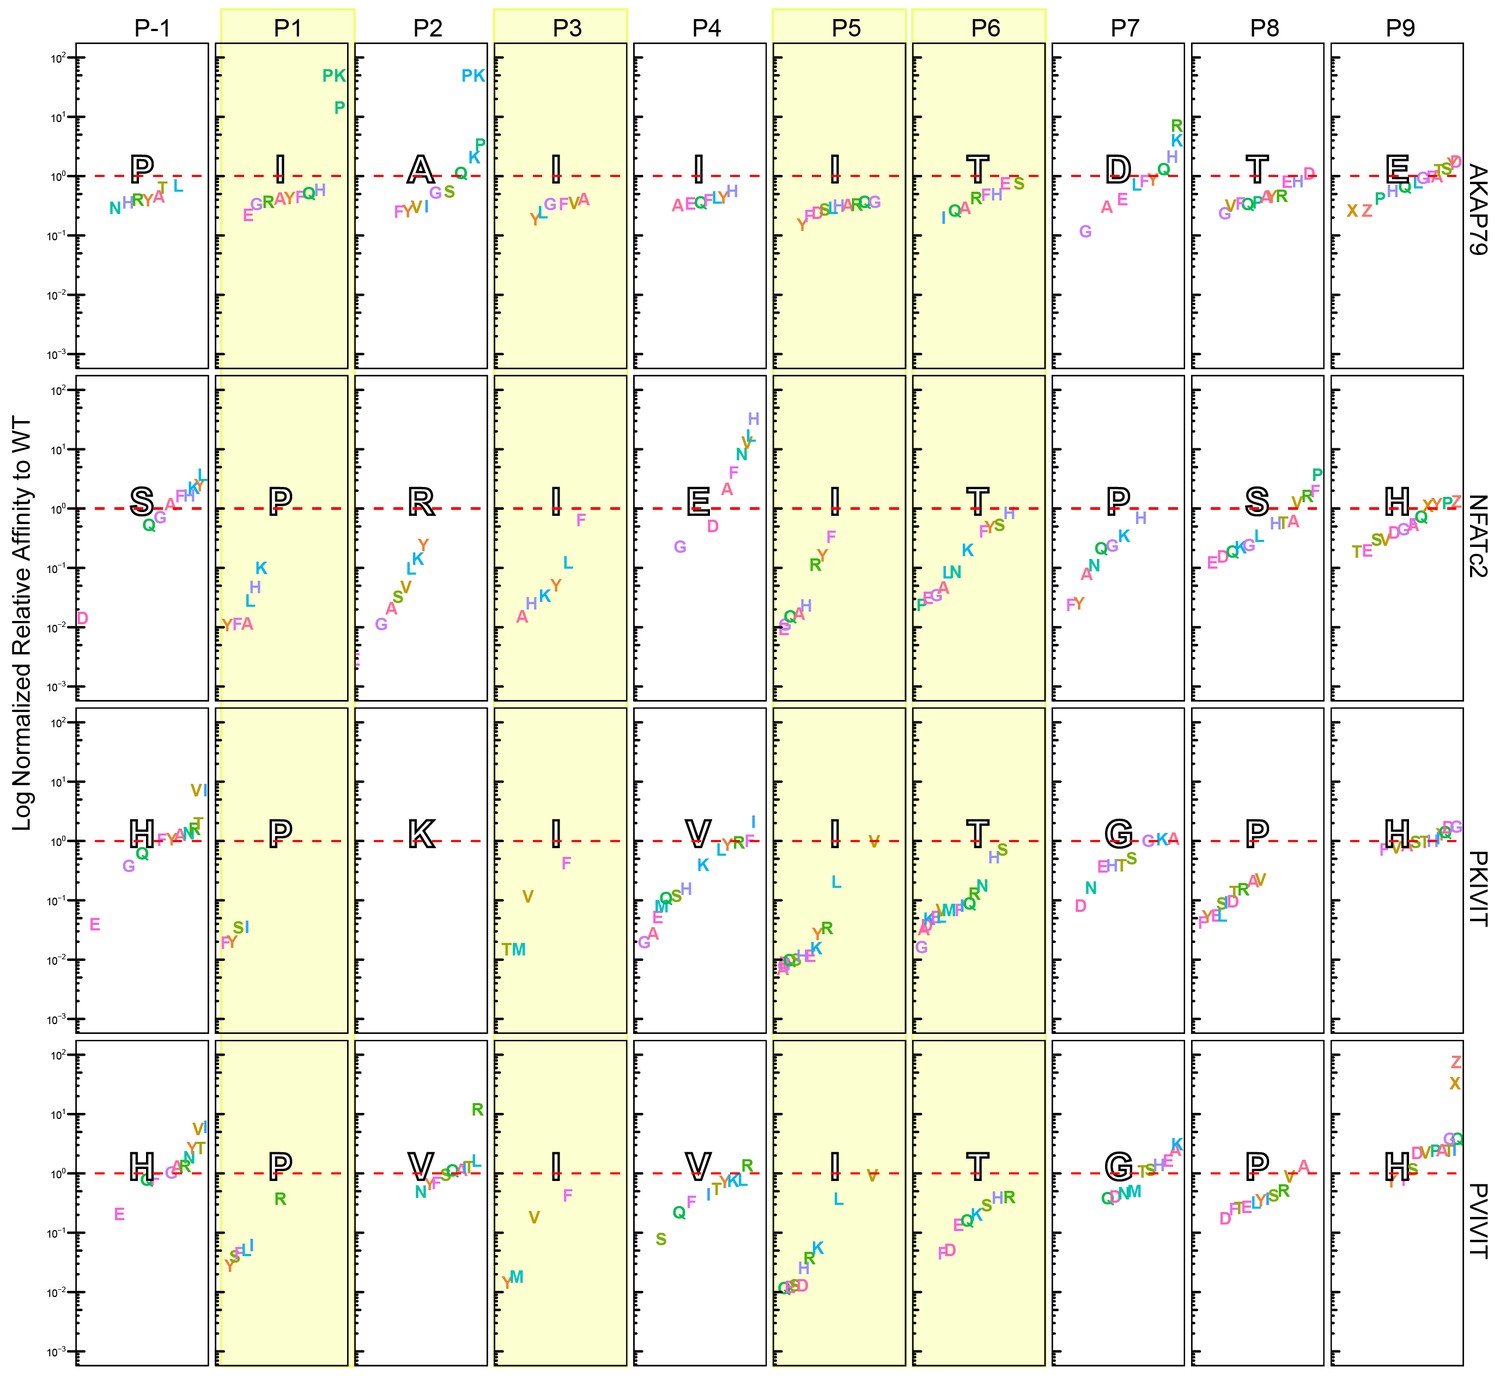
Visualization of Log normalized to corresponding WT sequences.
Amino acid substitutions (single letter code) for all four scaffolds: PVIVIT, PKIVIT, NFATc2, and AKAP79. Positions P-1 to P9 are separated by columns and columns highlighted in yellow represents conserved positions from PxIxIT binding motif. Letters in large black-outlined text corresponds to the WT sequence for that scaffold. Red dotted line is relative affinity = 1. Phosphoserine and phosphothreonine are represented by 'X' and 'Z', respectively.
Figure 3—figure supplement 22
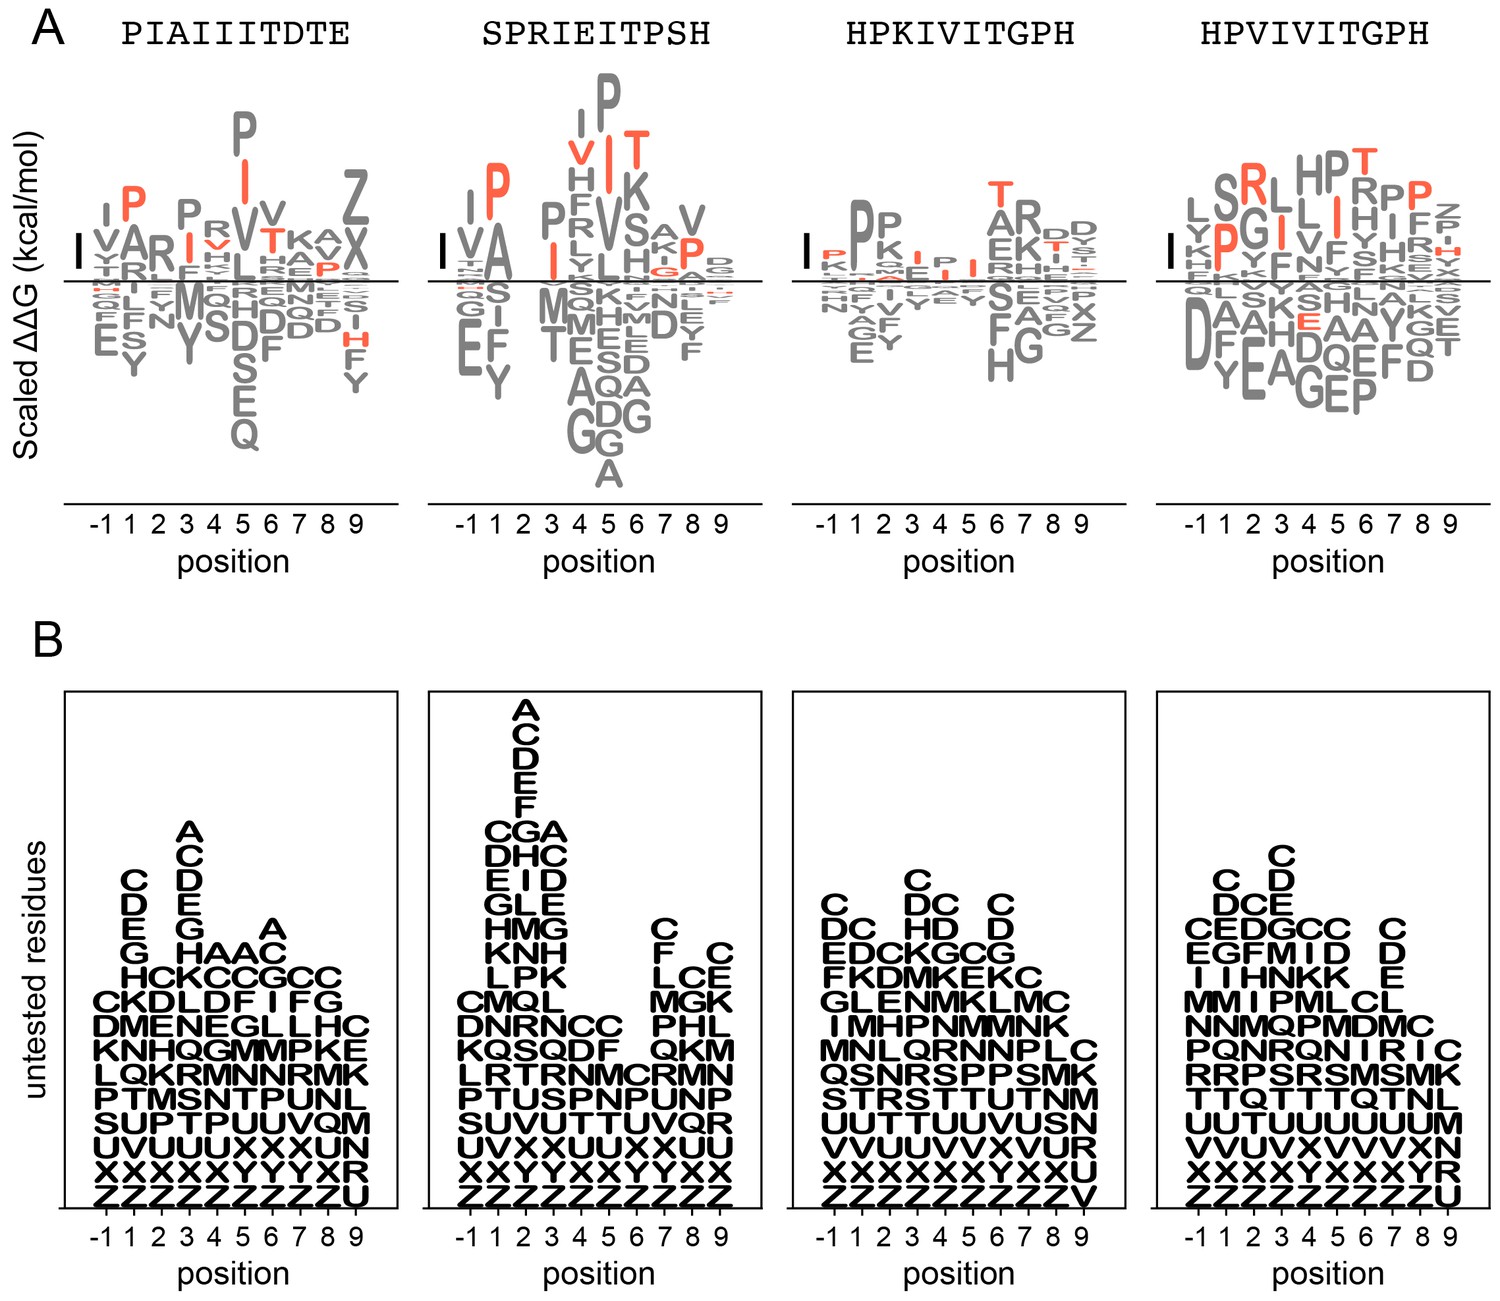
LogoMaker logos for binding data.
Top: binding preferences for AKAP79 (left), NFATc2 (middle left), PKIVIT (middle right), and PVIVIT (right) represented as logos. Scale bar indicates a change in binding affinity of 1 kcal/mol; amino acids are arranged top-to-bottom in order of binding preference. Wild-type residues are shown in red; other residues are shown in grey. Bottom: Logos display residues not tested experimentally at each position to illustrate missing data.
Figure 3—figure supplement 23
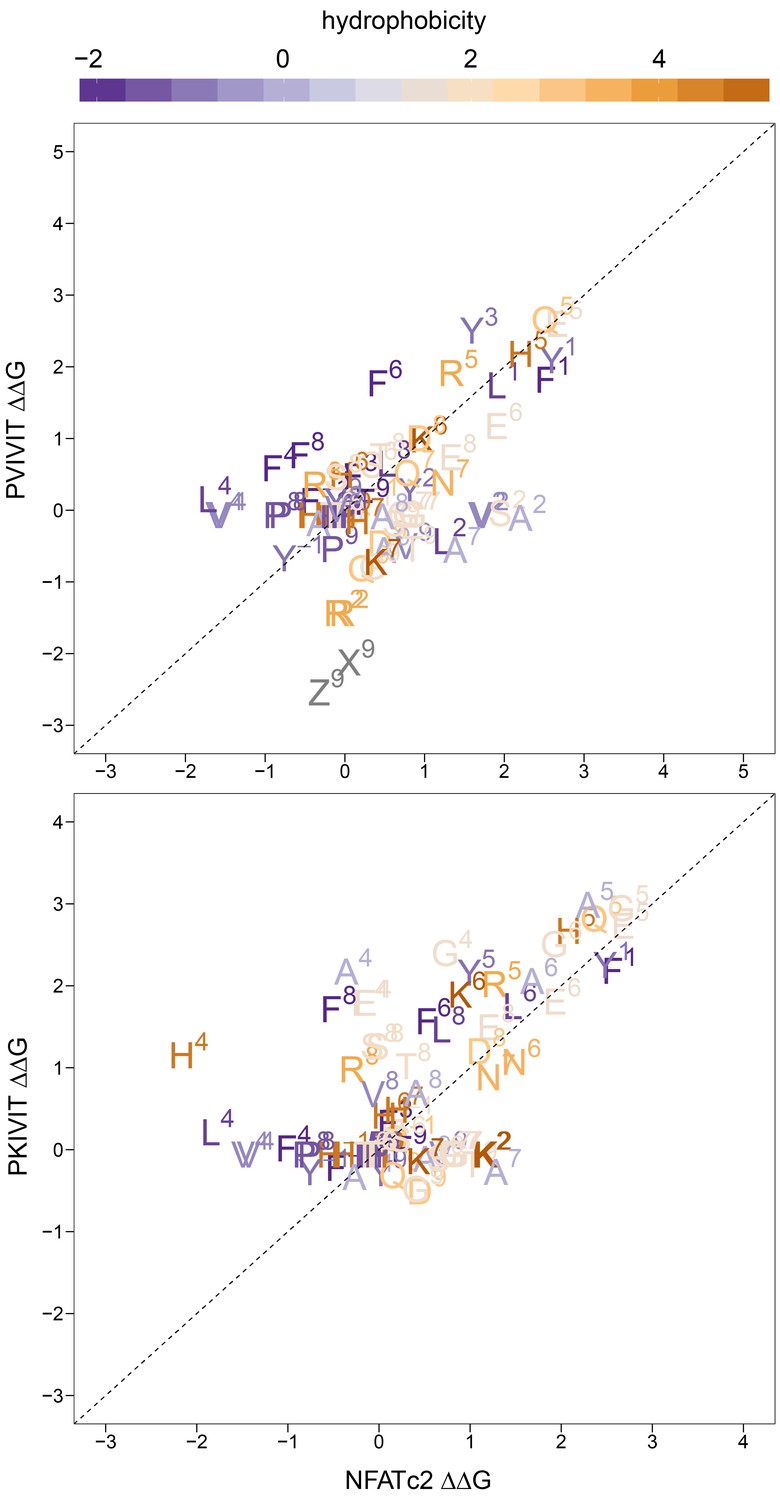
Measured changes in binding affinity for mutations in PVIVIT (top panel) and PKIVIT (bottom panel) relative to the same mutations in the NFATc2 (PRIEIT) library.
Amino acid substitutions are colored according to hydrophobicity with the position of the substitution indicated.
Figure 4 with 7 supplements
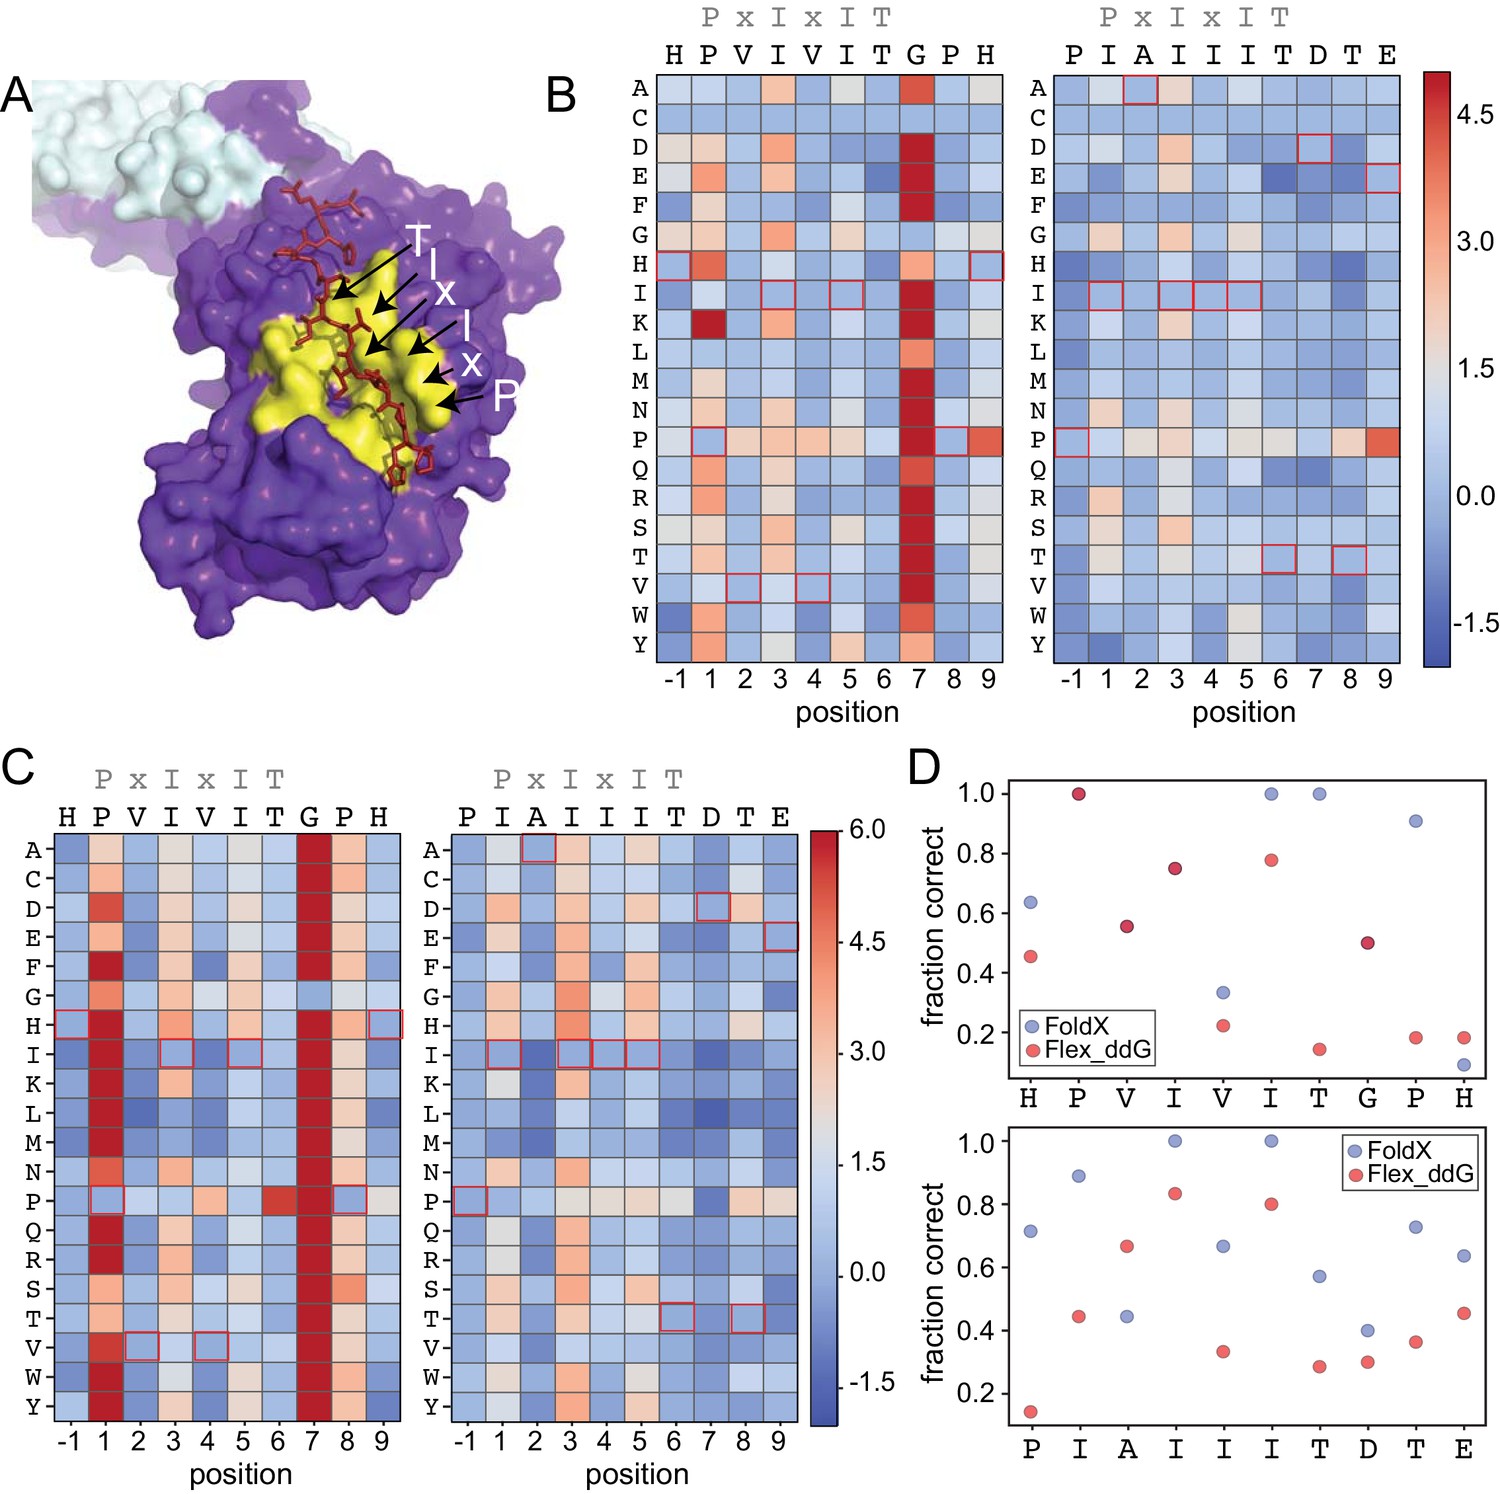
Structure-based modeling predictions.
(A) Co-crystal structures showing zoomed in overlay of substrates (PDB: 2P6B). (B) Heat maps showing predicted changes in binding energy from the Rosetta ‘flex_ddG’ protocol for each amino acid substitution at each position for PVIVIT and IAIIIT targets. (C) Heat maps showing FoldX-predicted changes in binding energy for each amino acid substitution at each position for PVIVIT and IAIIIT targets. (D) Fraction of residues correctly predicted to be stabilizing or destabilizing by both models as a function of position for PVIVIT (top) and IAIIIT (bottom).
-
Figure 4—source data 1
Rosetta sequence tolerance protocol frequencies for PVIVIT.
- https://doi.org/10.7554/eLife.40499.057
-
Figure 4—source data 2
Rosetta sequence tolerance protocol frequencies for IAIIIT.
- https://doi.org/10.7554/eLife.40499.058
-
Figure 4—source data 3
Flex ddG-predicted values for PVIVIT.
- https://doi.org/10.7554/eLife.40499.059
-
Figure 4—source data 4
Flex ddG-predicted values for IAIIIT.
- https://doi.org/10.7554/eLife.40499.060
-
Figure 4—source data 5
FoldX ddG-predicted values for PVIVIT.
- https://doi.org/10.7554/eLife.40499.061
-
Figure 4—source data 6
FoldX ddG-predicted values for IAIIIT.
- https://doi.org/10.7554/eLife.40499.062
Figure 4—figure supplement 1
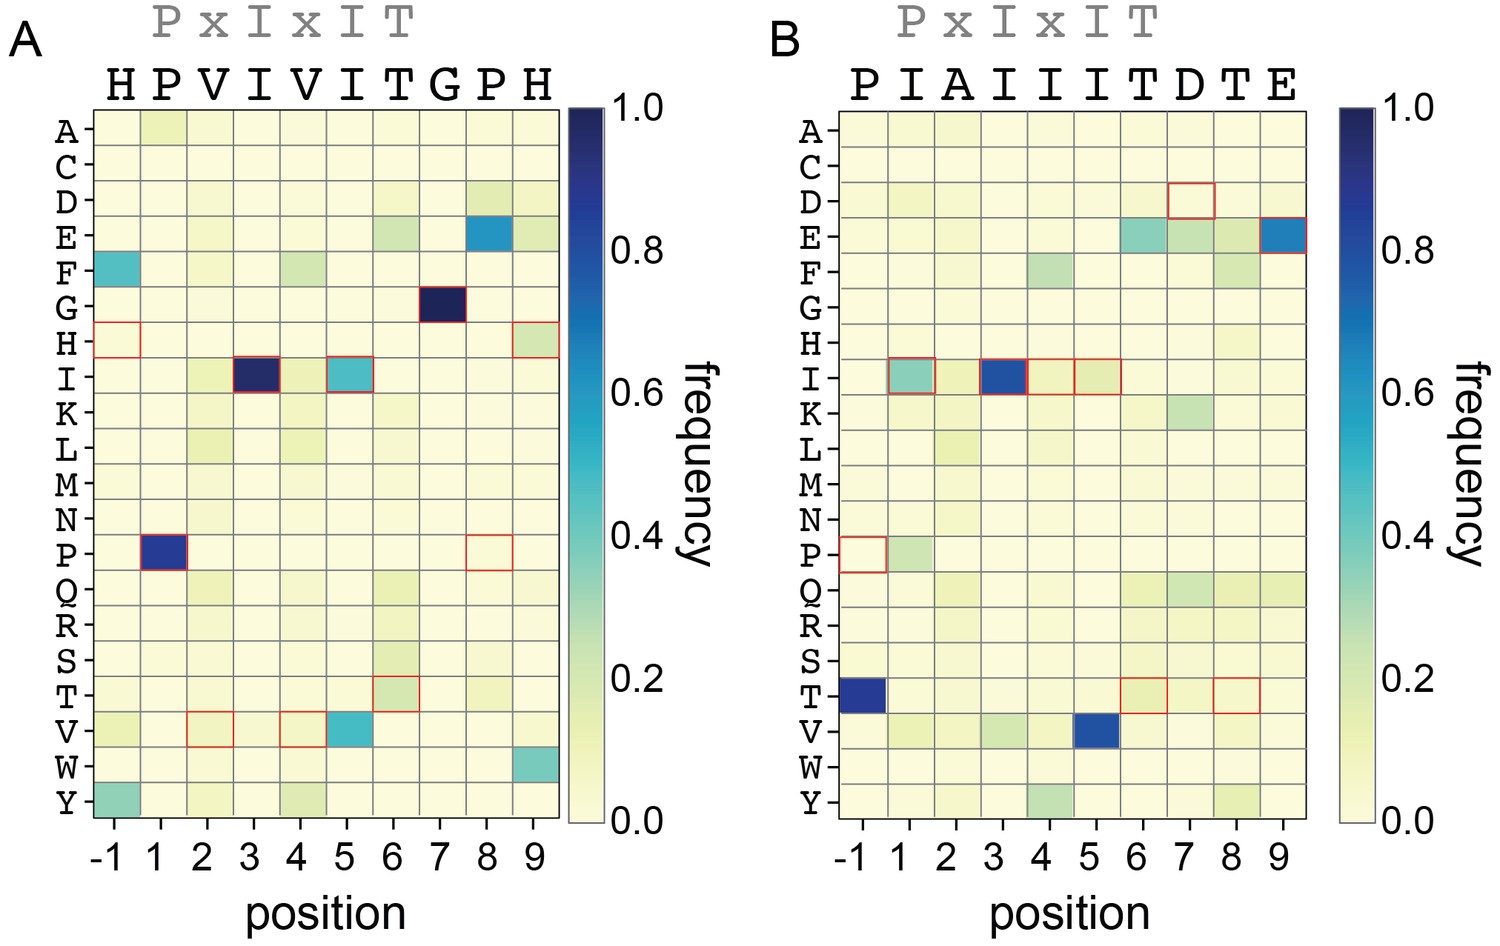
Rosetta Sequence Tolerance protocol frequencies.
Heat maps showing the frequencies with which each amino acid substitution is returned as most favorable by the Rosetta Sequence Tolerance protocol at each position for PVIVIT and IAIIIT targets.
Figure 4—figure supplement 2
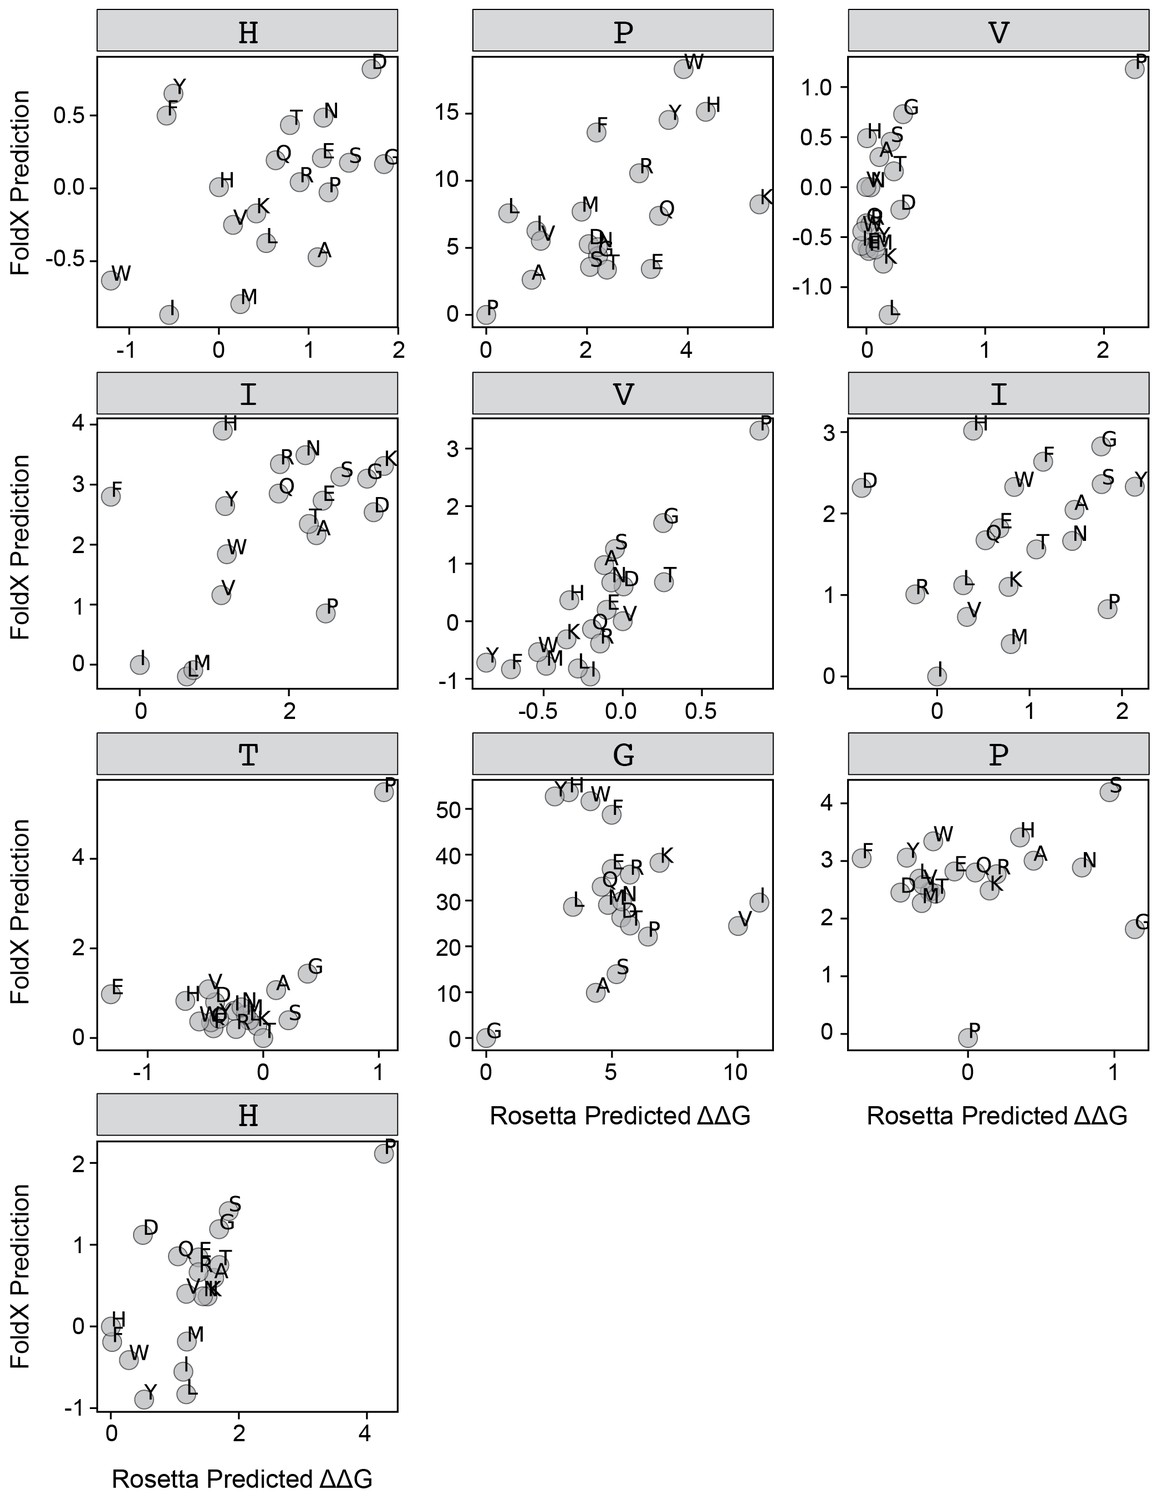
FoldX versus Rosetta predictions for PVIVIT.
Scatter plots comparing FoldX and Rosetta predictions for each position within the PVIVIT peptide.
Figure 4—figure supplement 3
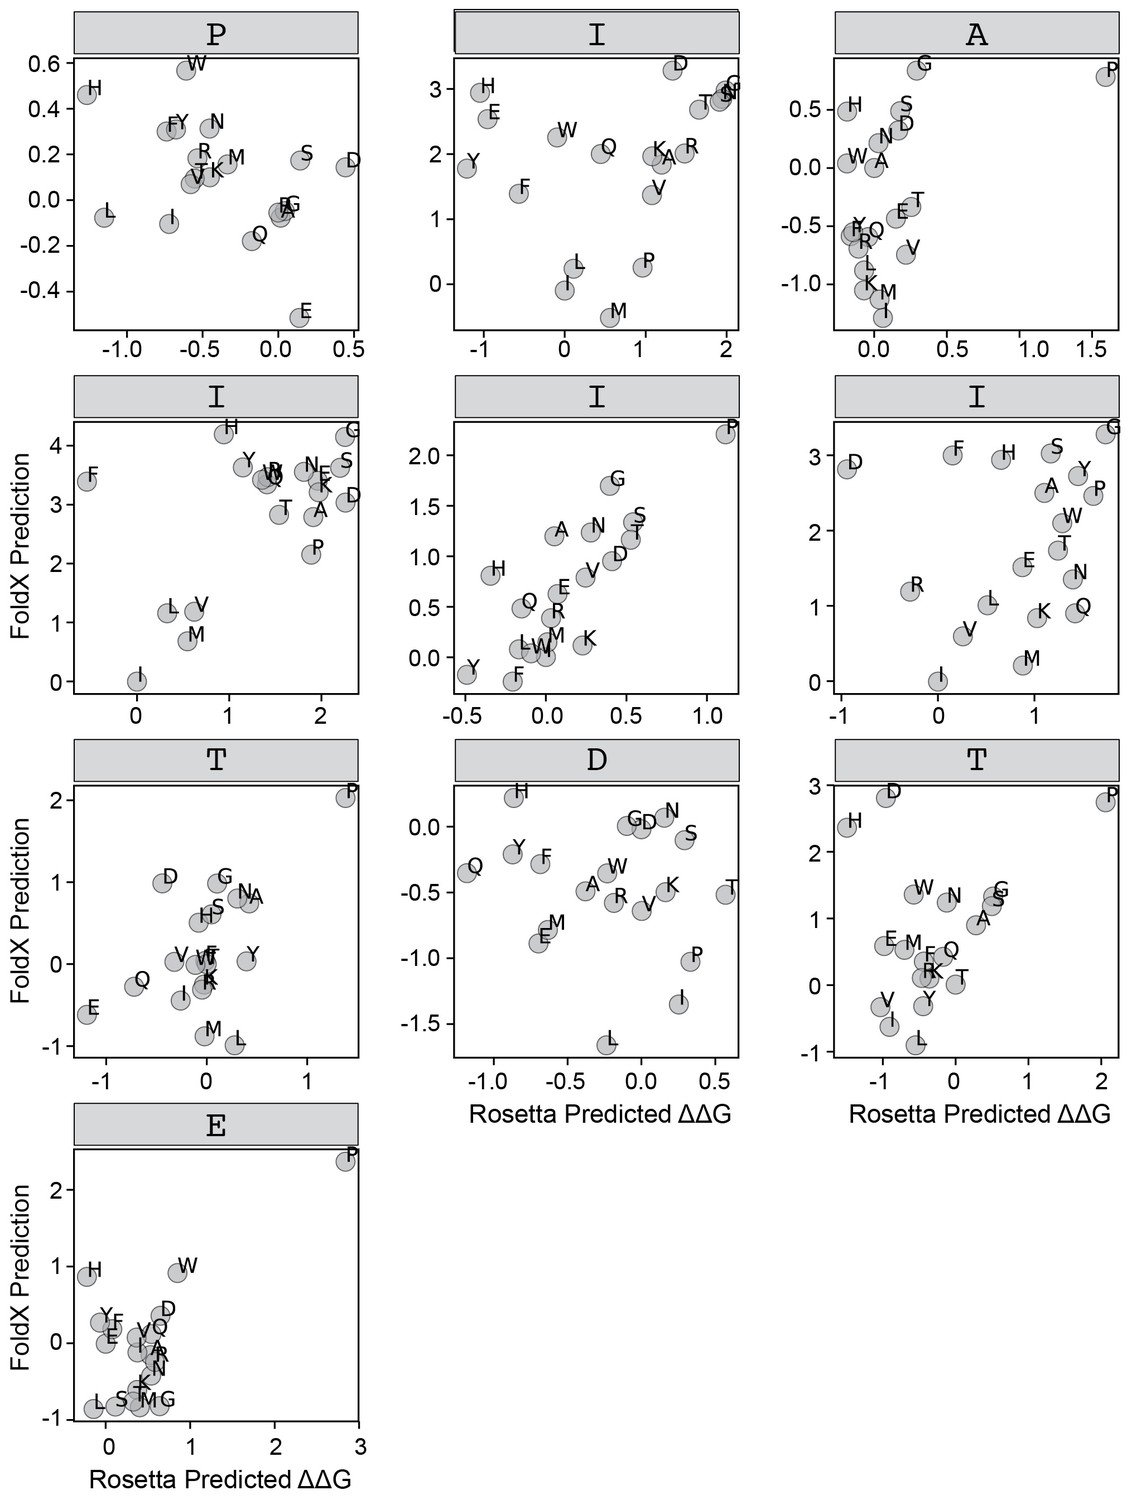
FoldX versus Rosetta predictions for IAIIIT.
Scatter plots comparing FoldX and Rosetta predictions for each position within the IAIIIT peptide.
Figure 4—figure supplement 4
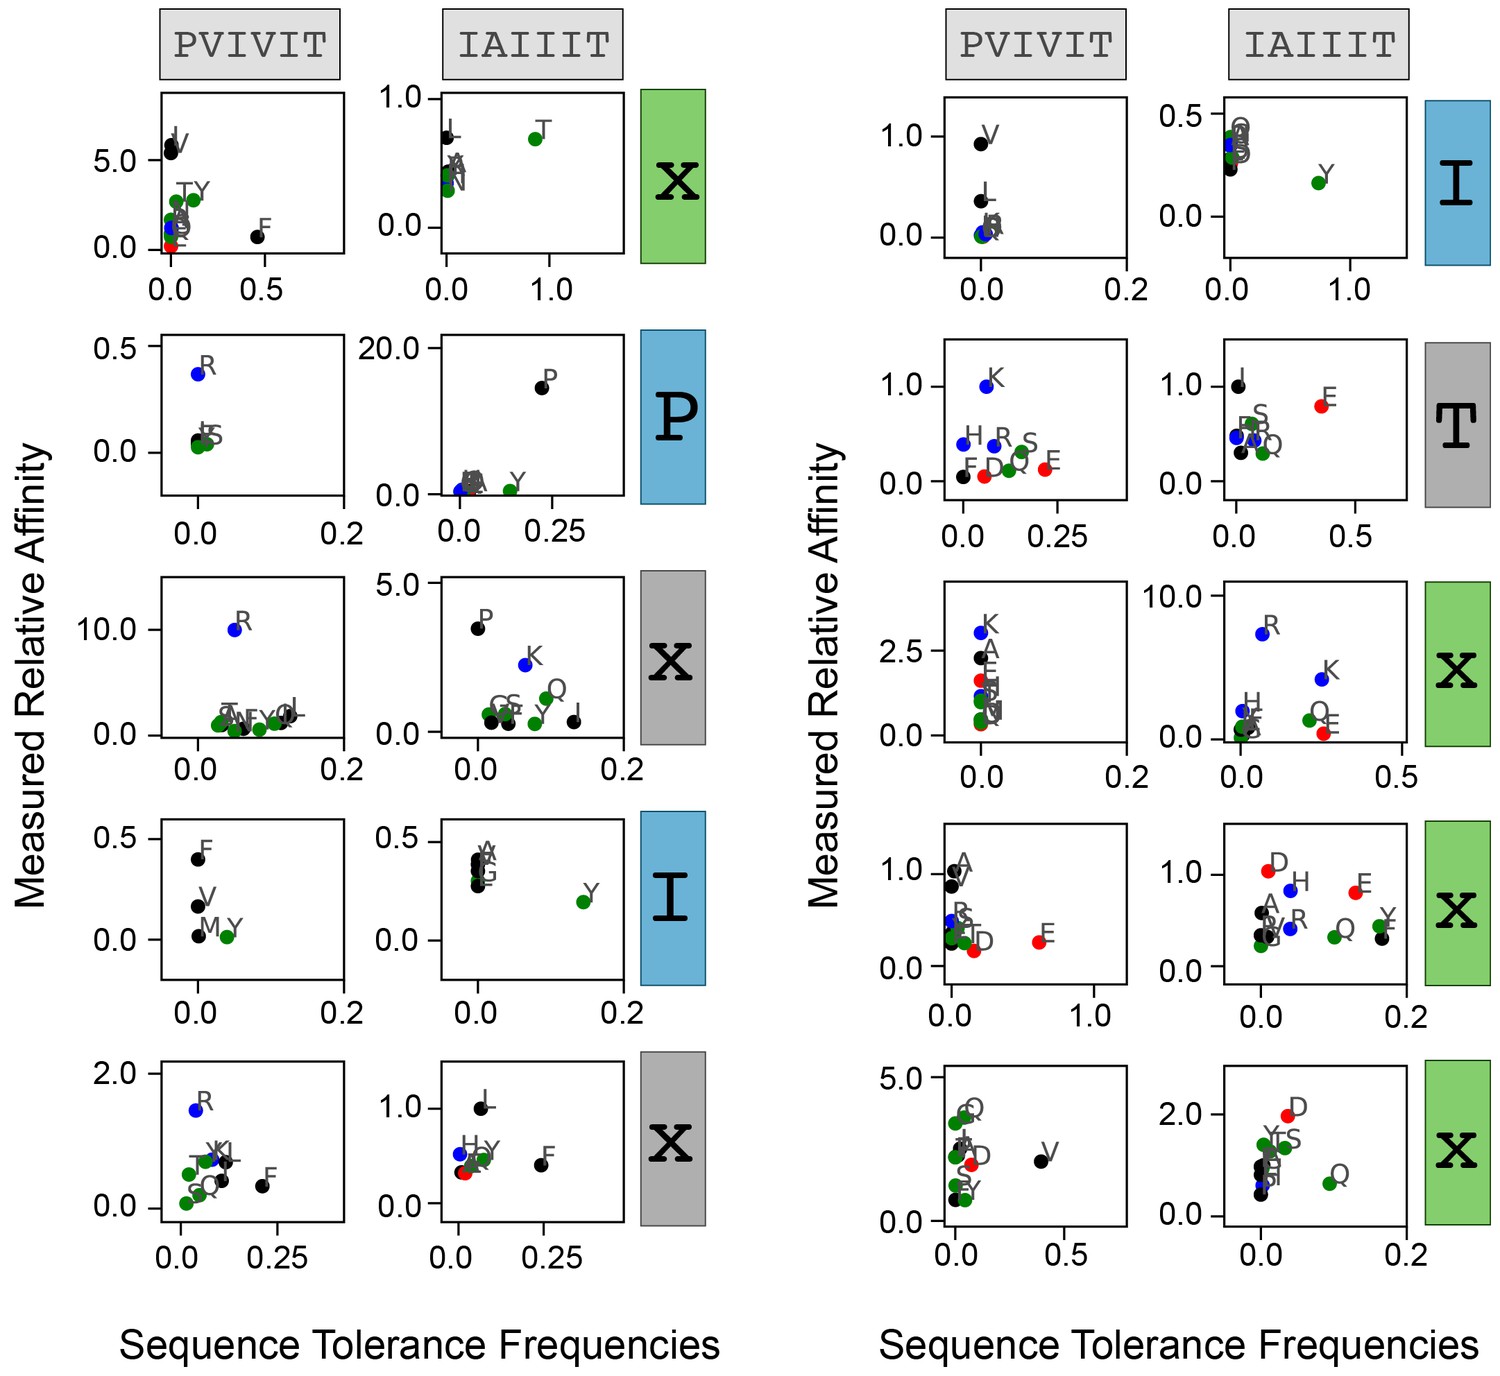
Measured affinities versus predicted amino acid frequencies.
Correlation between measured relative affinity and Backrub-predicted amino acid frequency for each substitution as a function of position. Residues are colored by biochemical properties (red = acidic, blue = basic, black = hydrophobic, green = all other residues).
Figure 4—figure supplement 5
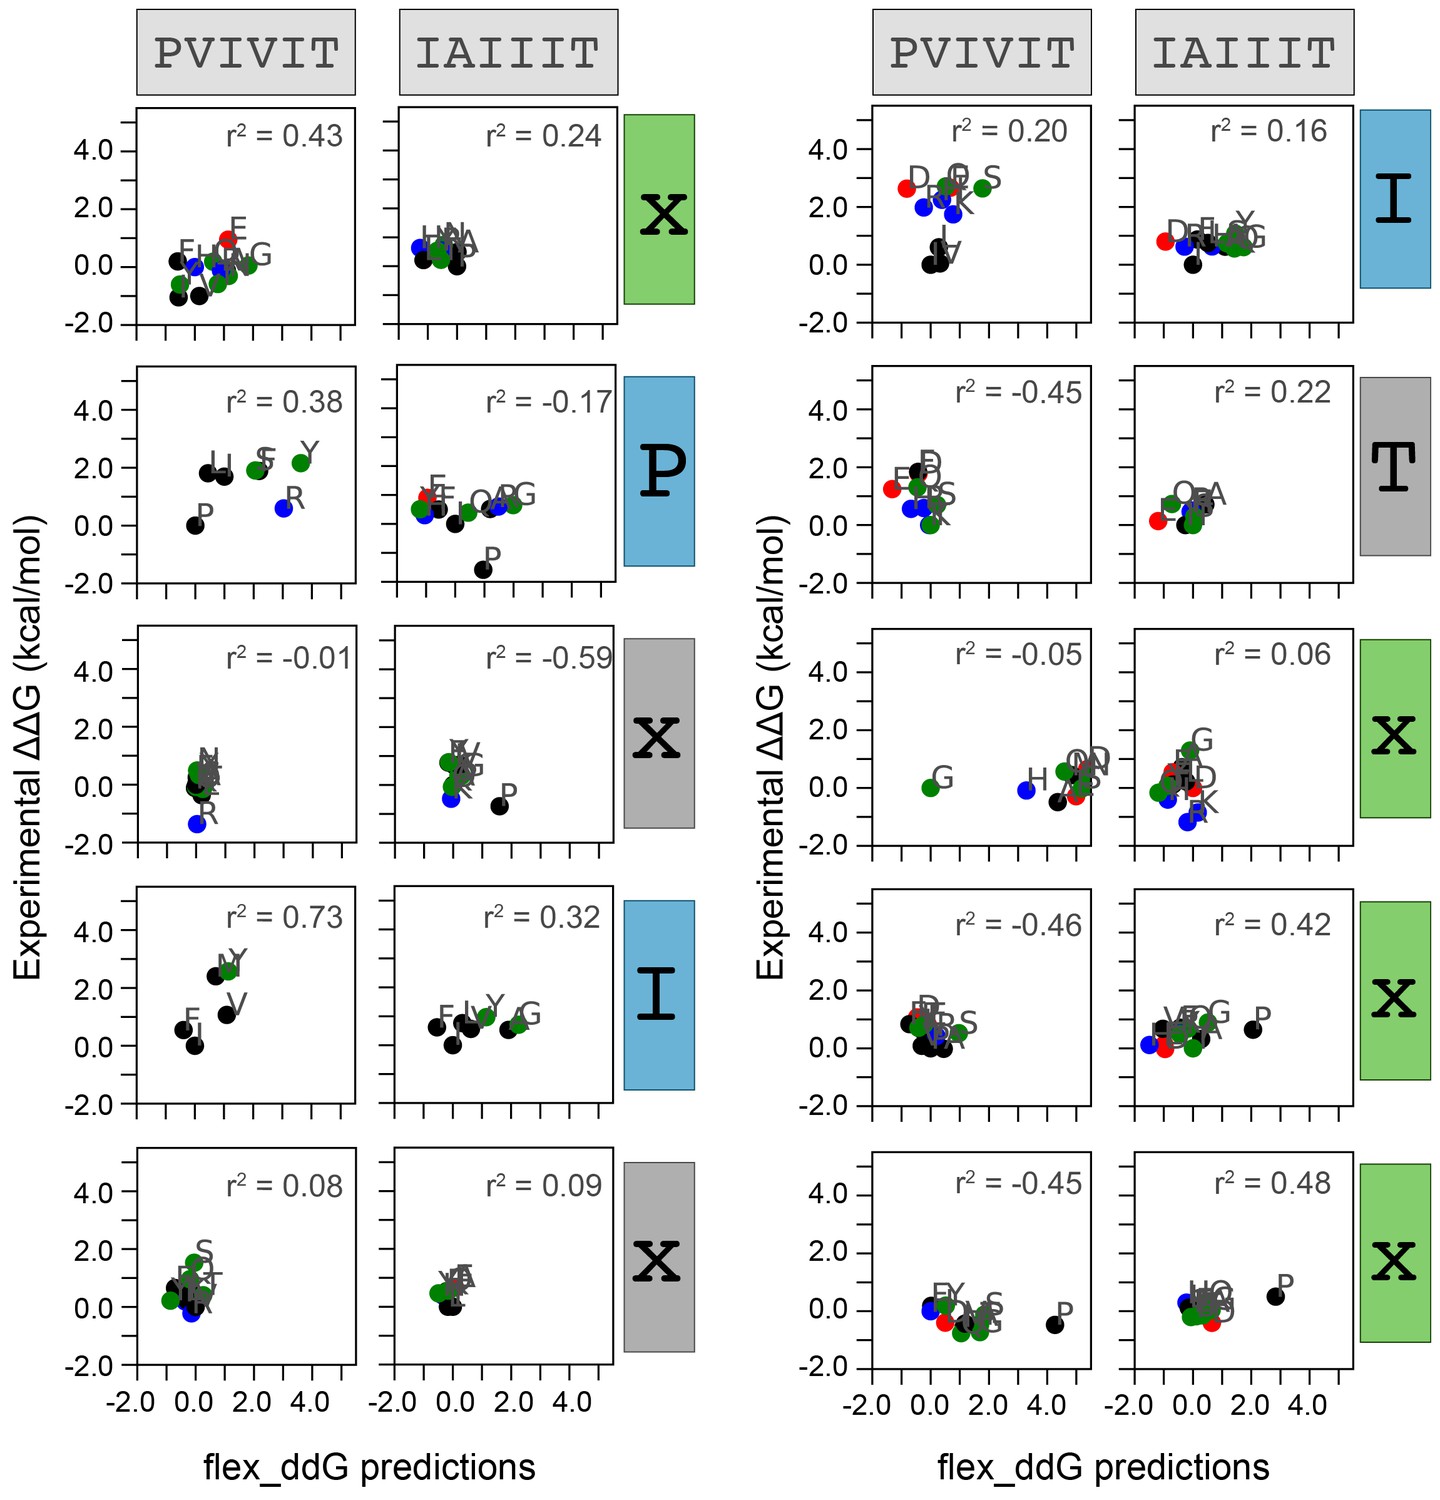
Measured versus Rosetta-predicted changes in Gibbs free energies.
Correlation between measured and flex_ddG-predicted change in Gibbs free energy for each mutation at each position within PVIVIT and AKAP79 peptides. Each panel includes calculated correlation coefficients between MRBLE-pep measured changes in binding affinity (y axis) and Rosetta-predicted changes in binding affinity (x axis). Residues are colored by biochemical properties (red = acidic, blue = basic, black = hydrophobic, green = all other residues).
Figure 4—figure supplement 6
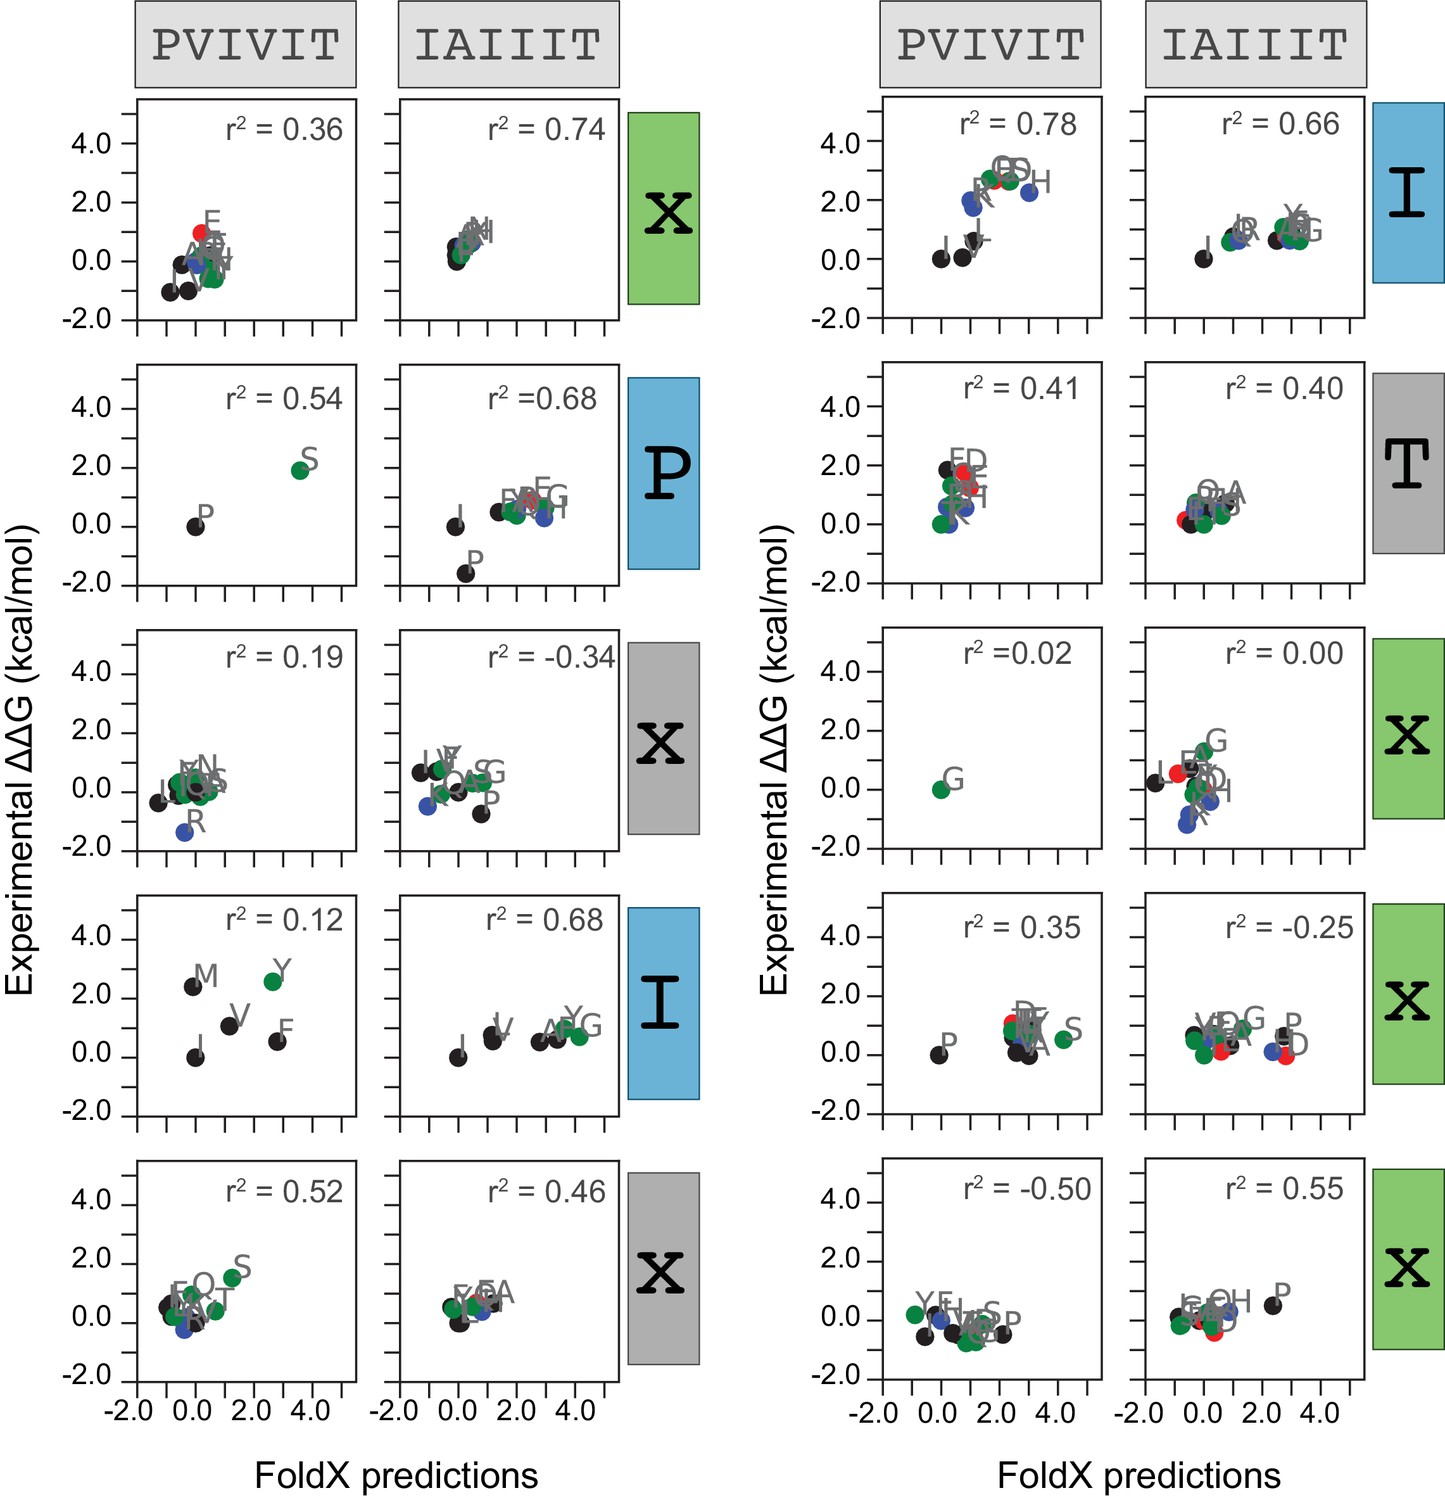
Measured versus FoldX-predicted changes in Gibbs free energies.
Correlation between measured and FoldX-predicted change in Gibbs free energy for each mutation at each position within PVIVIT and AKAP79 peptides. Each panel includes calculated correlation coefficients between MRBLE-pep measured changes in binding affinity (y axis) and FoldX-predicted changes in binding affinity (x axis). Residues are colored by biochemical properties (red = acidic, blue = basic, black = hydrophobic, green = all other residues).
Figure 4—figure supplement 7

MRBLE-pep measurements, FoldX predictions, and Rosetta predictions versus orthogonal affinity measurements for 3 PVIVIT variants.
Comparison between MRBLE-pep measurements (green), FoldX predictions (blue), and Rosetta predictions (red) versus previous literature measurements for the energetic effects of PVIVIN and PVIVVT single-site substitutions from the WT PVIVIT peptide. Literature values are calculated from Li et al. (2007).
Figure 5 with 7 supplements
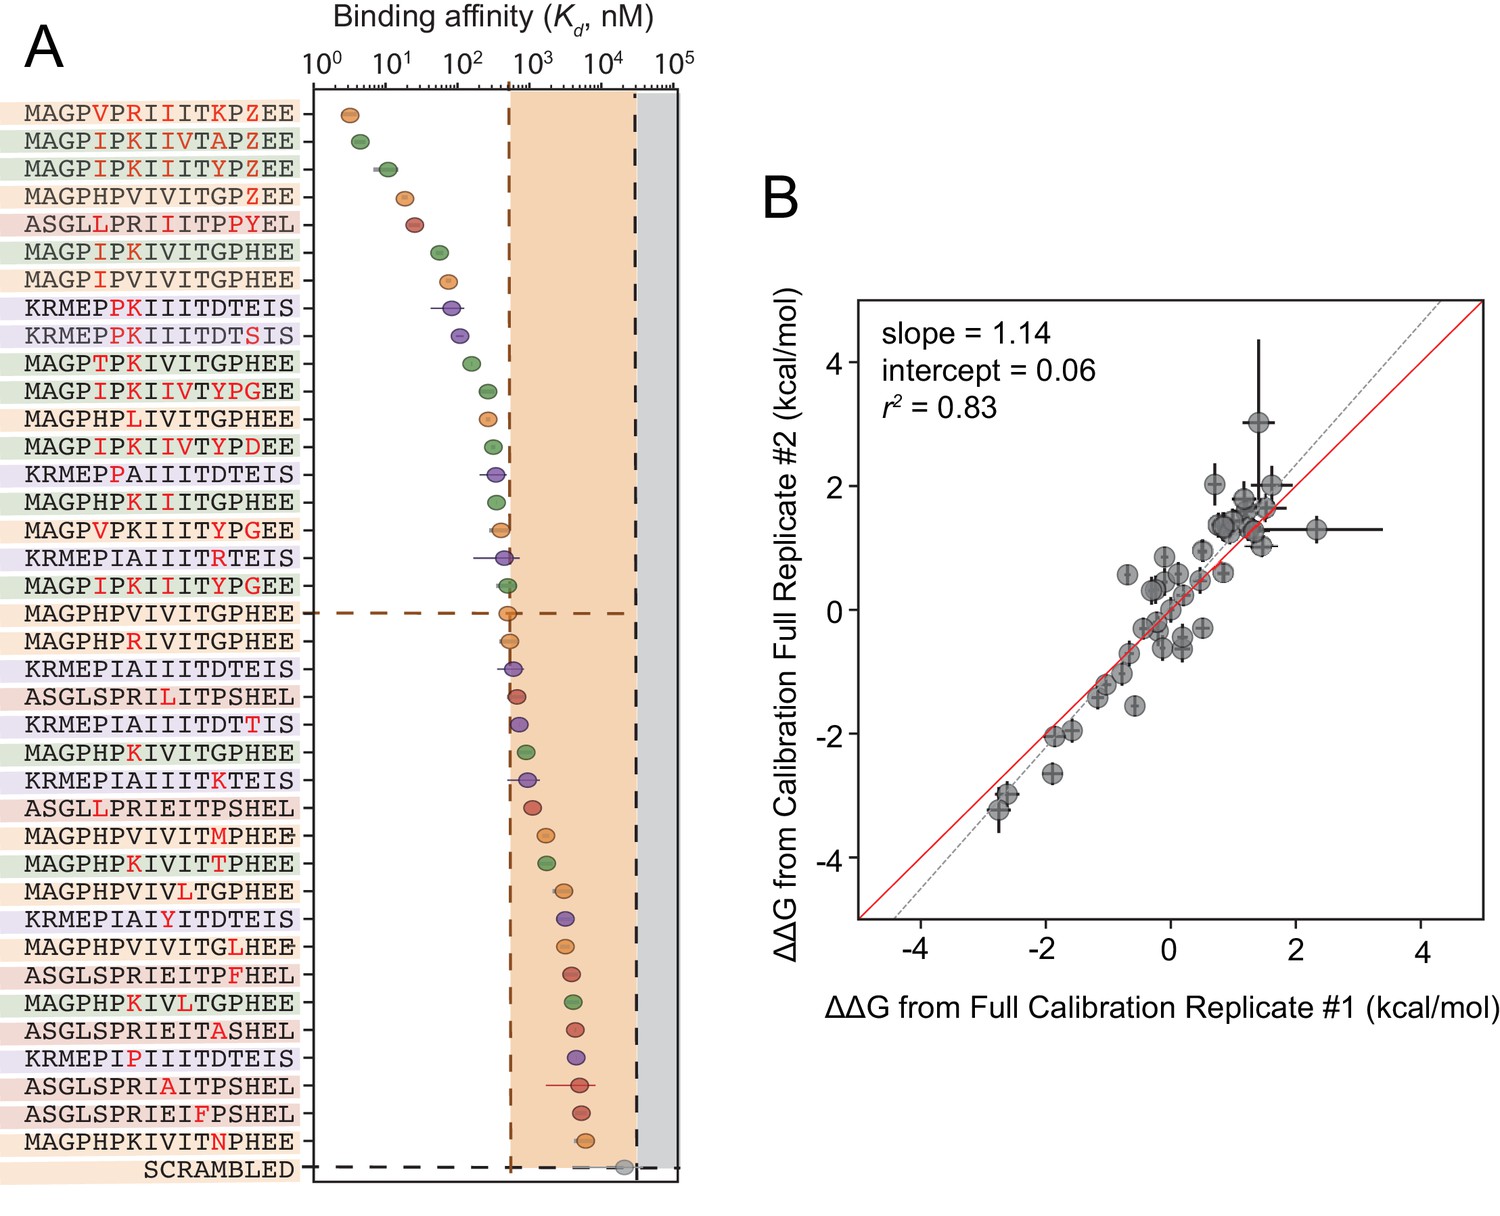
Calibrated in vitro affinities for a range of peptides.
(A) In vitro measurements of binding affinities for high-affinity binders identified by combining favorable residues. (B) Correlation between measured values for a full technical replicate (new bead synthesis, new peptide synthesis, and new calcineurin protein purification) for the library shown in (A). Solid red line shows expected 1:1 linear relationship, dotted grey line shows linear regression of log-transformed values.
-
Figure 5—source data 1
Concentration-dependent binding for calibration library, replicate 1.
- https://doi.org/10.7554/eLife.40499.071
-
Figure 5—source data 2
Concentration-dependent binding for calibration library, replicate 2.
- https://doi.org/10.7554/eLife.40499.072
-
Figure 5—source data 3
Concentration-dependent binding for full calibration library, replicate 1.
- https://doi.org/10.7554/eLife.40499.073
-
Figure 5—source data 4
Concentration-dependent binding for full calibration library, replicate 2.
- https://doi.org/10.7554/eLife.40499.074
Figure 5—figure supplement 1

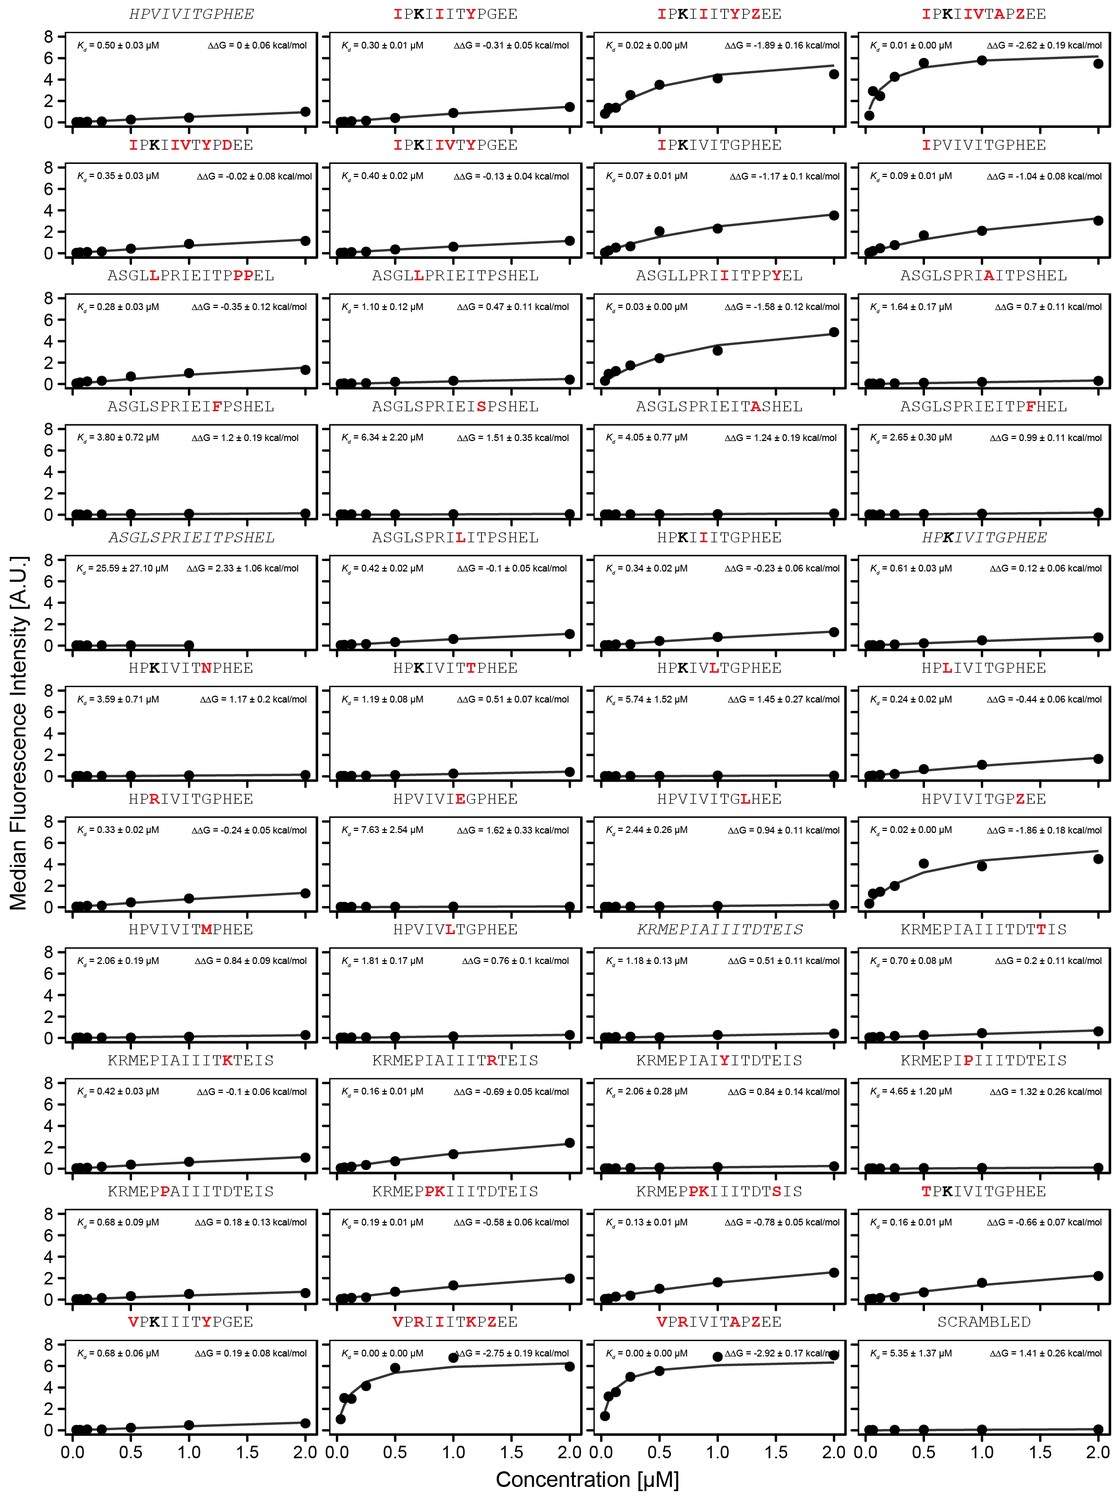
Concentration-dependent binding for calibration peptide library, replicate 1.
Concentration-dependent binding measurements for selected peptides within the ‘calibration' library for the first experimental replicate. For each sequence, measured change in binding affinity relative to the wild-type PVIVIT sequence was determined by a global fit to a single-site binding model (black line); values were calculating from this and the known literature for PVIVIT (0.5 μM) (Aramburu et al., 1999).
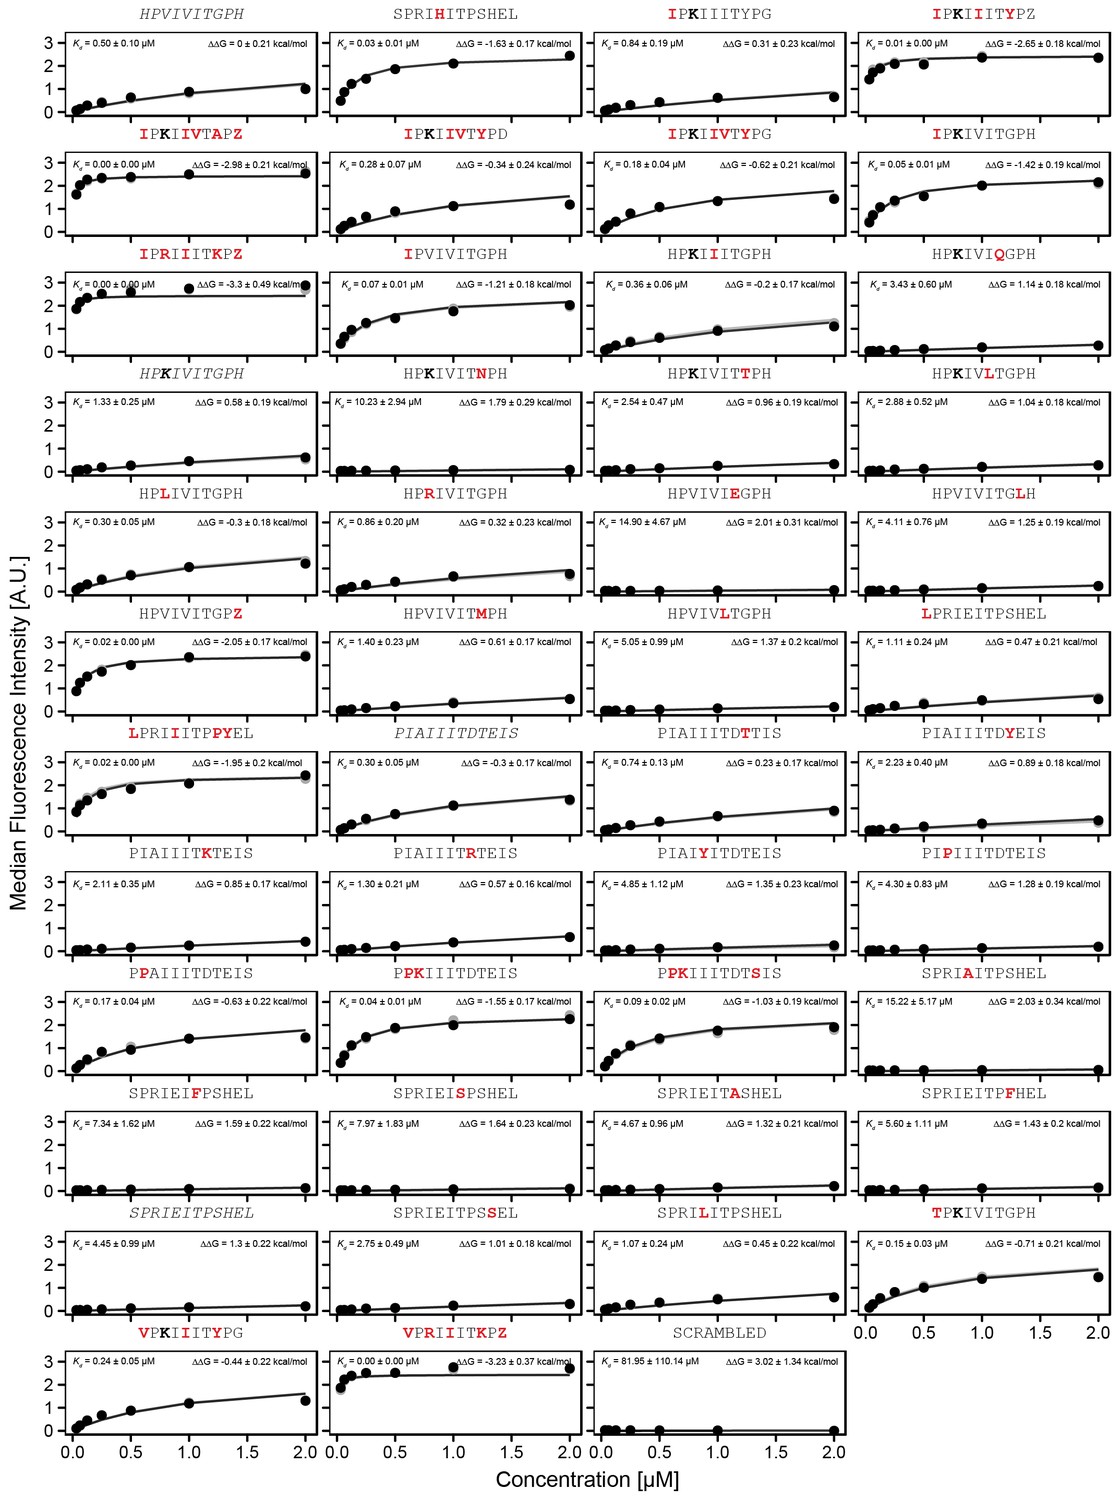
Figure 5—figure supplement 2

Concentration-dependent binding for calibration peptide library, replicate 2.
ConcentrationConcentration-dependent binding measurements for selected peptides within the ‘calibration' library for the second experimental replicate. For each sequence, measured change in binding affinity relative to the wild-type PVIVIT sequence was determined by a global fit to a single-site binding model (black line); values were calculating from this and the known literature for PVIVIT (0.5 μM) (Aramburu et al., 1999).
Figure 5—figure supplement 3
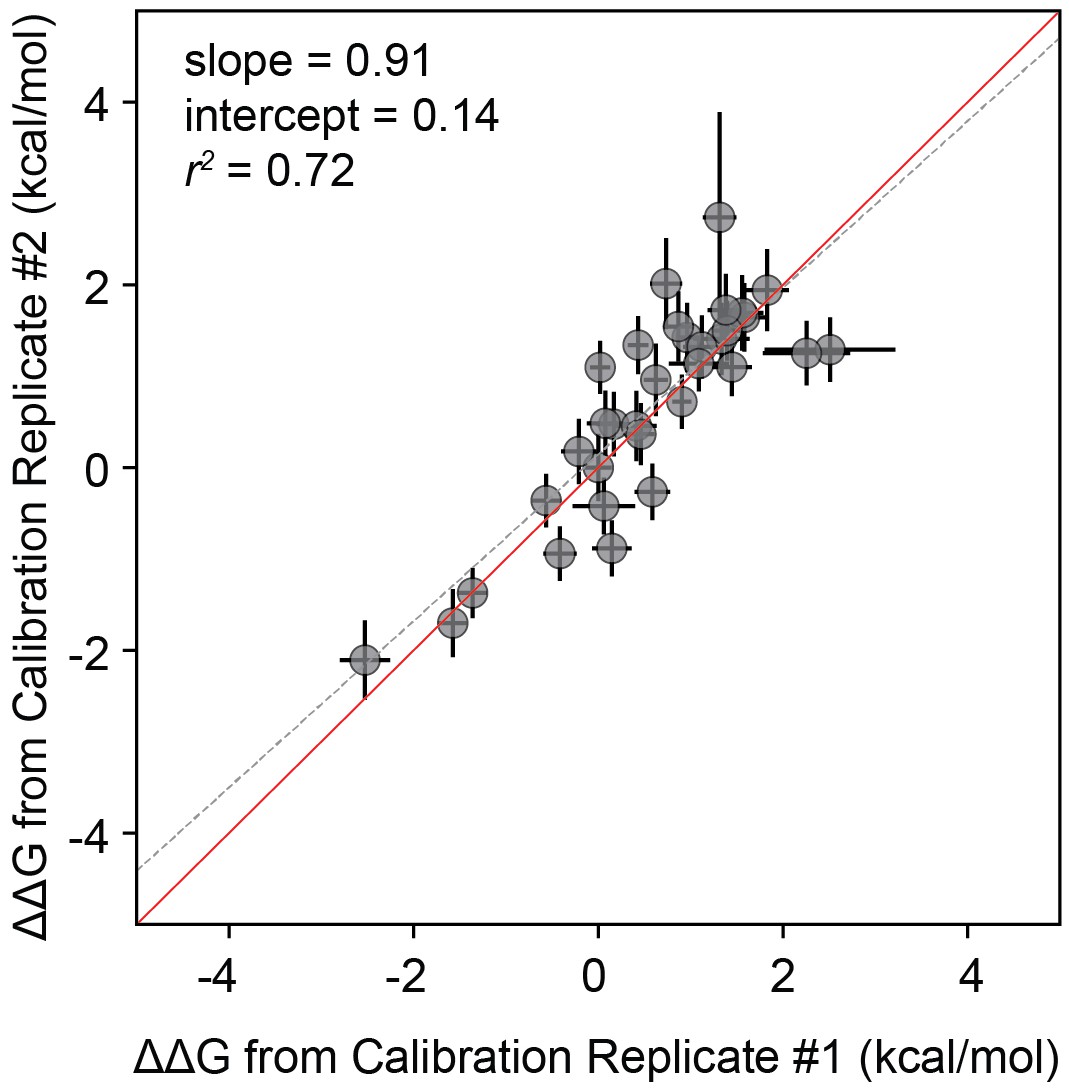
Correlation between measurements for calibration library technical replicates.
Correlation between measurements for technical replicates of ‘calibration' libraries. Correlation between measured values for a full technical replicate (new bead synthesis, new peptide synthesis, and new calcineurin protein purification) for the ‘calibration’ library. Solid red line shows expected 1:1 linear relationship, dotted grey line shows linear regression of log-transformed values.
Figure 5—figure supplement 4
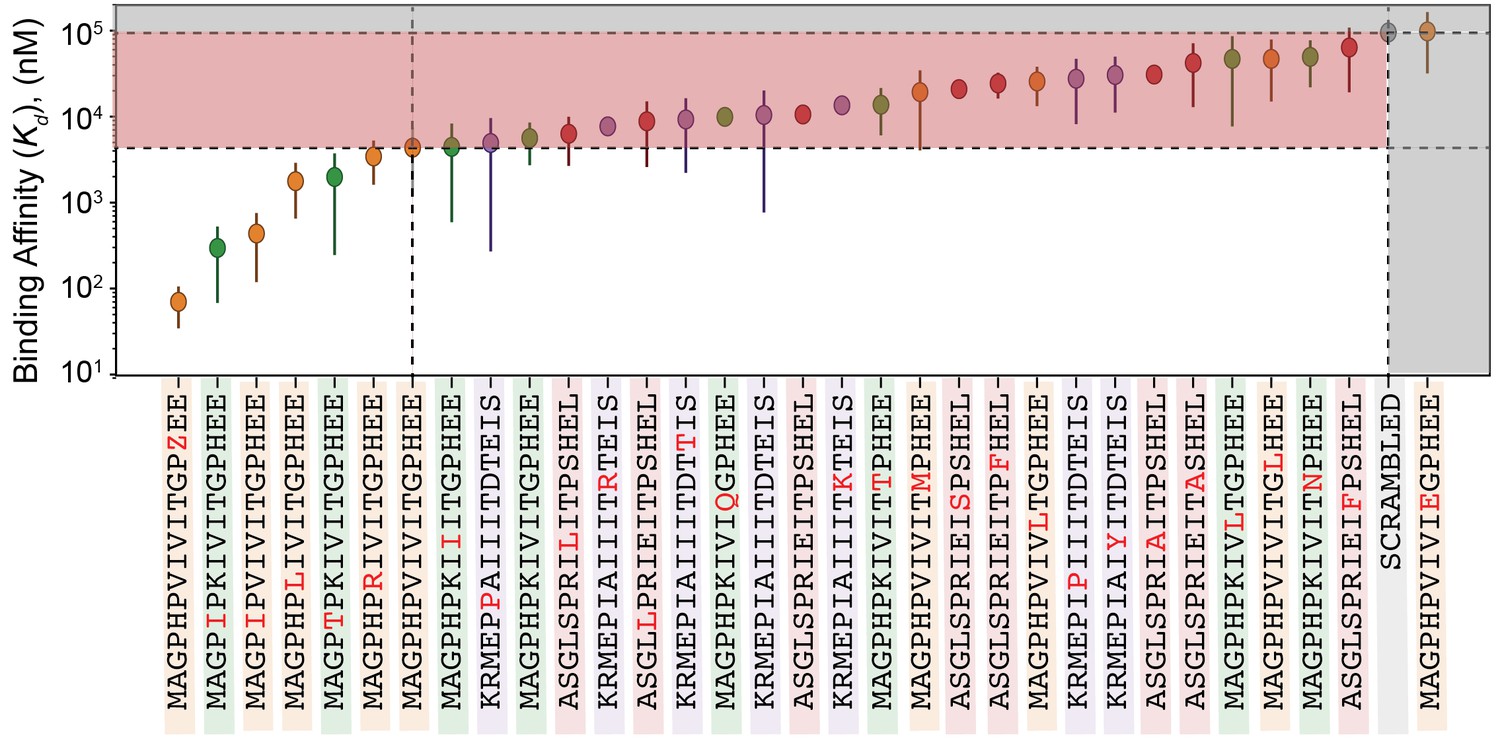
values for all peptides within calibration library.
values for all peptides within calibration library. PVIVIT variants are shown in orange, PKIVIT variants are shown in green, NFATc2 variants are shown in red, and AKAP79 variants are shown in purple. Values are calculated using the average value relative to PVIVIT for two technical replicates (Figure 5—figure supplement 5, Figure 5—figure supplement 6) and the literature. for PVIVIT (0.5 μM).
Figure 5—figure supplement 5
Concentration-dependent binding for full calibration library, replicate 1.
Concentration-dependent binding measurements for selected peptides within the ‘full calibration' library for the first replicate. For each sequence, measured change in binding affinity relative to the PVIVIT sequence was determined by a global fit to a single-site binding model (black line); values were calculating from this and the known literature for PVIVIT (0.5 μM).
Figure 5—figure supplement 6
Concentration-dependent binding for full calibration library, replicate 2.
Concentration-dependent binding measurements for selected peptides within the ‘full calibration' library for the second replicate. For each sequence, measured change in binding affinity relative to the PVIVIT sequence was determined by a global fit to a single-site binding model (black line). values were calculating from this and the known literature for PVIVIT (0.5 μM)..
Figure 5—figure supplement 7

Correlation between measurements for core/flank library measurements and ‘calibration’ library measurements.
Correlation between measurements for core/flank library measurements and ‘calibration’ library measurements. Solid red line shows expected 1:1 linear relationship, dotted grey line shows linear regression of log-transformed values.
Figure 6
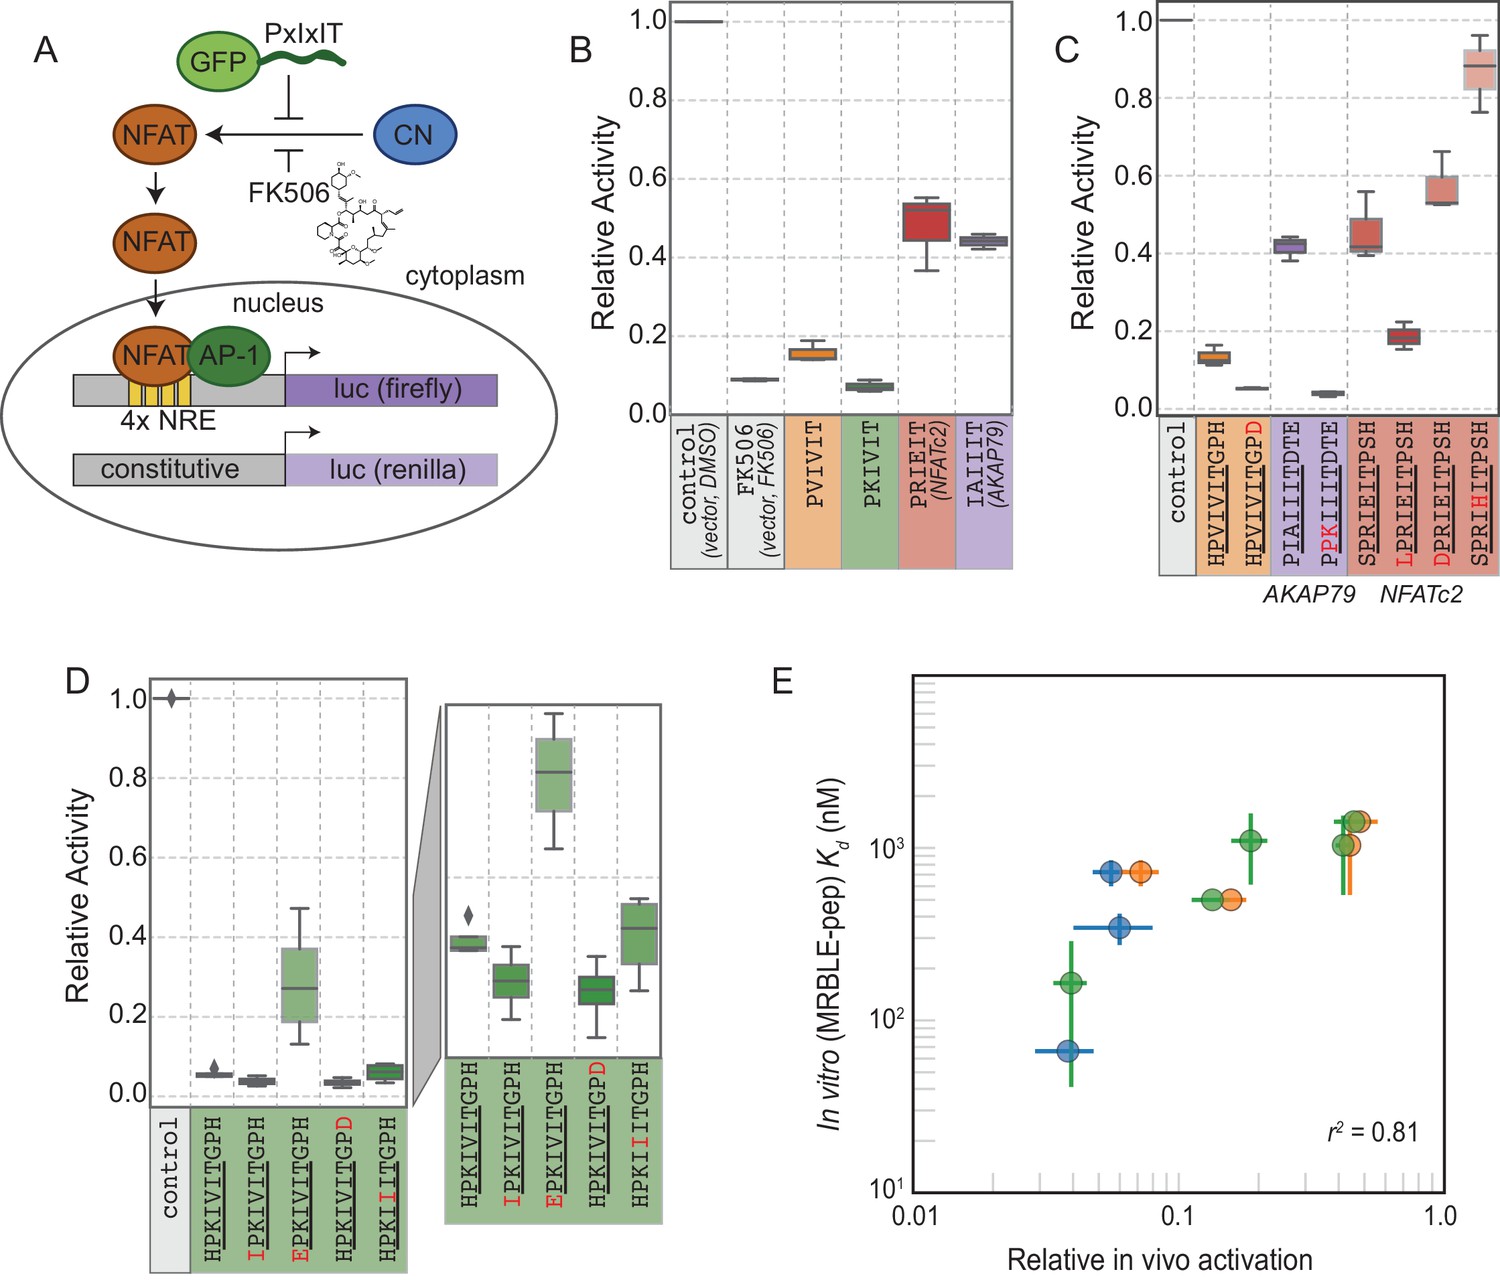
In vivo assays to quantify CN inhibition and an in vitro search for a potent inhibitor.
(A) In vivo experimental assay schematic. (B) Reporter gene inhibition in the presence of an empty eGFP vector (control), an empty eGFP vector with topical application of FK506, and vectors expressing PVIVIT, PKIVIT, NFATc2, and AKAP79 PxIxIT peptides with a C-terminal eGFP tag. (C) Reporter gene inhibition in the presence of various PVIVIT-, AKAP79-, and NFATc2-eGFP variants. (D) Reporter gene inhibition in the presence of various PKIVIT-eGFP variants. (E) In vitro calibrated binding affinities (, nM) plotted against relative in vivo activation for data shown in panels B (orange), C (green), and D (blue).
-
Figure 6—source data 1
Initial in vivo experiment.
- https://doi.org/10.7554/eLife.40499.076
-
Figure 6—source data 2
PKIVIT in vivo experiment.
- https://doi.org/10.7554/eLife.40499.077
-
Figure 6—source data 3
All other peptides in vivo experiment.
- https://doi.org/10.7554/eLife.40499.078
Additional files
-
Supplementary file 1
List of literature affinities and references.
- https://doi.org/10.7554/eLife.40499.079
-
Supplementary file 2
Calculated savings and references vs other techniques.
- https://doi.org/10.7554/eLife.40499.080
-
Transparent reporting form
- https://doi.org/10.7554/eLife.40499.081
Download links
A two-part list of links to download the article, or parts of the article, in various formats.
Downloads (link to download the article as PDF)
Open citations (links to open the citations from this article in various online reference manager services)
Cite this article (links to download the citations from this article in formats compatible with various reference manager tools)
Quantitative mapping of protein-peptide affinity landscapes using spectrally encoded beads
eLife 8:e40499.
https://doi.org/10.7554/eLife.40499


