Rapid changes in morphogen concentration control self-organized patterning in human embryonic stem cells
- Rice University, United States
Figures
Figure 1 with 3 supplements
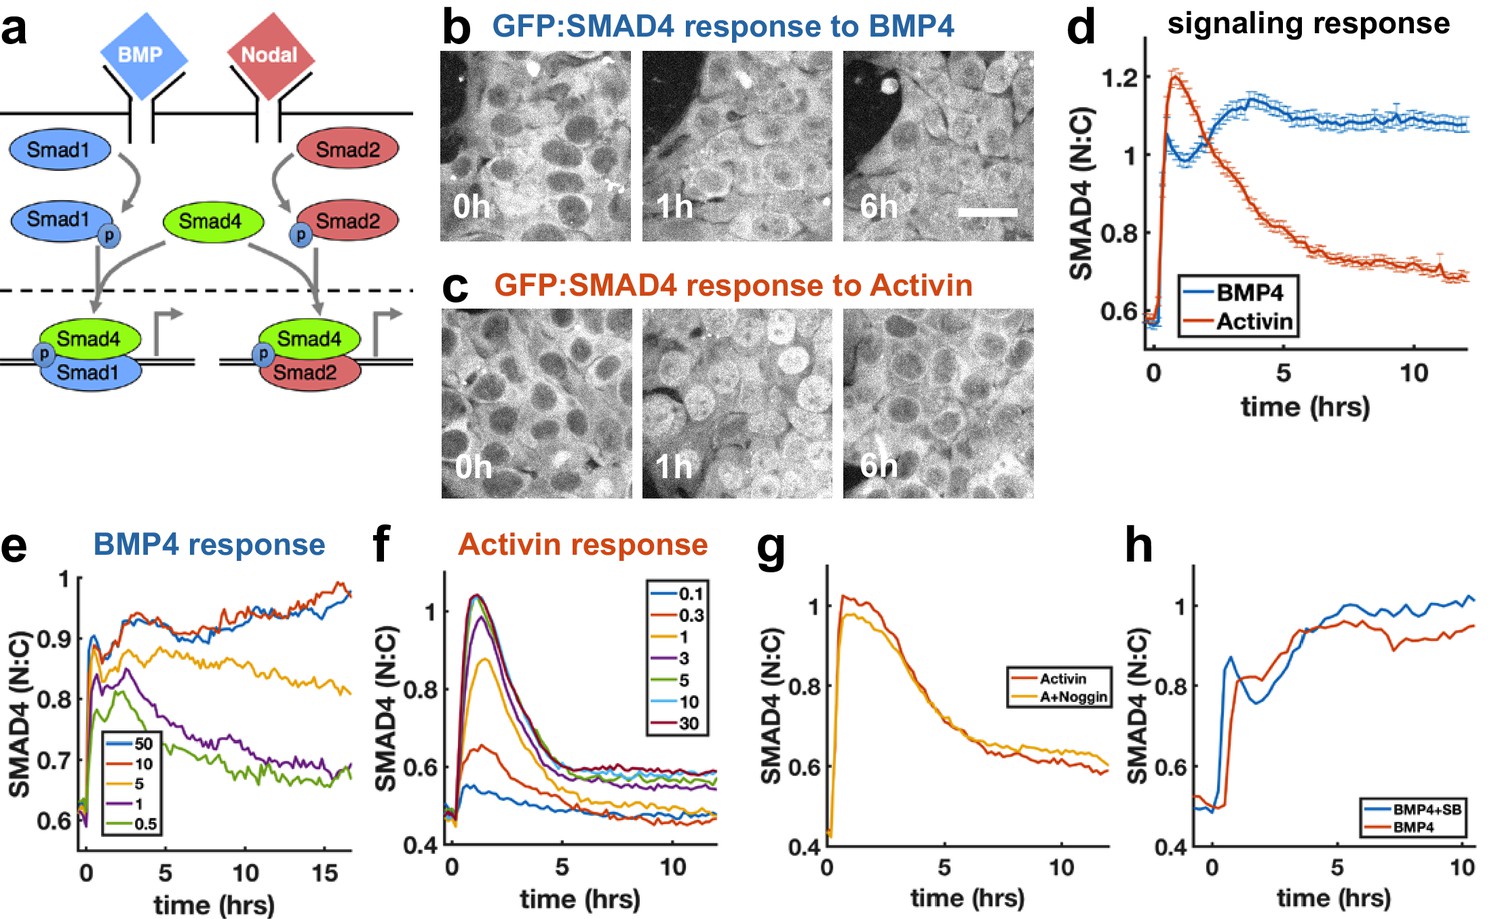
SMAD4 signaling response of hESCs to BMP4 is sustained while that to Activin is adaptive.
(a) BMP and Nodal pathways share the signal transducer Smad4. (b, c) hESCs expressing GFP:SMAD4 at 0, 1 and 6 hr after treatment with BMP4 (b) or Activin (c). Scalebar 30 μm (d) GFP:SMAD4 average nuclear:cytoplasmic intensity ratio after treatment with BMP4 (blue) or Activin (red). Error bars represent standard error. Ncells ~ 700, distributions shown in (Figure 1—figure supplement 1b–c). (e) SMAD4 response to different doses of BMP4 shows decline at low doses with a dose-dependent time scale, suggesting ligand depletion. Doses in graph legend are in ng/ml. (f) SMAD4 signaling response to different doses of Activin shows fixed time scale of adaptation. (g) Quantification of GFP:SMAD4 nuclear to cytoplasmic ratio in response to either Activin alone or together with the BMP inhibitor Noggin (h) Quantification of GFP:SMAD4 nuclear to cytoplasmic ratio in response to either BMP alone or together with the Activin/Nodal inhibitor SB431542.
-
Figure 1—source data 1
MATLAB script and .mat files to reproduce the data panels in Figure 1.
Requires the github repository – idse/stemcells.
- https://doi.org/10.7554/eLife.40526.006
Figure 1—figure supplement 1
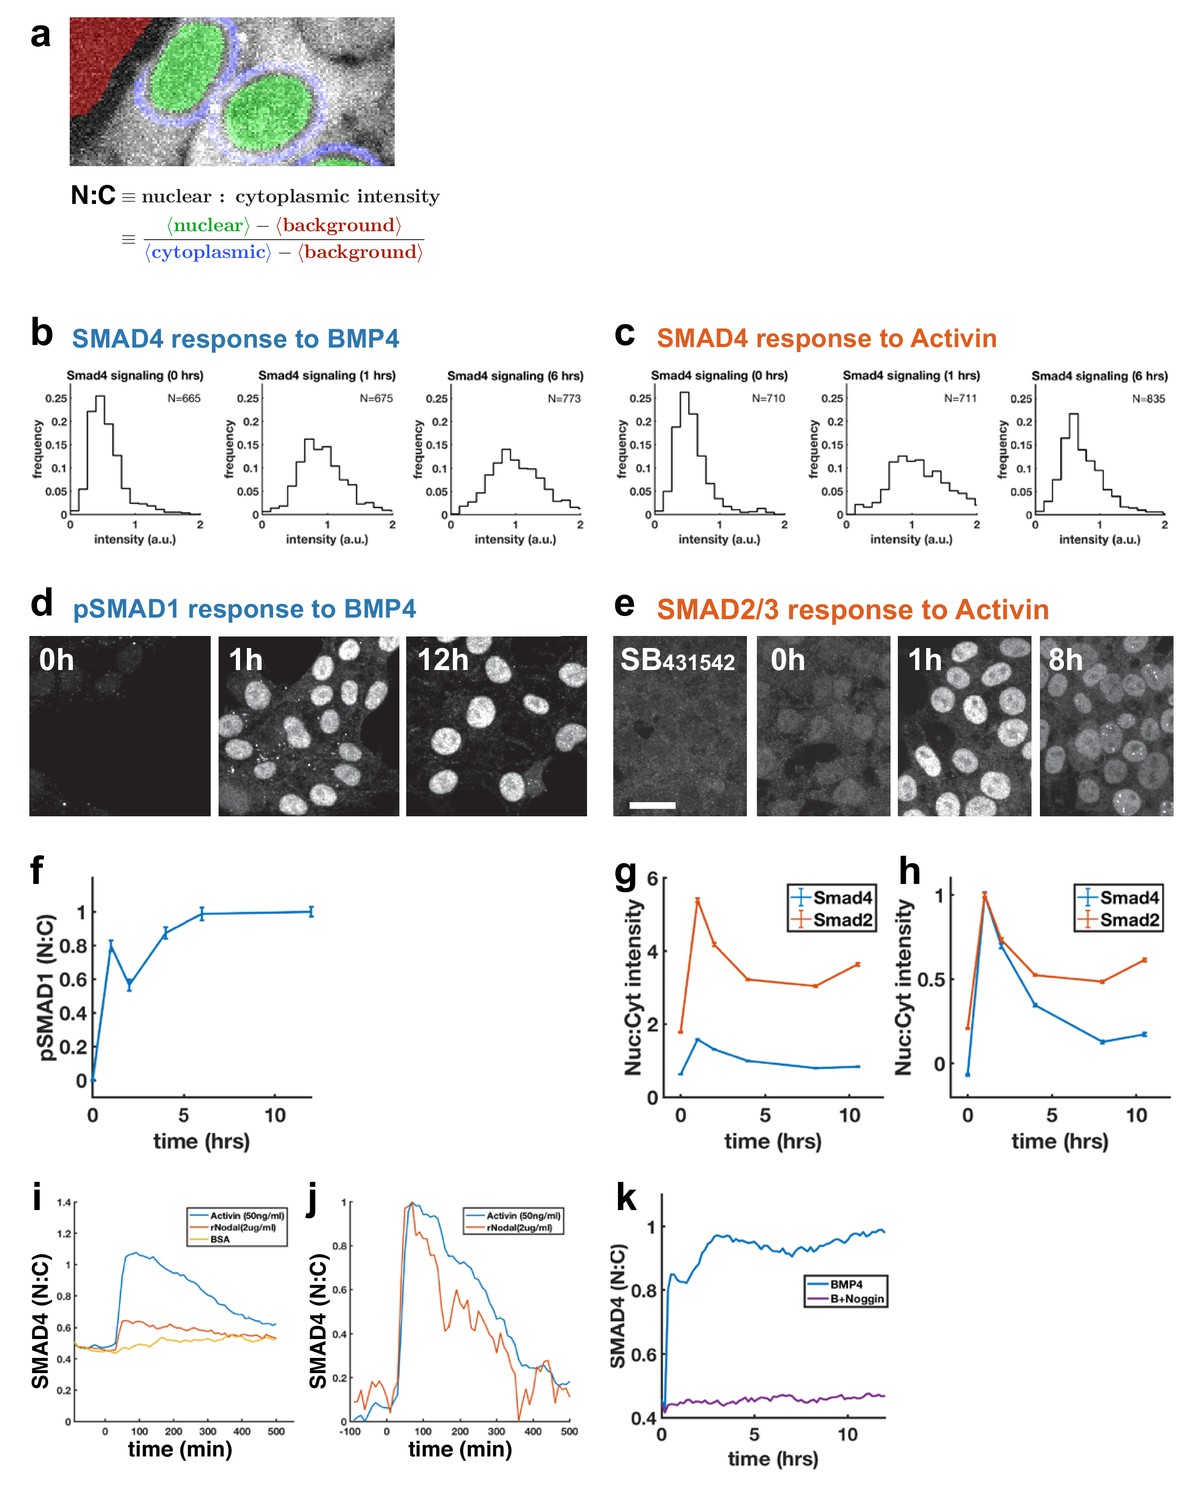
Further characterization of response of hESCs to BMP4 and Activin.
(a) Quantification of SMAD4 signaling as nuclear to cytoplasmic intensity ratio using automated segmentation of the nuclei. For SMAD4 and SMAD2, signaling strength is measured by the nuclear to cytoplasmic intensity ratio. (b) Distribution of SMAD4 response to BMP4 at 0, 1, and 6 hr after treatment. (c) Distribution of SMAD4 response to Activin at 0, 1, and 6 hr. (d, e) Time courses of pSMAD1 (d) and SMAD2 (e) determined by immunofluorescence. Scalebar 25 μm. (f) Quantification of pSmad1 time course. (g) Quantification of SMAD2 and SMAD4 nuclear signaling (nuclear to cytoplasmic ratio). Error bars represent standard error. Ncells per time point ~103. (h) same data as (g) normalized so that the mean in SB431542 treated cells is zero and peak signaling is 1. The level of SMAD2 intensity at time 0 indicates baseline signaling which is repressed by SB431542.(i) Comparison of the response of GFP:SMAD4 to either Activin or Nodal. (j) Same data as in the (i) except that the baseline from the control BSA only condition was subtracted from each curve and each was then normalized to its maximum value. (k) Control for Figure 1g showing complete inhibition of response to 50 ng/ml BMP4 by 500 ng/ml Noggin.
Figure 1—video 1
SMAD4 signaling response to BMP4 treatment is sustained.
Left panel: hESCs with GFP:SMAD4 in the endogenous locus show sustained SMAD4 signaling in response to BMP4. Right panel: Graph showing the mean nuclear to cytoplasmic ratio over time. Thick line represents average over cells from four colonies. Thin lines represent means of individual colonies.
Figure 1—video 2
SMAD4 signaling response to Activin treatment is adaptive.
Left panel: adaptive SMAD4 signaling in response to Activin. Right panel: Graph showing the mean nuclear to cytoplasmic ratio over time.
Figure 2
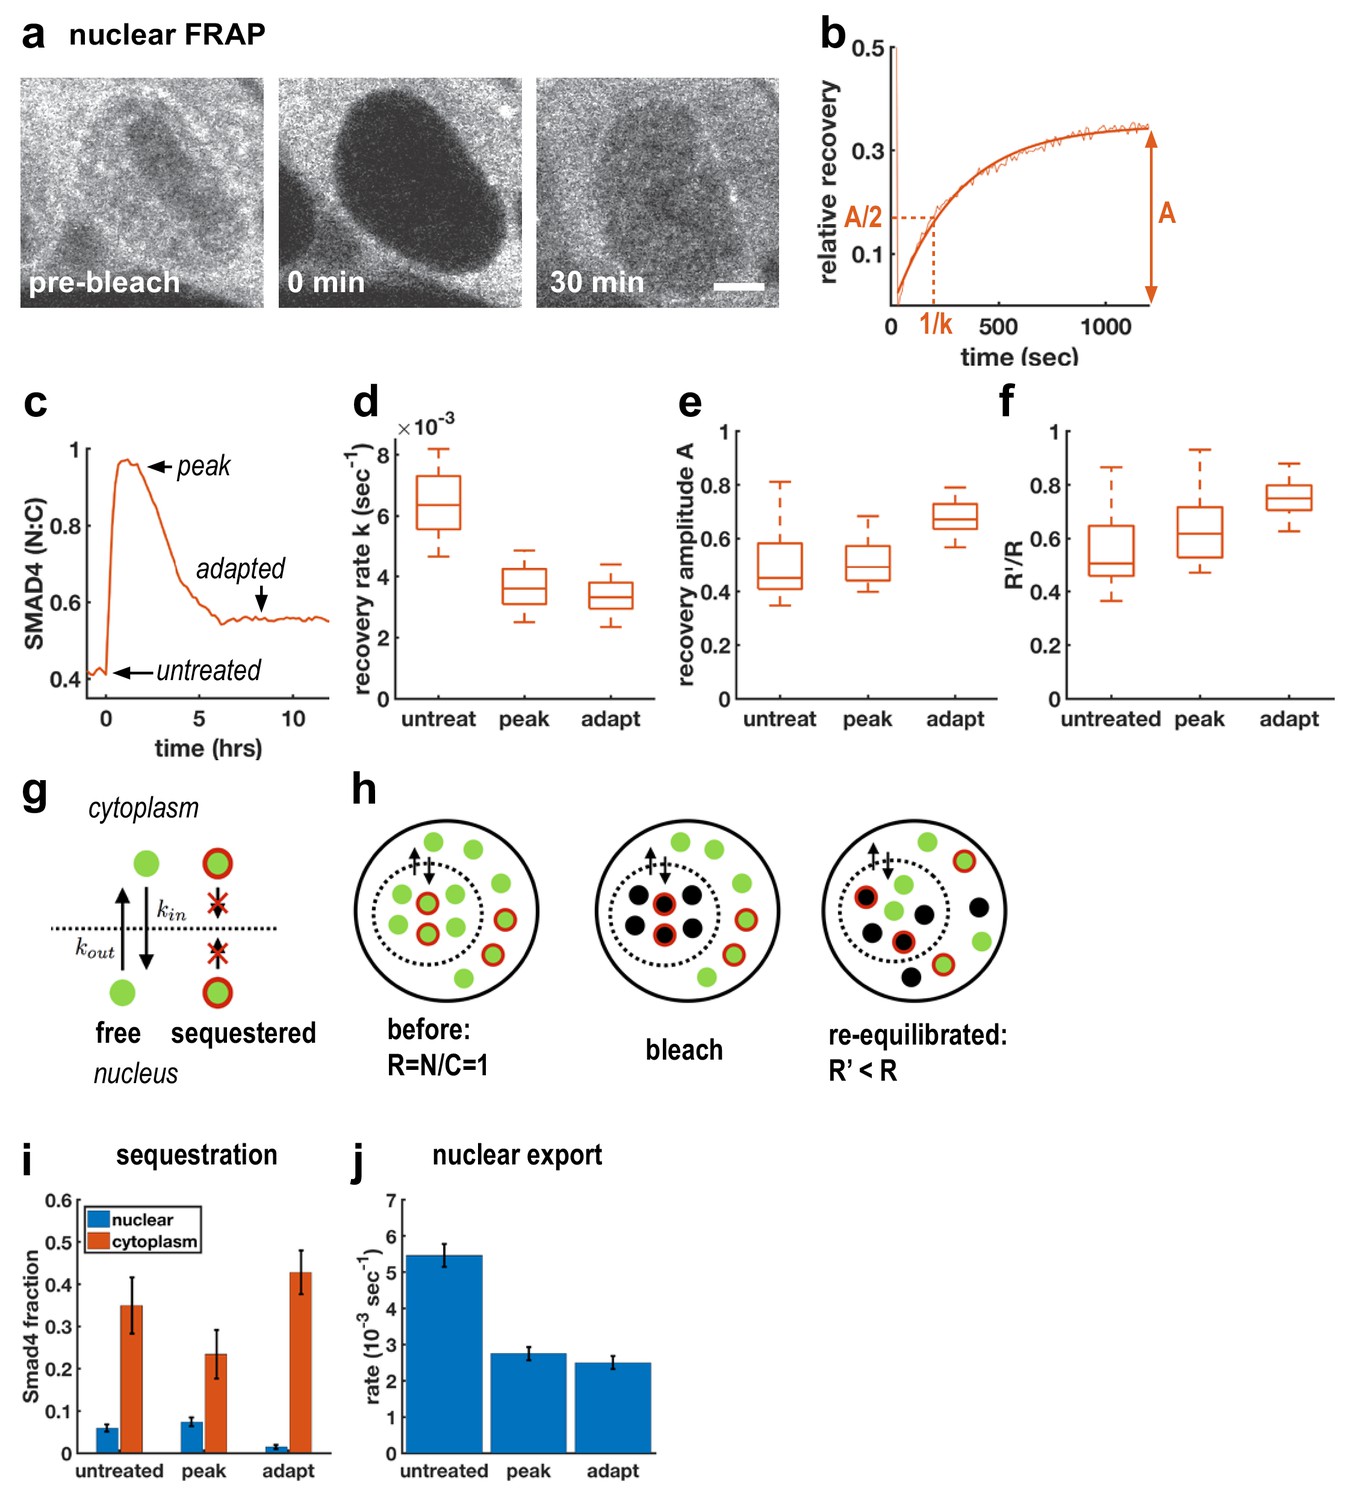
Adaptive Activin response is not a return to the pre-stimulus state and is explained by a model that includes sequestered SMAD4 populations.
(a) Photobleaching and recovery of nuclear Smad4 at 2 hr after Activin treatment. Scalebar 5 μm. (b) Exponential fit to recovery of nuclear fluorescence after bleaching yields amplitude A and recovery rate k. Intensity drop at t = 0 shows bleaching event. (c) Photobleaching was performed on untreated cells, at the peak response to Activin, and after adaptation. (d) Boxplot of distribution of recovery rates. Recovery rates at peak signaling and after adaptation are significantly smaller than for untreated cells (t-test p < 10−6), the difference in recovery rate between peak signaling and adapted state is not significant. N > 12 cells for each FRAP condition. (e) Boxplot of distribution of recovery amplitudes. (f) Nuclear to cytoplasmic intensity ratio after bleaching (R’) is systematically smaller than nuclear to cytoplasmic intensity ratio before bleaching (R). (g) Cartoon of mathematical model for Smad4 localization, with sequestered populations of Smad4 that are confined to either nucleus or cytoplasm, and free Smad4 shuttling with import/export rates kin/kout. (h) Cartoon demonstrating that this model explains results in (f). (i) Changes in Smad4 sequestration in nucleus (blue) and cytoplasm (red) determined through model fitting. Error bars in i and j represent error propagation of standard errors in measured parameters over N > 12 cells as described in Appendix 1. (j) Nuclear export rates, which given the fixed nuclear import rate of the model directly reflect the measured exchange rates k.
-
Figure 2—source data 1
MATLAB script and .mat files to reproduce the data panels in Figure 2.
Requires the github repository – idse/stemcells.
- https://doi.org/10.7554/eLife.40526.008
Figure 3 with 1 supplement
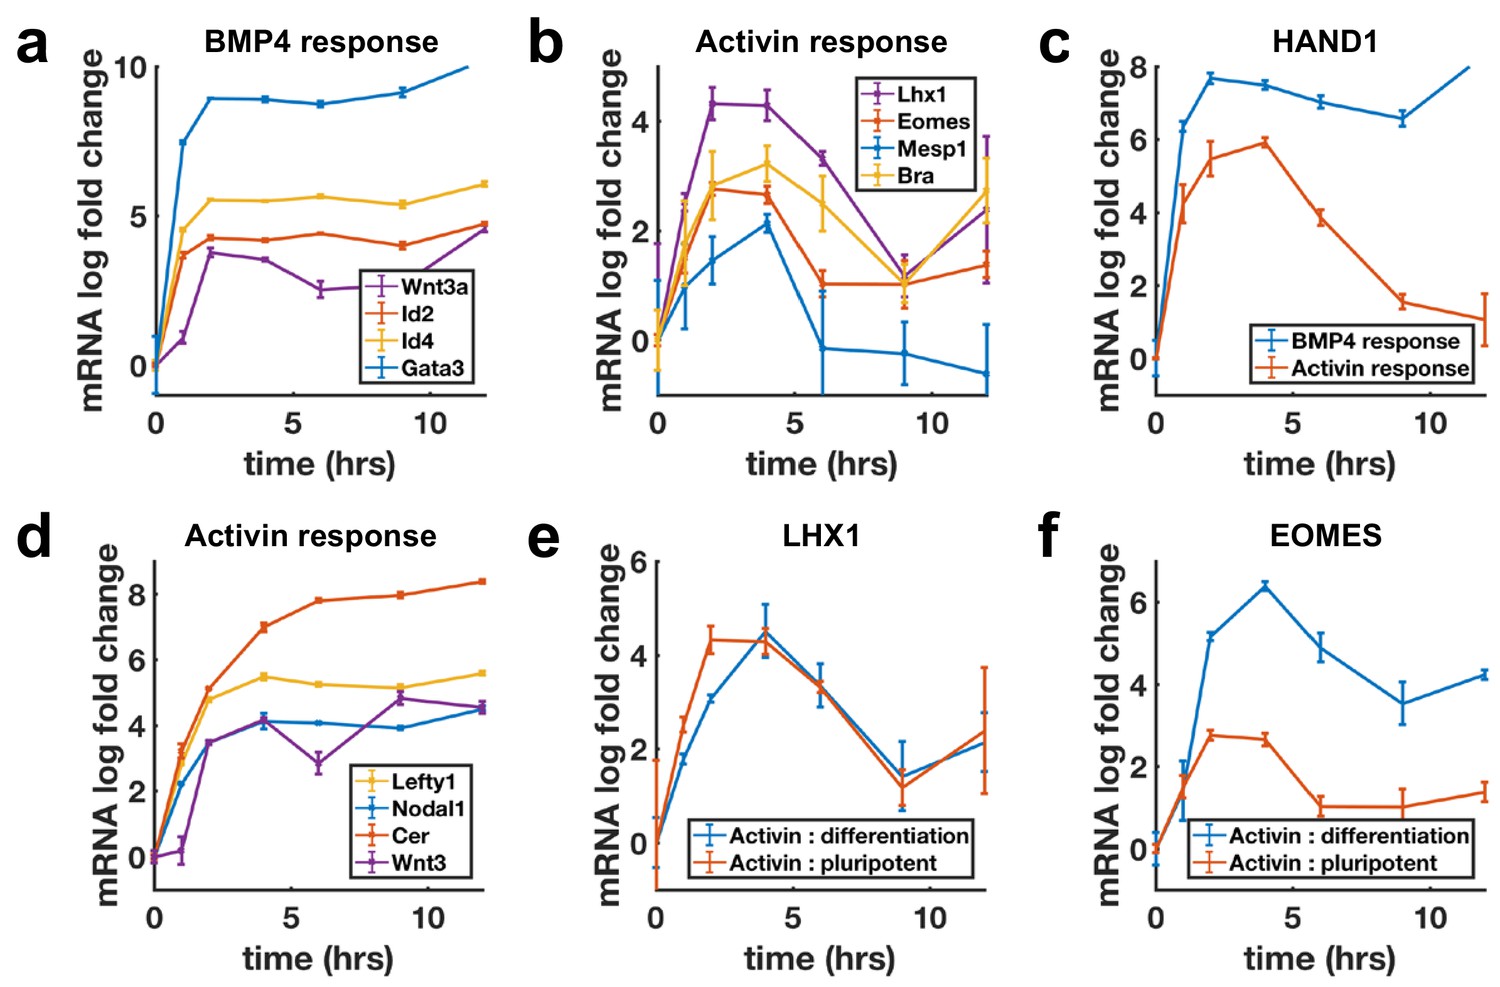
Transcription of BMP targets and Nodal differentiation targets reflects SMAD4 dynamics, while other Nodal targets show sustained transcription.
(a, b) qPCR measurements of transcriptional response to BMP4 treatment (a) and of differentiation targets to Activin (b) y-axes show relative CT values. (c) Transcription of the shared Activin/BMP4 target HAND1 after BMP4 (blue) or Activin (red) treatment. (d) Non-adaptive response to Activin of ligands and inhibitors involved in initiating the primitive streak. (e) Transcriptional response to Activin under pluripotency maintaining conditions (red) and mesendoderm differentiation conditions (blue) of Activin target LHX1 (e) and joint Activin/Wnt target EOMES (f). Error bars represent standard deviations over three replicates. Logarithms are base 2.
-
Figure 3—source data 1
MATLAB script and .mat files to reproduce the data panels in Figure 3.
Requires the github repository – idse/stemcells.
- https://doi.org/10.7554/eLife.40526.011
Figure 3—figure supplement 1
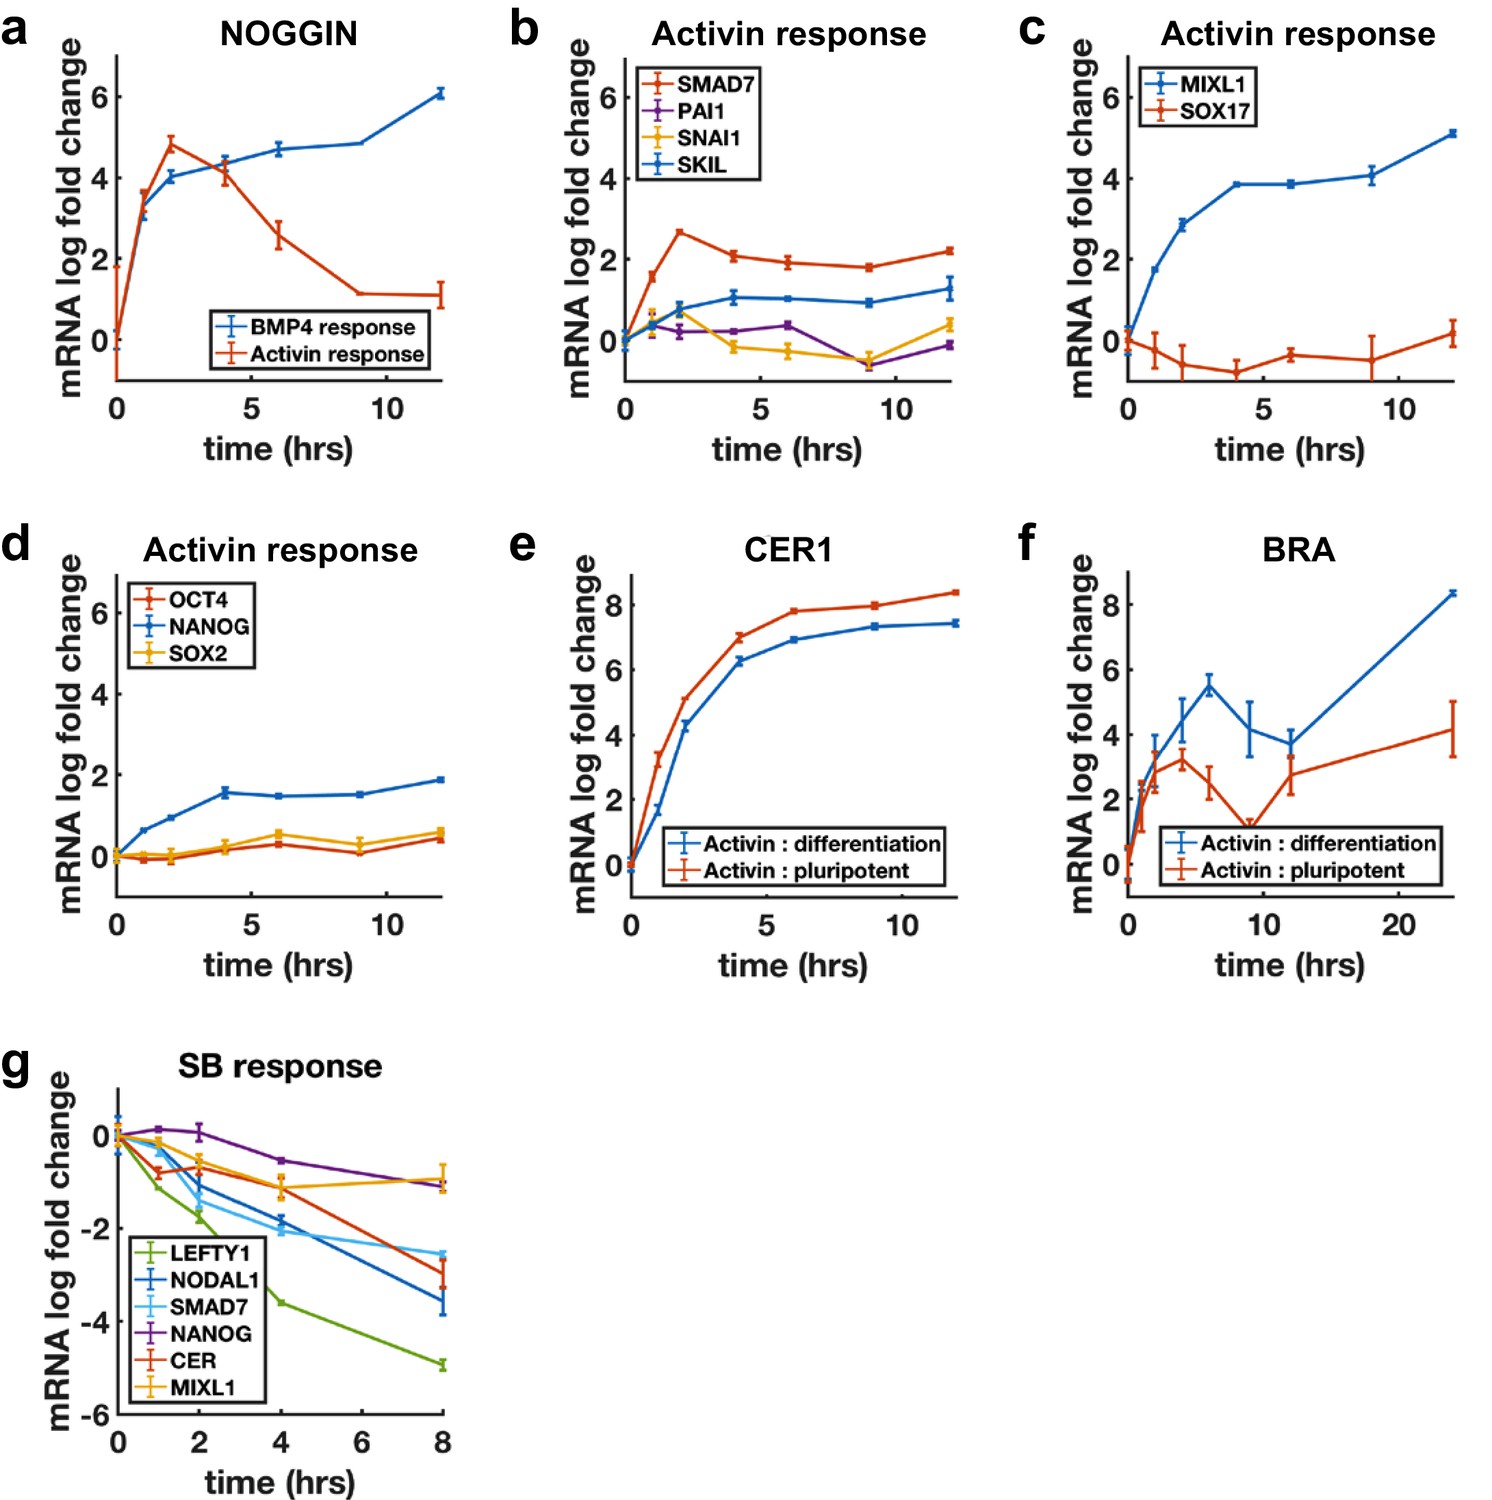
Additional qPCR data.
(a) Transcriptional response of NOGGIN to BMP4 (blue) and Activin (red) follows SMAD4 dynamics of respective pathways. (b-d) Genes in several functional classes show non-adaptive transcriptional response to Activin. (b) Non-cell fate related (TGF-β targets). (c) Differentiation genes, MIXL1 is an exception and responds non-adaptively to Activin, SOX17 does not respond in the pluripotent state. (d) Pluripotency genes. (e) CER1 is a non-adaptive target of Activin that behaves identically under under pluripotency (+FGF) and differentiation (+Wnt) conditions. (f) Like EOMES, BRA response is enhanced under differentiation conditions but the dynamics are qualitatively similar. (g) Decline in expression levels after SB treatment in mTeSR medium shows mRNA half lives of 1–4 hr.
Figure 4 with 1 supplement
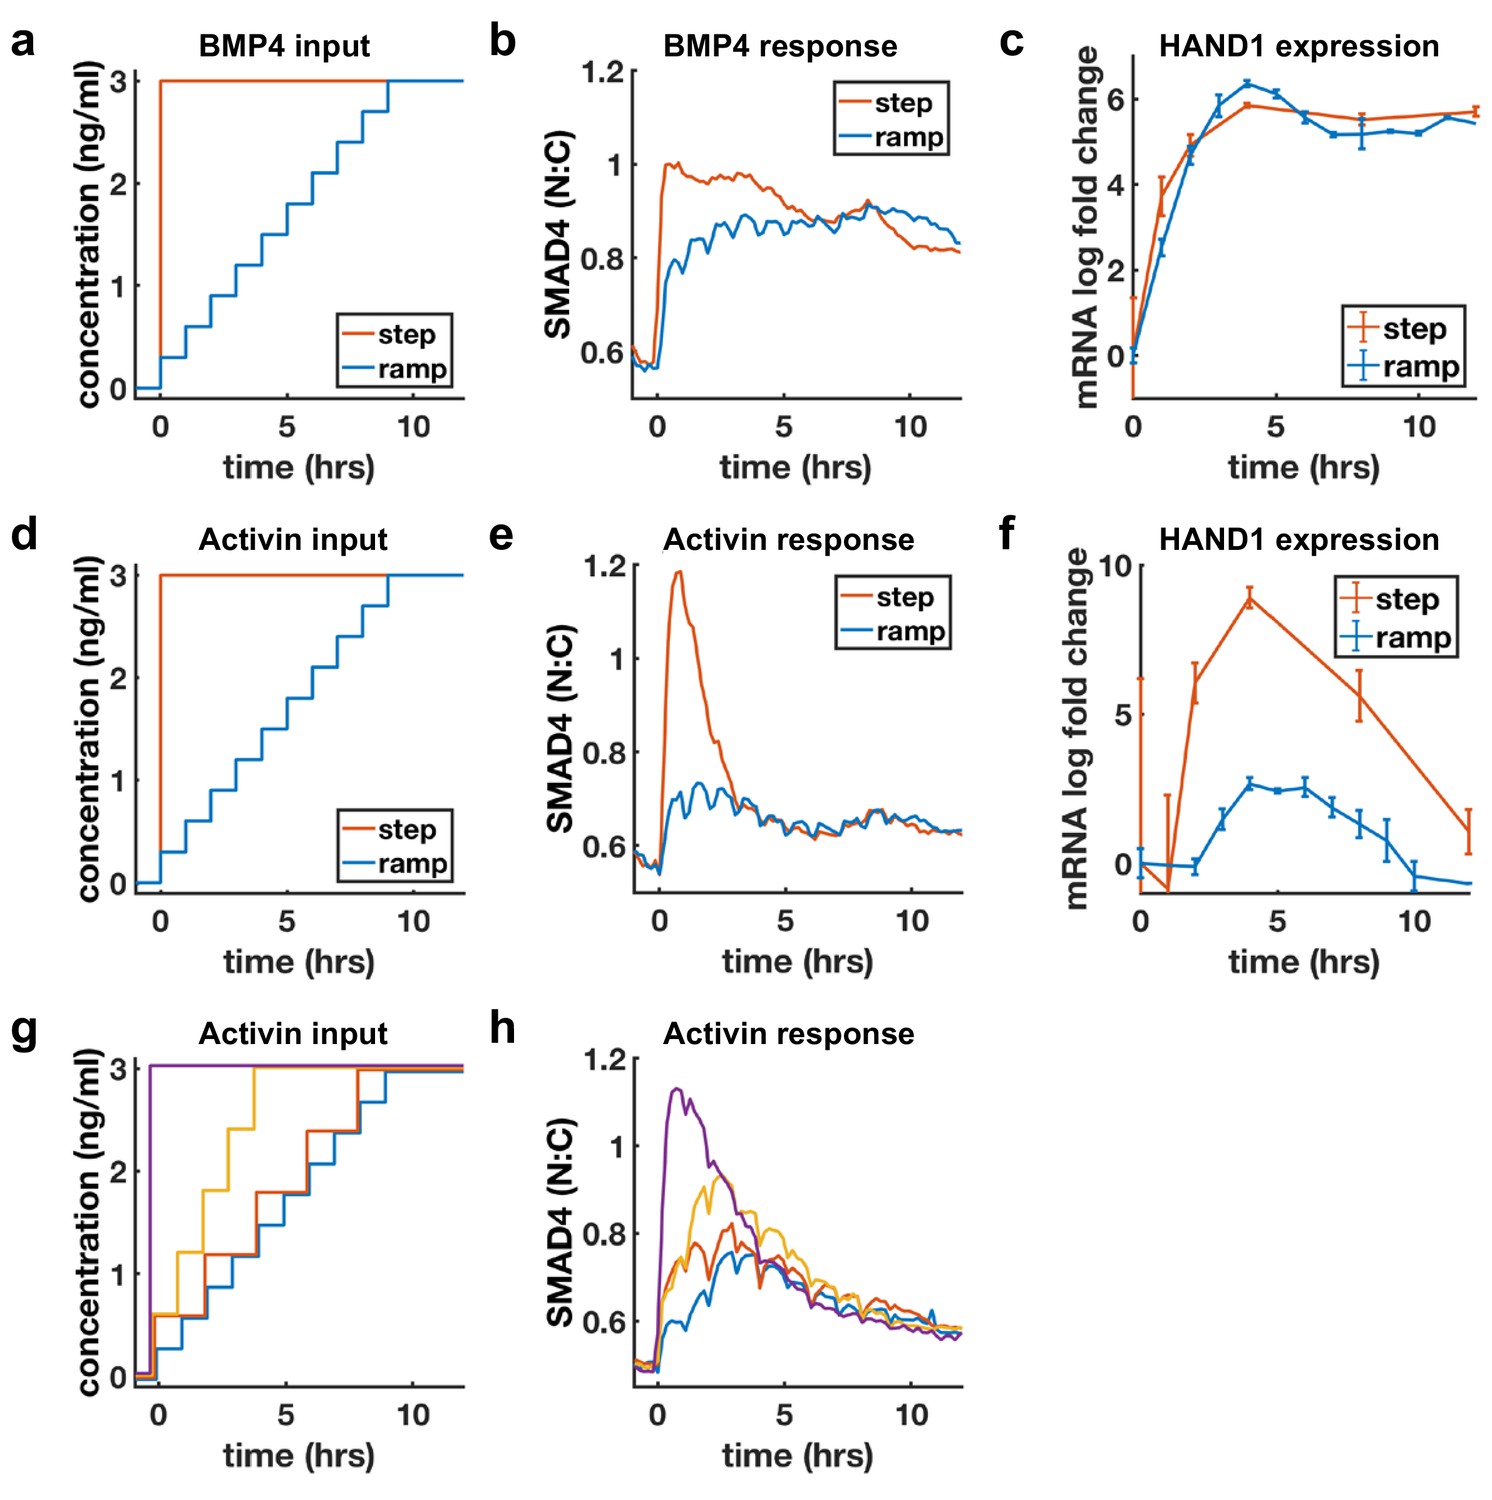
BMP4 response reflects concentration, but Activin response reflects rate of concentration increase.
(a, d) Ligand concentration over time for slow ramp (blue) or sudden step (red) in BMP4 (a) or Activin (d). (b, e) SMAD4 signaling response to BMP4 (b) or Activin (e). (c, f) Transcriptional response of HAND1 to concentration ramp versus step for BMP4 (c) or Activin (f). Error bars in qRT-PCR data (c, f) represent standard deviations over three replicates. (g, h) Activin response to different ramp rates and step sizes. In (b, e, h) small hourly wiggles are artifacts of performing media changes and do not reflect actual signaling responses.
-
Figure 4—source data 1
MATLAB script and .mat files to reproduce the data panels in Figure 4.
Requires the github repository – idse/stemcells.
- https://doi.org/10.7554/eLife.40526.014
Figure 4—figure supplement 1
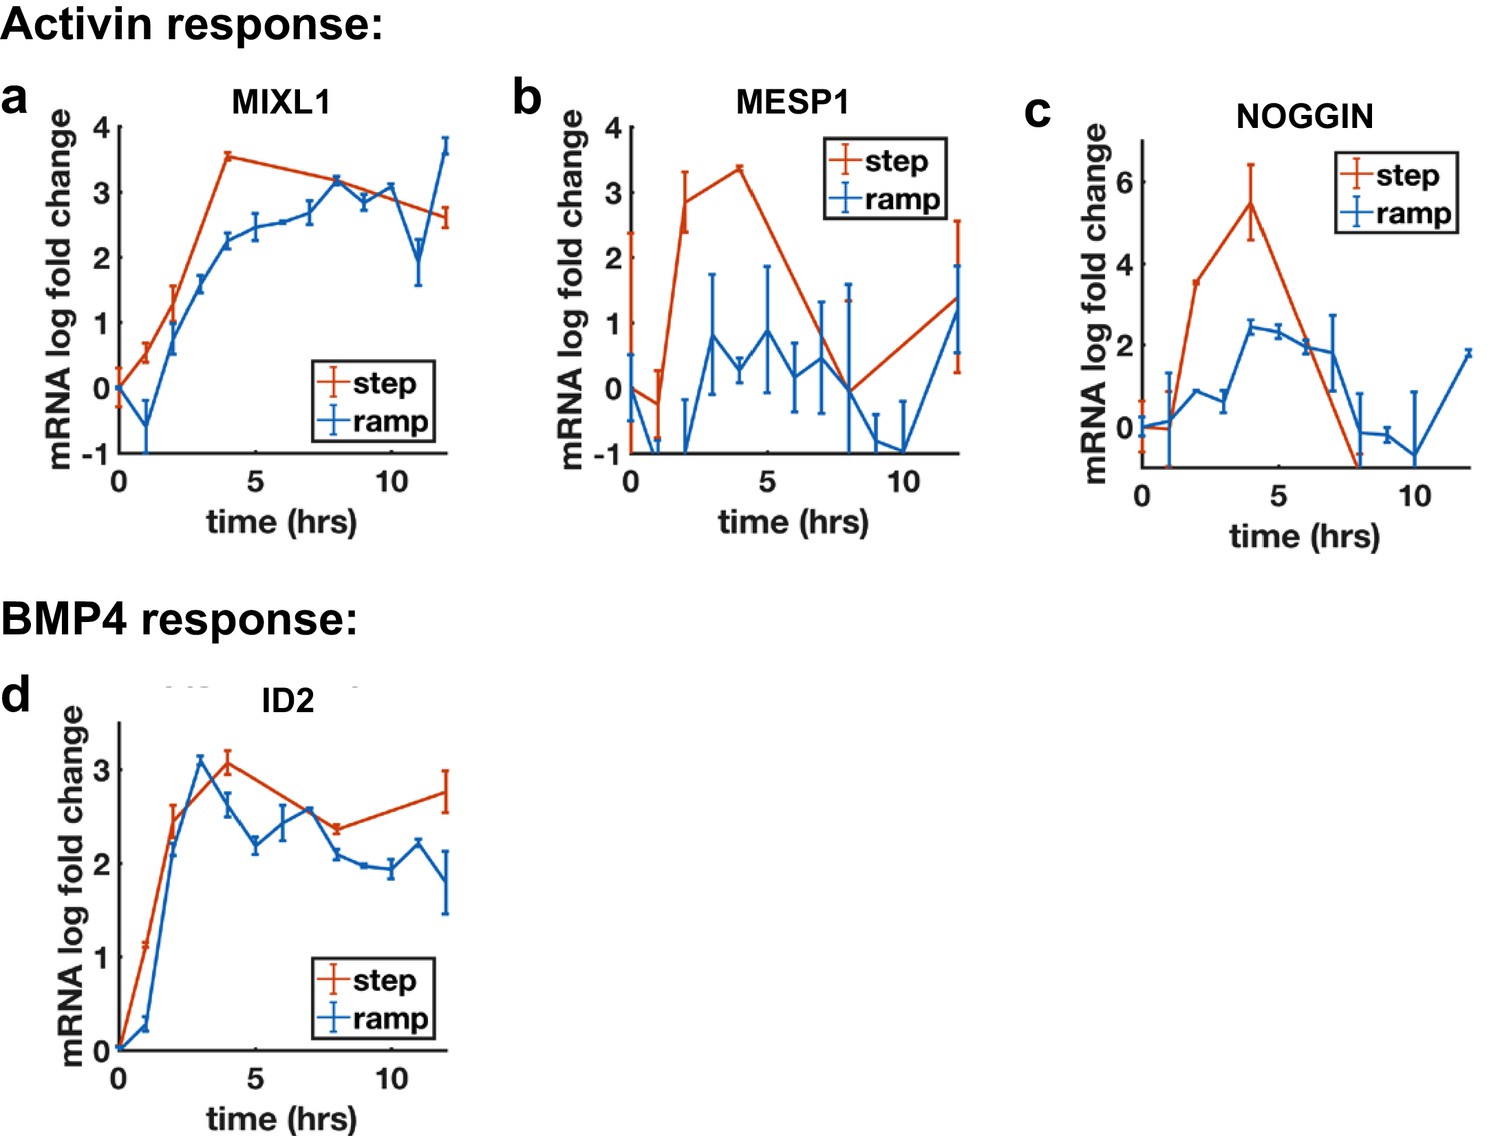
Additional qPCR ramp data.
(a) Transcription of MIXL1, a non-adaptive Activin target reaches the same levels after Activin ramp and step. (b, c) Transcriptional response of MESP1 (b) and NOG (c) to Activin ramp and step shows reduced transcription for ramp. (d) Transcriptional response of ID2 to BMP4 ramp and step.
Figure 5 with 1 supplement
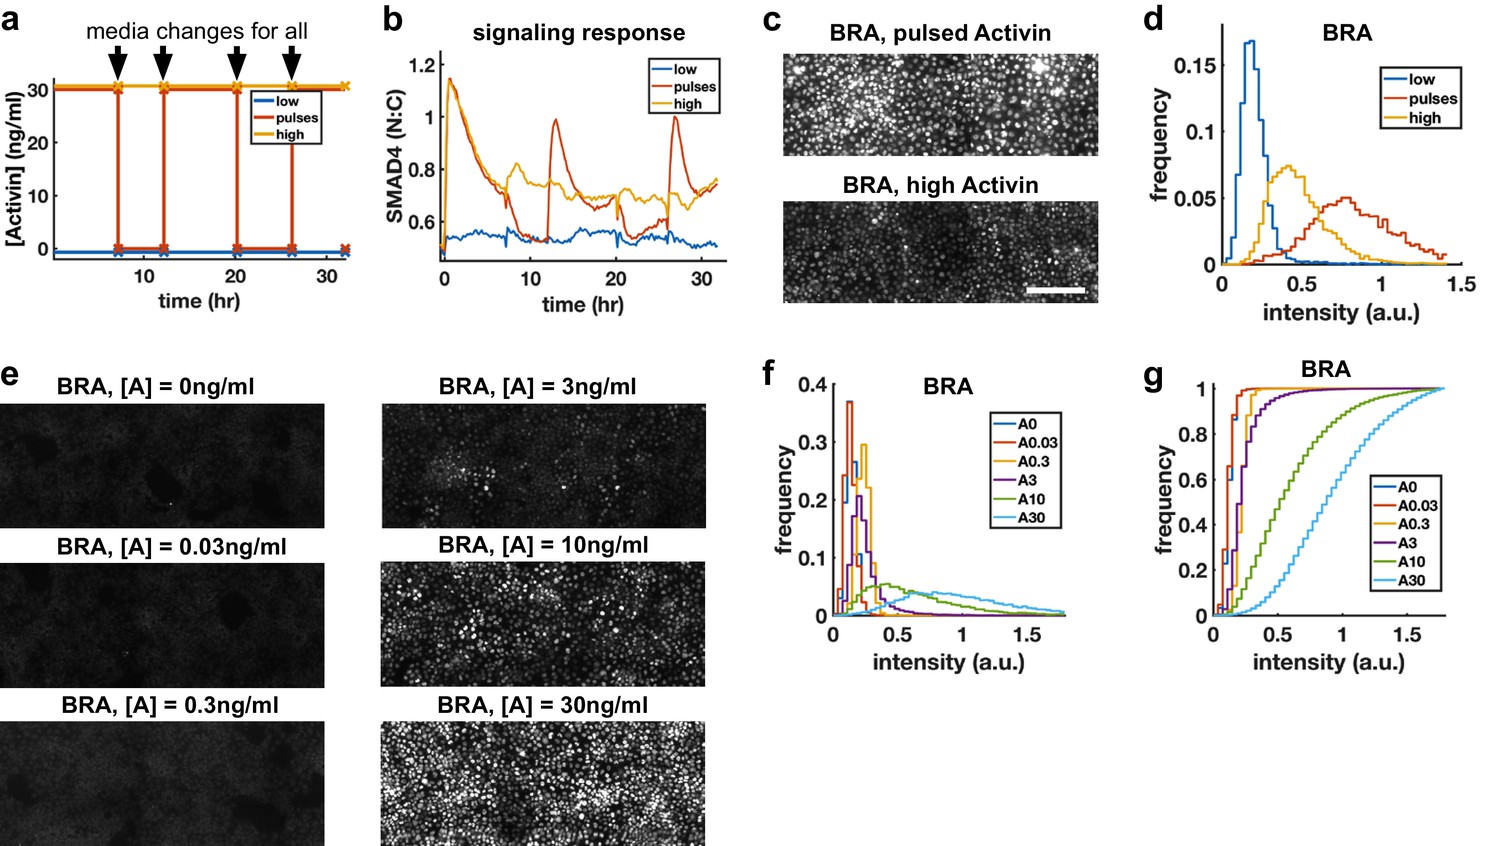
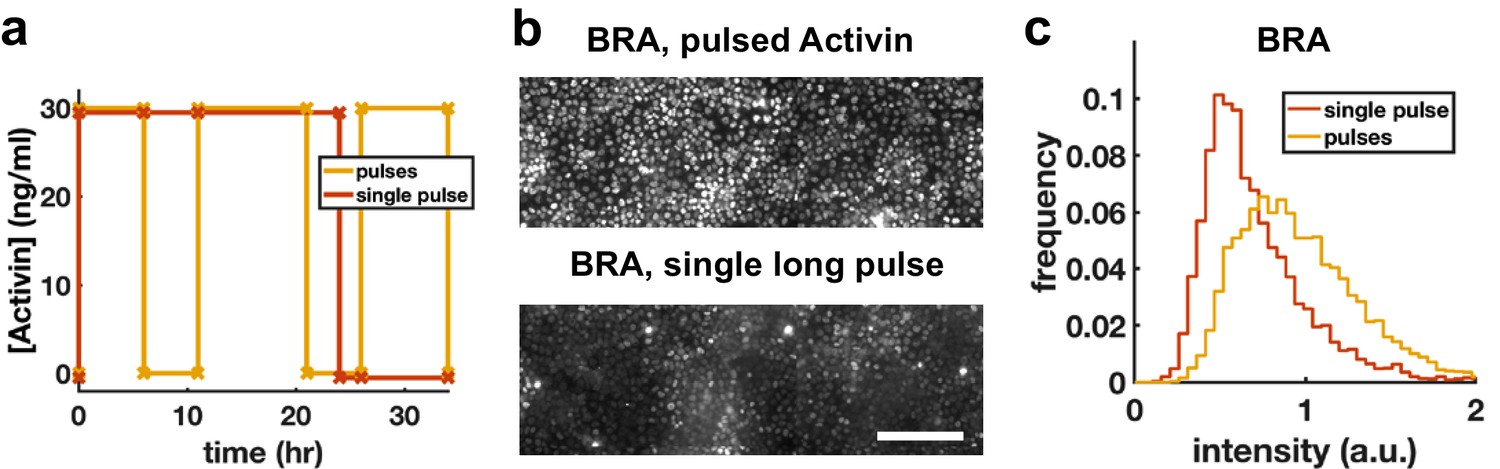
Repeated rapid increases in Activin/Nodal enhance differentiation to primitive streak fate.
(a) Schematic of pulse experiment, graph shows ligand concentration, controls receive media changes at the same time as the pulsed well. (b) SMAD4 signaling profile in response to Activin pulses (red), high Activin (yellow), and no Activin (blue). (c) Immunofluorescence staining for BRA after high constant Activin or pulsed Activin. Scalebar 100 μm. (d) Distribution of BRA expression per cell (Ncells per condition ~6 × 10³) determined from immunofluorescent images (c). (e, f, g) Dose response series showing BRA expression monotonically increases with Activin dose, and therefore the effect of pulses is not due to reduced average Activin exposure. (e) Immunofluorescence staining for BRA after 34 hr differentiation with different doses of Activin. (f) Distributions of BRA intensity per cell in the images containing (d). (g) Cumulative distributions of BRA intensity.
-
Figure 5—source data 1
MATLAB script and .mat files to reproduce the data panels in Figure 5.
Requires the github repository – idse/stemcells.
- https://doi.org/10.7554/eLife.40526.017
Figure 5—figure supplement 1
Increased BRA expression after pulsing is not due to reduced integrated exposure.
(a-c) Comparison of BRA expression in hESCs exposed to either three short pulses of high Activin concentration or to a single pulse with same total duration, demonstrating that the effect of pulses is not simply due to reduced overall time in Activin. (a) Schematic of the protocol. (b) Immunofluorescence stainings for BRA. Scalebar 100 μm. (c) Quantification of the distribution of BRA intensities in single cells (Ncells per condition ~6 × 10³).
Figure 6 with 1 supplement

Rapid changes in endogenous Nodal signaling occur during self-organized patterning.
(a) Average radial profile of SMAD4 signaling over time (kymograph) in micropatterned colonies after BMP4 treatment (N = 4 colonies). (b) SMAD4 signaling in single colony at 40 hr. (c) Radial SMAD4 signaling profiles at discrete times from 20 hr to 40 hr. (d) Immunofluorescence staining 40 hr after BMP4 treatment for pSMAD1, SMAD2/3 and BRA. (e, f, g) Normalized radial profiles of SMAD2/3 (e) pSMAD1 (f) and BRA (g) averaged over N > 5 colonies per time. (h) Half-maximum versus time for SMAD2/3 (blue), SMAD4 (purple) and pSMAD1 (red) and BRA expression domain defined by a threshold of at least 20% of maximal expression (yellow). In all panels, error bars represent standard deviations taken over different colonies.
-
Figure 6—source data 1
MATLAB script and .mat files to reproduce the data panels in Figure 6a–c.
Requires Figure 6—source data 2 and the github repository – idse/stemcells.
- https://doi.org/10.7554/eLife.40526.020
-
Figure 6—source data 2
Additional data for Figure 6—source data 1.
- https://doi.org/10.7554/eLife.40526.021
-
Figure 6—source data 3
MATLAB script and .mat files to reproduce the data panels in Figure 6e–h.
Requires the github repository – idse/stemcells.
- https://doi.org/10.7554/eLife.40526.022
Figure 6—video 1
SMAD4 signaling in a micropatterned colony reveals Nodal signaling wave.
Shown is a 700 micron diameter colony for 42 hr.
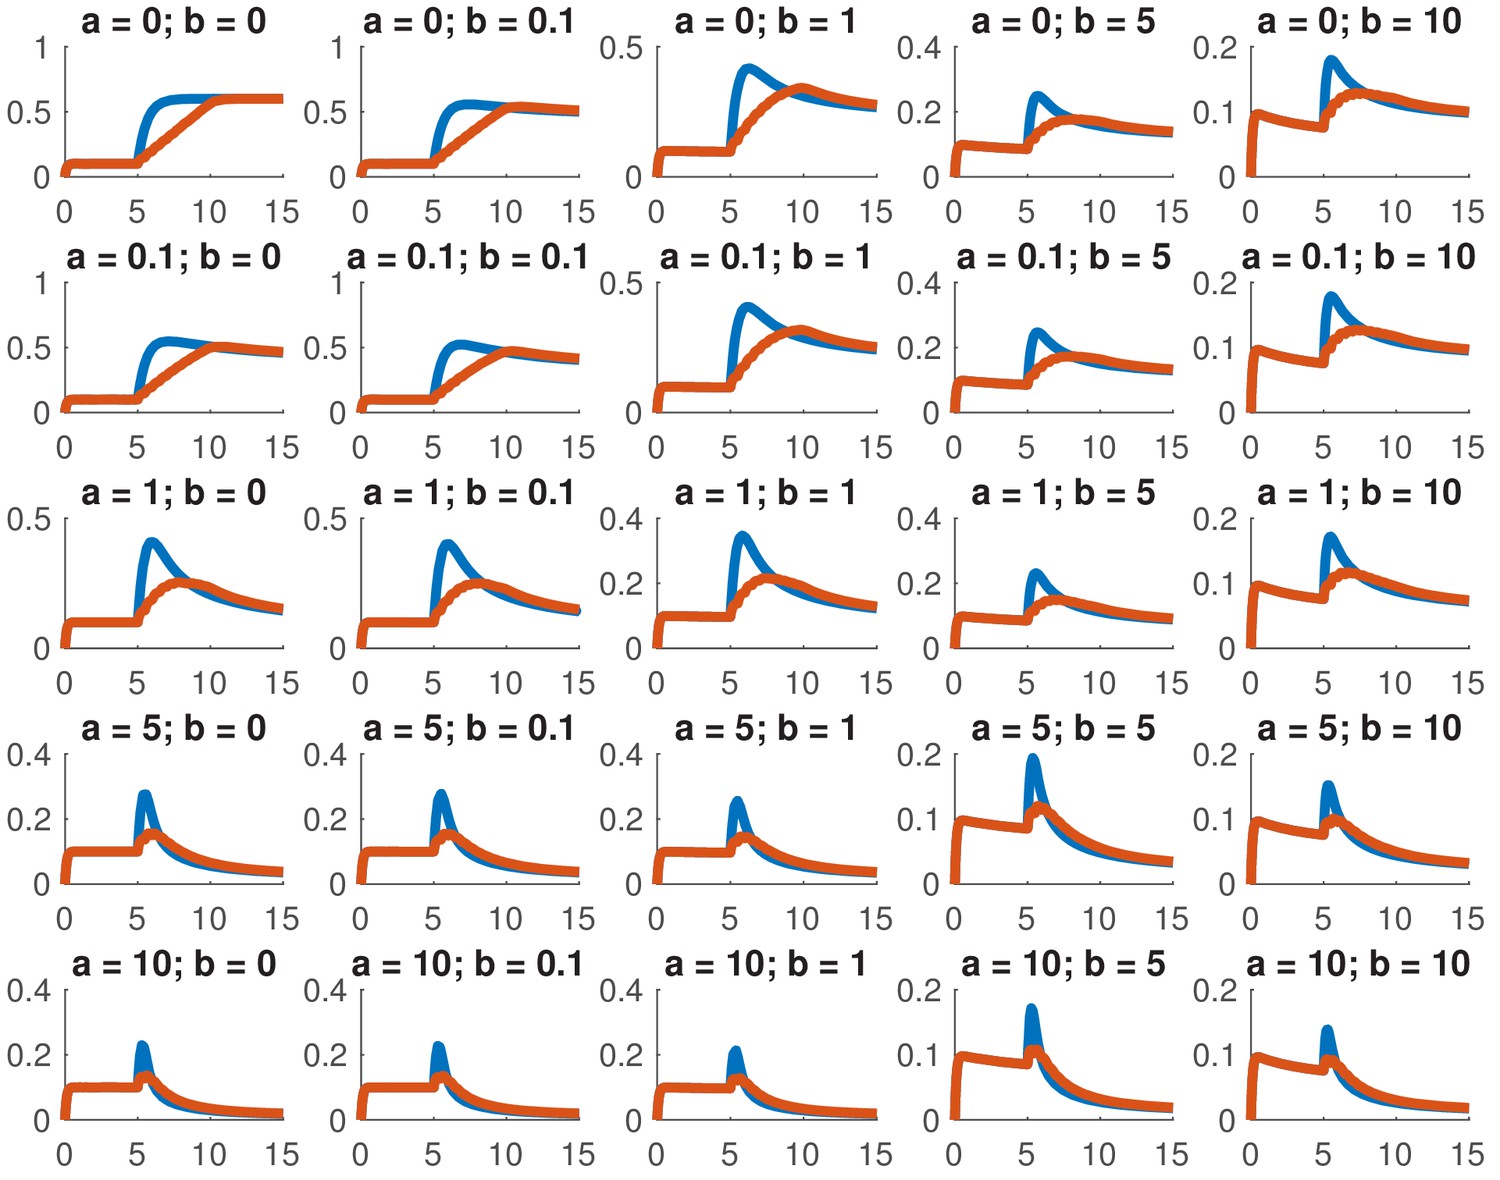
Appendix 1—figure 1
Simulated dose responses for the indicated values of and .
The x-axis indicates time and the y-axis nuclear Smad4, both are in arbitrary units. The values of used were 0, 0.5, 1, 2, 5, and 10. The values of the other parameters are , , , .
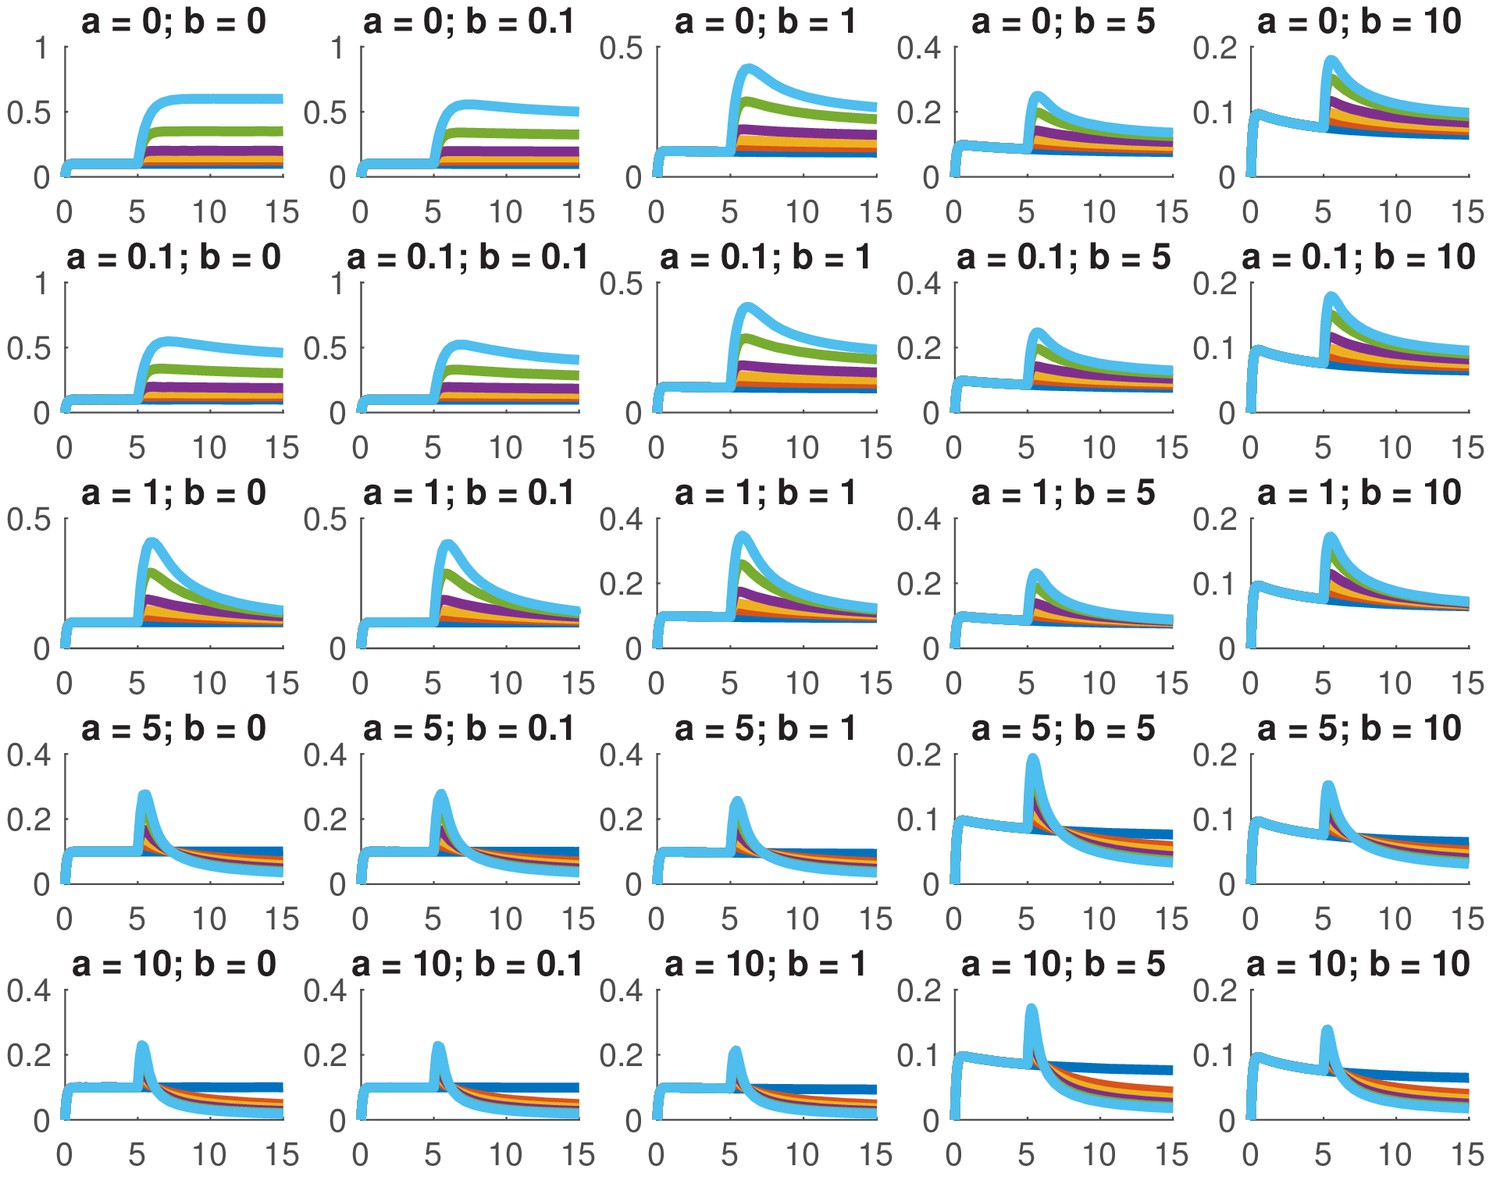
Appendix 1—figure 2
Simulated step and ramp responses for the indicated values of and .
Blue lines indicate a step increase in ligand to while red lines indicate a ramp where the same level was achieved in 10 steps which were spaced by 0.5 time units each. The x-axis indicates time and the y-axis nuclear Smad4, both are in arbitrary units Other parameters are the same as in Appendix 1—figure 1.
Appendix 1—figure 3
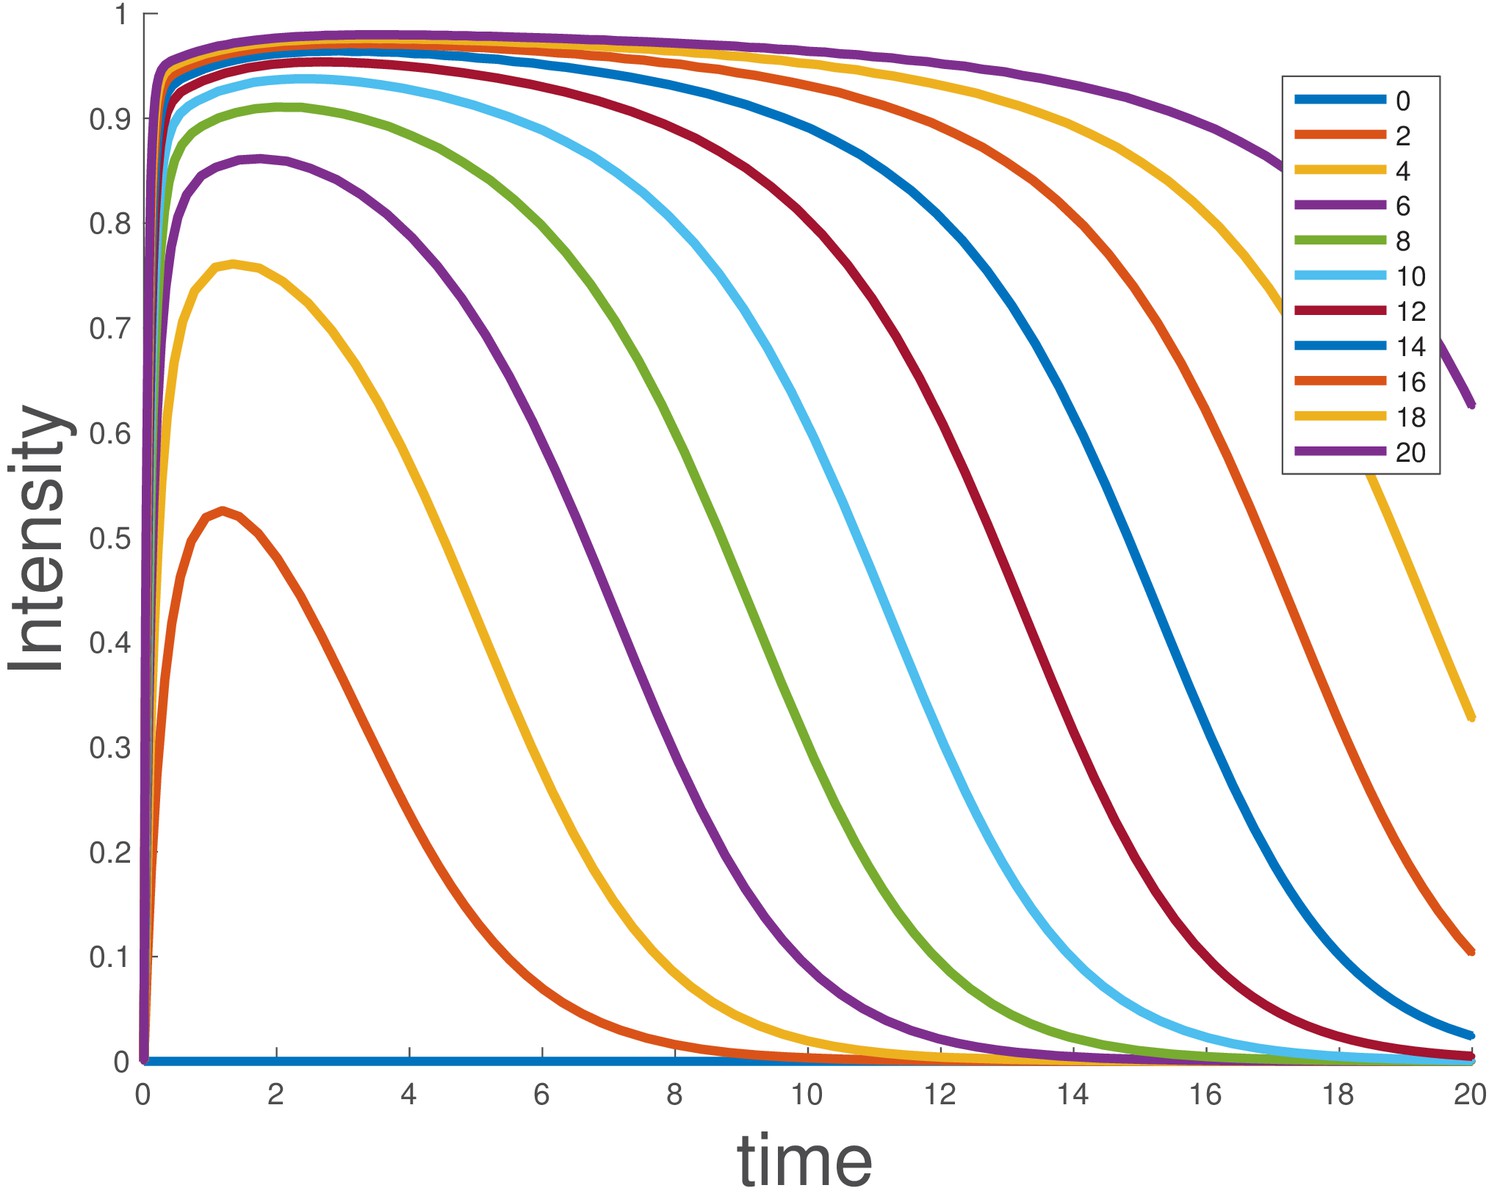
Simulated dose-response for the ligand depletion model, showing that this accounts for the BMP4 dose-response.
The parameters used are and . The initial conditions were , and , and the value of was varied as indicated in the legend.
Tables
Key resources table
| Reagent type (species) or resource | Designation | Source or reference | Identifiers | Additional information |
|---|---|---|---|---|
| Cell line (Homo sapiens) | ESI017 | ESIBIO | RRID:CVCL_B85 | |
| Cell line (H. sapiens) | RUES2 | Ali Brivanlou (Rockefeller) | RRID:CVCL_B810 | |
| Antibody | Goat polyclonal anti-Brachyury | R and D Systems | RRID:AB_2200235 | (1:400) |
| Antibody | Rabbit monoclonal anti-Sox2 | Cell Signaling Technologies | RRID:AB_1904142 | (1:200) |
| Antibody | Mouse monoclonal anti-Nanog | BD Biosciences | RRID:AB_1645598 | (1:400) |
| Antibody | Mouse monoclonal anti-Smad2/3 | BD Biosciences | RRID:AB_398162 | (1:100) |
| Antibody | Rabbit monoclonal anti-pSmad1 | Cell Signaling Technologies | RRID:AB_2493181 | (1:100) |
| Software, algorithm | Image processing and data analysis code | This study | https://github.com/idse/stemcells/ commit a5ee164 |
Table 1
qPCR primers used in this study.
https://doi.org/10.7554/eLife.40526.023| ATP5O | ACTCGGGTTTGACCTACAGC | AAAATGAACGGACAGAACCG |
| BRA | TGCTTCCCTGAGACCCAGTT | GATCACTTCTTTCCTTTGCATCAAG |
| CER | ACAGTGCCCTTCAGCCAGACT | ACAACTACTTTTTCACAGCCTTCGT |
| GATA3 | TTCCTCCTCCAGAGTGTGGT | AAAATGAACGGACAGAACCG |
| HAND1 | GTGCGTCCTTTAATCCTCTTC | GTGAGAGCAAGCGGAAAAG |
| ID2 | GCAGCACCTCATCGACTACA | AATTCAGAAGCCTGCAAGGA |
| ID4 | CCCTCCCTCTCTAGTGCTCC | GTGAACAAGCAGGGCGAC |
| LEFTY1 | ACCTCAGGGACTATGGAGCTCAGG | AGAAATGGCCAATTGAAGGCCAGG |
| LHX1 | TCCCCAATGGTCCCTTCTC | CGTAGTACTCGCTCTGGTAATCTCC |
| MIXL1 | CCGAGTCCAGGATCCAGGTA | CTCTGACGCCGAGACTTGG |
| NANOG | CCGGTCAAGAAACAGAAGACCAGA | CCATTGCTATTCTTCGGCCAGTTG |
| NODAL | ATGCCAGATCCTCTTGTTGG | AGACATCATCCGCAGCCTAC |
| NOG | CATGAAGCCTGGGTCGTAGT | TCGAACACCCAGACCCTATC |
| OCT4 | GGGCTCTCCCATGCATTCAAAC | CACCTTCCCTCCAACCAGTTGC |
| SOX2 | CCATGCAGGTTGACACCGTTG | TCGGCAGACTGATTCAAATAATACAG |
| TBR2/EOMES | CACATTGTAGTGGGCAGTGG | CGCCACCAAACTGAGATGAT |
| WNT3 | CTCGCTGGCTACCCAATTT | GAGCCCAGAGATGTGTACTGC |
Table 2
Antibodies used for immunofluorescence in this study.
https://doi.org/10.7554/eLife.40526.024| Protein | Species | Dilution | Catalog no. | Vendor |
|---|---|---|---|---|
| BRA | Goat | 1:400 | AF2085 | R and D Systems |
| SOX2 | Rabbit | 1:200 | 5024S | Cell Signaling Technology |
| NANOG | Mouse | 1:400 | 560482 | BD Biosciences |
| SMAD2/3 | Mouse | 1:100 | 610842 | BD Biosciences |
| pSMAD1 | Rabbit | 1:100 | 13820 | Cell Signaling Technology |
Additional files
-
Transparent reporting form
- https://doi.org/10.7554/eLife.40526.025
Download links
A two-part list of links to download the article, or parts of the article, in various formats.
Downloads (link to download the article as PDF)
Open citations (links to open the citations from this article in various online reference manager services)
Cite this article (links to download the citations from this article in formats compatible with various reference manager tools)
Rapid changes in morphogen concentration control self-organized patterning in human embryonic stem cells
eLife 8:e40526.
https://doi.org/10.7554/eLife.40526


