Plasmodium Niemann-Pick type C1-related protein is a druggable target required for parasite membrane homeostasis
- Washington University School of Medicine, United States
- Drexel University College of Medicine, United States
- Pennsylvania State University, United States
- Massachusetts Institute of Technology, United States
- University of California San Diego School of Medicine, United States
Figures
Figure 1 with 3 supplements
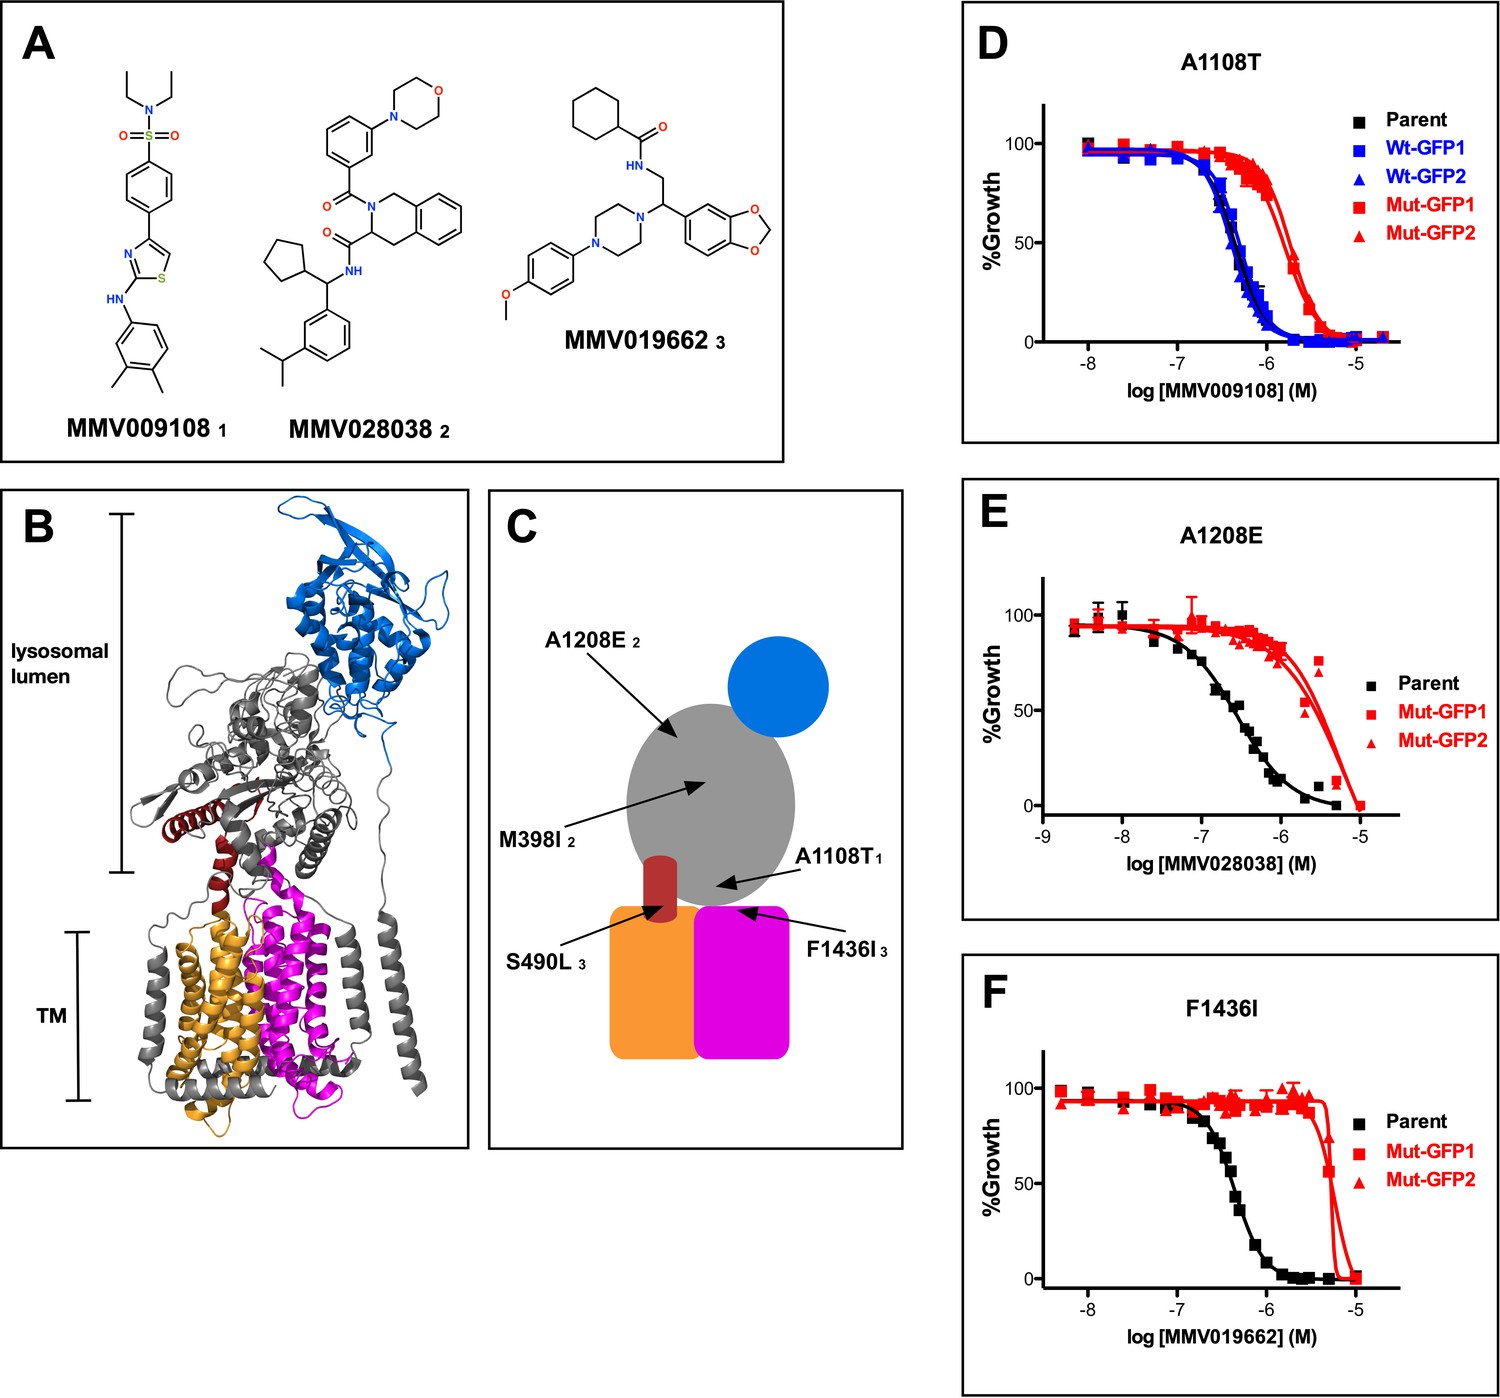
Mutations in PfNCR1 confer resistance to three antimalarial compounds.
(A) Structures of the three structurally diverse compounds that yielded mutations in PfNCR1. The lower-case numbers next the compound IDs are used in C) to match mutations with specific compounds. (B) Ribbon model of the structure of hNCR1 solved by cryoEM (Gong et al., 2016). PDB coordinates: 3JD8. The SSD is shown in orange, the conserved C-terminal membrane domain is shown in magenta, the domain that interacts with hNCR2 is in blue and an additional sequence stretch with similarity to PfNCR1 is in red. (C) Cartoon model of the possible domain arrangement in PfNCR1. Sequence similarity to hNCR1 is restricted to the red, orange and magenta domains. Locations of resistance-conferring mutations are shown with arrows. Compound IDs matching with mutations are shown in lower case numbers and match Figure 1A. The model was generated by visual examination of the hNCR1 structure, aided by the alignment of hNCR1 aa 580–794 and aa 1083–1253 with PfNCR1 aa 439–662 and aa 1304–1468, and aided by a partial model of C-terminal residues generated by Robetta (Ovchinnikov et al., 2018). (D–F) Concentration response curves of blood-stage parasites (all in 0.1% DMSO) measured using a flow cytometry-based assay. Each panel shows different compound and a different mutation. (D) MMV009108, (E) MMV028038, (F) MMV019662. Black = parental 3D7 parasites; red = two independent clones of parasites with mutant allelic exchange; blue = two independent clones of parasites with wild-type allelic exchange (for part D only). The error bars (S.D.) for a representative experiment (technical triplicates) are shown and are very small. The experiment in D) was done three times, (E) and (F) were done twice. For each one representative experiment is shown.
-
Figure 1—source data 1
Potencies of compounds against parental (wild-type) parasites in Figure 1D–F).
- https://doi.org/10.7554/eLife.40529.006
-
Figure 1—source data 2
Resistance of allelic exchange-modified parasites, compared to parental parasites.
- https://doi.org/10.7554/eLife.40529.007
Figure 1—figure supplement 1
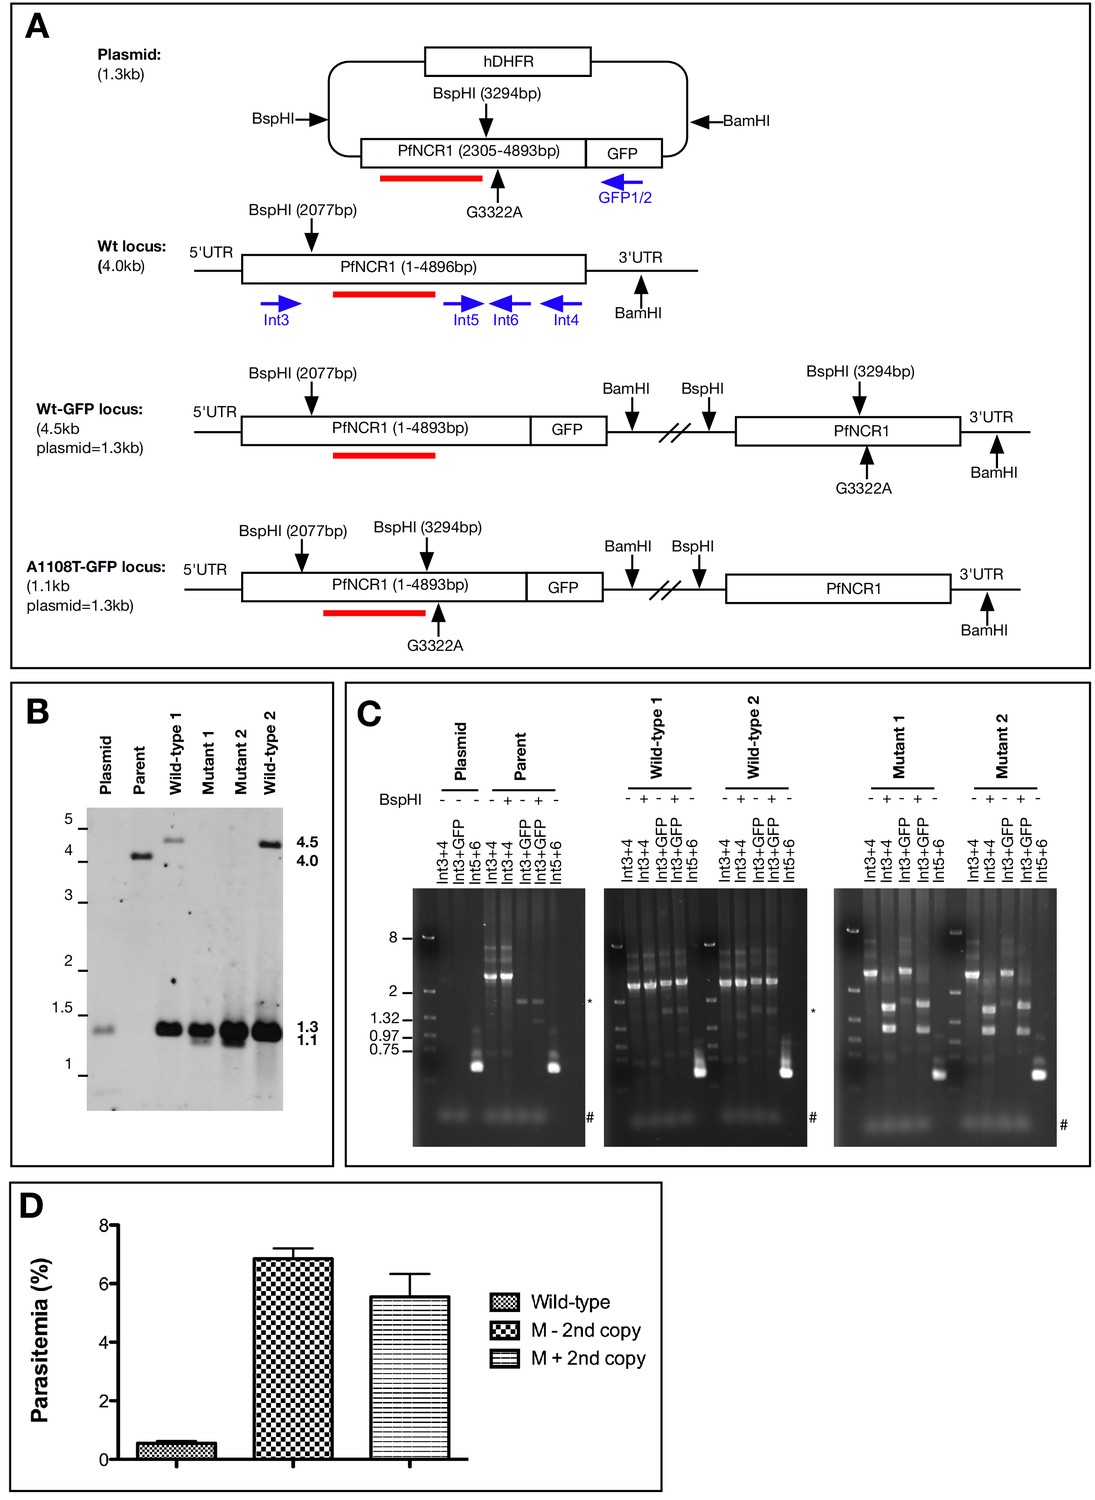
Characterization of 1108 allelic exchange clones.
(A) Scheme of Southern blot for clones with the A1108T mutation. A C-terminal fragment of PfNCR1 (bp 2305–4893) was amplified from gDNA and cloned into the pPM2GT vector with restriction sites XhoI and AvrII. Site-directed mutagenesis was used to introduce the mutation expressing A1108T (nucleotide G3322A) as well as a mutation at bp 3294 to introduce a synonymous BspHI site. The location of the probe (bp 2624–3298) is shown in red. For integrants, and normally a second truncated and promoterless copy is introduced into the genome. Primers used for PCR analysis of clones are shown in blue. Primers Int4, Int5, Int6 anneal to the transfected plasmid, wild-type parasites sequences and allelic exchange clones. Int3 is outside the plasmid sequence, while GFP1/2 are not present in the parent. (B) Southern blot of plasmid DNA, 3D7 parental DNA, two clones in which homologous recombination occurred such that the A1108T mutation is expressed (Mutant 1 and 2), as well as two clones in which homologous recombination occurred downstream from the mutation (Wild-type 1 and 2). A size ladder (in kb) is shown on the left. The expected sizes from the BspHI/BamHI double digest are: 1.3 kbp (plasmid), 4.0 kbp (genomic locus), 4.5 kbp (integration of vector, 3’ GFP), 1.1 kbp (integration of vector and expression of A1108T mutation, 3’ GFP). The expected promoterless second copy in the mutation integrant parasites used in Figure 1 is not present. It is possible that this second copy has looped out via homologous crossover after the BspHI site in the integrated concatamerized plasmid. Clones with or without this second copy displayed similar resistance (see D, below). (C) PCR diagnostic tests on A1108 allelic exchange clones using primers indicated in A). PCRs show integration at endogenous locus and introduction of mutation in A1108T mutant clones (as indicated by BspHI restriction). Expected sizes of PCR products are as follows: Int3 +Int4=2747; Int3 +GFP2=2860, Int5 +Int6=521. * indicates non-specific product, # denotes primers. In clones expressing A1108T digest of Int3 +Int4 product results in two fragments of 1145 bp and 1602 bp, and digest of Int3 +GFP2 product produces 1145 bp and 1750 bp fragments. (D) Parasitemia of allelic replacement clones after 72 hr incubation with 1.2 µM MMV009108. In some clones, the second (promoter-less) copy has looped out. Clones expressing A1108T with or without second copy were resistant to MMV009108. Wild-type refers to A1108A expressing clones, M-2nd copy refers to A1108T clones with looped out promoter-less copy, while M+2nd copy have the promoter-less copy. This experiment was done once with biological duplicates.
Figure 1—figure supplement 2
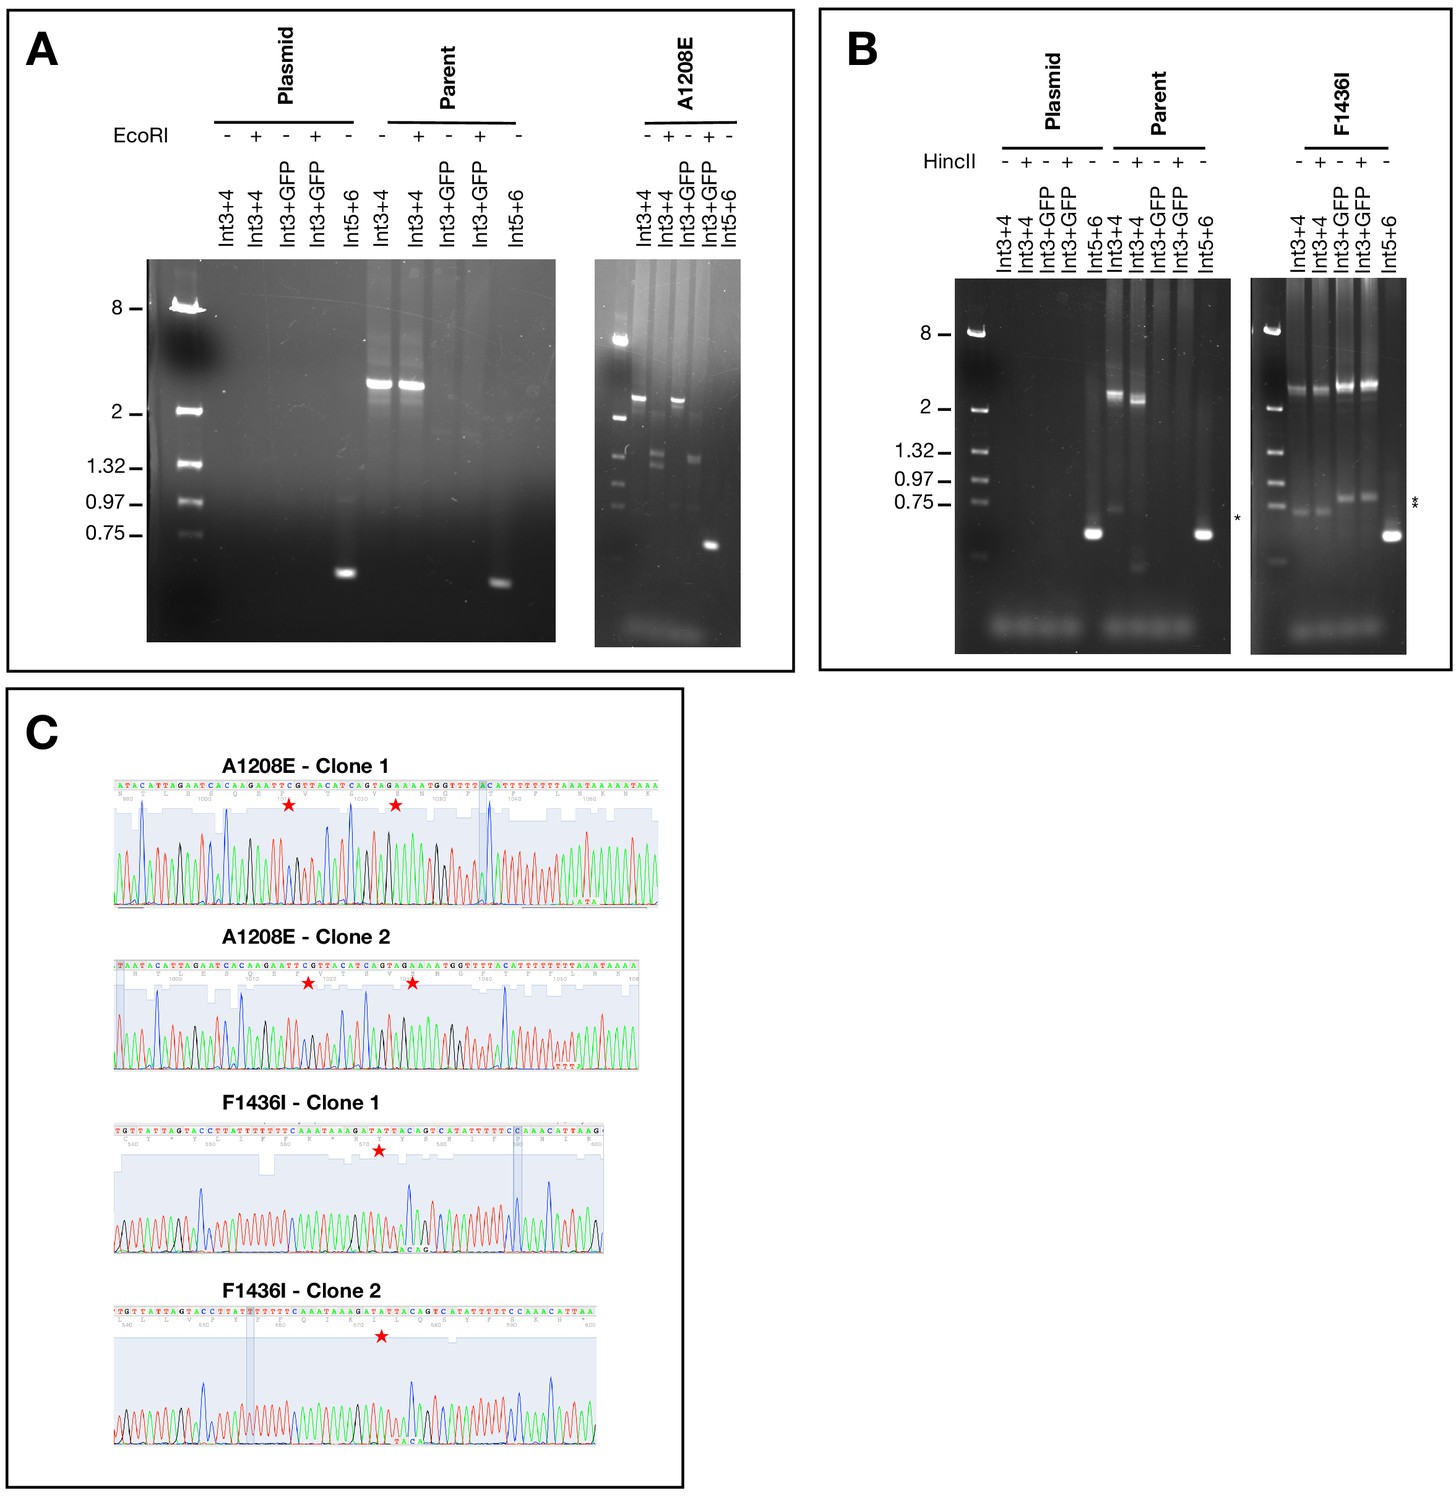
Characterization of A1208E and F1436I clones.
PCR diagnostic tests using primers indicated in Figure 1—figure supplement 1A). (A) PCRs show integration at endogenous locus and introduction of mutation at 1208 (as indicated by EcoRI restriction). Expected sizes of PCR products are as follows: Int3 +Int4=2747; Int3 +GFP2=2860, Int5 +Int6=521. Digest of Int3 +Int4 product results in two fragments of 1291 bp and 1456 bp. Digest of Int3 +GFP2 product results in a doublet (1404 bp and 1456 bp). (B) PCRs show integration at endogenous locus and introduction of mutation at 1436 (as indicated by mutated HincII restriction). Expected sizes of PCR products are as follows: Int3 + Int4=2747; Int3 + GFP2=2860, Int5 +Int6=521. Digest of Int3 + 4 PCR from parent gDNA with HincII decreases the 2747 bp product by 317 bp (small fragment is not visible on gel). The HincII site is mutated in the mutant clone. * indicates non-specific product. (C) Sequencing traces of gDNA purified from allelic exchange parasites showing the introduction of the desired mutations (highlighted by red stars). The primers Int3 and GFP1 were used to amplify the sequence of PfNCR1.
Figure 1—figure supplement 3
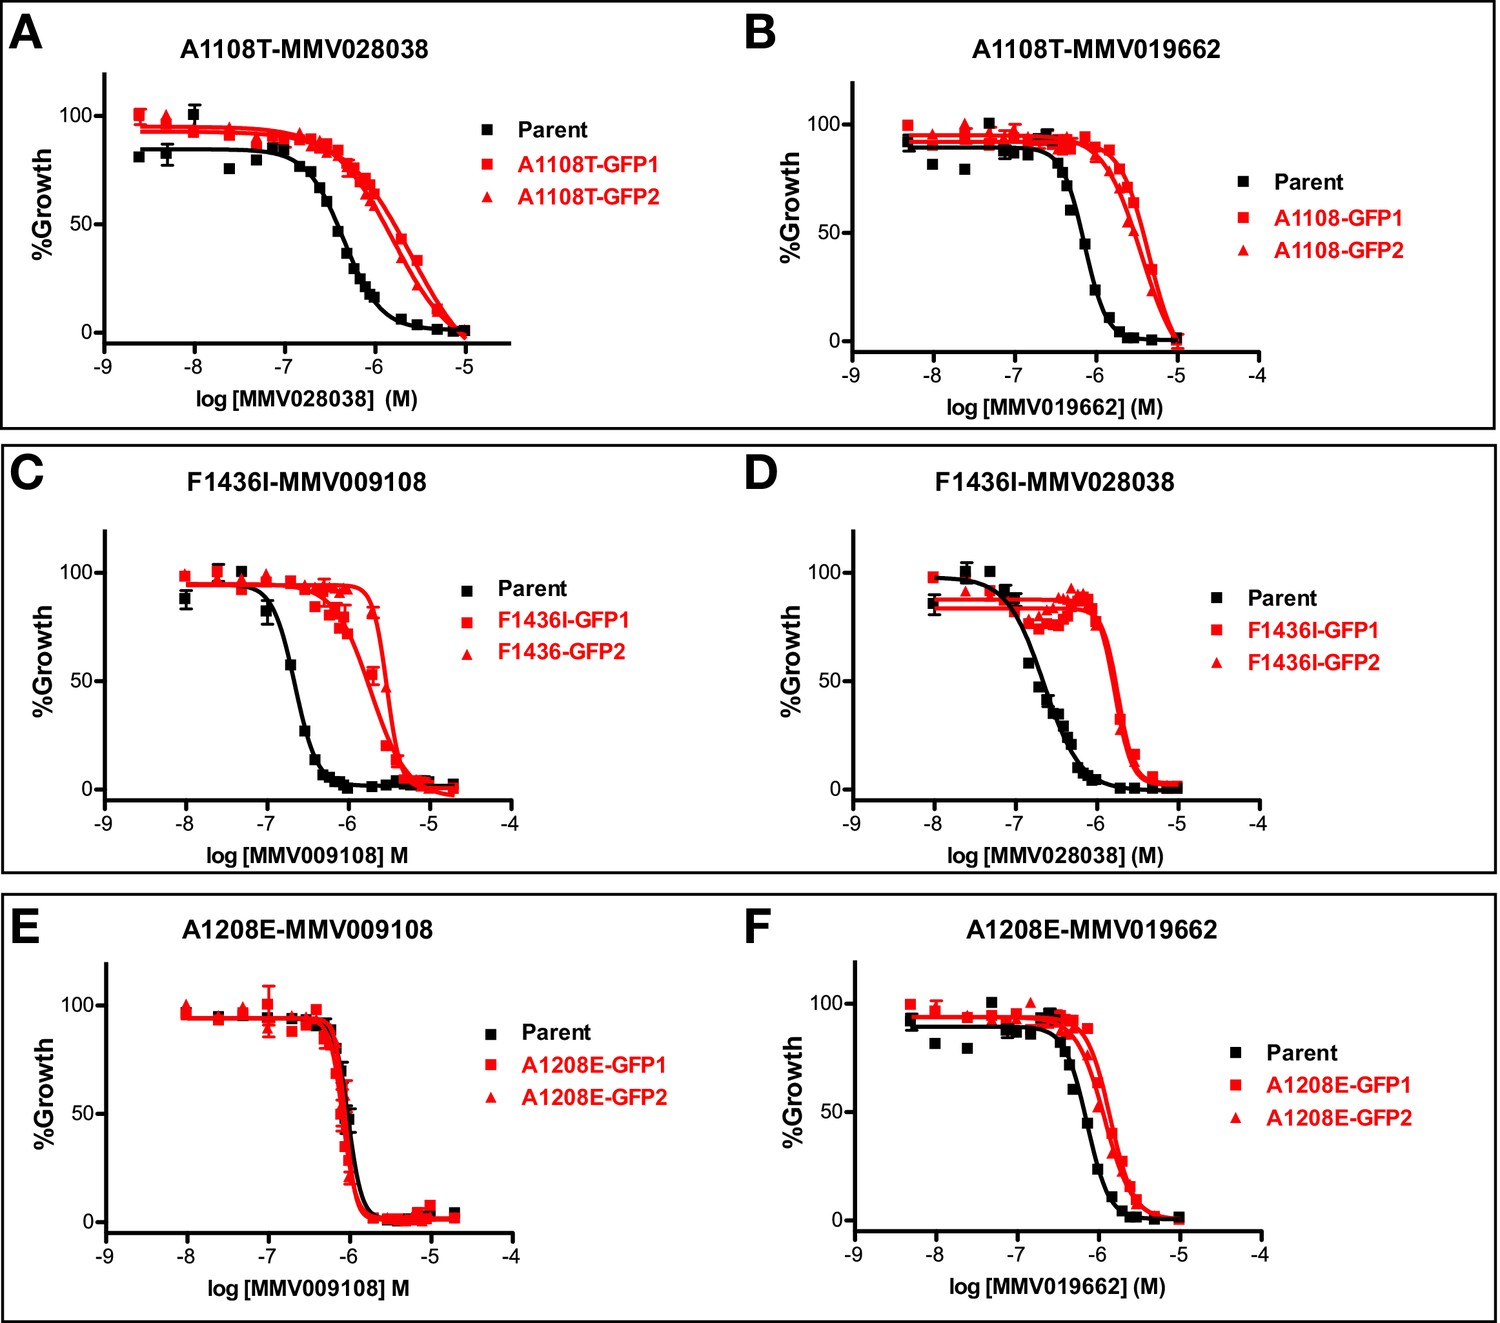
Concentration response curves of PfNCR1 mutant parasite clones with compounds.
(A,B) PfNCR1 mutant clone A1108T; (C,D) F1436I; (E,F) A1208E. This experiment was done two times. One representative experiment is shown.
Figure 2 with 1 supplement
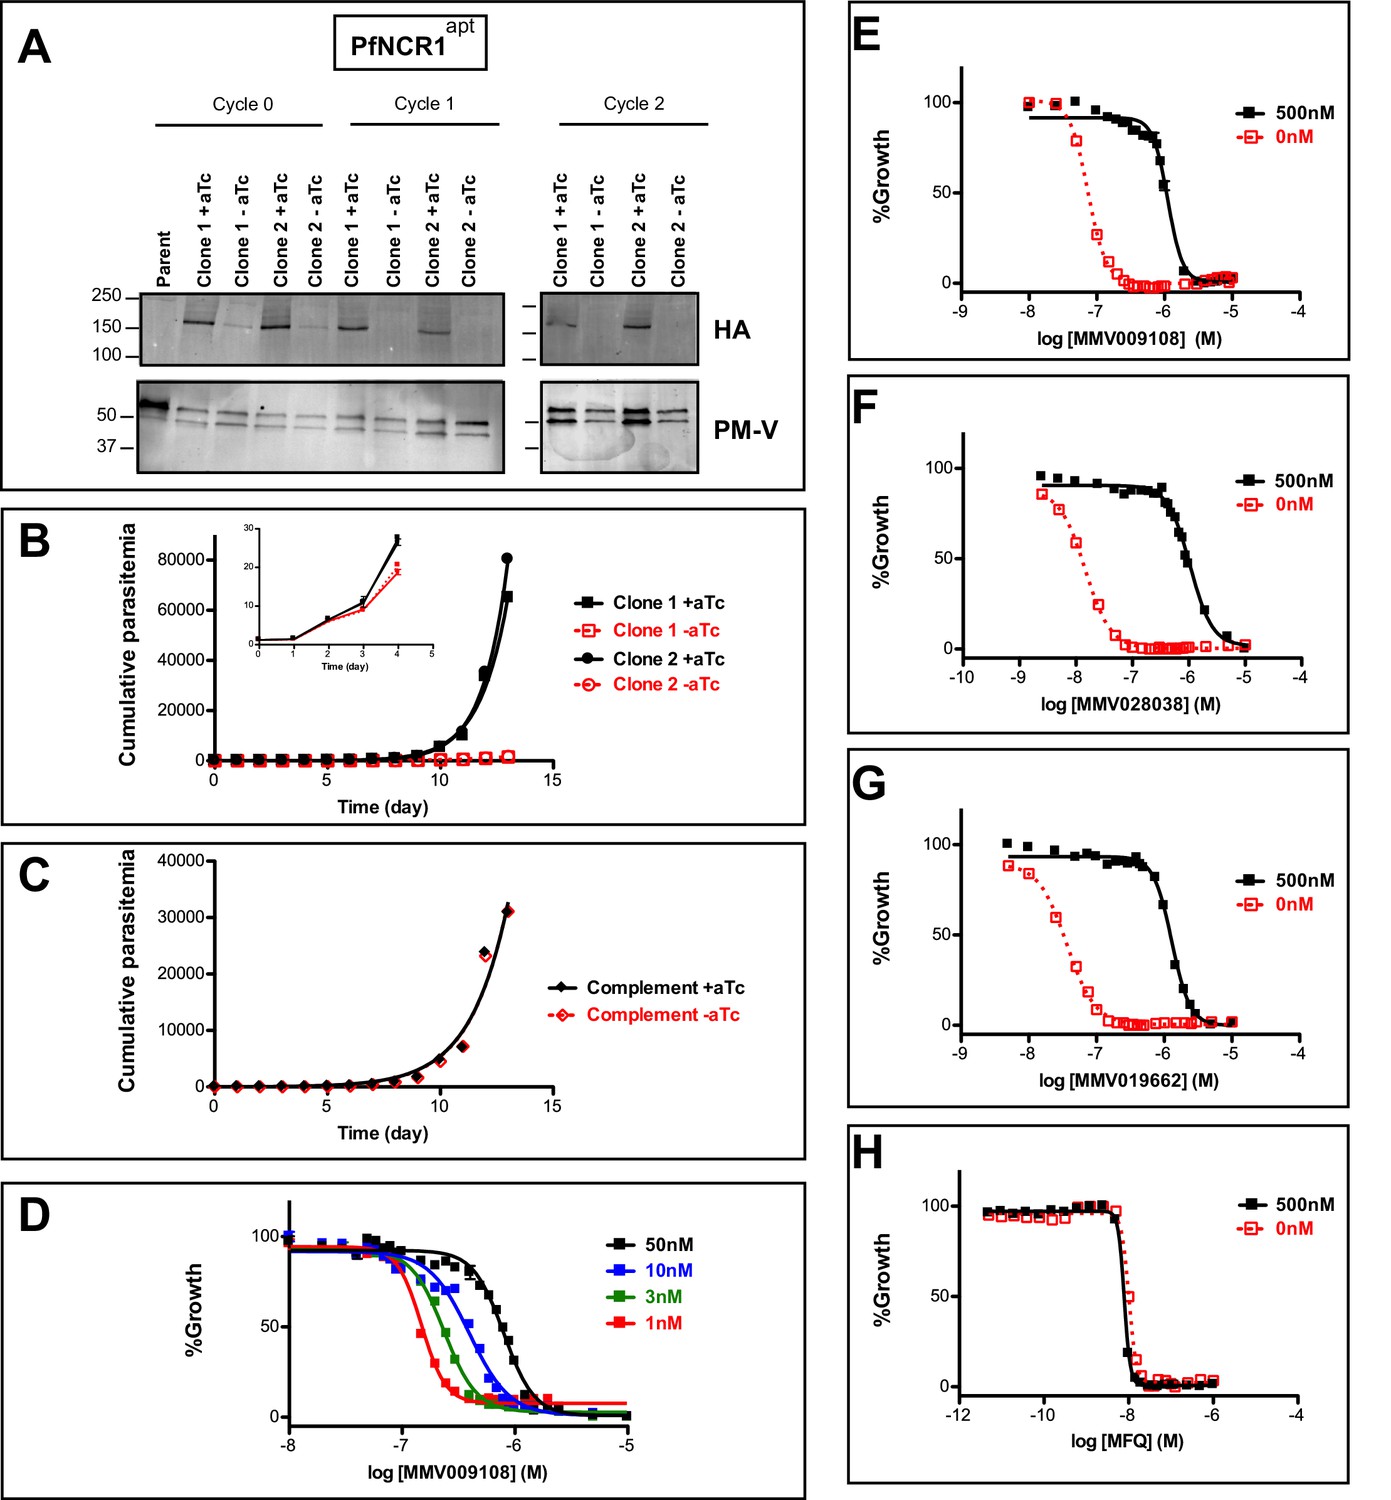
PfNCR1 is required for blood-stage parasite replication and is targeted by three antimalarials.
(A) Western blot showing regulation of the PfNCR1apt by aTc. Trophozoite-stage parasites were harvested from the replication cycle in which aTc was removed (cycle 0), as well as the following two cycles. PfNCR1 was detected using a C-terminal HA-tag. The ER membrane protein plasmepsin V (PM-V) was used as a loading control. Note that the two bands recognized by α-PM-V antibody correspond to the full-length protein and a proteolytic fragment of the protein produced during the membrane isolation. Expected sizes: 171 k Da for PfNCR1-HA, 69 k Da for PM-V. This experiment was done two times. (B) Replication of PfNCR1apt parasites. Using a flow cytometry assay, the replication of two PfNCR1apt clones was monitored over two weeks. +aTc is in black and solid lines, -aTc is in red and dashed lines. Cultures were seeded at 1% parasitemia, and subjected to daily media changes, and/or sub-culturing. Cumulative parasitemias were calculated by multiplying with dilution factors. One representative experiment with technical triplicates is shown. The inset magnifies the initial time points. Doubling times in days are as follows (95% confidence intervals in parentheses): clone 1 -aTc = 1.596 (1.546–1.650), R2 = 0.9964; clone 1 +aTc = 0.8663 (0.8218–0.9159), R2 = 0.9930; clone 2 -aTc = 1.463 (1.417–1.512), R2 = 0.9965; clone 2 +aTc = 0.7776 (0.7559–0.8005), R2 = 0.9981. This experiment was done four times. (C) Complementation of PfNCR1apt rescues growth phenotype. Wild-type PfNCR1 was stably expressed in the PfNCR1apt background. Replication of parasites was monitored over two weeks. +aTc is in black and solid line, -aTc is in red and dashed line. One representative experiment with technical triplicates is shown. Doubling times in days are as follows (95% confidence intervals in parentheses): -aTc = 1.152 (1.036–1.298), R2 = 0.97; +aTc = 1.166 (1.039–1.329), R2 = 0.96. This experiment was done four times. Note that the complemented strain grows less well than PfNCR1apt with aTc (B), but that there is no significant difference ±aTc. (D) Expression level of PfNCR1 correlates with sensitivity to MMV009108. Concentration response curves using a flow cytometry-based growth assay. After aTc washout, aTc was replenished in triplicate cultures at different concentrations and parasitemias were measured after 72 hr. aTc concentrations are indicated. This experiment was done three times. (E–H) PfNCR1 K/D hypersensitizes parasites to three compounds. Concentration-responses of PfNCR1apt parasites to E) MMV009108, (F) MMV028038, (G) MMV019662, and H) mefloquine (MFQ) (control compound) without aTc (red open symbols, dashed lines) or with 500 nM aTc (black symbols, solid lines) after 72 hr. One representative experiment with technical triplicates is shown. The experiment in E) was done three times the experiments in F-H) were done two times.
-
Figure 2—source data 1
Shifts in EC50s under PfNCR1 K/D.
- https://doi.org/10.7554/eLife.40529.010
Figure 2—figure supplement 1

Editing of the PfNCR1 locus to generate aptamer-regulated strains and generation of the PfNCR1 complementation.
(A) Schematic of the CRISPR/Cas9 modification of the pfncr1 locus. Aptamers = 10X aptamer sequence, BS = blasticidin deaminase resistance cassette, 2A = T2A viral skip peptide, DOZI-TetR = tet repressor protein fused to DOZI effector. (B) PCR product from gDNA of pfncr1 locus in PfNCR1apt parasite clones. Primers Int1 (anneals 5’ of the integration site) and Int2 (reverse, anneals to 3’ of the integration site) were used. Expected size for pfncr1 locus is 2.3 kbp, for aptamer-modified locus it is 13.1kbp. (C) Sequence of PfNCR1apt clone two illustrating the Cas9 shield mutations, the AatII sites and the HA-sequence. (D) Western blot of PfNCR1apt complemented parasites. Expression from the genomic locus is regulated by aTc (left), while there is no change in the level of expression of the additional copies of PfNCR1-GFP (right). Expected size for HA-tagged PfNCR1apt is 171 kDa (arrow on left), expected size for second copy PfNCR1-GFP is 197 kDa (arrow on right).
Figure 3 with 2 supplements
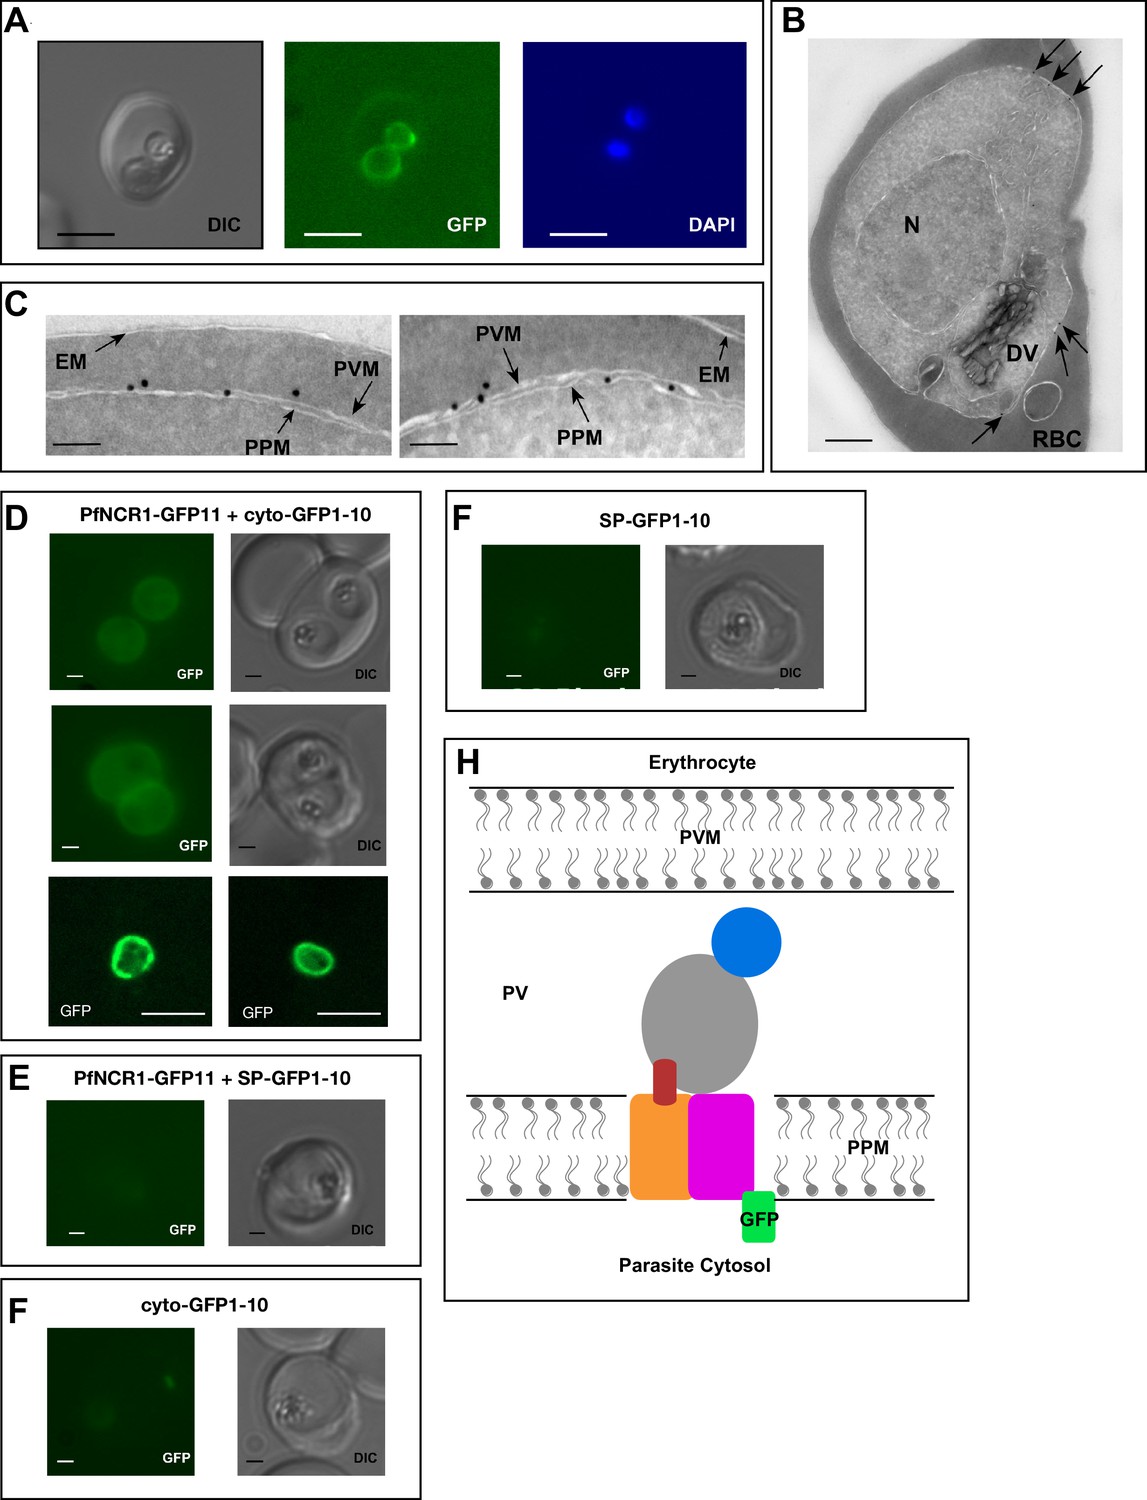
PfNCR1 localizes to the parasite plasma membrane.
(A) Live fluorescence microscopy with C-terminally GFP-tagged wild-type PfNCR1-expressing parasites (clone Wt-GFP1 from Figure 1) localizes PfNCR1 to the parasite surface. Scale bar 5 μm. (B–C) Immuno-electron-micrographs of trophozoite-stage parasites using α-GFP antibody. Arrows mark gold particles, RBC = infected red blood cell, DV = digestive vacuole, N = nucleus. The close-up in C) shows gold particles clustered at the parasite-delimiting membranes. EM = erythrocyte membrane; PVM = parasitophorous vacuolar membrane; PPM = parasite plasma membrane. Scale bar B = 500 nm, C = 100 nm. (D–G) Live fluorescence microscopy on split-GFP expressing parasites. (D) Co-expression of PfNCR1-GFP11 with cytoplasmic GFP1-10. The bottom panels were generated using confocal microscopy. (E) Co-expression of PfNCR1-GFP11 with GFP1-10 that contains a signal peptide and localizes to the vacuole. (F) Cytoplasmic GFP1-10 without expression of PfNCR1-GFP11. (F) GFP-1–10 containing a signal peptide without expression of PfNCR1-GFP11. Scale bar: 1 µm for epifluorescence images, 10 µm for confocal images. (H) Cartoon of the proposed orientation of PfNCR1 in the PPM (parasite plasma membrane). PV = parasitophorous vacuole; PVM = parasitophorous vacuolar membrane.
Figure 3—figure supplement 1
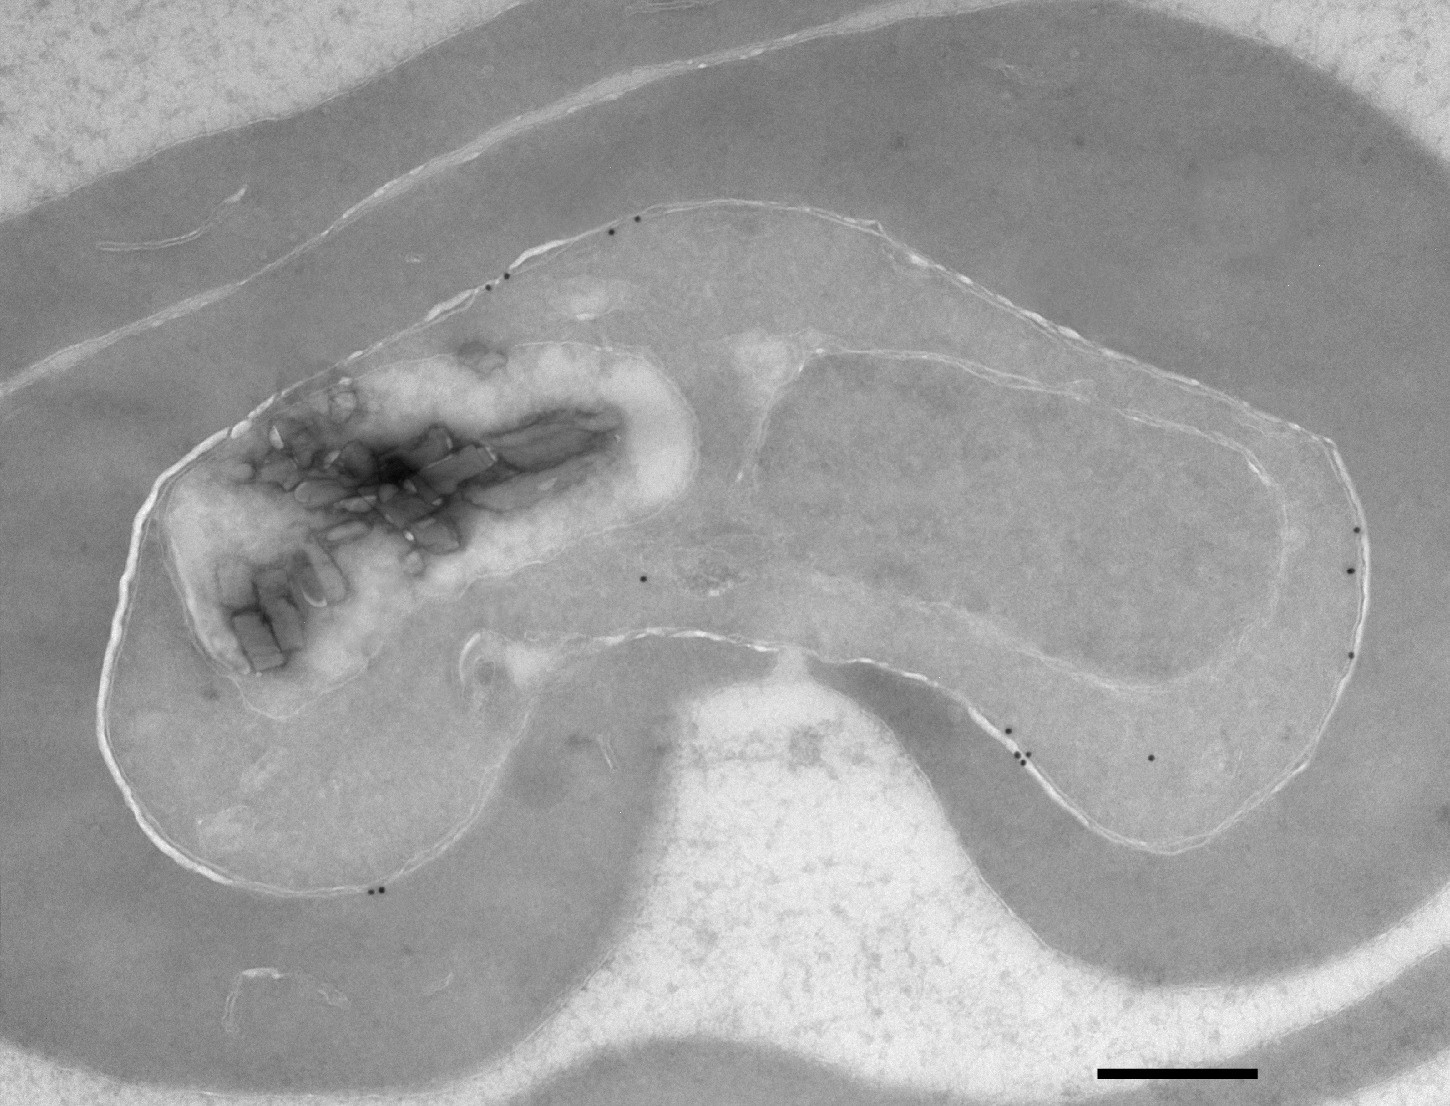
Immuno-electron microscopy of HA-tagged PfNCR1.
Immuno-electron micrograph of PfNCR1apt parasites kept in 500 nM aTc. The PfNCR1apt clones expresses a single C-term. HA-tag. Scale bar 500 nm.
Figure 3—figure supplement 2
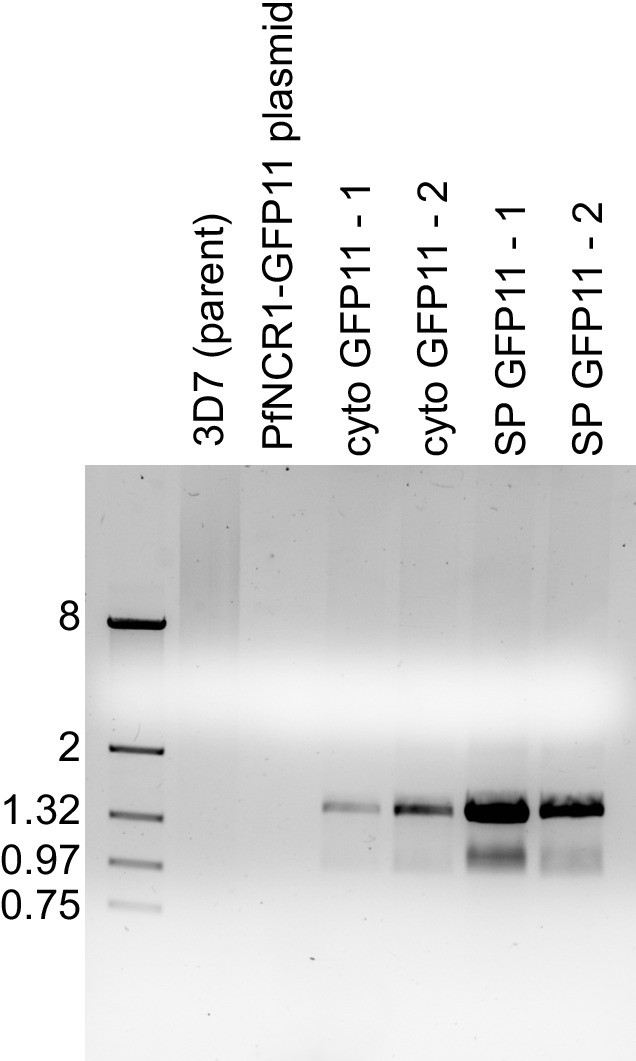
Preparation of PfNCR1-GFP11.
PCR of gDNA from two independent transfection each of PfNCR1-GFP11 into cytoplasmic or vacuolar expressed GFP1-10 parasites. The primers Int1 and Plasmid1 were used for the amplification. The size ladder on the left is in kbase pairs. Cyto-GFP11 means PfNCR1-GFP11 is expressed in the background of cytoplasmic GFP1-10, SP-GFP11 means PfNCR1-GFP11 is expressed in the background of vacuolar GFP1-10. Expected size: 1.46 kbp.
Figure 4 with 1 supplement

Compound treatment hypersensitizes parasites to saponin.
(A) Strain 3D7 parasites (30–34 hr post-infection) were exposed to DMSO or 100 nM MMV009108 for 2 hr. Compound or vehicle were removed by washout and rescued by growing in compound-free cRPMI medium for another 2 hr. Parasites were treated with saponin (0.02%) to release parasites followed by western blot analysis using antibodies to parasite aldolase or EXP2. EXP2 was used as a loading control. This experiment was done three times. B – D) Flow cytometry-based assay to monitor cell leakiness using a cytoplasmic GFP expressing parasite clone (NF54eGFP). Parasites were incubated with MMV009108 (B), MMV028038 (C), or MMV019662 (D) at the indicated concentrations for 1 hr (DMSO was the vehicle control). Following compound washout with PBS, parasites were released from RBCs with saponin. Using flow cytometry, 50,000 cells were counted and scored as GFP positive or negative. At 0% saponin, all samples had similar numbers of GFP-positive cells (~80%). The experiment in B) was done three times. The experiments in C and D) were done two times. For each B)-D) a single representative experiment (with technical duplicates) is shown. E) Low Na+-adapted trophozoite stage 3D7 parasites were subjected to varying concentration of MMV009108 for 2 hrs followed by saponin (0.02%) treatment to release the parasites and subjected for western blot analysis using antibodies to parasite aldolase or EXP2 (loading control). 100 nM PA21A05024 and 100 nM artemisinin were used as controls. This experiment was done two times. Unlike the pyrazoleamide PA21A050, MMV009108 does not induce Na+ influx into parasites. Low Na+-adapted trophozoite stage 3D7 parasites were subjected to varying concentration of MMV009108 for 2 hrs followed by saponin (0.02%) treatment to release the parasites and subjected for western blot analysis using antibodies to parasite aldolase or EXP2 (loading control). 100 nM PA21A05024 and 100 nM artemisinin were used as controls. This experiment was done two times.Unlike the pyrazoleamide PA21A050, MMV009108 does not induce Na+ influx into parasites. SBFI 340 nm/380 nm emission ratio traces are plotted for indicated compounds and concentration. Unlike the pyrazoleamide PA21A050, MMV009108 does not alter intracellular [Na+] as represented by the lack of change in SBFI 340/380 ratiometric traces. This experiment was done three times.
-
Figure 4—source data 1
EC50fold change to KAE609 under PfNCR1 K/D.
- https://doi.org/10.7554/eLife.40529.016
Figure 4—figure supplement 1
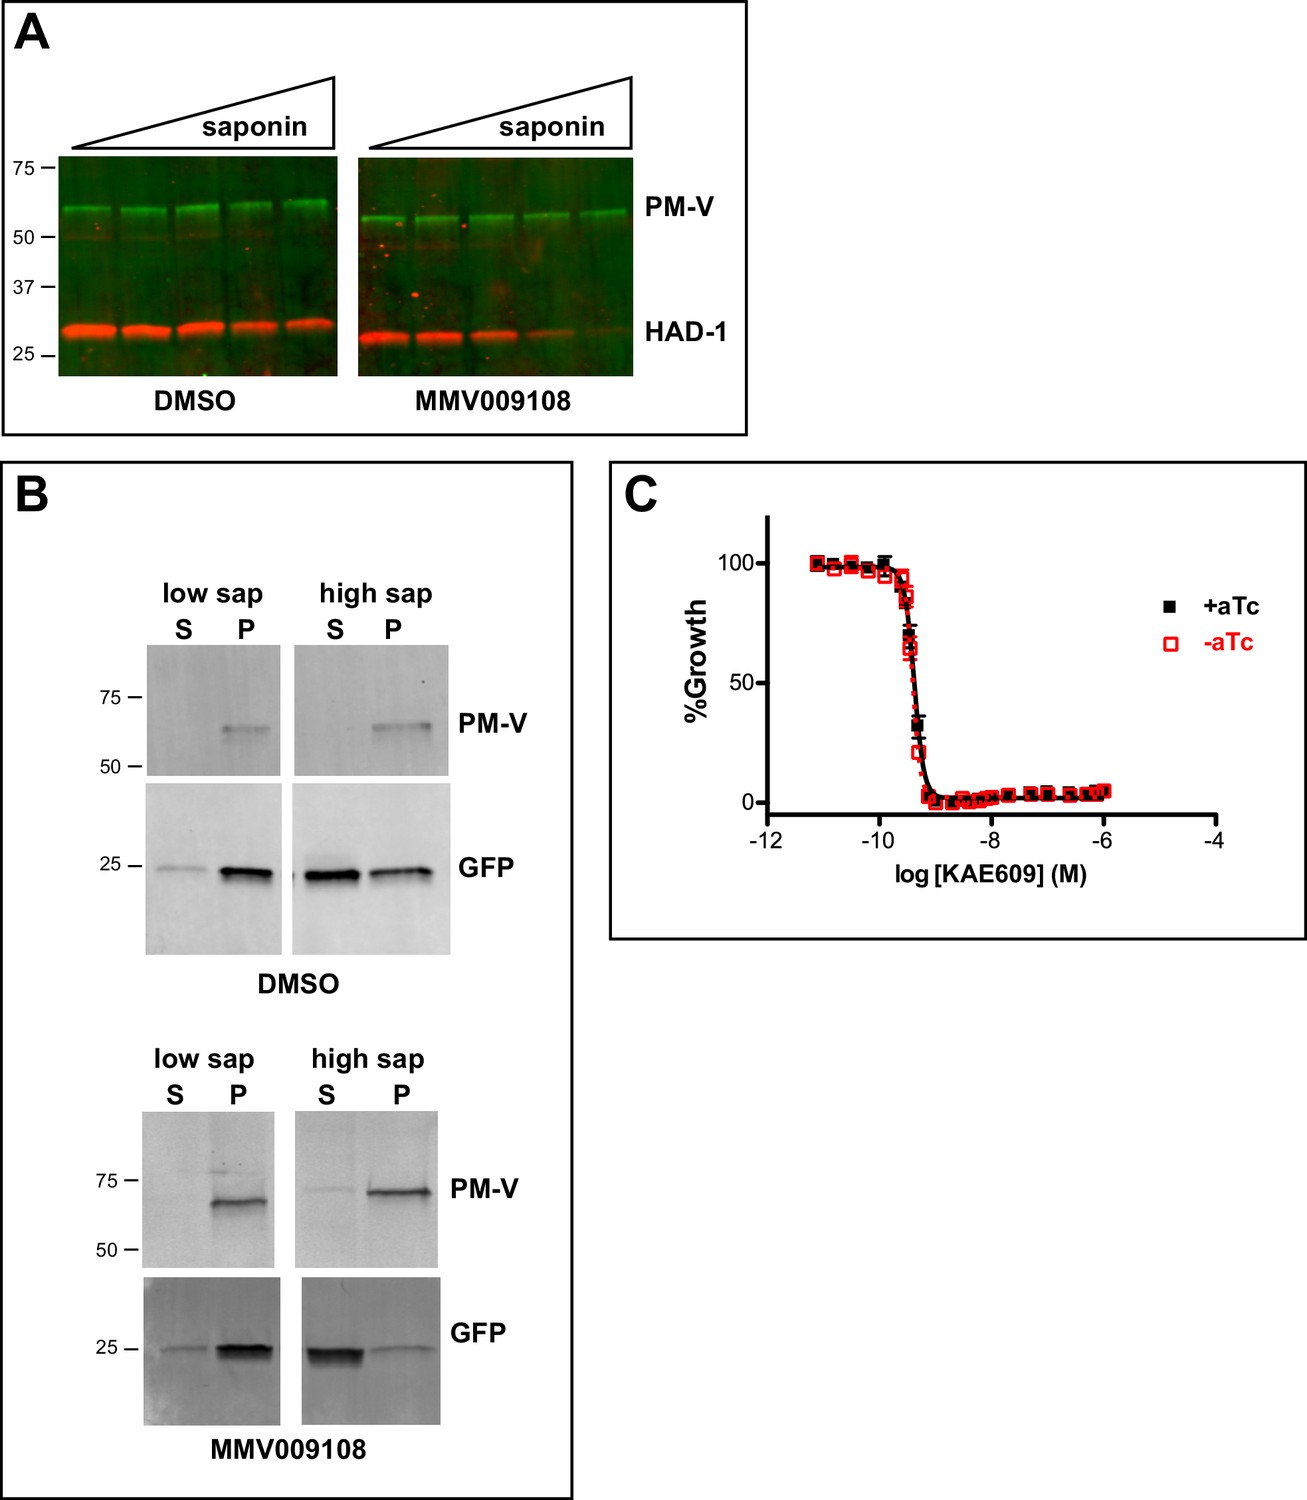
Further characterization of PfNCR1 inhibition or K/D.
Saponin release of cytosolic protein from drug-treated parasites (A, B). (A) Trophozoite stage parasites (strain 3D7) were incubated with 500 nM MMV009108 or vehicle (DMSO) for 2 hr in cRPMI. Parasites were released from RBCs with increasing concentrations of saponin (0%, 0.009%, 0.018%, 0.035%, 0.07%), lysed in Ripa buffer and analyzed by western blotting. (B) Western blot analysis on saponin supernatant (S) and pellet (P) fractions using NF54eGFP parasites. Parasites were incubated with 1 μM MMV009108 or vehicle (DMSO) for 2 hr, washed, released from RBCs with low saponin (low sap, 0.0088%) or high saponin (high sap, 0.14%). Saponin supernatants were loaded directly, while washed parasite pellets were lysed in Ripa before electrophoresis. Expected sizes: HAD1 = 33 kDa, PM-V = 69 kDa, GFP = 27 kDa. (C) Sensitivity of PfNCR1 K/D to the PfATP4 inhibitor KAE609. Concentration-response curves of blood-stage parasites (all in 0.1% DMSO) measured using a flow cytometry-based assay. Black and solid line = PfNCR1apt parasites with 500 nM aTc; red and dashed line = PfNCR1apt parasites after removal of aTc. Incubation of parasites with compound was 72 hr. The error bars (S.D.) for the experiment (technical triplicates) are shown.
Figure 5 with 1 supplement
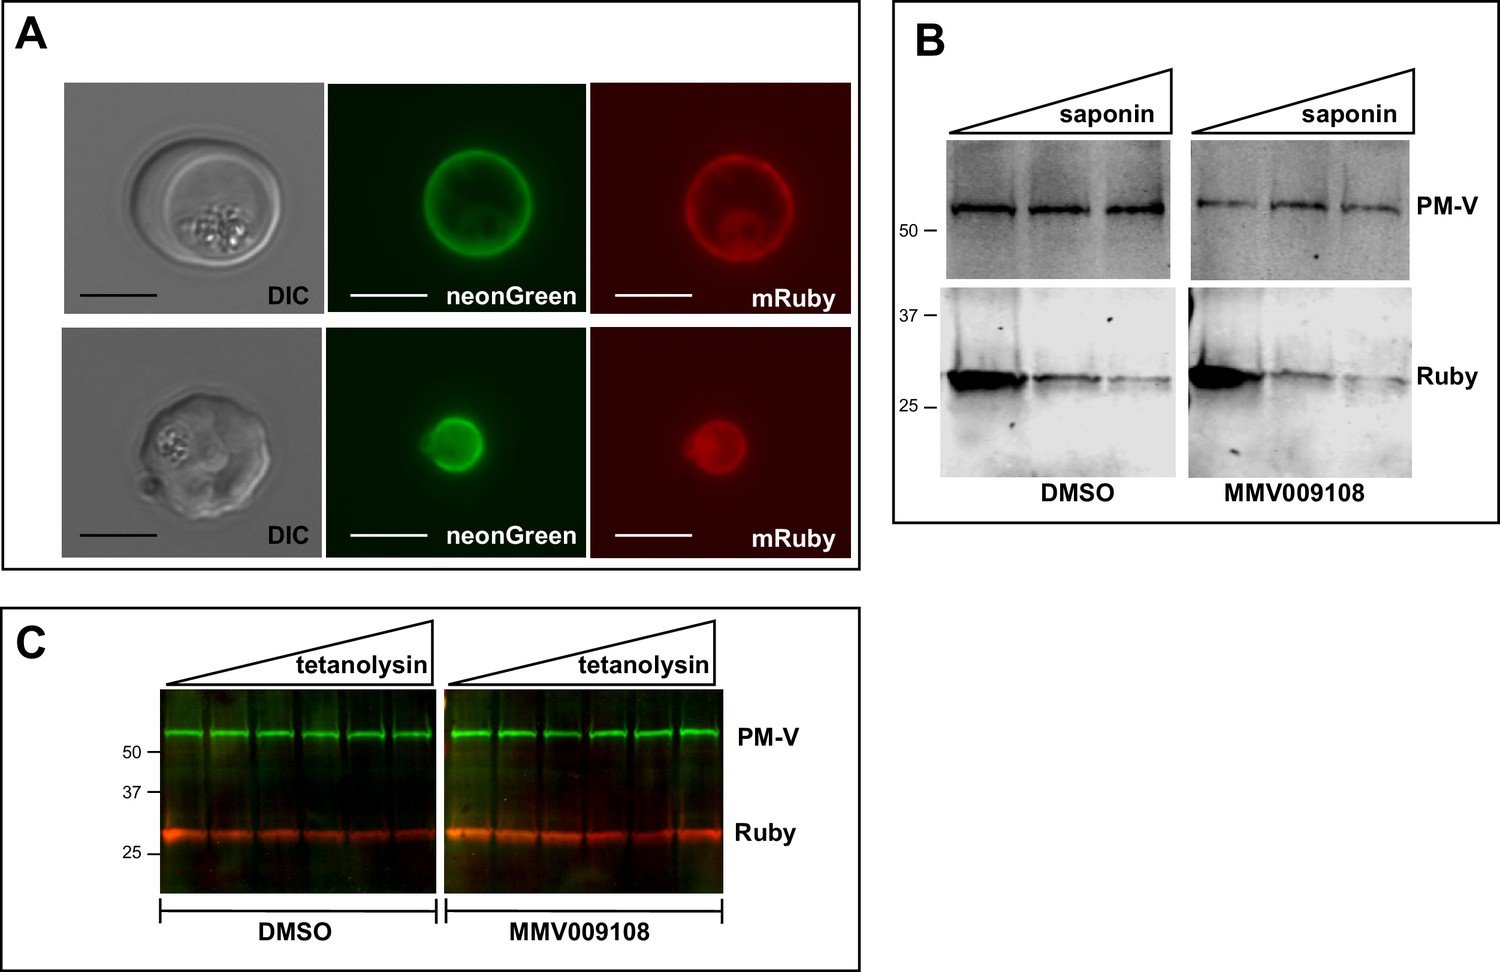
PVM lipid homeostasis is not affected by MMV009108.
(A) Live microscopy on NF54-EXP2-mNeonGreen + PV-mRuby3 parasites. The PVM protein EXP2 is expressed as mNeonGreen fusion; mRuby3 is targeted to PV lumen. Scale bar = 5 μm. (B) Western blot on saponin-treated NF54-EXP2-mNeonGreen + PV-mRuby3 parasites following treatment with 500 nM MMV009108 for 2 hr. The saponin gradient was as follows: 0%, 0.009%, 0.018%. This experiment was done two times. (C) Western blot on NF54-EXP2-mNeonGreen + PV-mRuby3 parasites following treatment with tetanolysin (concentrations: 0, 0.5, 1, 2.5, 5, 7.5 ng/ml). Blot was probed with anti-RFP and anti-PM-V antibodies. This experiment was done two times. Expected sizes: PV-Ruby3 = 27 kDa, PM-V = 69 kDa.
Figure 5—figure supplement 1
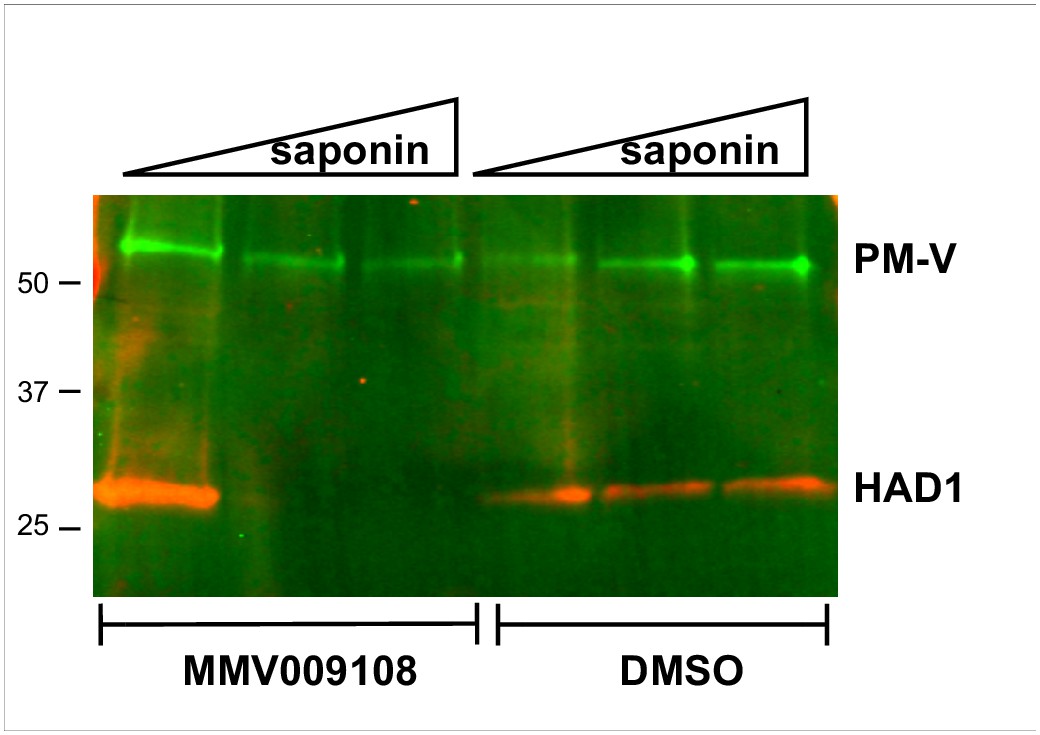
Control experiment: PPM but not PVM lipid homeostasis is affected by MMV009108.
Western blot on saponin-isolated MMV009108-treated NF54-EXP2-mNeonGreen + PV-mRuby3 parasites showing leakage of cytoplasmic HAD1. Saponin concentrations: 0%, 0.035%, 0.07%. Expected sizes: HAD1 = 33 kDa, PM-V = 69 kDa.
Figure 6 with 1 supplement
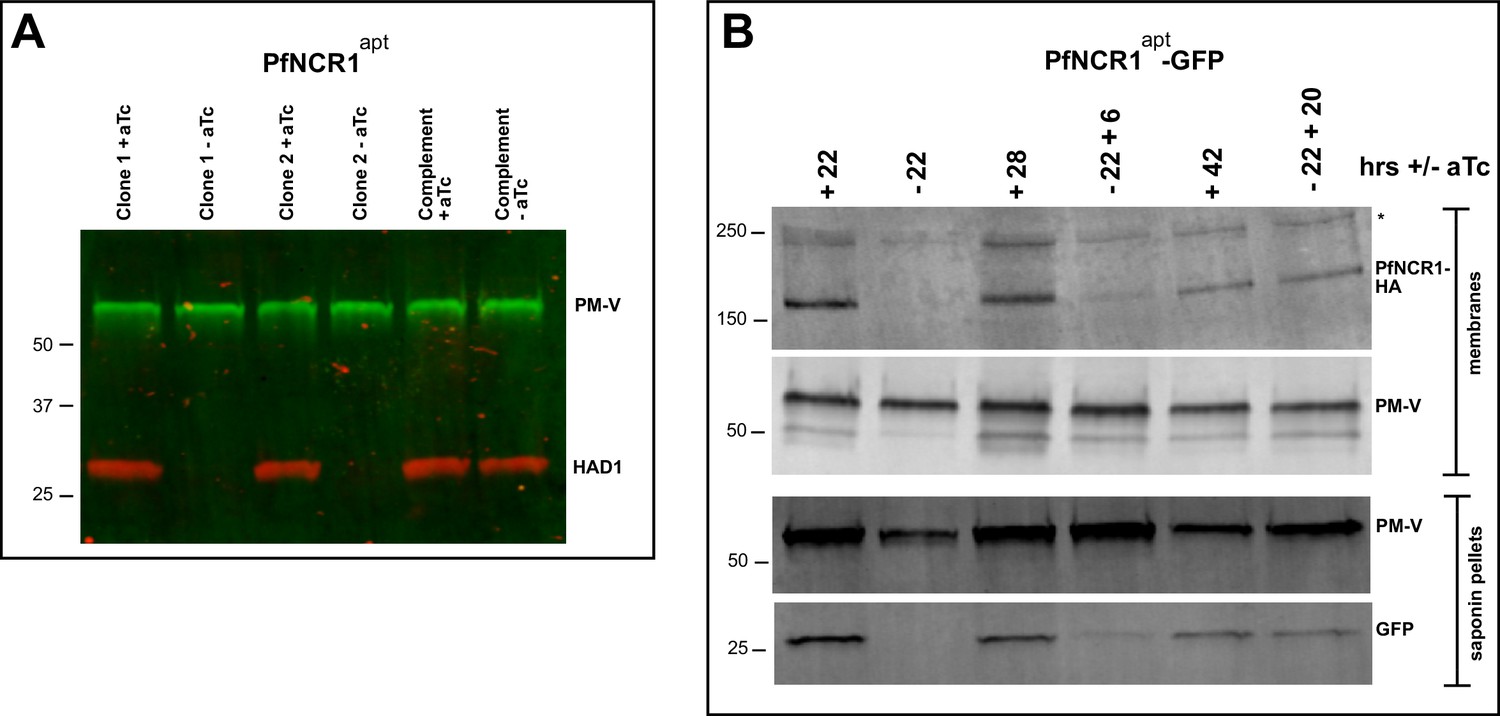
PfNCR1 K/D hypersensitizes parasites to saponin.
(A) Western blot analysis of saponin extracts (0.07%) from two PfNCR1apt clones and complemented parasites. Parasites were harvested 24 hr after aTc washout. This experiment was done two times. (B) Replenishing aTc after washout reverts the K/D phenotype. aTc was removed from PfNCR1apt-GFP parasites (stable expression of cytosolic GFP). 22 hr after washout, one set of parasites was harvested, while aTc (500 nM) was added back to another set of parasite samples for 6 or 20 hr. Parasites were either harvested to prepare membranes, or released with saponin. Lysates were subjected to western blotting. * in top blot (anti-HA) marks a cross-reacting protein. This experiment was done two times. Expected sizes: HAD1 = 33 kDa, PM-V = 69 kDa, PfNCR1-HA = 171 kDa, GFP = 27 kDa.
Figure 6—figure supplement 1
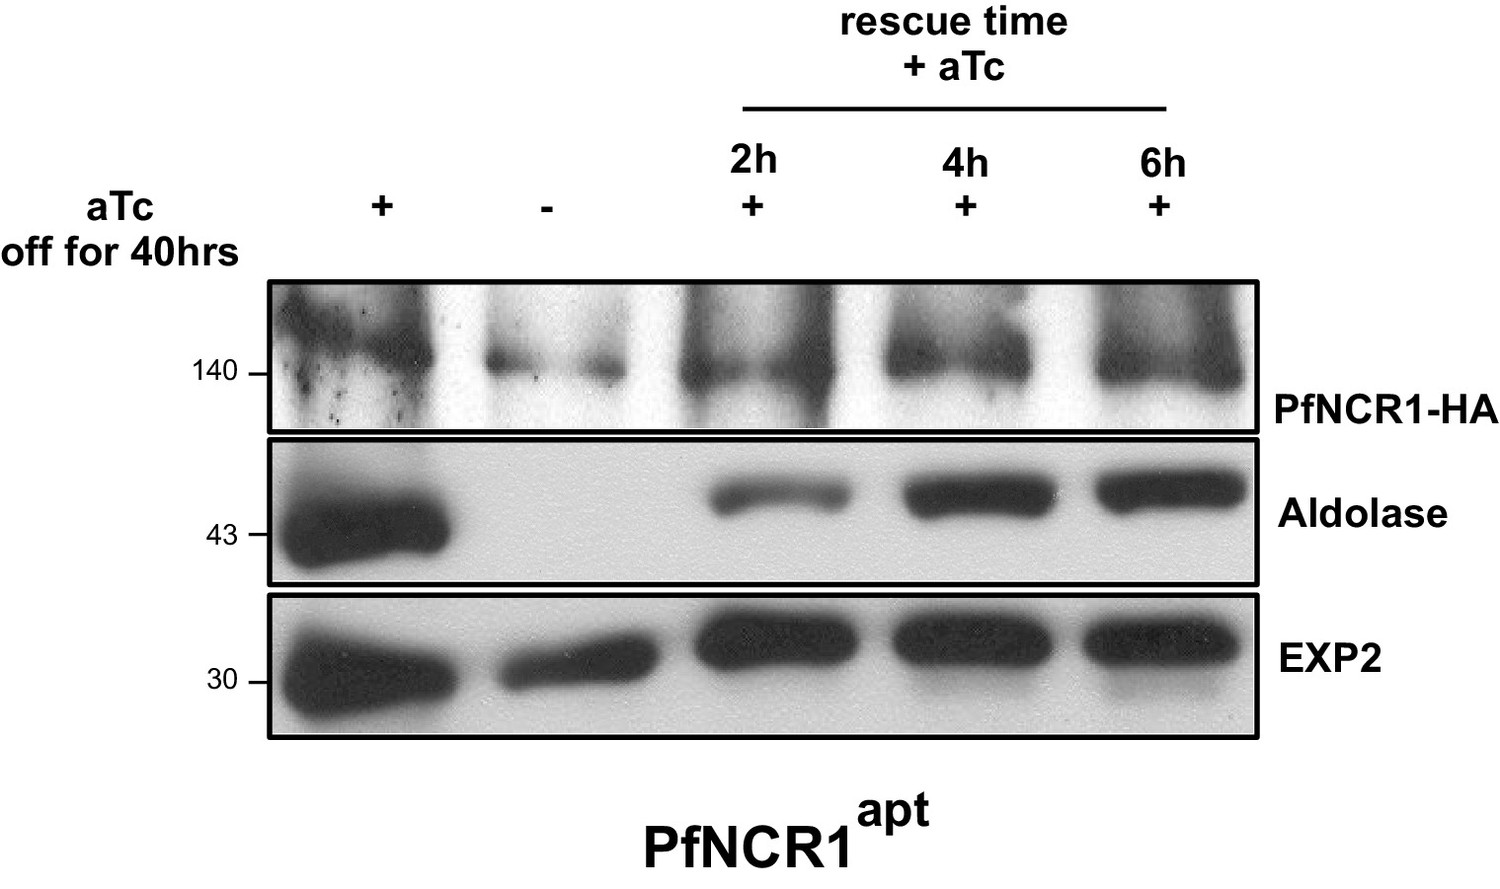
Saponin hypersensitivity after PfNCR1 K/D is reversed rapidly by addition of aTc.
PfNCR1-apt parasites were grown without aTc for 40 hr. aTc was then added back at 2 µM for 2, 4, or 6 hr. Saponin released parasite extracts were analyzed by western blotting for K/D (HA), or leakage of cytosolic content (aldolase). EXP2 was the loading control.
Figure 7 with 2 supplements
PfNCR1 inhibition or K/D impairs digestive vacuole genesis.
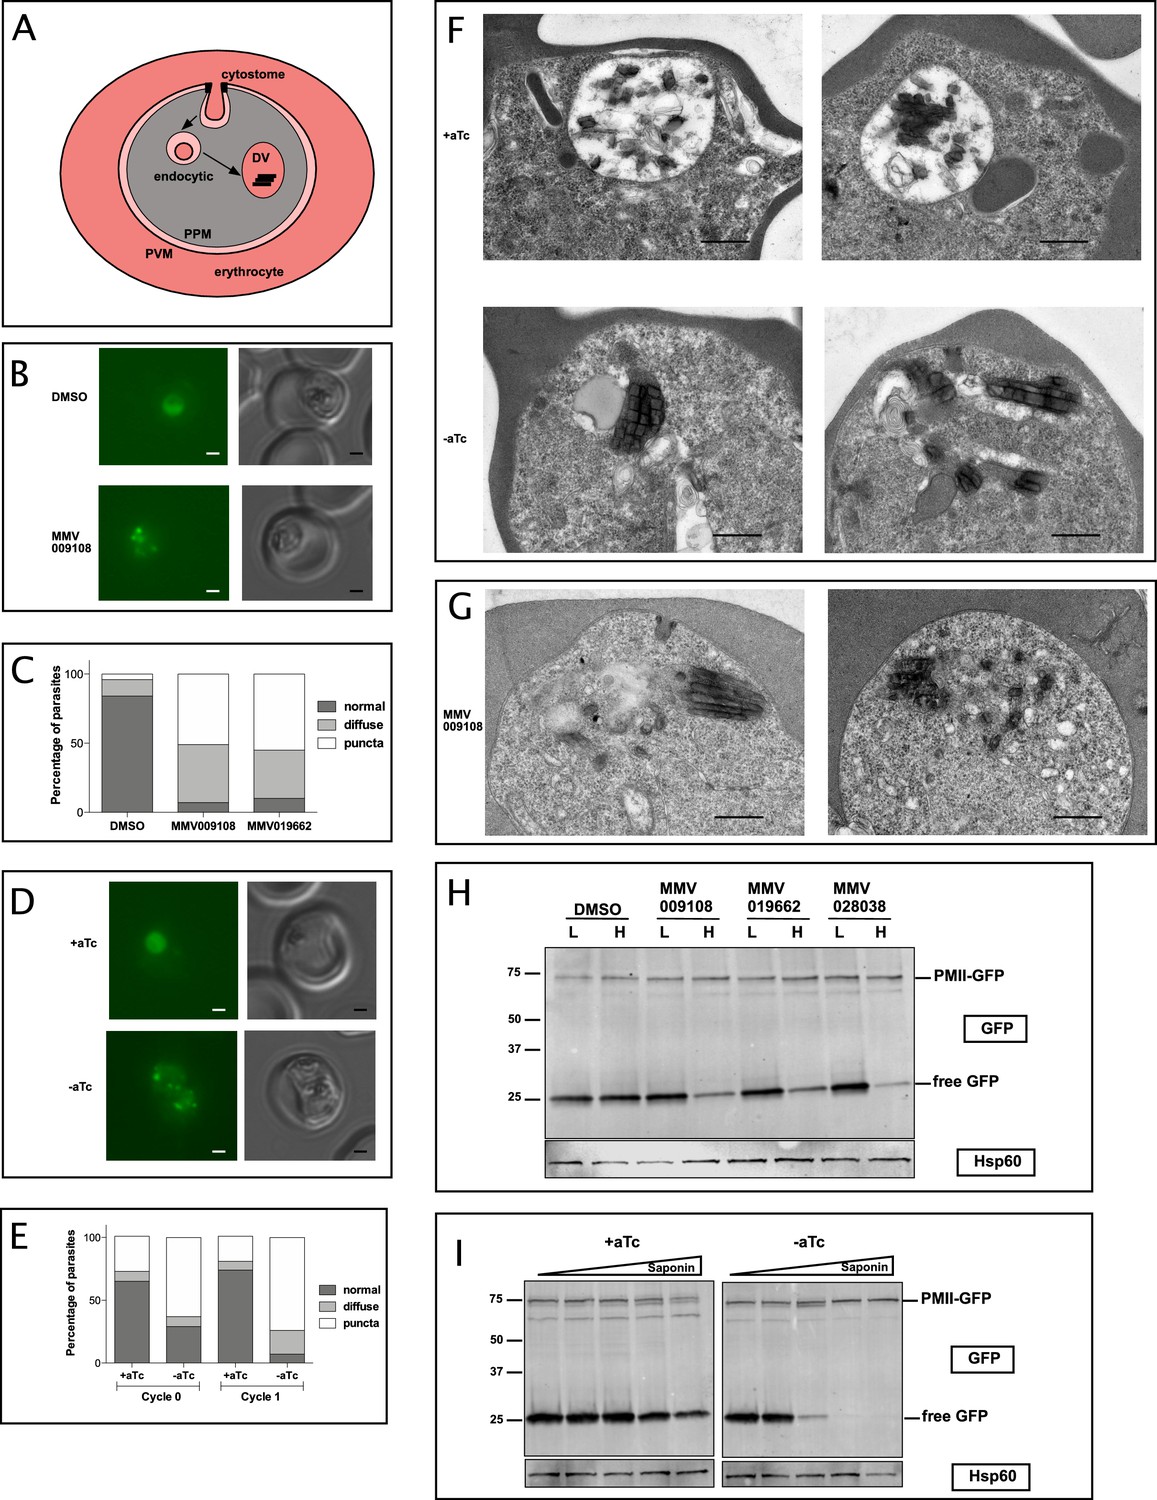
(A) Cartoon of trafficking route to the DV in an infected red blood cell. DV = digestive vacuole; PVM = parasitophorous vacuolar membrane; PPM = parasite plasma membrane. (B) Live microscopy of PMII-GFP parasites after incubation with MMV009108 (1 μM, 3 hr) or with vehicle (DMSO). Scale = 1 μm. (C) Quantitation of abnormal DVs from parasites in (B) after incubation with MMV009108 (N = 43), or MMV019662 (N = 43) or vehicle (DMSO) (N = 77) (1 μM, 3 hr). p<0.0001, Fisher’s exact test. (D) Live microscopy of PfNCR1 K/D parasites expressing PMII-GFP, after removal of aTc. Scale = 1 μm. (E) Quantitation of abnormal DVs from parasites in (D) after aTc washout. Cycle 0 + aTc (N = 93), –aTc (N = 84); cycle 1 + aTc (N = 107), –aTc (N = 116). p<0.0001, Fisher’s exact test. (D and E): cycle 0 = trophozoites after removal of aTc within the same replication cycle (27 hr post washout), cycle 1 = trophozoites after removal of aTc in the preceding replication cycle (68 hr post washout). (F) Transmission electron micrographs of PfNCR1 K/D parasites (clone 2) after aTc removal (68 hr post washout). Scale = 0.5 μm. (G) Transmission electron micrographs of PfNCR1 K/D parasites maintained with aTc and incubated with 500 nM MMV009180 for 1 hr. Scale = 0.5 μm. (H) Western blot analysis of PMII-GFP parasites after treatment with 1 μM compounds for 2 hr. Parasites were released from RBCs with low (L) (0.009%) or high (H) (0.035%) saponin. Top blot was probed with α-GFP antibody, bottom blot (loading control) was probed with α-Hsp60 antibody, an organellar marker. This experiment was done two times. (I) Western blot analysis of PMII-GFP, PfNCR1 K/D parasites after aTc washout for 22 hr. Parasites were released from RBCs with 0.009%, 0.0175%, 0.035%, 0.07% or 0.14% saponin. Top blot was probed with α-GFP antibody, bottom blot (loading control) was probed with α-Hsp60 antibody. This experiment was done two times. Expected size of pro-PMII-GFP=79 kDa, free GFP = 27 kDa.
Figure 7—figure supplement 1
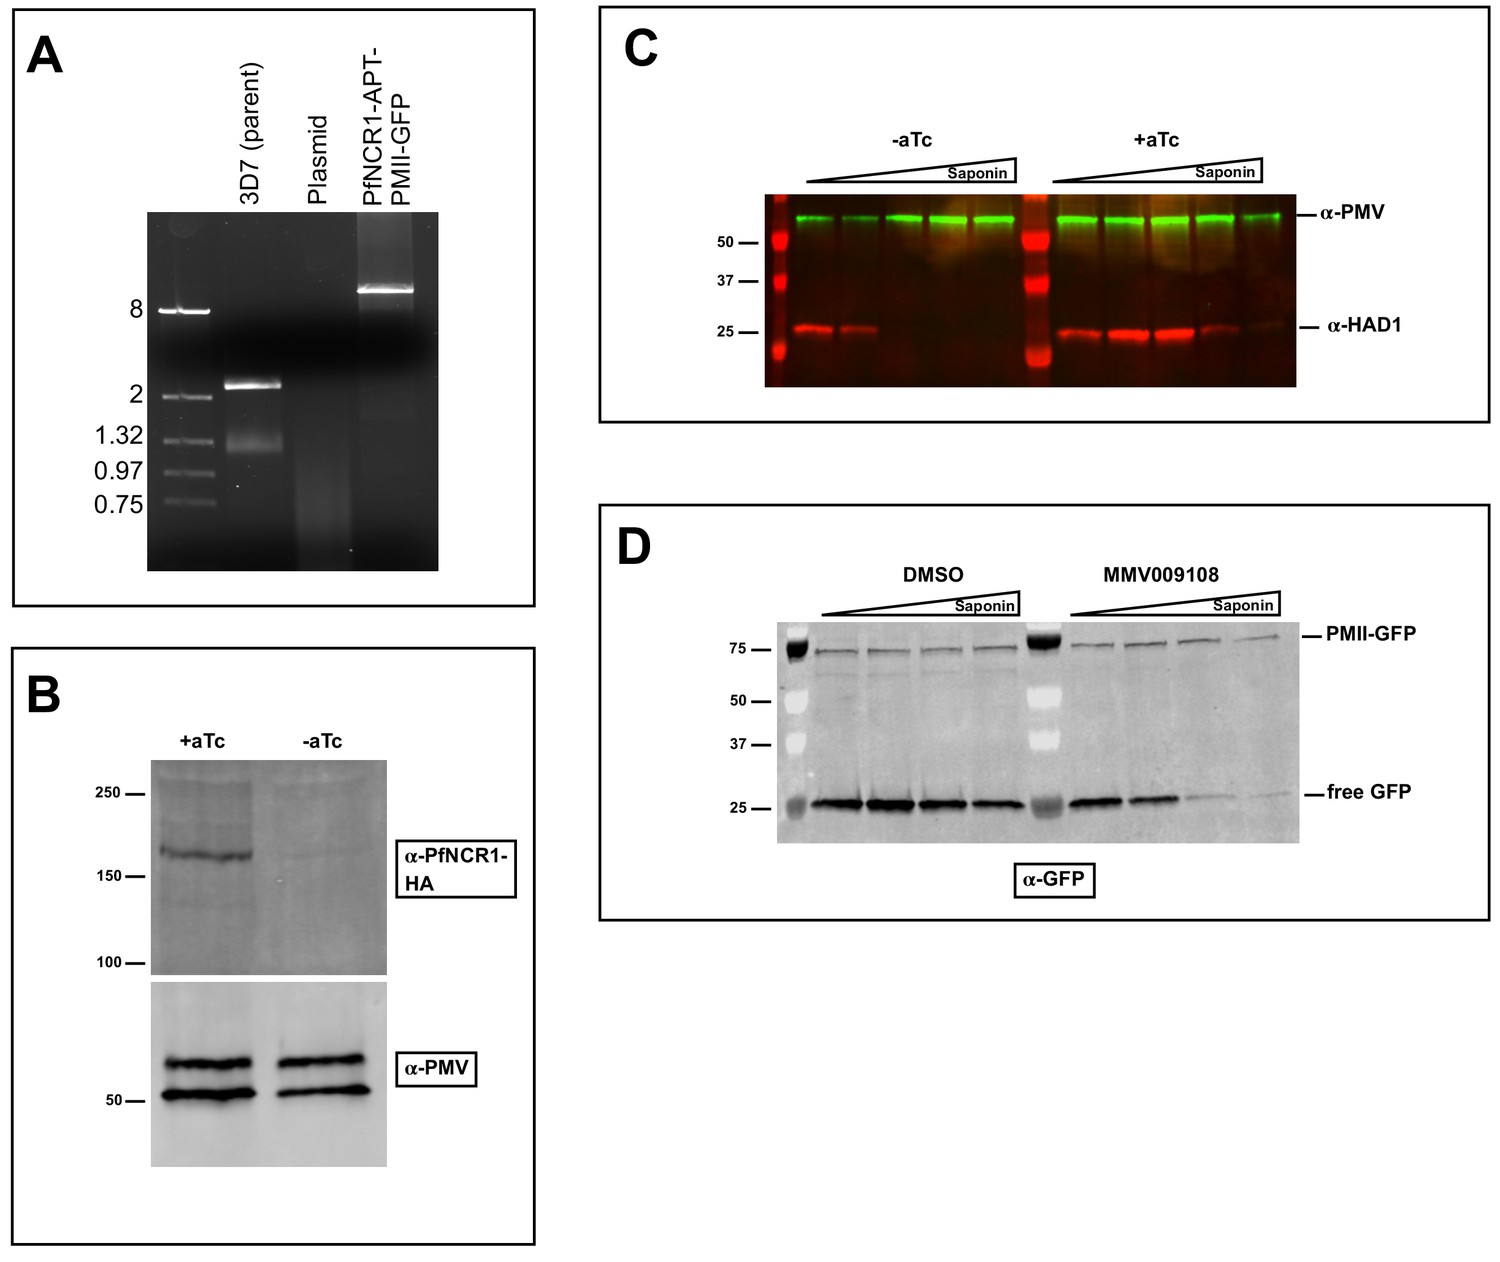
Characterization of strain with PfNCR1apt in PMII-GFP background.
(A) PCR with gDNA preparation from clonal parasites showing integration of K/D construct and disruption of wild-type locus. Expected size for pfncr1 locus is 2.3 kbp, for aptamer-modified locus is 13.1kbp. (B) PfNCR1 expression in PMII-GFP background is regulated by aTc. Image is western blot 22 hr post washout. Top blot was probed with α-HA antibody, bottom blot (loading control) was probed with α-PM-V antibody. (C) Western blot showing premature leakage of cytoplasmic HAD1 protein after aTc washout (22 hr) following saponin isolation of parasites in the PfNCR1 K/D + PMII GFP clone. Blot was probed with α-HAD1 and α-PM-V antibodies. (D) Western blot on osmotically released (5% sorbitol, 5 min, room temperature) PMII-GFP DVs that were treated with increasing saponin concentrations following incubation with MMV009108 (1 μM, 2 hr). This blot was probed with α-GFP antibody. Expected sizes: PfNCR1-HA = 171 kDa, PM-V = 69 kDa, HAD1 = 33 kDa, pro-PMII-GFP=79 kDa, free GFP = 27 kDa.
Figure 7—figure supplement 2
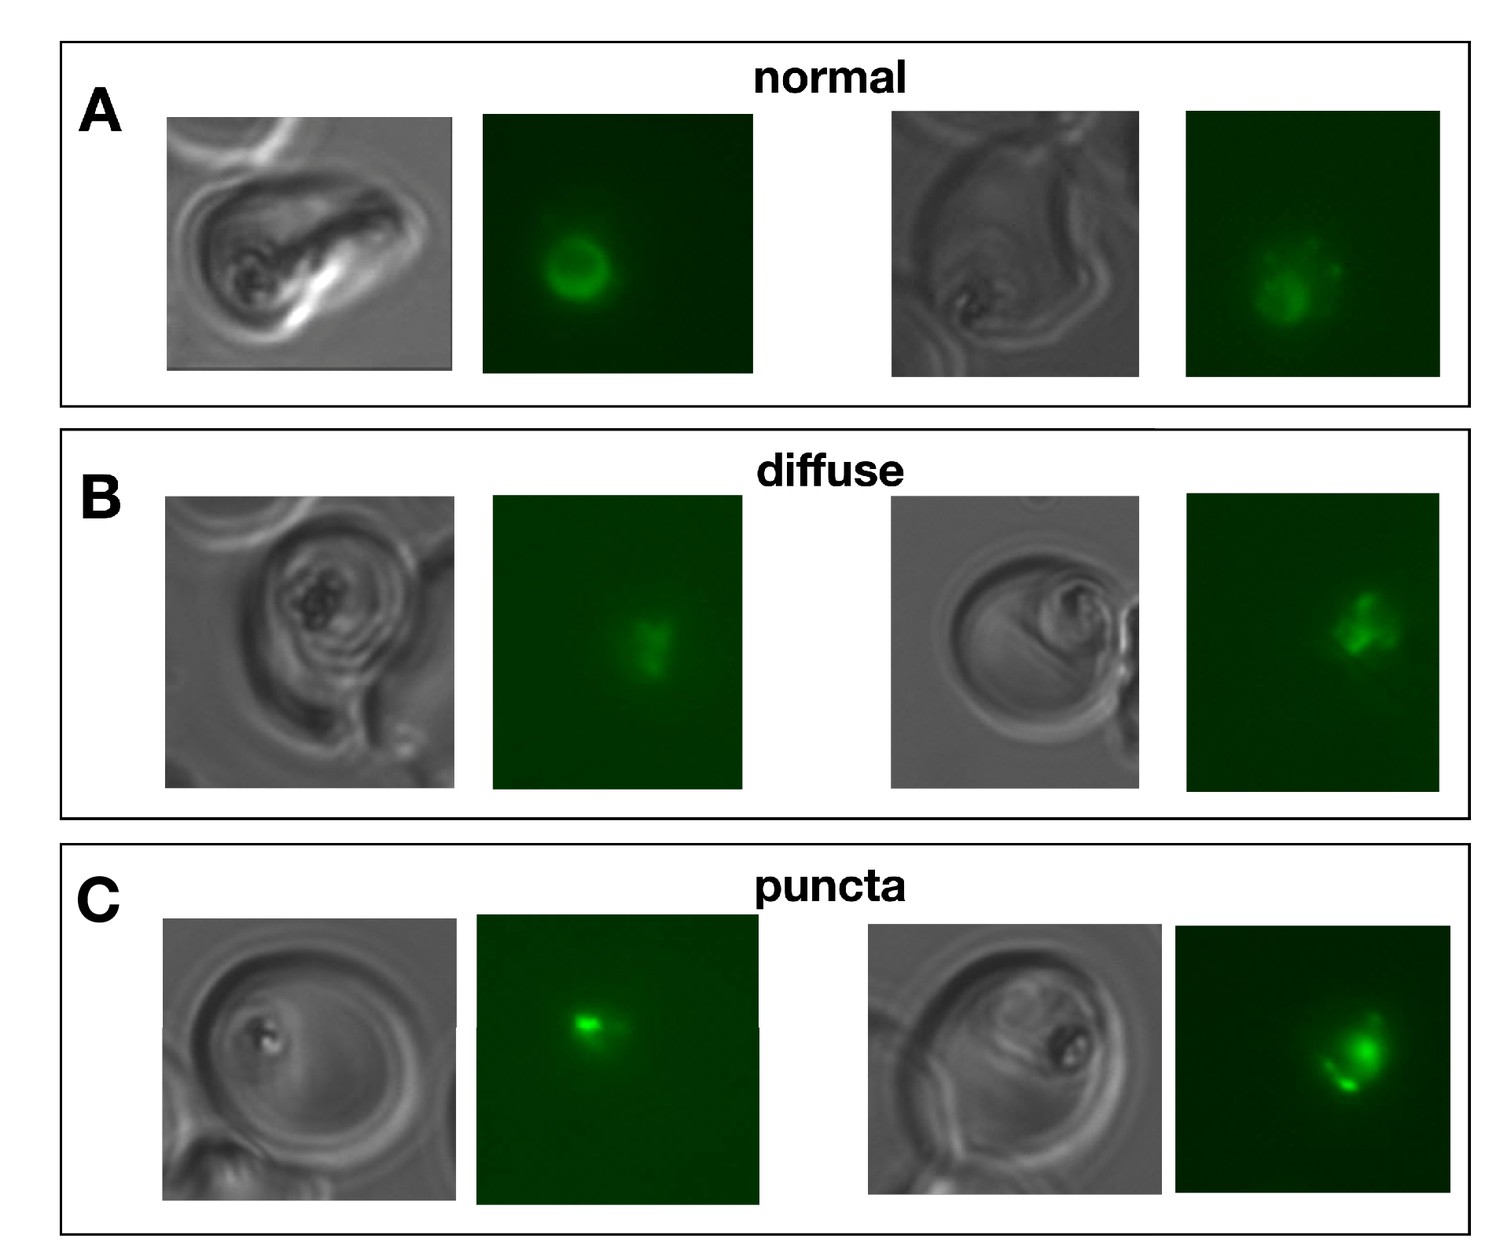
Examples of different digestive vacuole GFP patterns.
Live fluorescence micrographs illustrating DV patterns. (A) normal, (B) diffuse GFP, (C) punctate GFP.
Figure 8
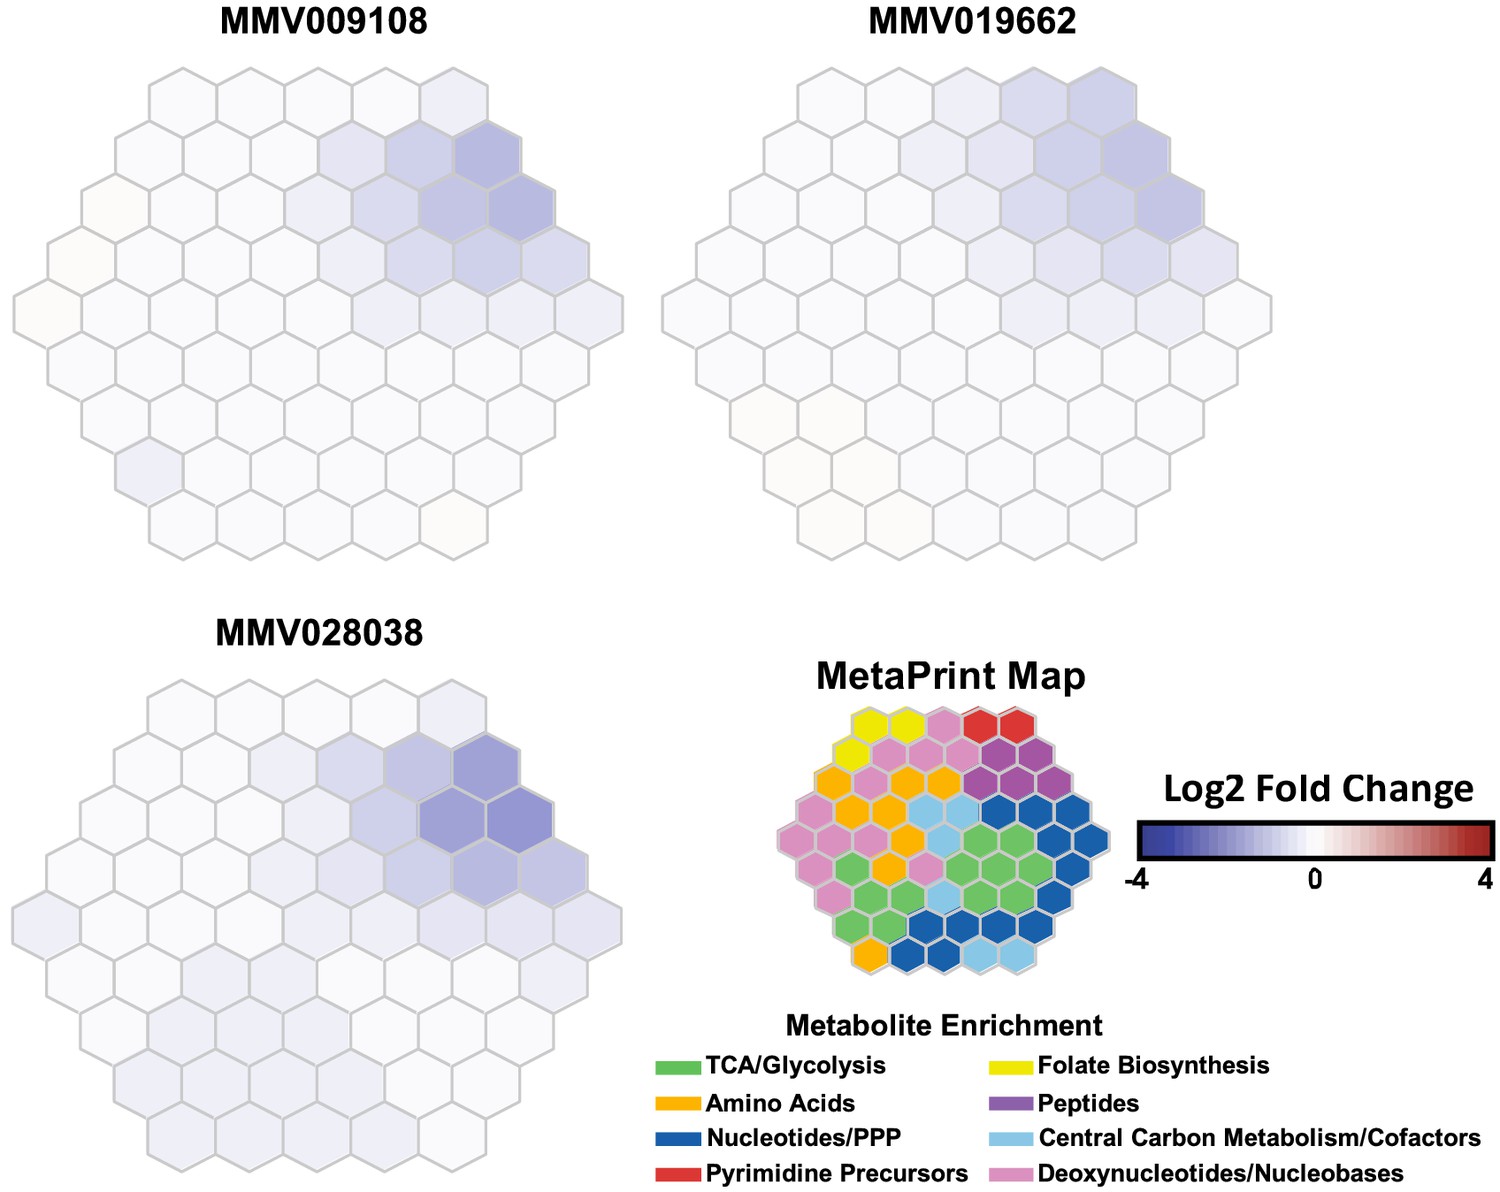
Metabolomic analysis of parasites incubated with PfNCR1 inhibitors.
Mass spectrometry-based metabolic profiling of hydrophilic extracts from parasites (Allman et al., 2016) exposed to the three PfNCR1-targeting MMV compounds depicts a depletion in hemoglobin-derived peptides. Each panel represents incubation with a different compound and is an average of two experiments (each containing triplicates). These Metaprint representations (Fang and Gough, 2014) also demonstrate a highly similar metabolic response upon drug treatment with these compounds.
-
Figure 8—source data 1
Log2 fold changes of treated versus untreated controls.
Values for 109 metabolites are listed. Atovaquone was used as a control. Sheet one (‘Data’) contains averages of technical triplicates for each biological replicate. Sheet two (‘AVGs’) contains averages of the biological replicate. Data were normalized via an isotope-labelled internal standard, 13C15N-Aspartate.
- https://doi.org/10.7554/eLife.40529.025
Additional files
-
Supplementary file 1
Primers used in this manuscript.
- https://doi.org/10.7554/eLife.40529.026
-
Transparent reporting form
- https://doi.org/10.7554/eLife.40529.027
Download links
A two-part list of links to download the article, or parts of the article, in various formats.
Downloads (link to download the article as PDF)
Open citations (links to open the citations from this article in various online reference manager services)
Cite this article (links to download the citations from this article in formats compatible with various reference manager tools)
Plasmodium Niemann-Pick type C1-related protein is a druggable target required for parasite membrane homeostasis
eLife 8:e40529.
https://doi.org/10.7554/eLife.40529


