Defining host–pathogen interactions employing an artificial intelligence workflow
- The Francis Crick Institute, United Kingdom
- University College London, United Kingdom
Figures
Figure 1

Overview of the HRMAn pipeline.
Following image acquisition, on a high-content imaging platform or any other fluorescence microscope, the images can be loaded into the HRMAn software. First, the data is pre-processed and clustered based on user-defined parameters and provided plate maps. Images then undergo illumination correction and automated segmentation using Huang algorithm. Segmented images are used by a deep convolution neural network (CNN) and other machine learning based algorithms to analyze infection of cells with intracellular pathogens. Depicted is the CNN diagram representing two-dimensional convolutional filters with respective width, height and depth designated on filters facets. Respective change of stride in the groups of hidden layers is depicted above the diagram, while respective activation functions below the diagram. Finally, the data is written as a single file and will provide the researcher with more than 15 different readouts that describe the interaction between pathogen and host cell during infection. HRMAn is based on the open-source data integration environment KNIME Analytics Platform making it modular and adaptable to a researcher’s needs. The analysis is based on training of the machine learning algorithms generating high flexibility, which can be tailored to the needs of the user.
Figure 2 with 1 supplement
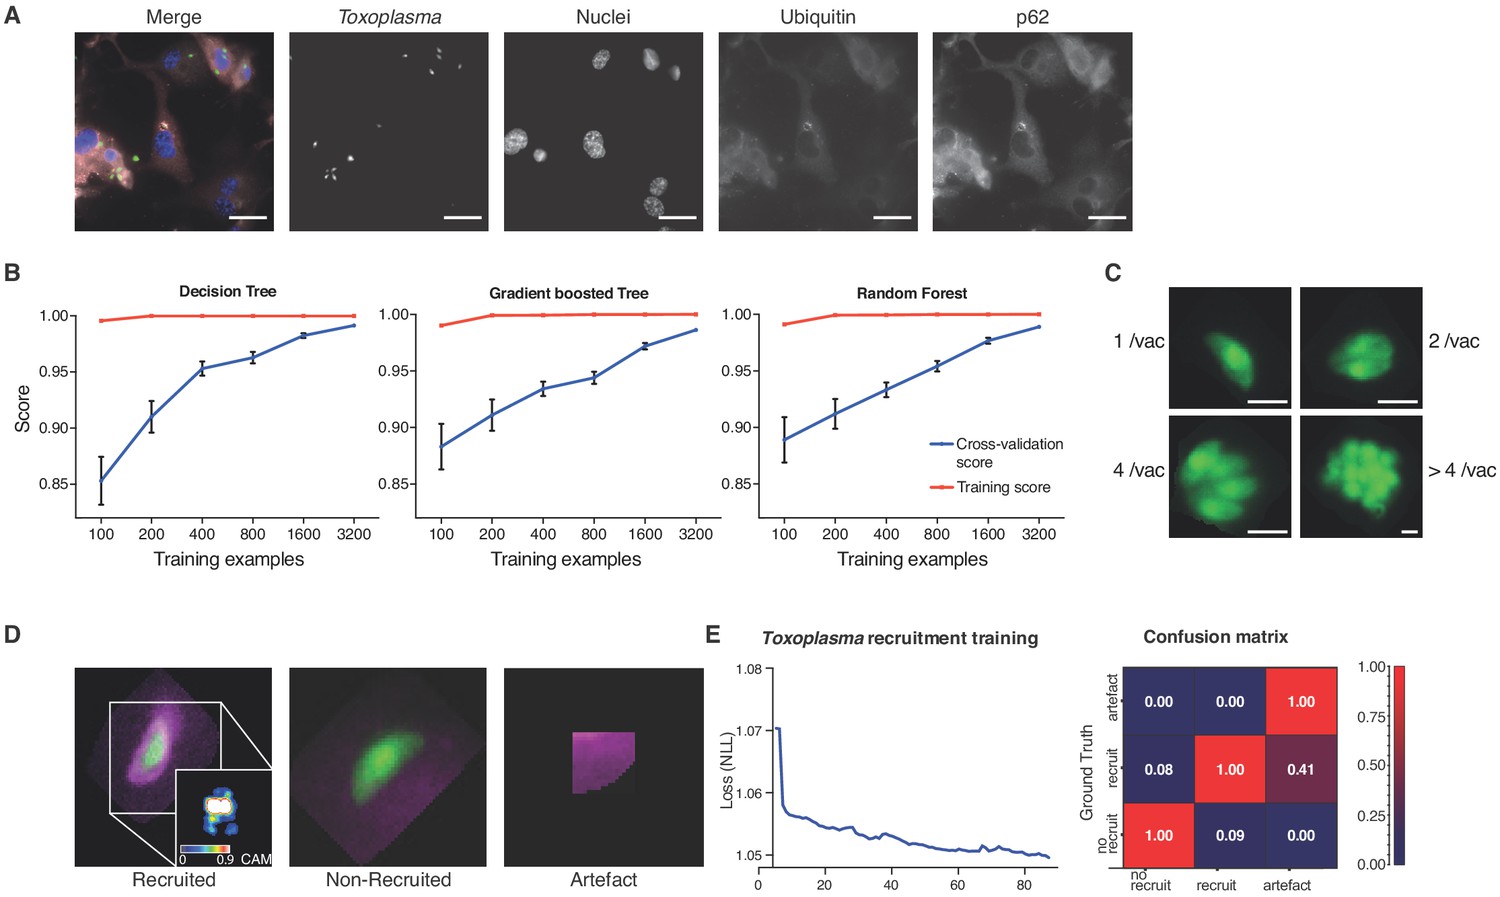
Decision-tree and convolutional neural network training for pathogen replication and host defense protein recruitment analysis.
(A) Example images from one field of view. A composite image of all channels (blue: nuclei, green: Tg, red: Ubiquitin, grey: p62) and the single channel images are shown. Scale bar indicates a distance of 30 μm. (B) Training and cross-validation of different machine learning classification algorithms to predict parasite replication. (C) Example images of different vacuoles with the resulting classification of a trained decision tree classifier. Scale bar, 5 μm. (D) Resulting classification of the trained deep convolution neural network (CNN) with example vacuoles. For the recruited classification a class activation map (CAM) is depicted to illustrate the focus of the CNN. (E) Decrease of negative log likelihood (NLL) used as loss function during CNN training over training cycles (epochs) for Toxoplasma gondii model (left) and confusion matrix of Toxoplasma gondii model validation illustrating classification accuracy of labelled data unseen by the model, classification accuracy (0 to 1) during validation is colour-coded blue to red and indicated in the figure (right).
Figure 2—figure supplement 1
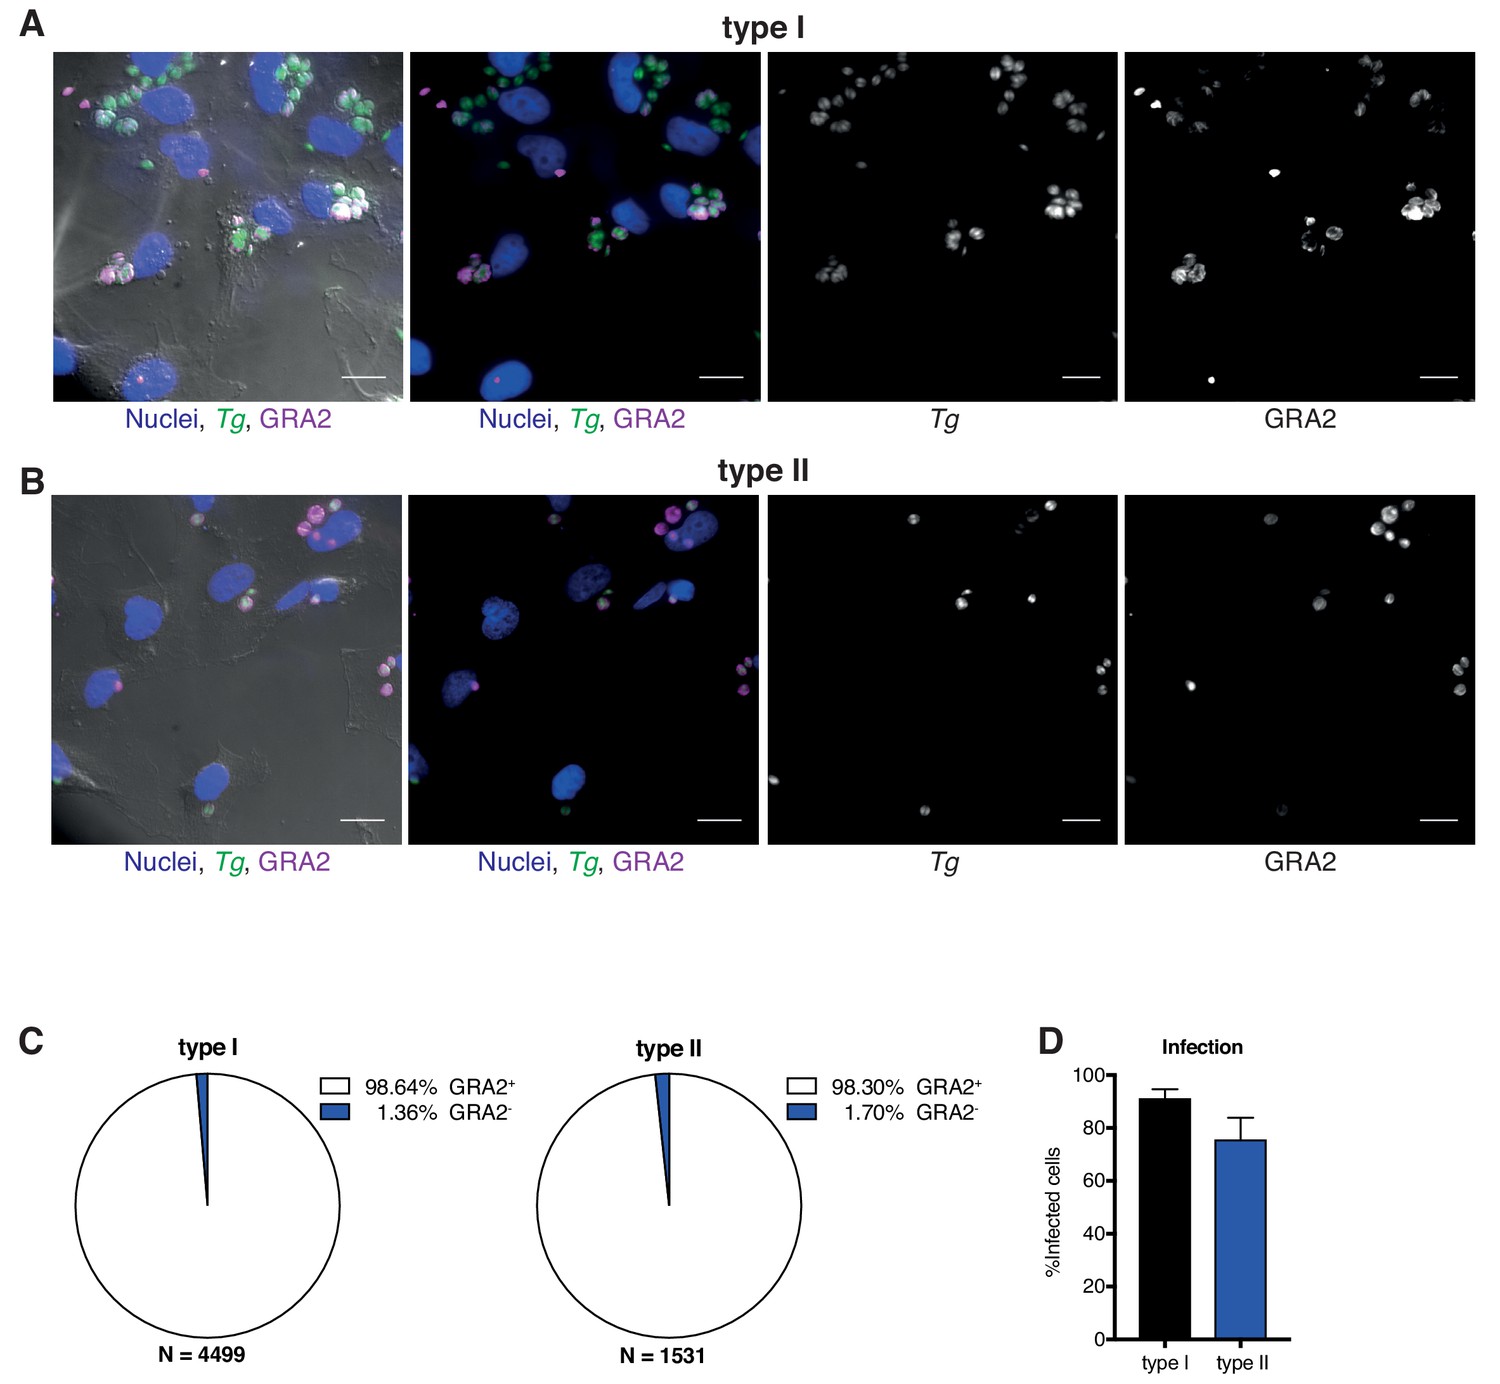
Infection of HeLa cells with Toxoplasma gondii at 6 hr post-infection.
(A–B) HeLa cells were infected with either type I (RH) Toxoplasma gondii (Tg) (A) or type II (Pru) Tg (B) and underwent a stringent washing procedure to eliminate uninvaded parasites. Infected cells were stained with anti-GRA2 (purple) to illustrate vacuole establishment. Scale bar indicates a distance of 20 μm. (C) Quantification of GRA2 positive vacuoles for type I and type II Tg-infected cells. (D) Quantification of infected cells as proportion of all captured cells. Data shown in (C) and (D) represents the mean of N = 3 experiments±SEM, N = total number of vacuoles analyzed in the course of three experiments.
Figure 3 with 7 supplements
Analysis of Toxoplasma gondii infection in IFNγ-treated HeLa cells.
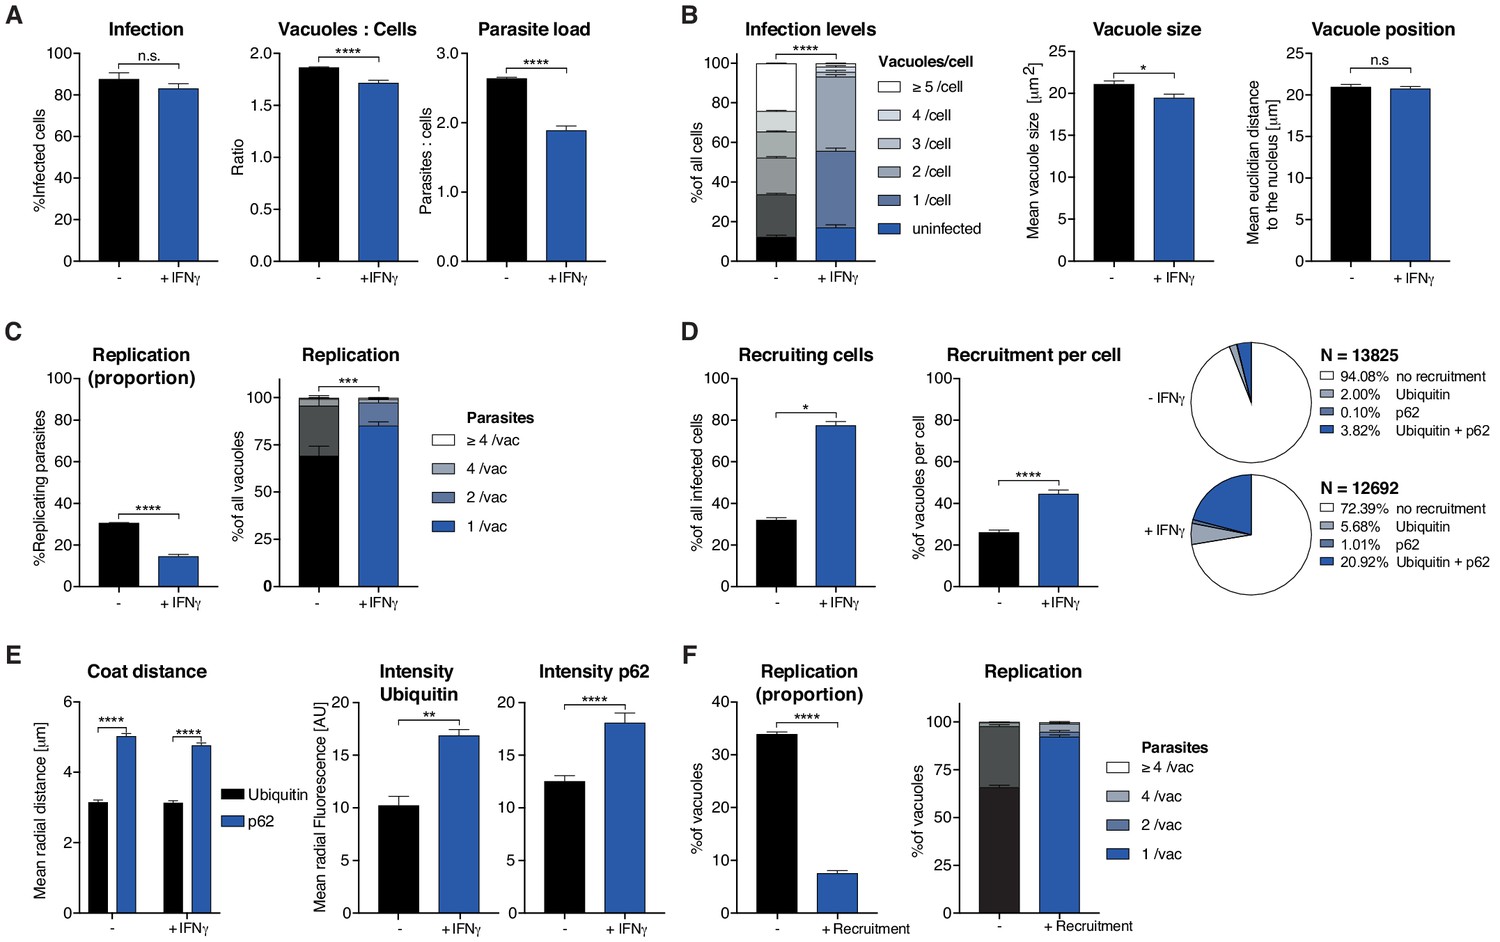
HeLa cells were stimulated with 100 IU/mL IFNγ, infected with type I (RH) Toxoplasma gondii (Tg) and analyzed 6 hr post-infection. (A) Infection parameters depicted as total percent of Tg infected cells, the ratio of Tg vacuoles to cells and the ratio of parasites to cells. (B) Cellular readouts showing the proportion of cells that contain a varying numbers of parasite vacuoles, the mean vacuole size of Tg and the vacuole position as the value of the mean Euclidian distance of Tg vacuoles to the host cell nucleus. (C) Replication capacity of Tg shown as the proportion of replicating parasites and the distribution of replicating Tg. (D) Cellular response to infection with Tg measured as the percentage of cells that decorate vacuoles and the average proportion of vacuoles per cell that are being decorated simultaneously and the overall proportion of ubiquitin and/or p62 decorated Tg vacuoles. N shows the total number of vacuoles analyzed for each condition, percentages are indicated in the legend. (E) Properties of the host protein coat on Tg vacuoles as the average coat distance for ubiquitin and p62 to Tg and mean fluorescence intensity of ubiquitin and p62 at Tg vacuoles. (F) Fate of Tg vacuoles grouped based on host protein recruitment. The proportion of replicating parasites and the replication distribution based on recruitment status of the vacuole are shown. All data shown above represent the mean of N = 3 experiments±SEM. Significance was determined using unpaired t-tests, n.s. = not significant, *p≤0.05; **p≤0.01, ***p≤0.001, ****p≤0.0001.
Figure 3—figure supplement 1
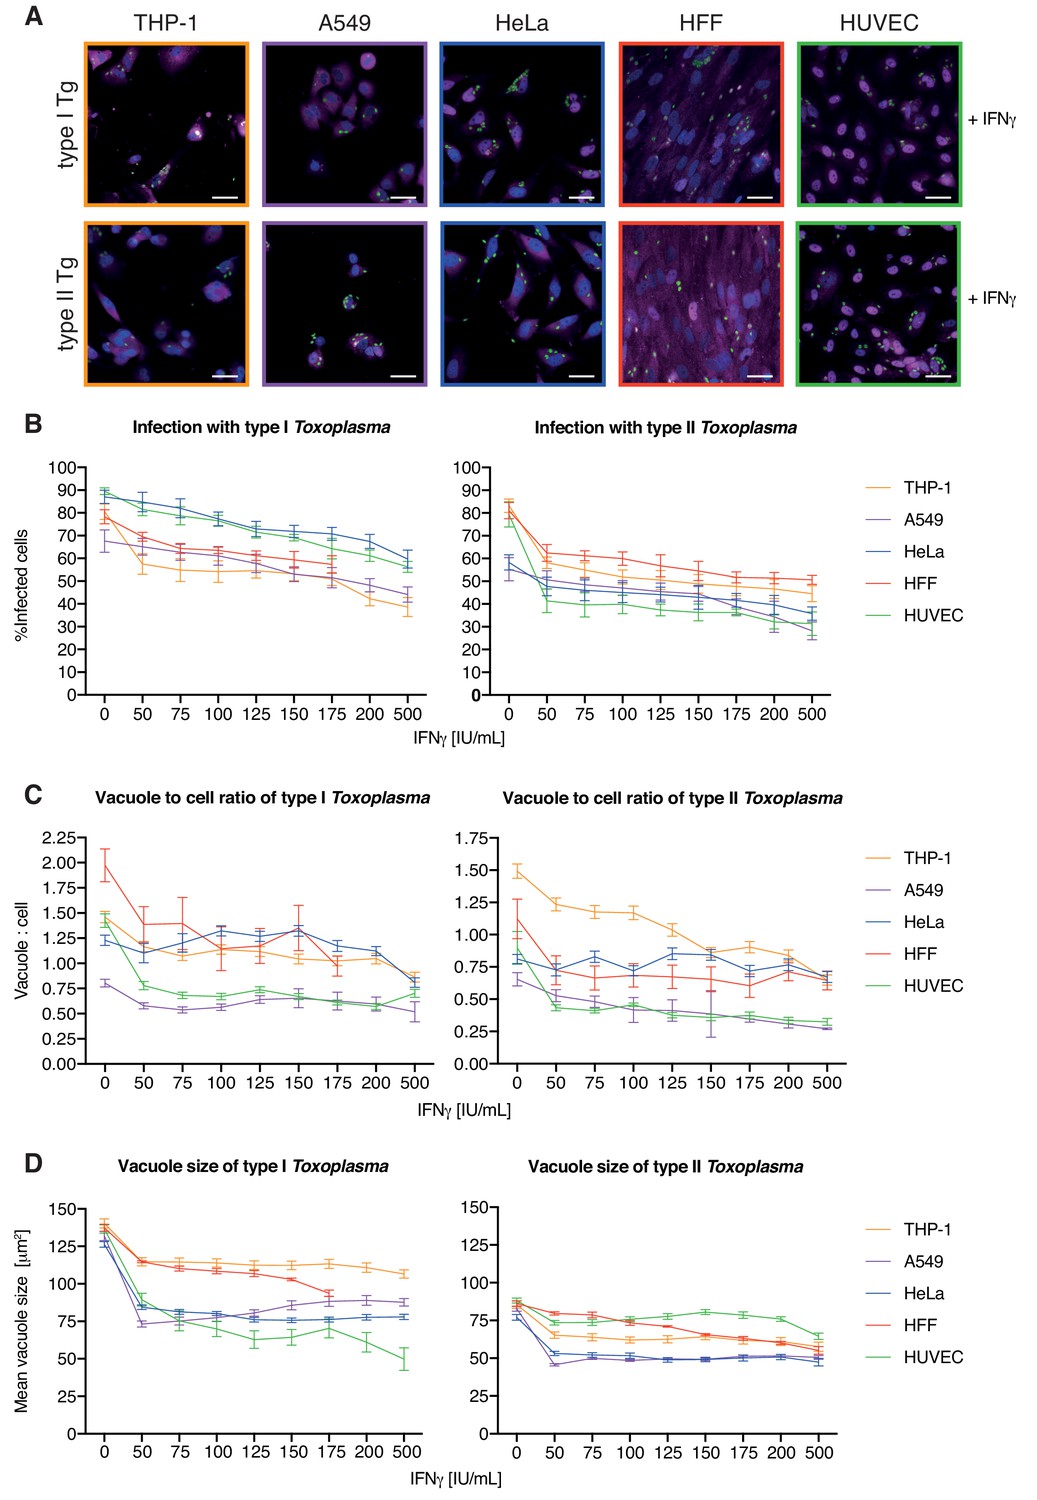
IFNγ dose-dependent killing and replication-inhibition of Toxoplasma gondii in five human cell types at 24 hr post-infection.
(A) Example images employed to analyze the cellular response to Toxoplasma gondii (Tg) infection dependent on different dosages of IFNγ pre-treatment for these five different human cell lines: macrophage-like, PMA-differentiated THP-1s (yellow), alveolar-epithelial tumor cells A549 (purple), the cervical cancer cell line HeLa (blue), human foreskin fibroblasts (HFF, red) and primary human umbilical vein endothelial cells (HUVEC, green). Scale bar indicates a distance of 30 μm. All images represent conditions pre-treated with 100 IU/mL IFNγ. (B–D) Host–pathogen interaction parameters of Tg type I and II infection were analyzed with HRMAn 24 hr post-infection. (B) Percent Tg infected cells, (C) ratio between Tg vacuoles and cells and (D) the mean vacuole size of Tg. All data shown above represent the mean of N = 3 experiments±SEM.
Figure 3—figure supplement 2
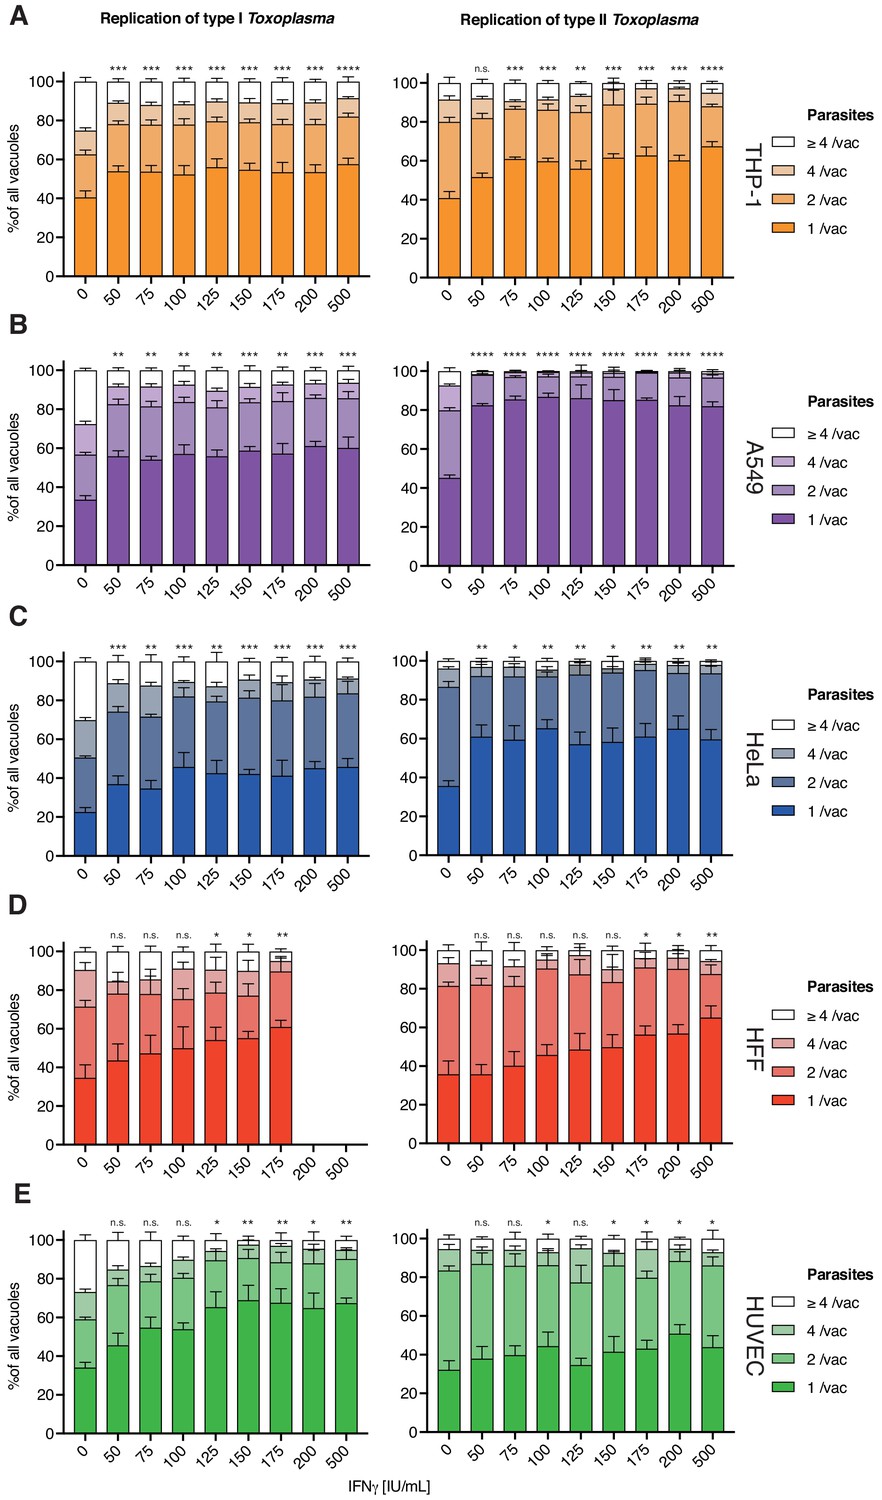
IFNγ dose-dependent replication-inhibition of Toxoplasma gondii in five human cell types analyzed as parasites per vacuole at 24 hr post-infection.
(A–E) Mean vacuole size of Toxoplasma gondii (Tg) dependent on different dosages of IFNγ pre-treatment for five different human cell lines converted to number of parasites per vacuole as per HRMAn decision tree machine learned algorithm. Plotted are the distribution of vacuoles that contain one parasite, two, four or more than four parasites. Data shown was recorded 24 hr post-infection. Growth restriction of type I (RH) Tg (left) or type II (Pru) Tg (right) in THP-1 cells (A), A549 cells (B), HeLa cells (C), HFF (D) and HUVECs (E). All data shown above represent the mean of N = 3 experiments±SEM. Significance was determined using non-parametric one-way Anova, n.s. = not significant, *p≤0.05; **p≤0.01, ***p≤0.001, ****p≤0.0001.
Figure 3—figure supplement 3
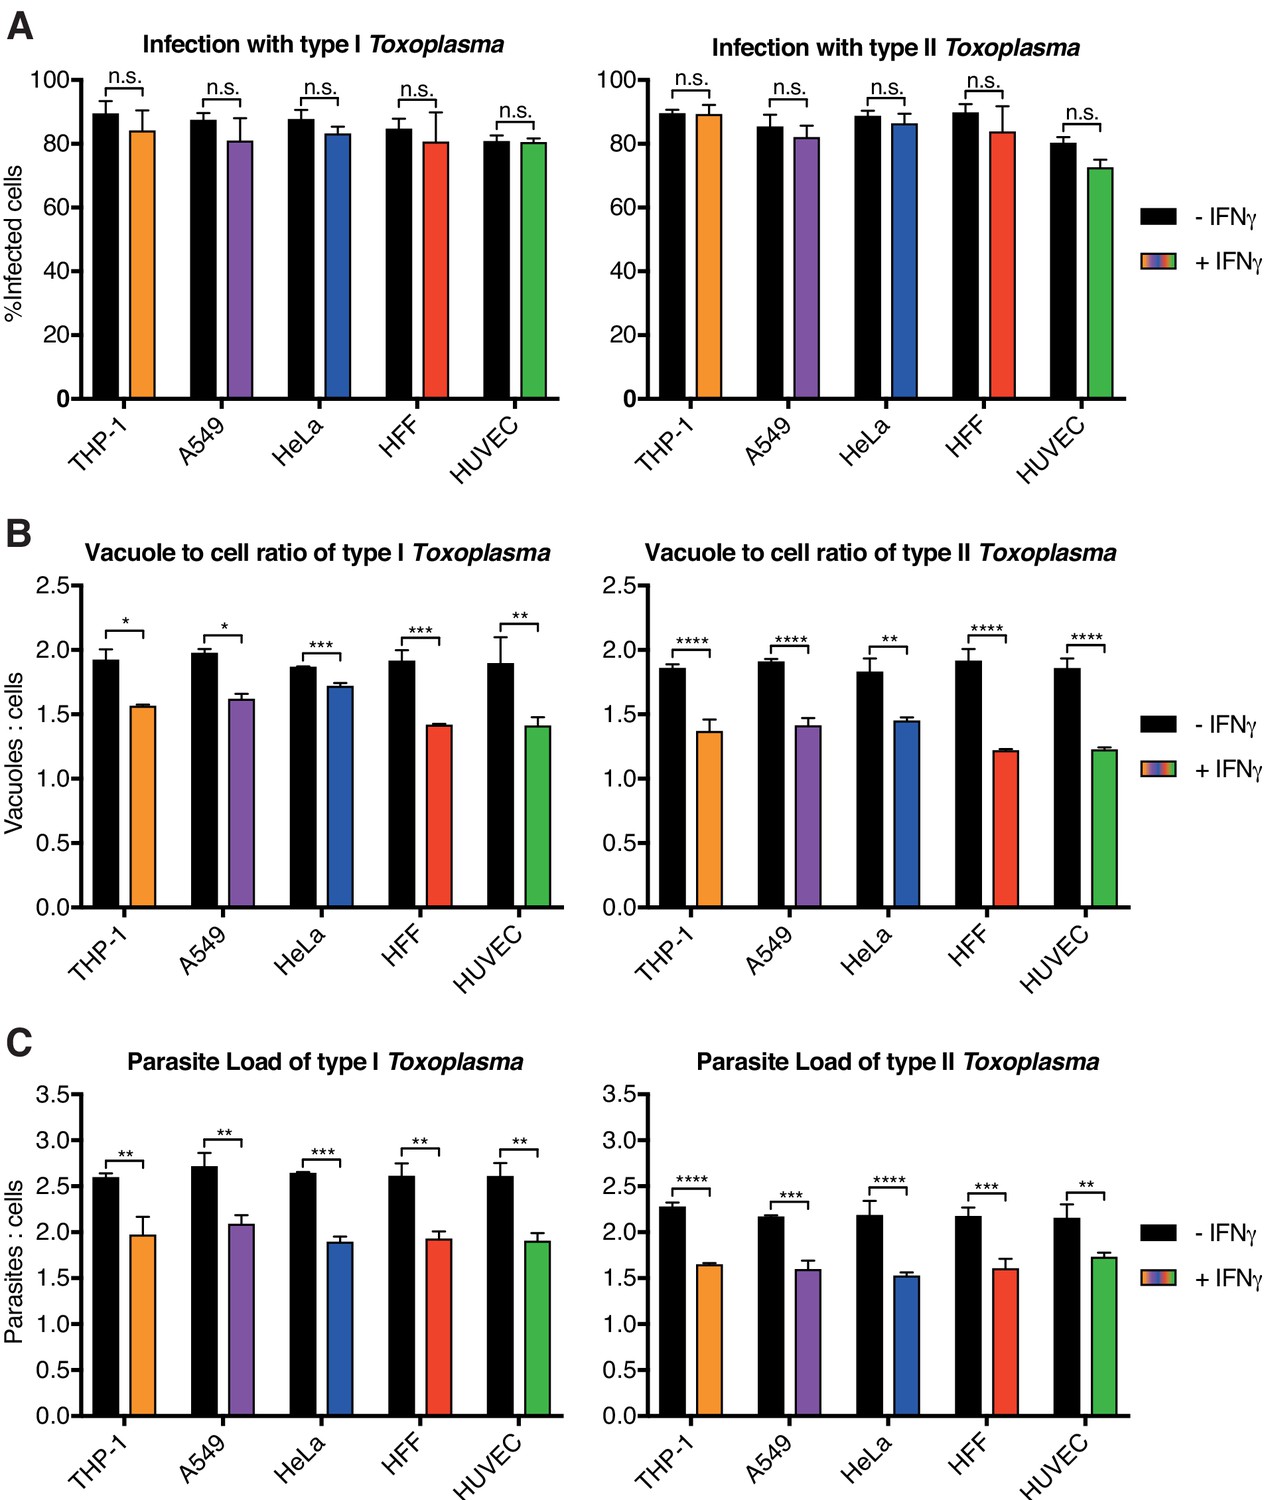
Systematic analysis of IFNγ-dependent cellular control of Toxoplasma gondii infection of 5 human cell types at 6 hr post-infection.
Analysis of the proportion of cells infected with type I (RH) and type II (Pru) Toxoplasma gondii (Tg) in IFNγ-treated five human cell types. (A) Total percent infected cells for all cell lines tested, (B) the ratio of Tg vacuoles to cells and (C) the ratio of total number of individual parasites to cells. All data shown above represent the mean of N = 3 experiments±SEM. Significance was determined using unpaired t-tests, n.s. = not significant, *p≤0.05; **p≤0.01, ***p≤0.001, ****p≤0.0001.
Figure 3—figure supplement 4
Systematic analysis of IFNγ-dependent replication control of Toxoplasma gondii infection of 5 human cell types at 6 hr post-infection.
Measuring the infectivity and position of type I (RH) and type II (Pru) Toxoplasma gondii (Tg). (A) The proportion of cells that contain a certain number of parasite vacuoles, (B) the mean vacuole size of Tg, (C) Value of the mean euclidian distance of Tg vacuoles to the host cell nucleus. All data shown above represents the means of N = 3 experiments±SEM. Significance was determined using unpaired t-tests, n.s. = not significant, *p≤0.05; **p≤0.01, ***p≤0.001, ****p≤0.0001.
Figure 3—figure supplement 5
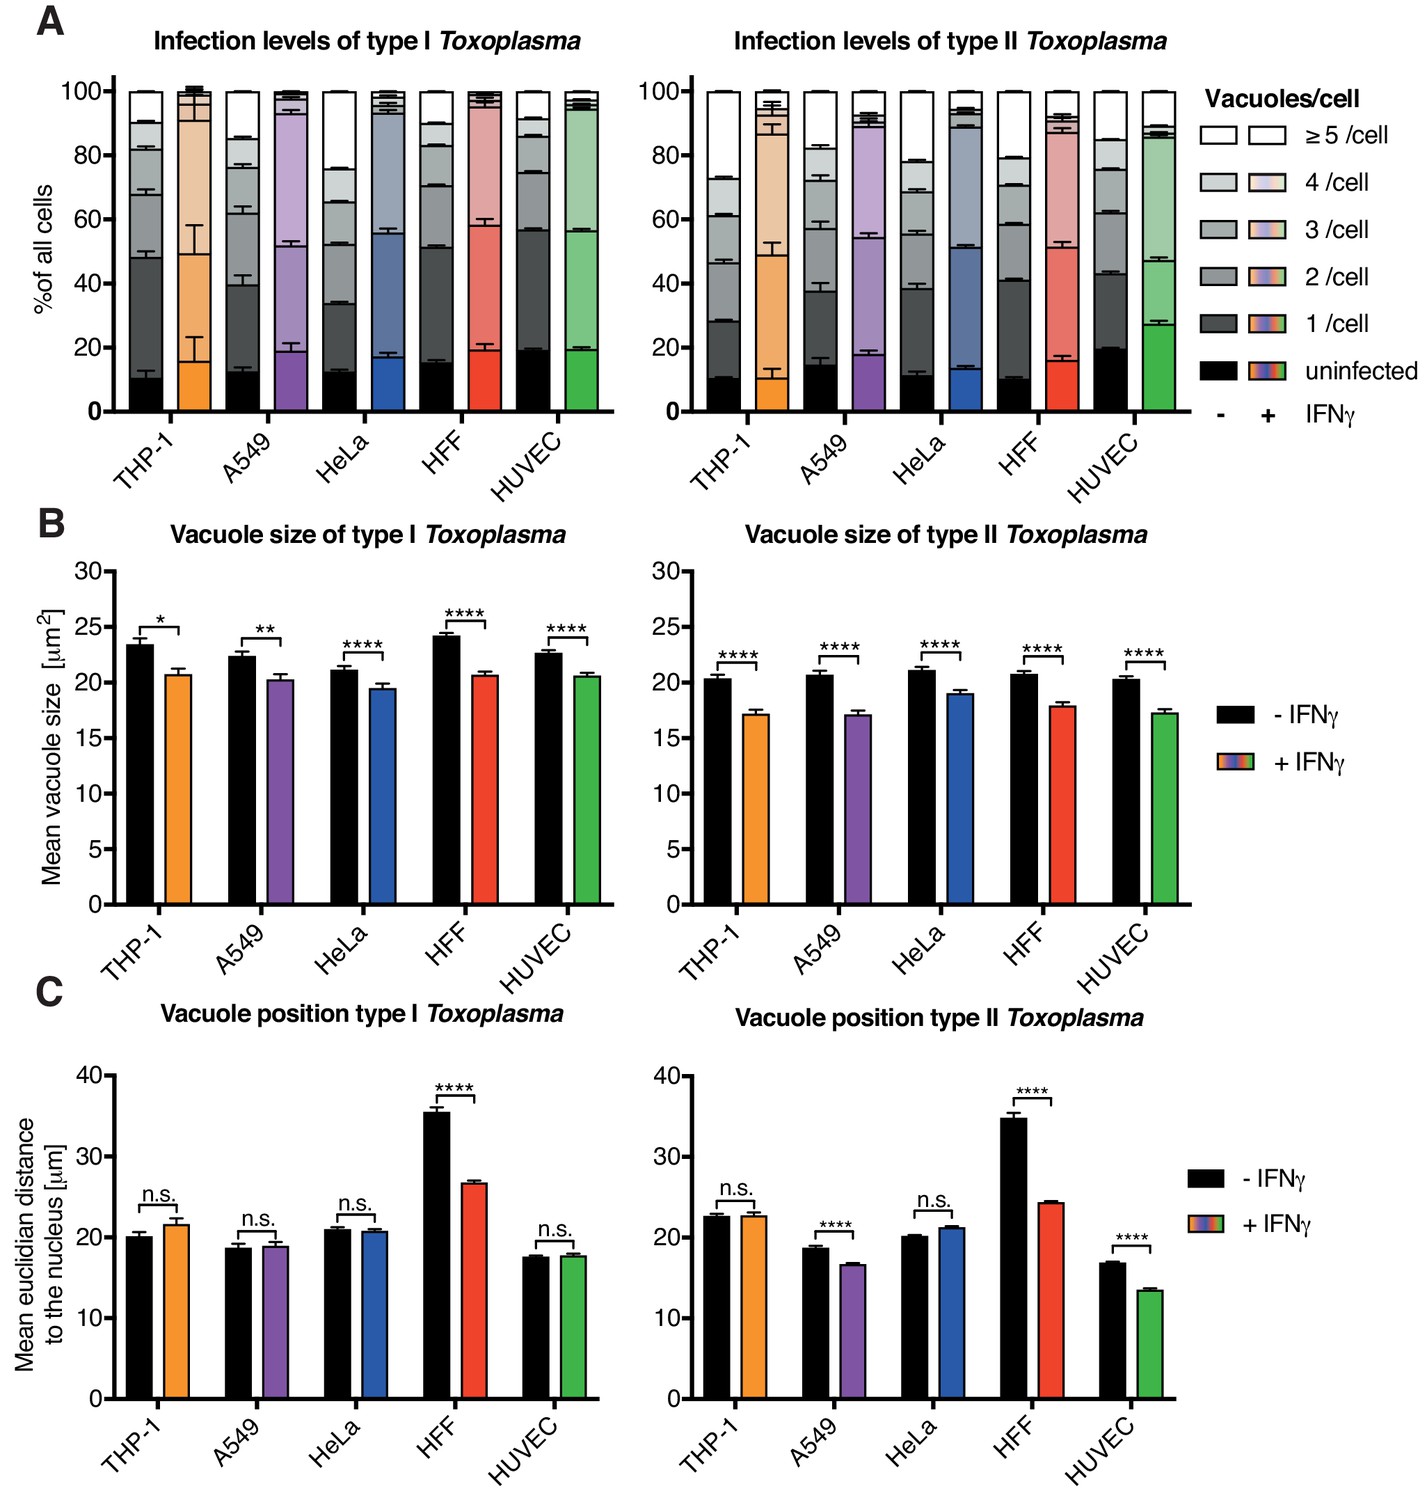
Systematic analysis of IFNγ-dependent replication control of Toxoplasma gondii infection of 5 human cell types at 6 hr post-infection analyzed as parasites per vacuole.
Measuring the replication capacity of type I (RH) and type II (Pru) Toxoplasma gondii (Tg). (A) The proportion of replicating parasites, (B) the distribution of replicating Tg. All data shown above represents the means of N = 3 experiments±SEM. Significance was determined using unpaired t-tests, n.s. = not significant, *p≤0.05; **p≤0.01, ***p≤0.001, ****p≤0.0001.
Figure 3—figure supplement 6

Ubiquitin and p62 host protein recruitment to Toxoplasma gondii type I and II vacuoles in 5 IFNγ-treated human cell lines at 6 hr post-infection.
Cellular response to type I (RH) and type II (Pru) Toxoplasma gondii (Tg) infection. (A) Percentage of infected cells that respond to Tg infection by decorating at least one vacuole with either ubiquitin, p62 or both. (B) Proportion of vacuoles one cell can decorate with ubiquitin or p62 or both simultaneously. (C) Depicted are the average percentages Tg vacuoles decorated with host protein. Exact proportions can be found in the legend. The number of vacuoles analyzed is indicated. All data shown above represent the mean of N = 3 experiments±SEM. Significance was determined using unpaired t-tests, n.s. = not significant, *p≤0.05; **p≤0.01, ***p≤0.001, ****p≤0.0001.
Figure 3—figure supplement 7

Characterization of the effect of host protein coating of Toxoplasma gondii type I and II vacuoles in 5 IFNγ-treated human cell lines at 6 hr post-infection.
(A–B) Radial fluorescence intensity of host proteins around decorated type I (RH) and type II (Pru) Toxoplasma gondii (Tg) vacuoles. (A) Analysis of the coat distance to the centroid of Tg for ubiquitin and p62. (B) Intensity of the ubiquitin and p62 stain at the Tg vacuole. Significance was determined using unpaired t-tests, n.s. = not significant, *p≤0.05; **p≤0.01, ***p≤0.001, ****p≤0.0001. (C–D) Fate of Tg vacuoles grouped based on host protein recruitment. (C) Combined replication and recruitment analysis for non-decorated Tg vacuoles versus vacuoles co-decorated with ubiquitin and p62. (D) Replication distribution of Tg parasites contained in vacuoles with or without ubiquitin and p62 decoration. Significance was determined using unpaired t-tests, n.s. = not significant, *p≤0.05; **p≤0.01, ***p≤0.001, ****p≤0.0001. All data shown above represents the means of N = 3 experiments±SEM.
Figure 4
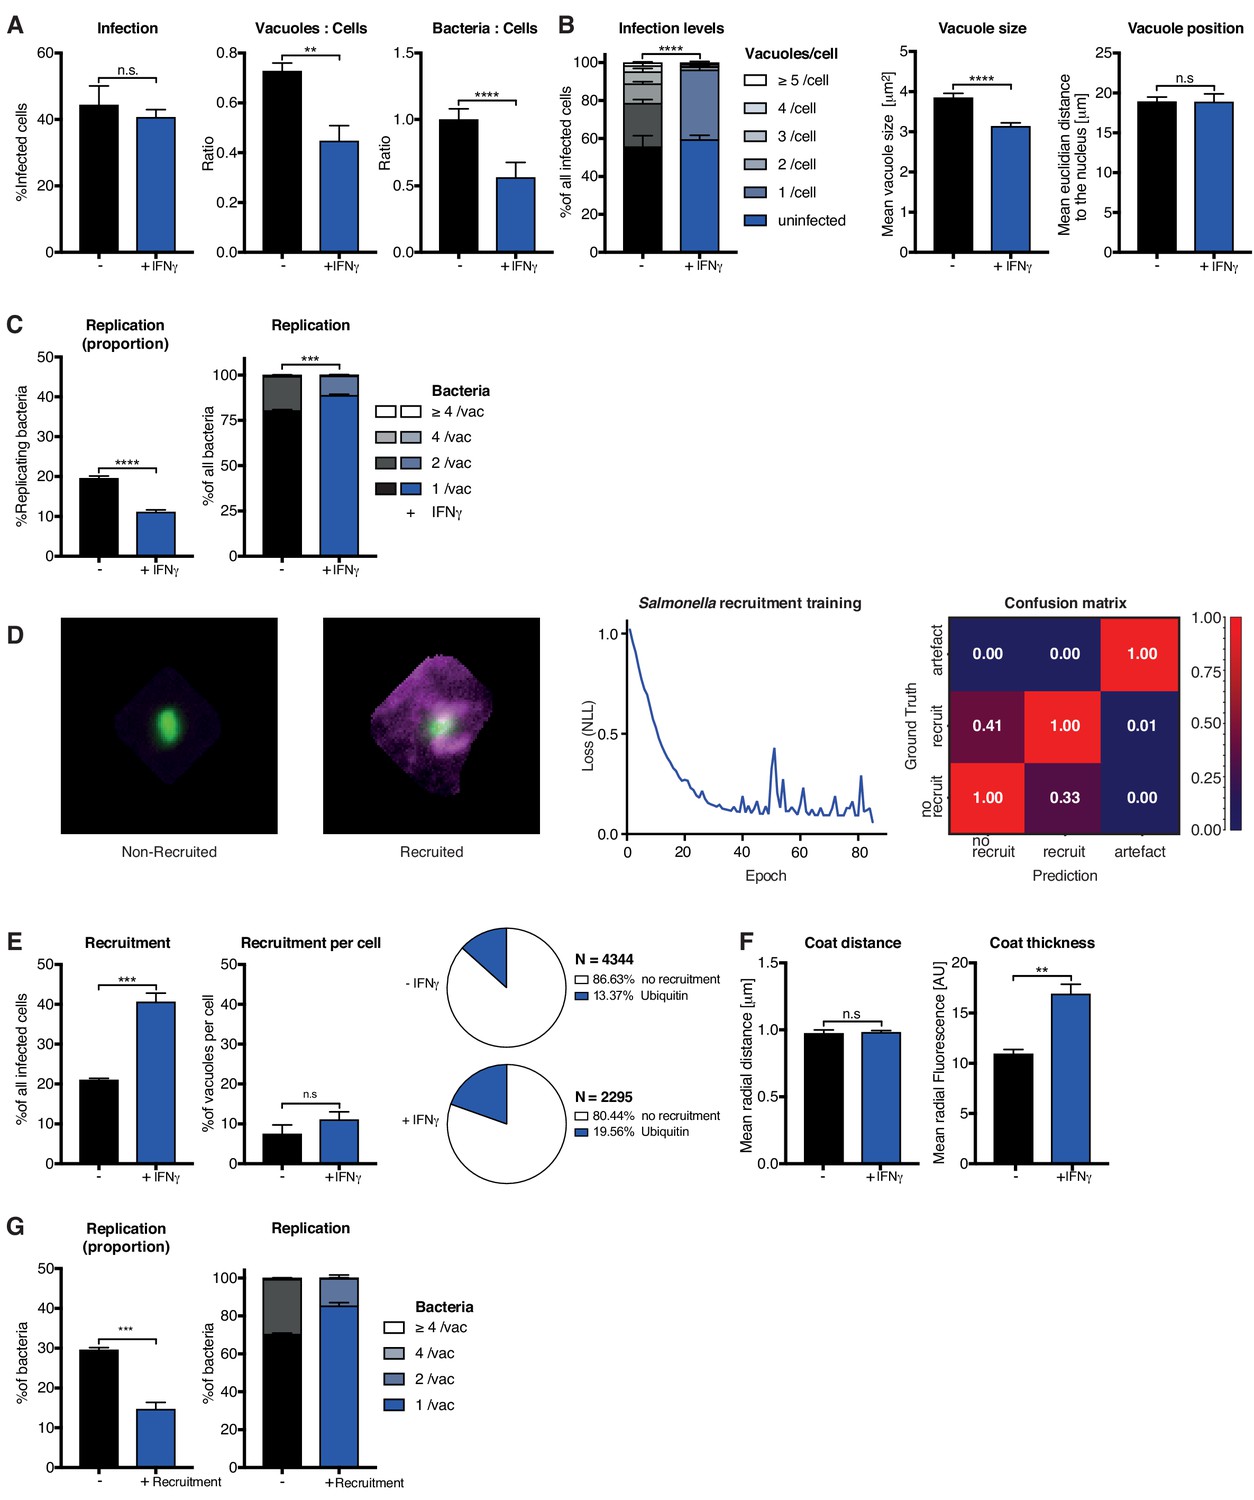
Analysis of Salmonella enterica Typhimurium infection in IFNγ-treated HeLa cells.
HeLa cells were stimulated with 100 IU/mL IFNγ, infected with Salmonella enterica Typhimurium (STm) and analyzed 2 hr post-infection. (A–C) Stage one infection analysis parameters. (A) Infection parameters depicted as total percent of STm infected cells, the ratio of STm vacuoles to cells and the ratio of bacteria to cells. (B) Cellular readouts showing the proportion of cells that contain a certain number of bacteria vacuoles, the mean vacuole size of STm and the vacuole position as the value of the mean euclidian distance of STm vacuoles to the host cell nucleus. (C) Replication capacity of STm shown as the proportion of replicating bacteria and the distribution of replicating STm. (D) Training of the deep convolution neural network (CNN) to analyze host protein recruitment to STm vacuoles and bacteria. Left: Example images showing the difference of no recruitment versus ubiquitin (magenta) recruitment to STm. Middle: Decrease of negative log likelihood (NLL) used as loss function during CNN training over training cycles (epochs) for STm model. Right: Confusion matrix of STm model validation, classification accuracy (0 to 1) during validation is colour-coded blue to red and indicated in the figure. (E) Cellular response to infection with STm measured through the percentage of cells that decorate vacuoles and the average proportion of vacuoles per cell that are being decorated simultaneously and the overall proportion of ubiquitin decorated STm vacuoles. N shows the total number of vacuoles analyzed for each condition, percentages are indicated in the legend. (F) Properties of the host protein coat on STm vacuoles as the average coat distance for ubiquitin to STm and mean fluorescence intensity of ubiquitin. (G) Fate of STm grouped based on host protein recruitment. Shown is the proportion of replicating bacteria and the replication distribution based on recruitment status of the vacuole. All data shown above represent the mean of N = 3 experiments±SEM. Significance was determined using unpaired t-tests, n.s. = not significant, *p≤0.05; **p≤0.01, ***p≤0.001, ****p≤0.0001.
Figure 5

HRMAn can be adapted to study pathogen biology.
(A) HRMAn-based quantification of Gbp recruitment to Tg vacuoles. Red lines show mean ± SEM of N = 3 experiments. (B) Quantification of Tg protein secretion and translocation to the host cell nucleus. HFF cells were infected with type I Tg expressing GRA16-HA or GRA24-HA or with type II Tg expressing TgIST-HA and fixed after 18 hr. Secreted proteins were visualized by staining with anti-HA (magenta) and Tg was stained with anti-SAG1 (green). Scale bar, 20 μm. Fluorescence signal in the host cell nucleus was quantified, correlated to the number of parasites per cell and normalized to the signal of uninfected cells. Overall number of analyzed cells are indicated in the graphs. Data represented as mean ± SEM of N = 3 experiments. Significance from one-way ANOVA comparing to the respective WT, n.s. = not significant, *p≤0.05; **p≤0.01, ***p≤0.001, ****p≤0.0001.
Additional files
-
Supplementary file 1
Overview and evaluation of existing software packages for analysis of fluorescence images in HCI experiments.
- https://doi.org/10.7554/eLife.40560.015
-
Transparent reporting form
- https://doi.org/10.7554/eLife.40560.016
Download links
A two-part list of links to download the article, or parts of the article, in various formats.
Downloads (link to download the article as PDF)
Open citations (links to open the citations from this article in various online reference manager services)
Cite this article (links to download the citations from this article in formats compatible with various reference manager tools)
Defining host–pathogen interactions employing an artificial intelligence workflow
eLife 8:e40560.
https://doi.org/10.7554/eLife.40560


