Fatigue induces long-lasting detrimental changes in motor-skill learning
- Johns Hopkins University, Maryland
- University Hospital Zurich, Switzerland
- University College London, United Kingdom
- Boston University, Massachusetts
- The Johns Hopkins University School of Medicine, Maryland
Figures
Figure 1
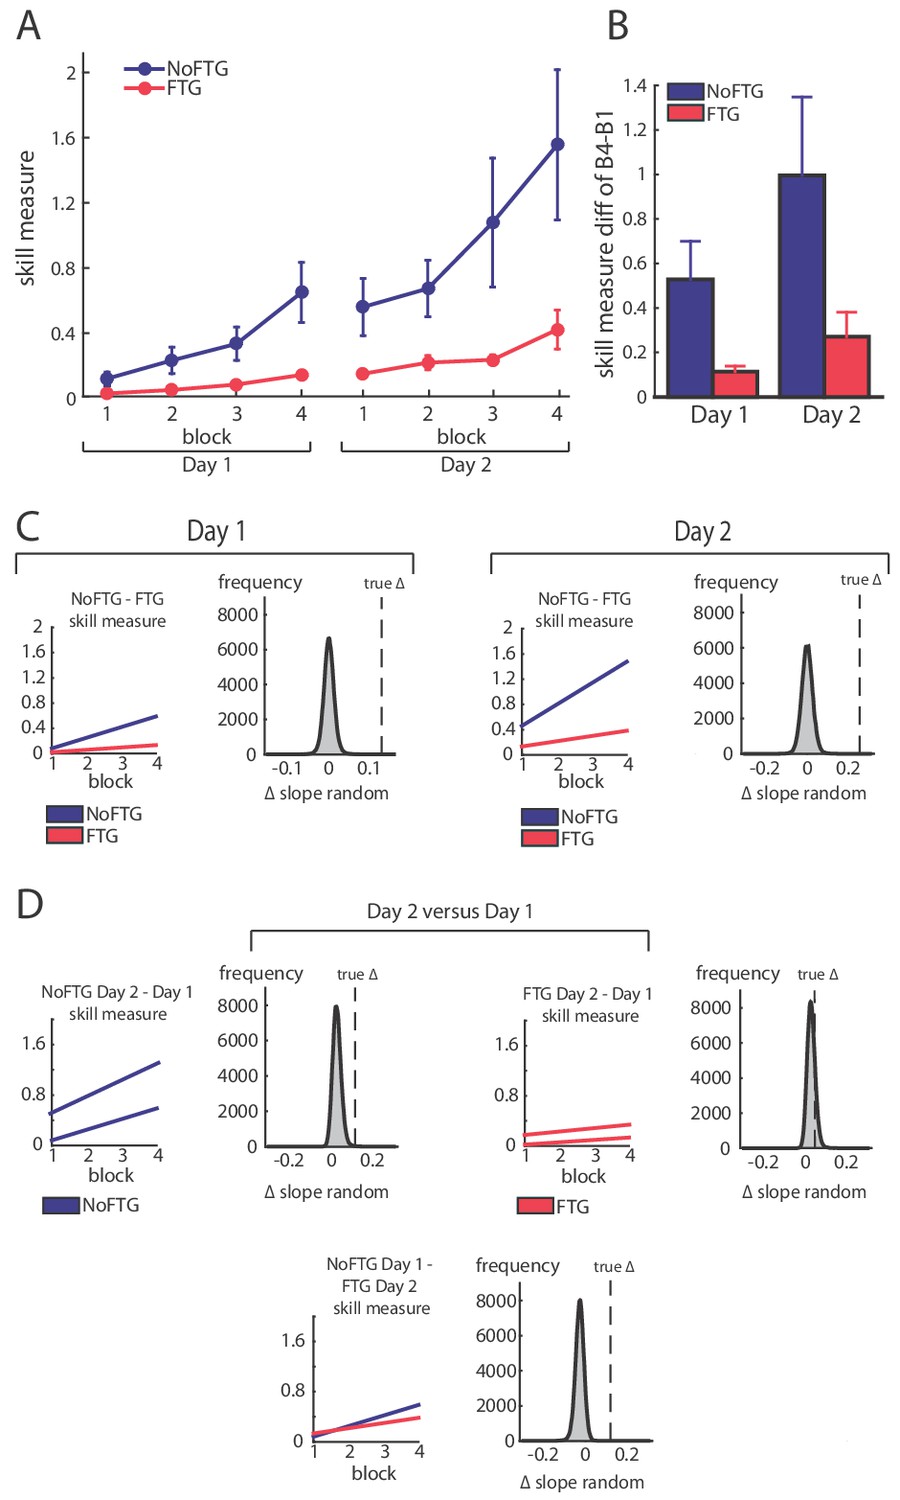
Comparison of skill acquisition in an isometric pinch task between fatigued and non-fatigued participants.
Panel (A) shows changes in skill measure over the course of four training blocks on two consecutive days for both groups (NoFTG = blue; FTG = red). While both groups improved task execution, the FTG had a lower performance level on Day 1 and Day 2 when they were not fatigued compared to controls. Note that the skill performance in block 4 of Day 2 in the FTG remained below the level of NoFTG at the end of Day 1. Panel (B) shows the difference in performance between block 4 to block one for both groups on each day. Panel (C) shows the differences in learning rates for Day 1 and Day 2 between groups. We compared the learning rate of both groups by first fitting a robust linear regression model to the individual data of each group (line plots). To test if there was a true difference in learning rates, we calculated the ∆ of the average slope of the fitted model (regression coefficients). We then used permutation testing to generate a distribution of ∆ slopes of randomly generated groups (grey histoplots). The Null hypothesis was rejected when less than 5% of the generated ∆ slopes exceed the true ∆ slope (dashed vertical lines, see also Materials and methods). In Panel (D) learning rates are compared within groups across days (Day 2 versus Day 1). There were no significant differences in learning rates across days in both groups.
Figure 2

Comparison of skill execution between FTG and NoFTG over the course of four days.
Note that the FTG (red) showed lower skill levels at Day 1 and 2 compared to the NoFTG (blue) and only reached similar levels to controls at the end of Day 3 and on Day 4.
Figure 3
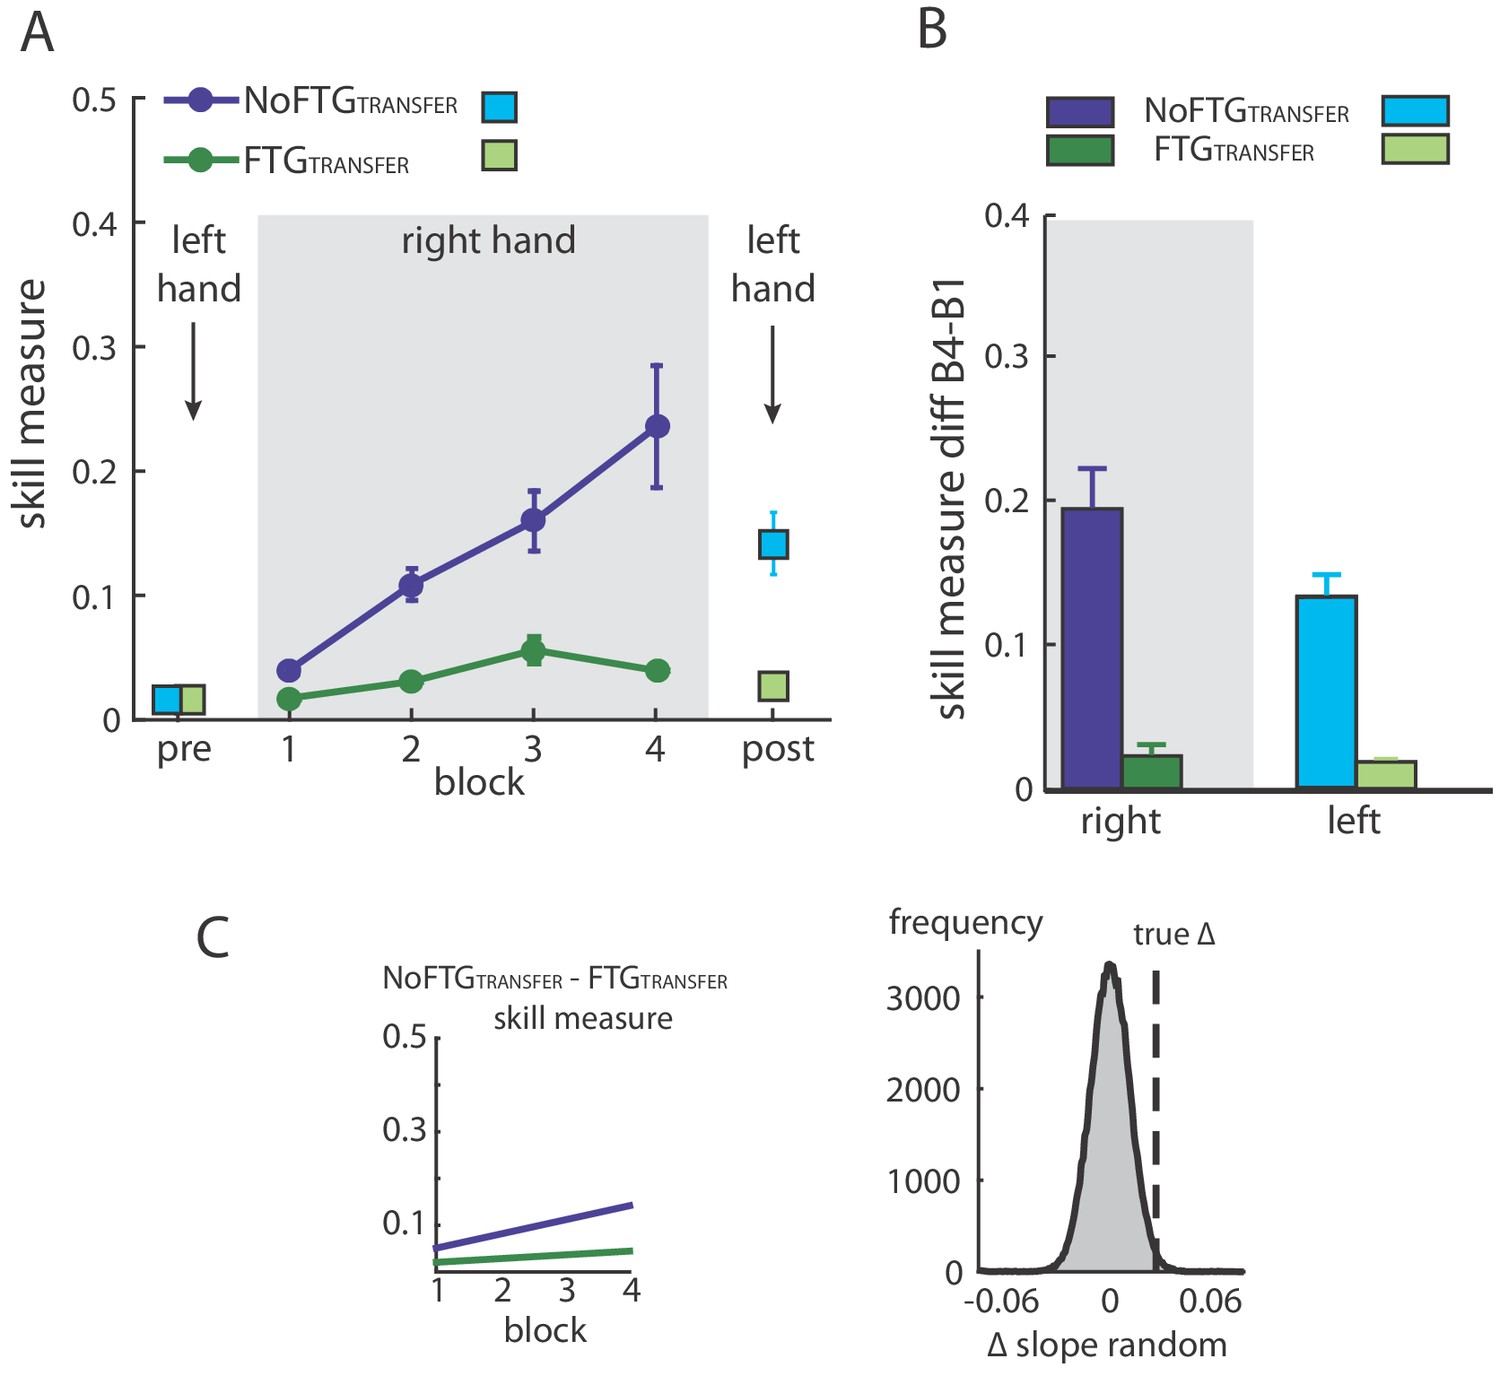
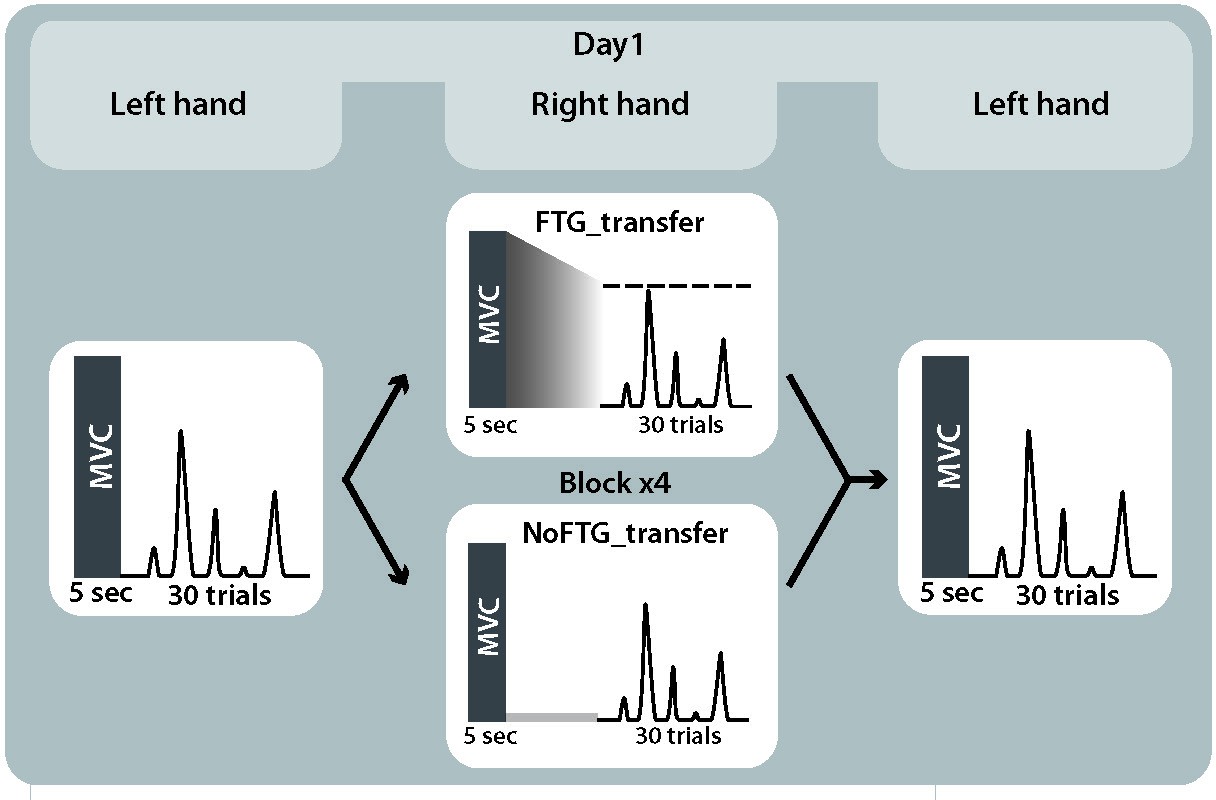
Intermanual transfer of learning in fatigued versus non-fatigued participants.
Panel (A) shows changes in the skill measure over the course of four blocks during one day of training (NoFTGTRANSFER = dark blue, FTGTRANSFER = dark green). Before and after the training, both groups performed 15 trials of the pinch force task with their left hand (FTGTRANSFER = light blue square, NoFTGTRANSFER = light green square). Note that, while both groups improved skill performance over time, the FTGTRANSFER group had a lower performance level, consistent with experiment 1, in both the fatigued and non-fatigued effector. Panel (B) shows the difference in performance between block 4 to block one for the right hand and block 2 - block one for the left hand in both groups. Performance in the left hand was significantly lower in the FTGTRANSFER compared to NoFTGTRANSFER. Panel (C) shows the learning rates and the true ∆ slope in comparison to randomly generated ∆ slopes after permutation. Similar to experiment 1, controls showed higher learning rates than the fatigued group.
Figure 4

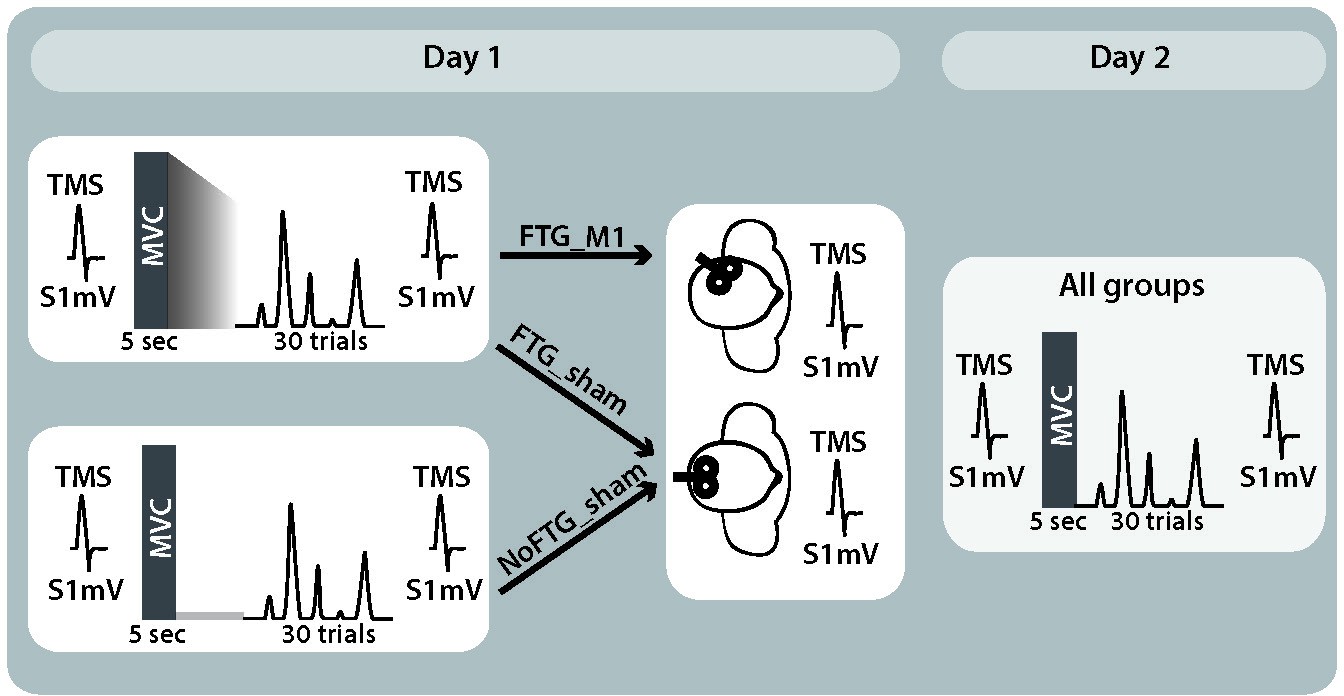
Disrupting M1 at the end of Day one training reduces the impaired skill acquisition on Day 2.
Panel (A) shows changes in the skill measure over four training blocks on two consecutive days for all groups (NoFTGSHAM = blue, FTGSHAM = red, FTGM1 = green). Note that the FTGM1 experienced higher improvement of performance in Day 2 compared to the FTGSHAM. Panel (B) shows the difference in performance between block 4 to block one for all groups on each day. Panel (C) shows the comparison of learning rates for all groups on Day 1 and 2. On both days, the unfatigued control group showed a higher learning rate than the FTGSHAM group (this group received sham stimulation at the end of Day 1). Second row: In contrast, there was no significant difference in learning rates between the FTGM1 group and the control group on Day 2 (in this group, M1 function was disrupted at the end of Day 1 using rTMS), while learning rates on Day 1 were lower. Third row: Both groups showed similar performance on Day 1, but higher learning rates were evidenced on Day 2 in the FTGM1 group compared to the FTGSHAM group.
Figure 5

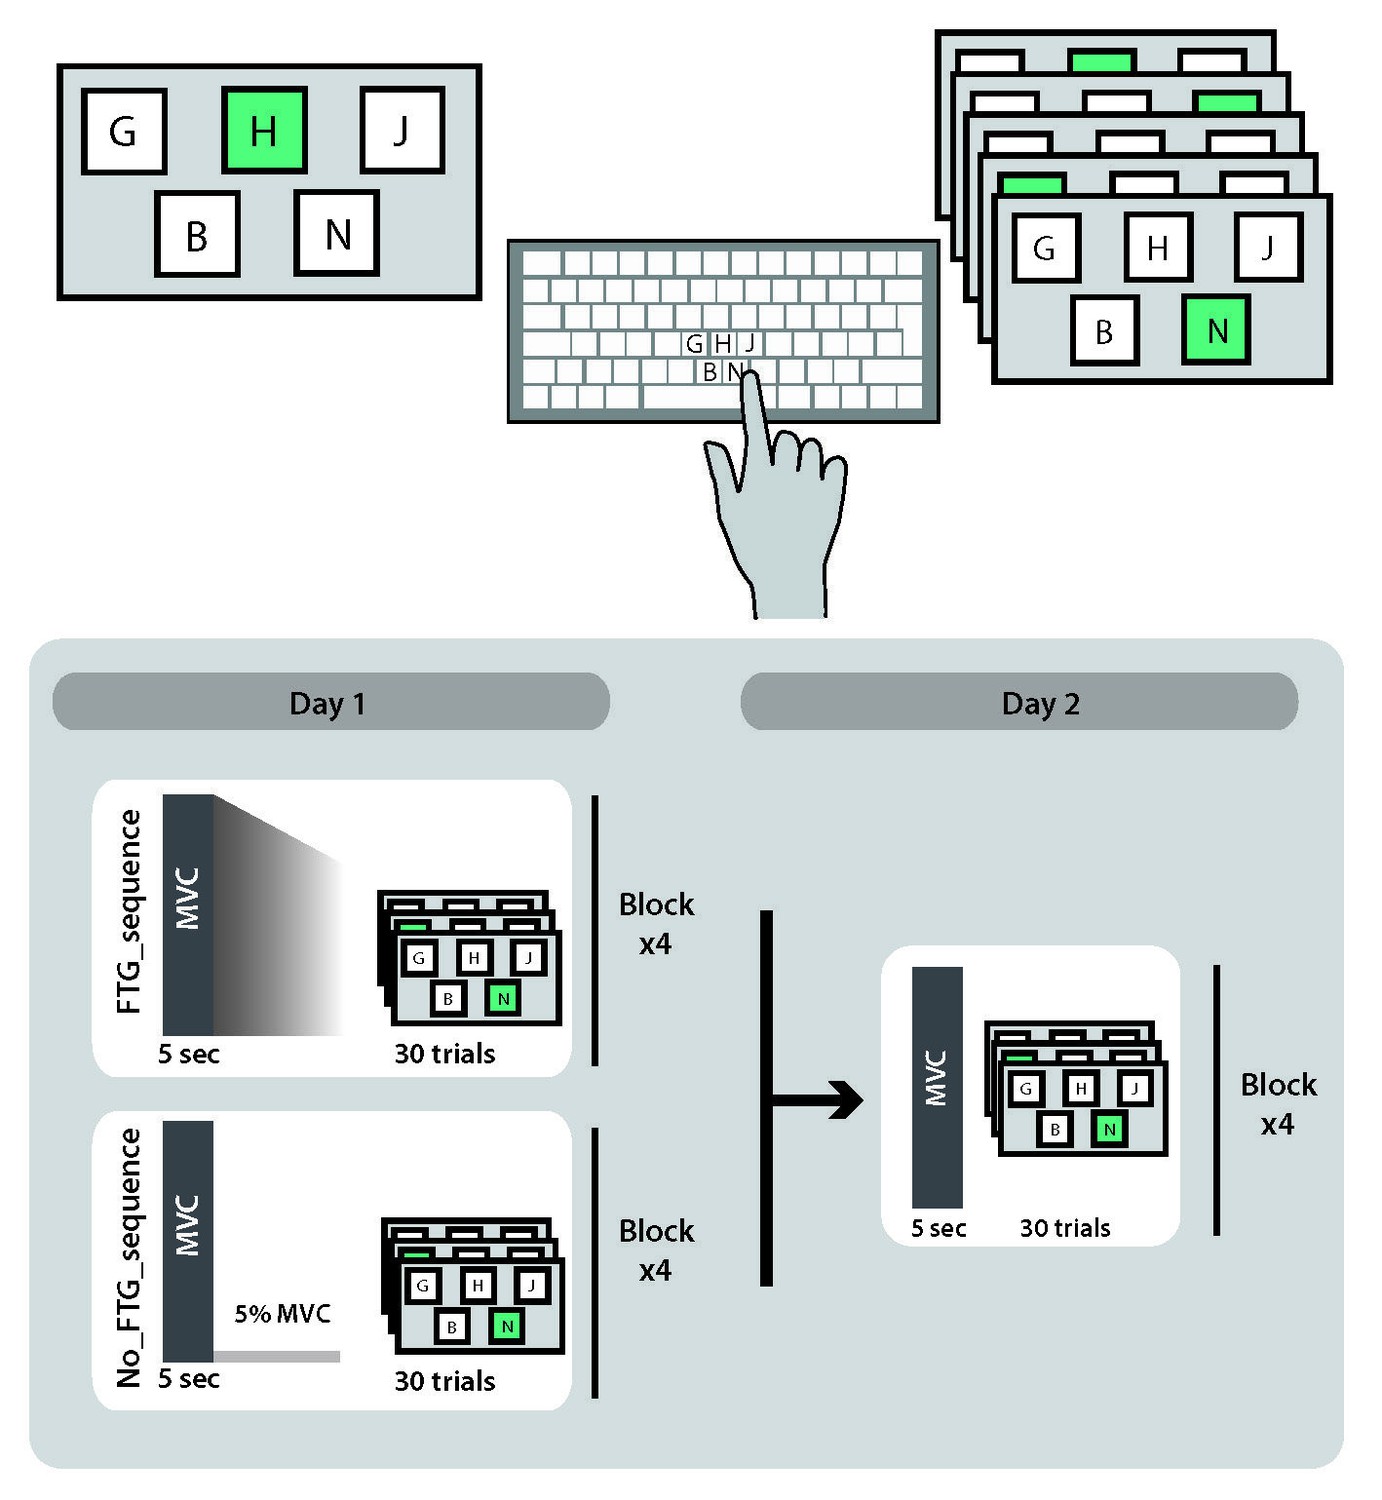
Muscle fatigue does not impair sequence learning.
Panel (A) shows changes in movement time over the course of four blocks on two consecutive days for the non-fatigued versus the fatigued group (NoFTGSEQUENCE and FTGSEQUENCE). Both groups performed similar on the task on both days. Panel (B) shows the difference in error rate for both groups on both days. Again, we found no differences in performance between the groups.
Figure 6
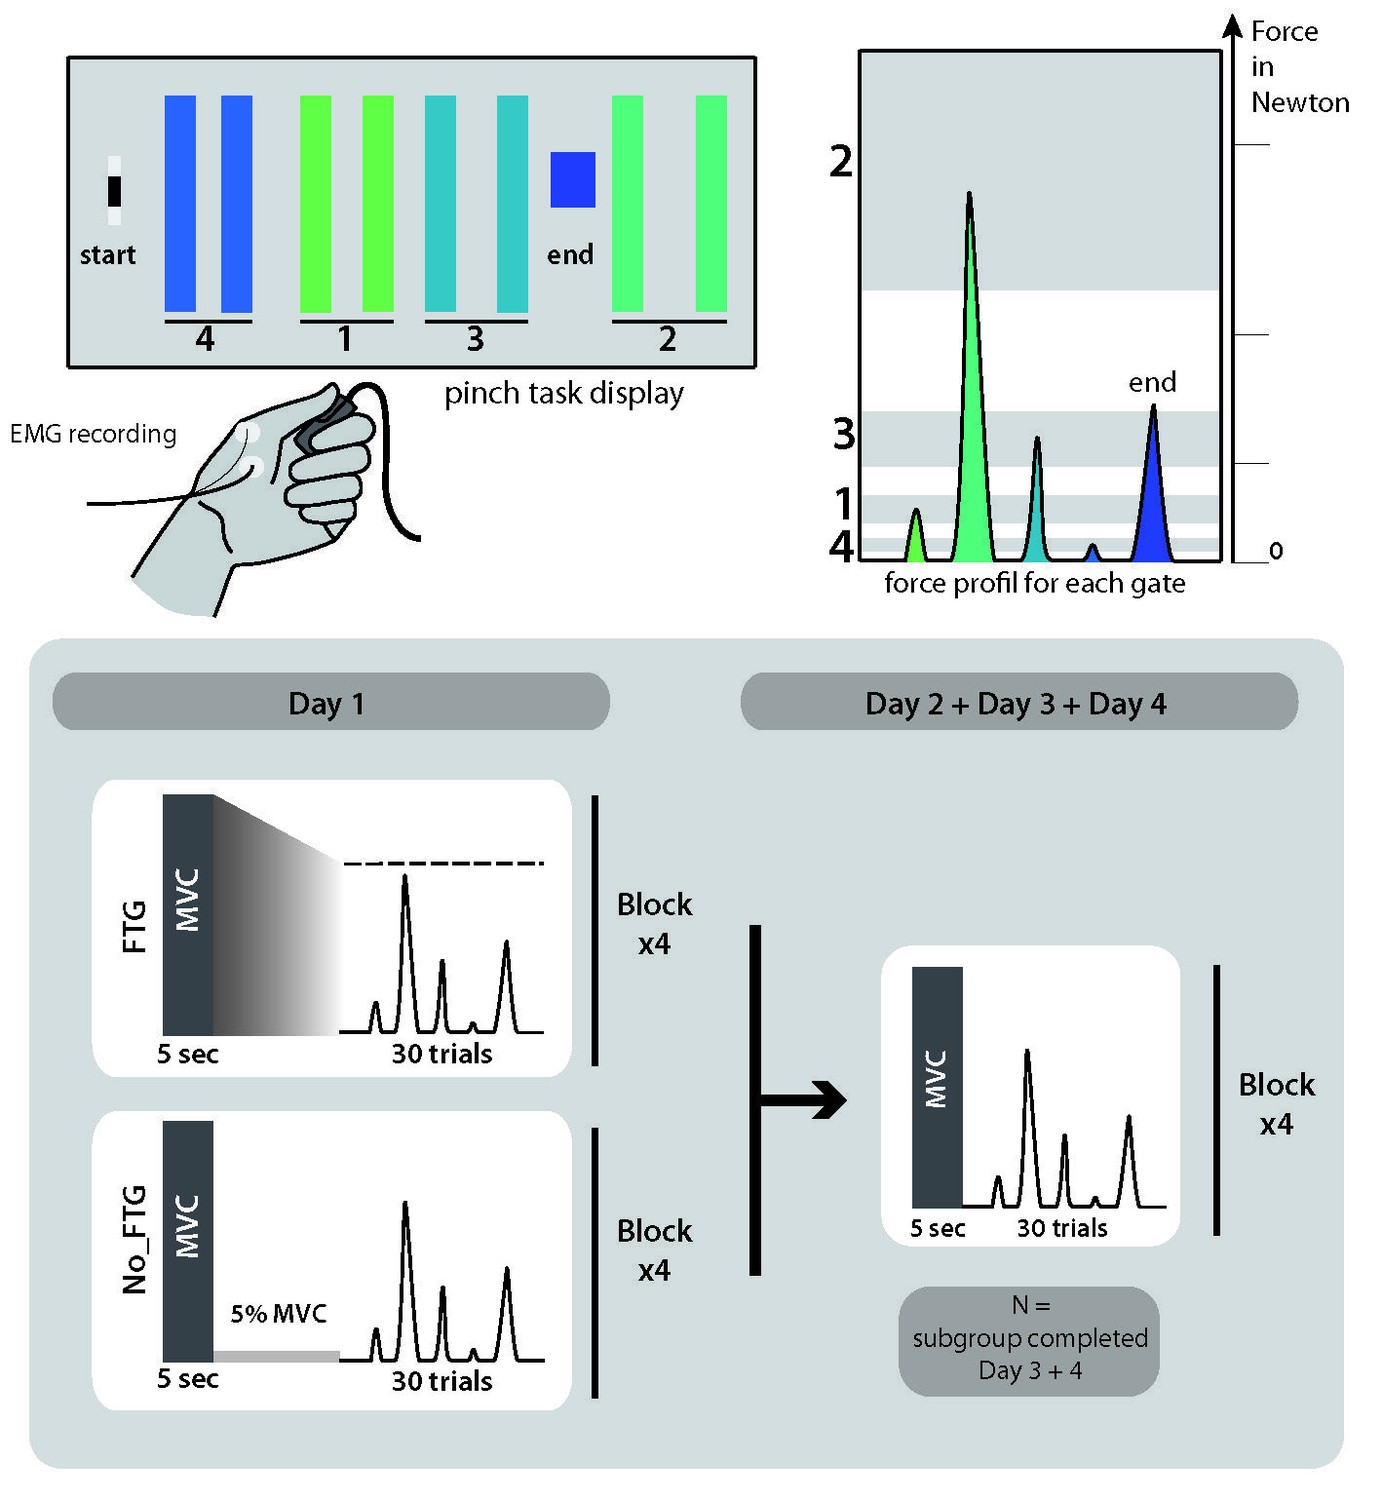
Pinch force skill task and study design for experiment 1.
https://doi.org/10.7554/eLife.40578.008
Appendix 1—figure 1
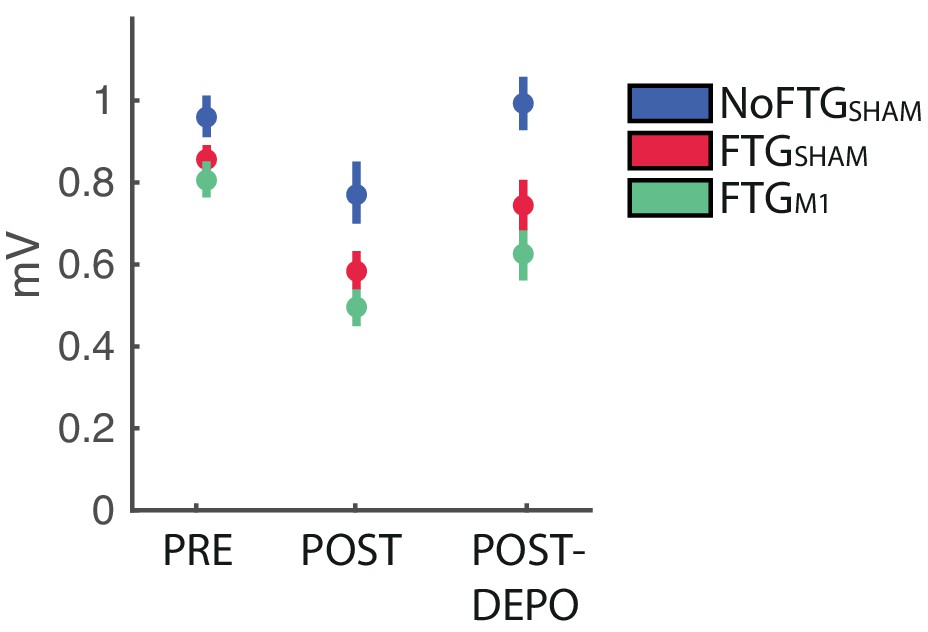
Changes of M1 excitability in experiment 3.
https://doi.org/10.7554/eLife.40578.012
Appendix 1—figure 2
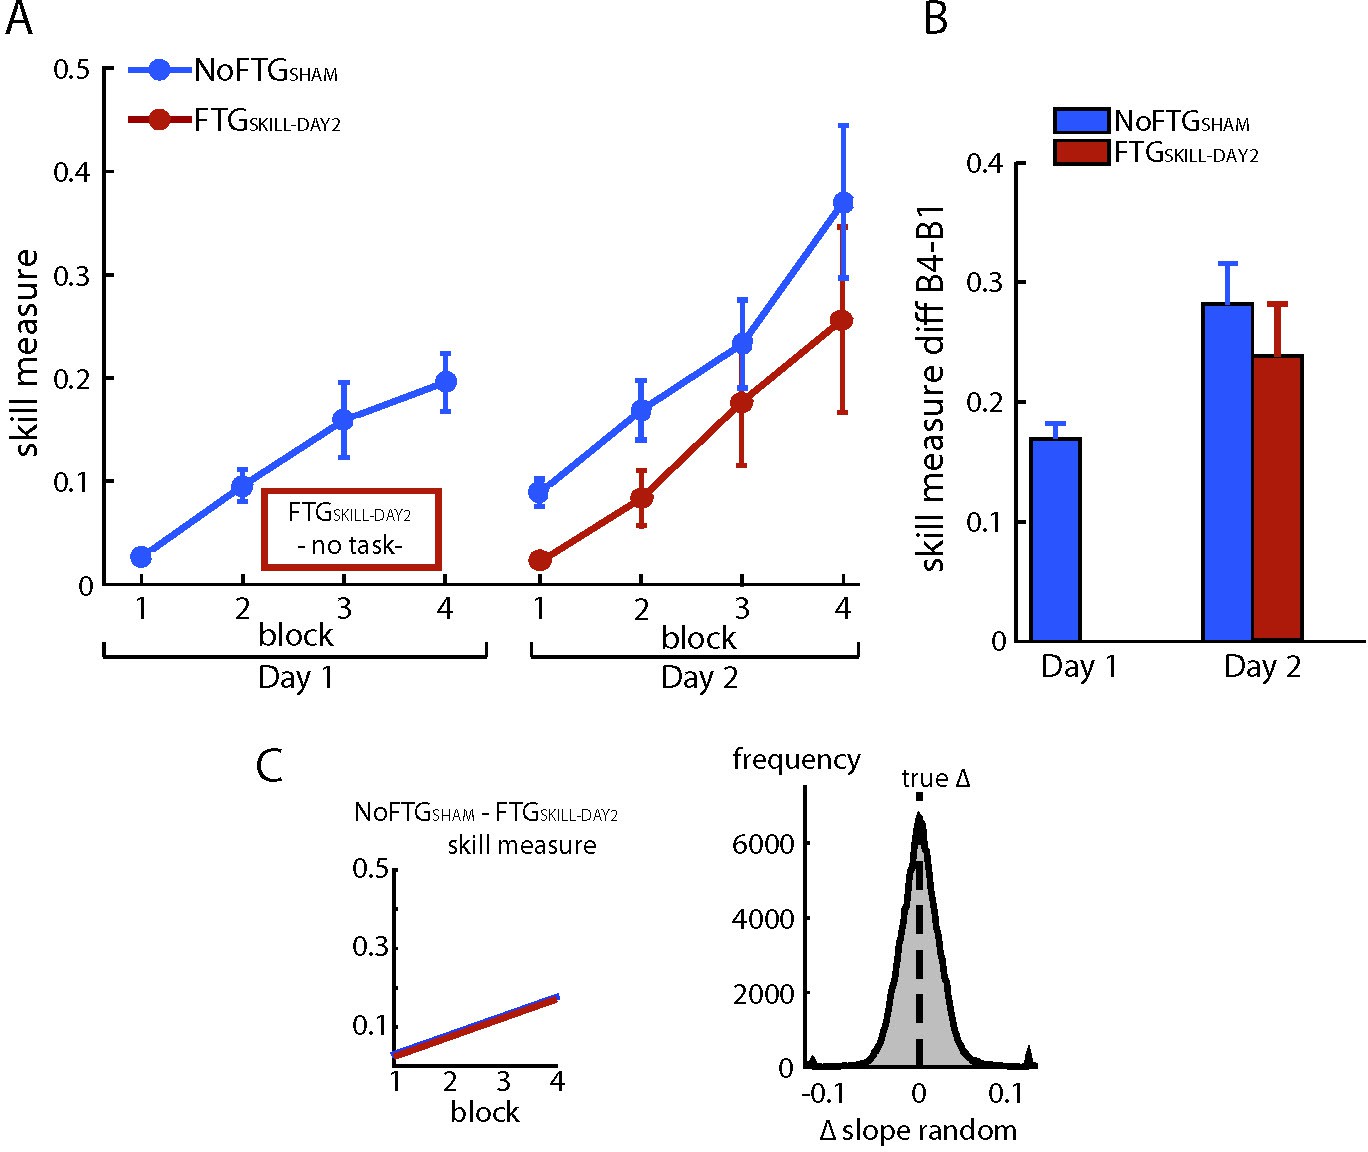
Fatiguing without training did not affect learning on Day 2.
Panel (A) shows changes in skill measure over the course of four blocks on two consecutive days for the non-fatigued group (NoFTGSHAM, same control group as in experiment 3) and on Day two for the FTGSKILL-DAY2 (participants were fatigued on Day 1, but did not learn the task until Day two when they trained in the absence of fatigue). FTGSKILL-DAY2 learned the task on Day two to a similar extent as the non-fatigued group on Day 1. As expected, the FTGSKILL-DAY2 performed at a lower level compared to the non-fatigued group on Day 2. Panel (B) shows the difference in performance between block 4 to block one for both groups across days, the relative improvement in the FTGSKILL-DAY2 was comparable to the control group on both days. Panel (C) shows the learning rates for the control group on Day one compared to the FTGSKILL-DAY2. No differences in learning rates were found using permutation testing.
Appendix 1—figure 3
Study design experiment 2.
https://doi.org/10.7554/eLife.40578.015
Appendix 1—figure 4
Study design experiment 3.
https://doi.org/10.7554/eLife.40578.016
Appendix 1—figure 5
Study design experiment 4.
https://doi.org/10.7554/eLife.40578.017
Appendix 1—figure 6

Study design control condition.
https://doi.org/10.7554/eLife.40578.018Tables
Appendix 1—table 1
error rate experiment 3.
https://doi.org/10.7554/eLife.40578.011| Group | Day 1 | Day 2 | ||||||
|---|---|---|---|---|---|---|---|---|
| B1 | B2 | B3 | B4 | B1 | B2 | B3 | B4 | |
| NoFTG_sham | 0.58 ± 0.05 | 0.38 ± 0.05 | 0.34 ± 0.06 | 0.29 ± 0.06 | 0.44 ± 0.04 | 0.35 ± 0.04 | 0.31 ± 0.05 | 0.23 ± 0.04 |
| FTG_sham | 0.78 ± 0.04 | 0.70 ± 0.04 | 0.61 ± 0.05 | 0.56 ± 0.05 | 0.59 ± 0.03 | 0.48 ± 0.04 | 0.44 ± 0.04 | 0.39 ± 0.03 |
| FTG_M1 | 0.68 ± 0.04 | 0.57 ± 0.04 | 0.49 ± 0.05 | 0.5 ± 0.05 | 0.52 ± 0.03 | 0.43 ± 0.04 | 0.38 ± 0.04 | 0.30 ± 0.03 |
Additional files
-
Transparent reporting form
- https://doi.org/10.7554/eLife.40578.009
Download links
A two-part list of links to download the article, or parts of the article, in various formats.
Downloads (link to download the article as PDF)
Open citations (links to open the citations from this article in various online reference manager services)
Cite this article (links to download the citations from this article in formats compatible with various reference manager tools)
Fatigue induces long-lasting detrimental changes in motor-skill learning
eLife 8:e40578.
https://doi.org/10.7554/eLife.40578


