Promoting subjective preferences in simple economic choices during nap
- Peking University, China
- The First Affiliated Hospital of Xinxiang Medical University, China
- The University of Hong Kong, China
- West China Hospital, Sichuan University, China
- Beijing Key Laboratory on Drug Dependence Research, China
- The State Key Laboratory of Natural and Biomimetic Drugs, China
Figures
Figure 1
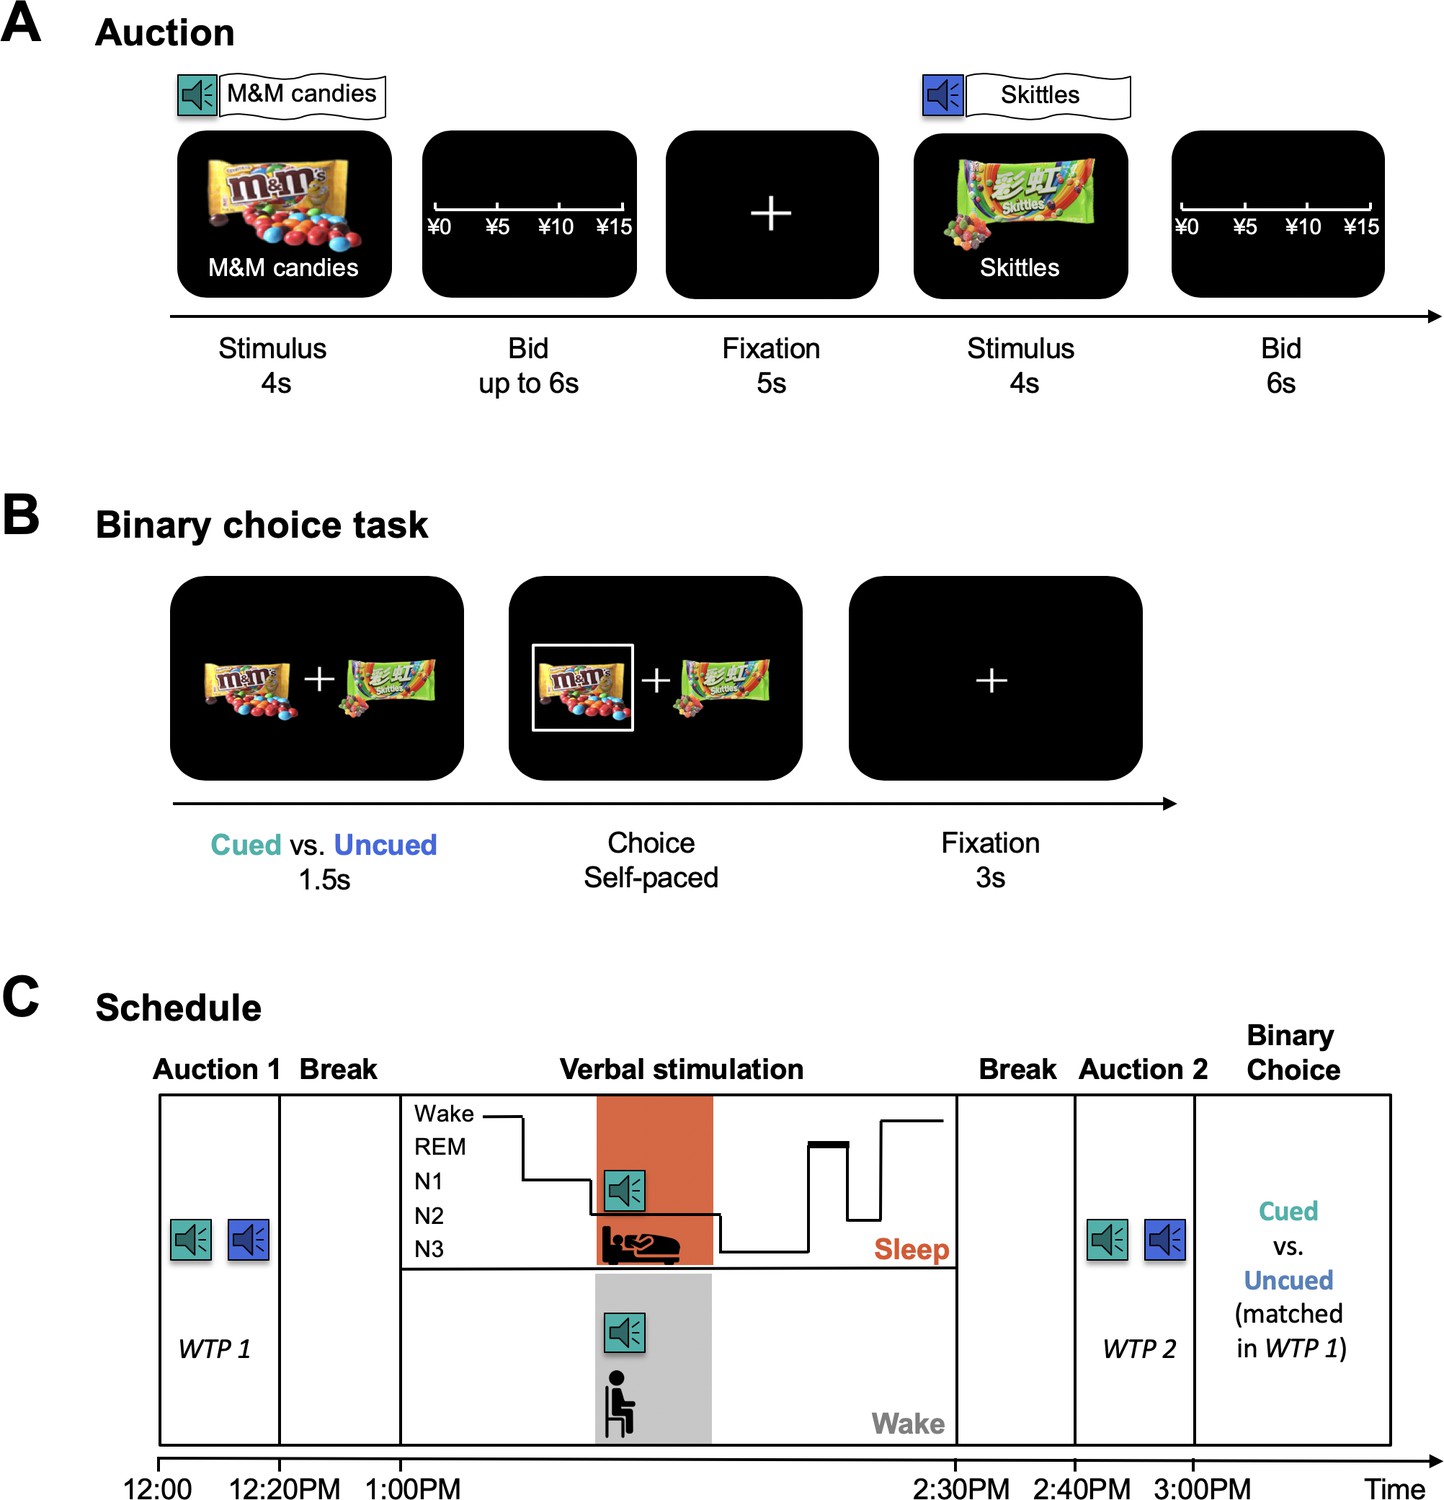
Task Illustration.
(A) BDM auction. In each trial, participants were presented with a familiar snack item on a computer screen for 4 s, accompanied by the spoken name of the item delivered over a speaker once. Then, participants were asked to report their willingness to pay for the item. (B) Binary choice task. Participants were presented with two snack items that were matched by baseline WTP (i.e. WTP1) and differed by whether they had or had not been named during verbal stimulation. (C) Timeline of the experiment. Subjects first indicated their baseline WTP (i.e. WTP1) for a set of 60 familiar snacks in the first BDM auction. After a break, subjects entered a verbal stimulation session, during which they were randomly divided into the sleep (N = 47) or wake (N = 45) group. Sleep group participants took a 90-min nap. The names of 8 snacks were broadcast during N2 sleep, each with ten repetitions. Wake group participants received the same stimulation for the same number of snacks at approximately the same time that verbal cues were delivered to the sleep group. After a break, all subjects underwent a second BDM auction followed by a binary choice task.
Figure 2 with 2 supplements

Effects of verbal cueing on preferences and choices.
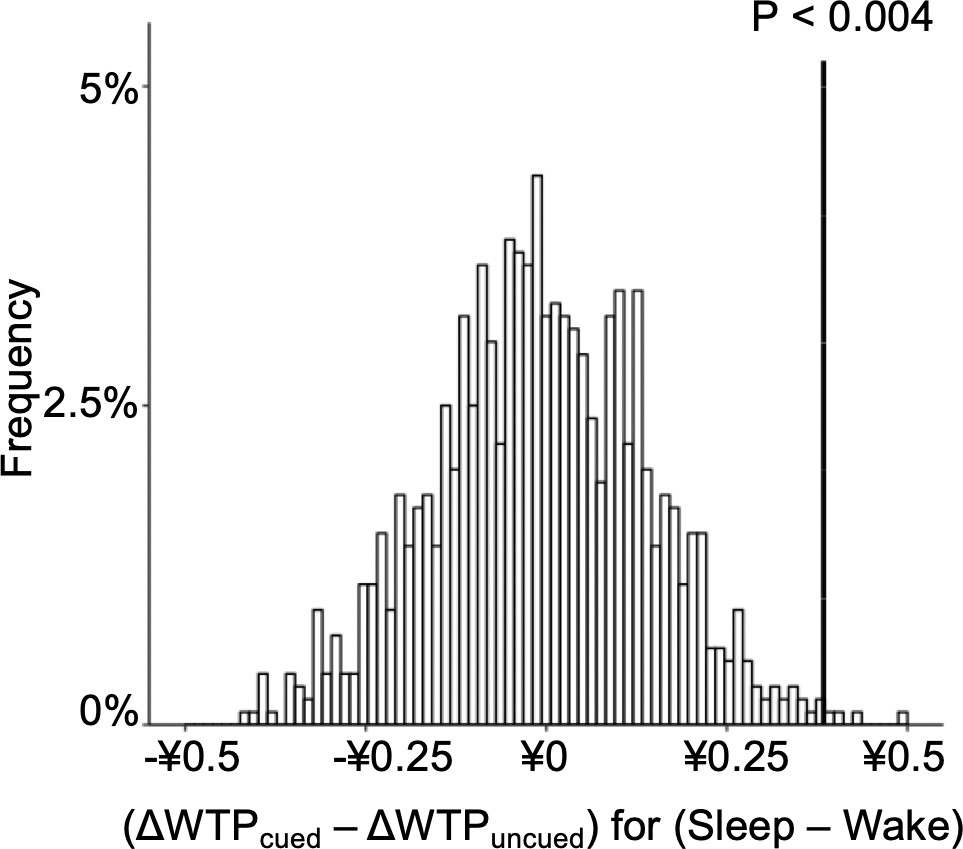
(A) Effects of cueing on WTP. ΔWTP is defined as the paired difference of an item’s WTP elicited by the first and second BDM auction (i.e. WTP2 – WTP1). Relative to WTP1 (¥7.02 ± ¥0.16), cueing during sleep promotes preferences by 8.3% (±1.3%) for cued items more than for items not externally cued, whereas during wakefulness cueing increases WTP by 3.5% (±2.1%) for cued relative to uncued items. (B) Effects of cueing on choices in the binary decision task. Histograms illustrate the percentage of participants for each bin of choice likelihood. The average frequency of selecting the cued item was higher in the sleep group than in the wake group (Insert). Error bars indicate S.E.M.
Figure 2—figure supplement 1
Results of permutation test for the effect of verbal cueing on ΔWTP.
Histograms depict the average difference in ΔWTP for cued and uncued items between the sleep and wake group based on 1000 permutations of the dataset in which the cohort labels of sleep and wake were randomly shuffled across subjects. The black line represents the actual data.
Figure 2—figure supplement 2
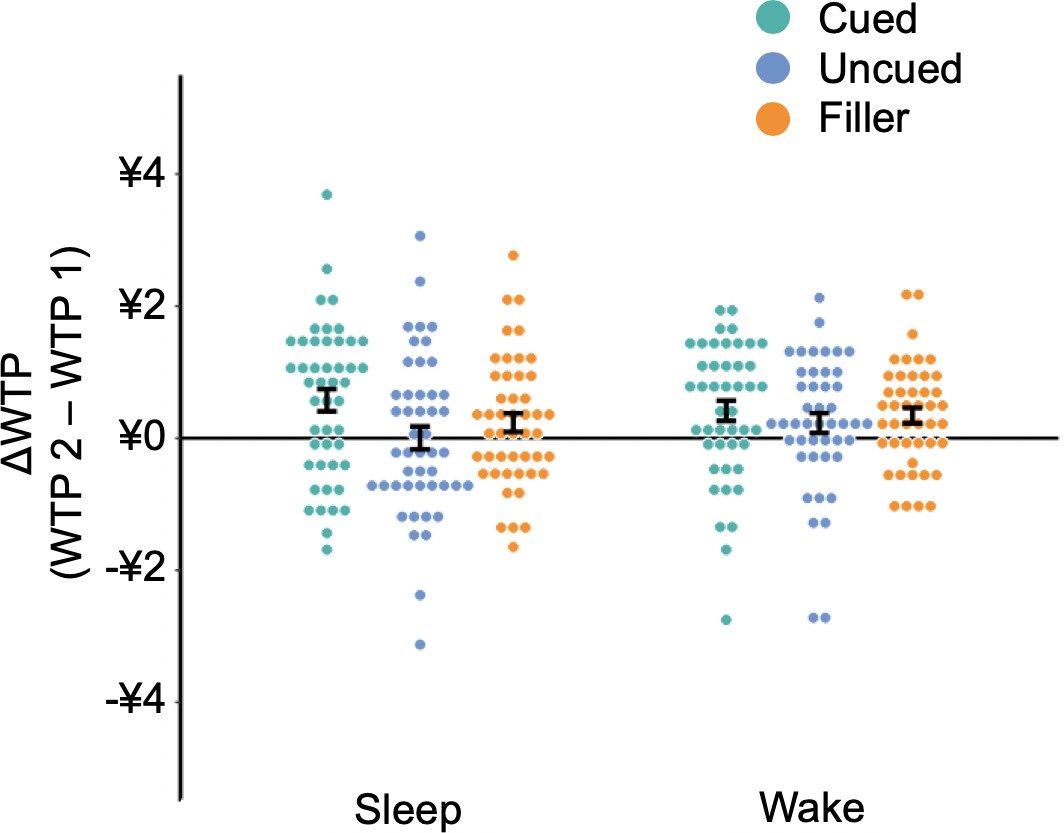
Detailed effects of verbal cueing on ΔWTP.
ΔWTP is defined as the paired difference of an item’s WTP before and after the verbal stimulation (i.e., WTP2 – WTP1). Each dot indicates a subject. Dot color represents different types of snack items, including items that had been cued during the verbal stimulation (green), items that had not been cued but matched with cued items and presented in the binary decision task (blue), and items that had neither been cued nor been presented in the binary decision task (orange). When taking filler items (orange) into consideration, repeated measures ANOVA revealed similar results as reported in Figure 2. There was no significant main effect in cohort (sleep vs. wake; F1,90 = 0.085, p = 0.772), yet a significant within-subject main effect in the cueing condition (cued vs. uncued vs. filler: F2,180 = 11.63, p = 1.8 × 10⁻⁵), and a significant cohort by condition interaction (F2,180 = 3.07, p = 0.049). Post-hoc analysis showed that ΔWTP was significantly higher for cued relative to other items in the sleep group (cued vs. uncued: t46 = 6.081, p = 6.6 × 10⁻⁷; cued vs. filler: t46 = 3.047, = 0.015, Bonferroni corrected), but not in the wake group (cued vs. uncued: t46 = 6.081, p = 0.413; cued vs. filler: t46 = 0.558, p = 1, Bonferroni corrected).
Figure 3
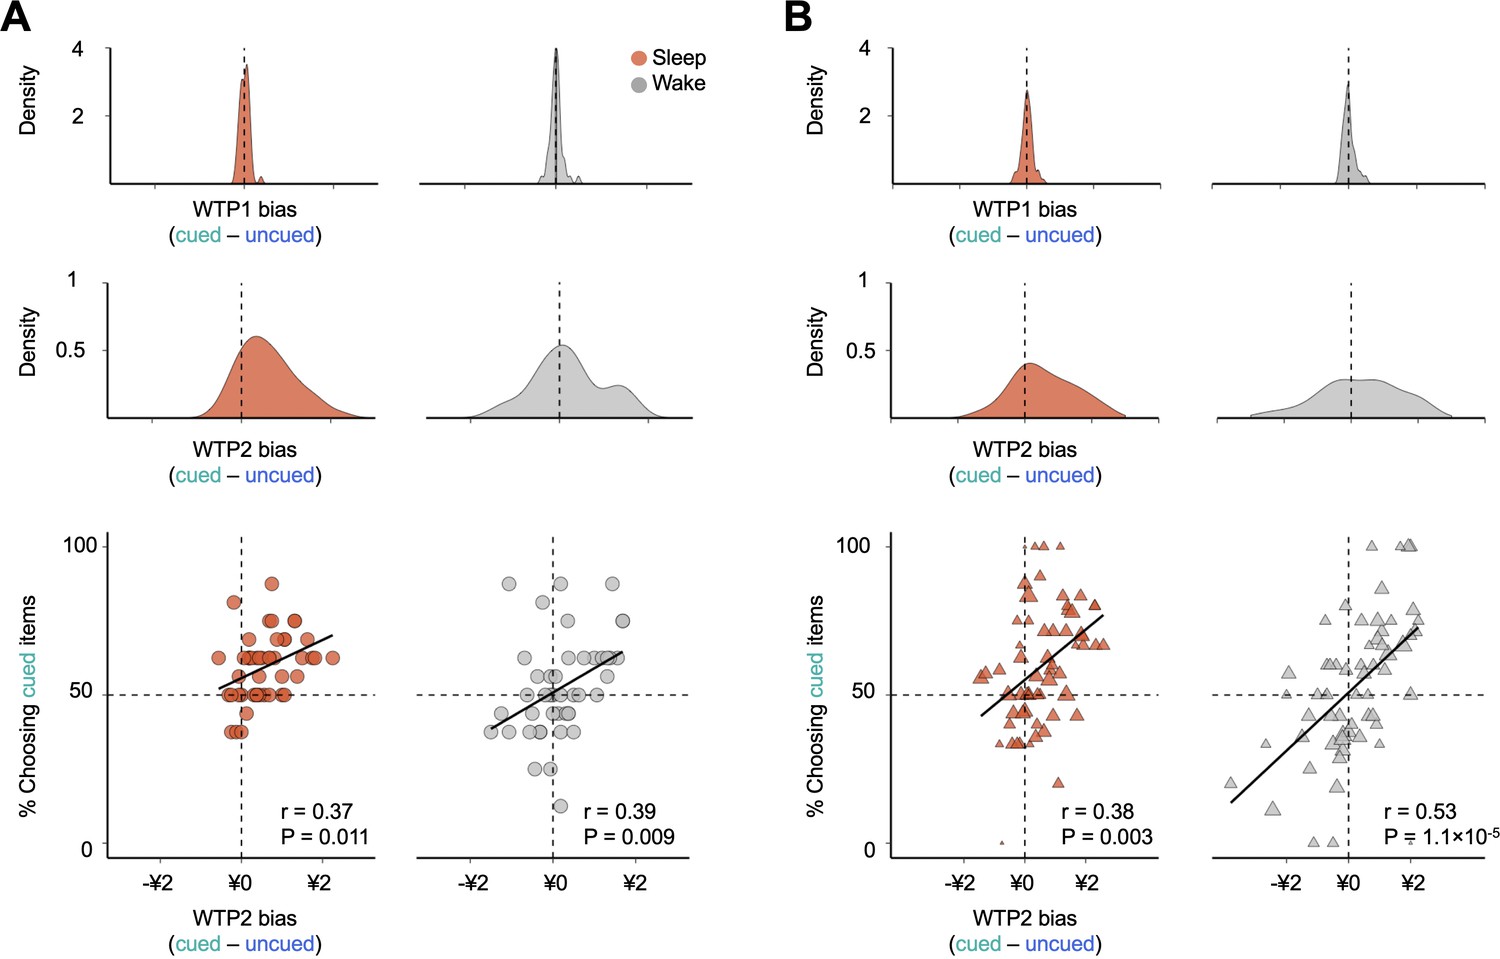
Effects of verbal cueing at the subject and item levels.
(A) Density plot of individual-level biases in WTP1 (top) and WTP2 (middle) in the binary decision task. The individual WTP1(2) bias is computed by subtracting WTP1(2) of an uncued item from the competing cued items that a participant chose between in the binary decision task. (Bottom) Individuals who demonstrated stronger biases in WTP2 toward cued items were more likely to choose cued over uncued items in both sleep and wake groups, with no significant group difference between slopes, suggesting that the cueing-specific effect was not driven by differential level of choice randomness across sleep and wake groups. Each dot represents a subject. (B) Density plot of item-level biases in WTP1 (top) and WTP2 (middle). The item-level WTP1(2) bias is computed by averaging the WTP1(2) difference associated with the same cued item across all subjects and all uncued items paired in the binary decision task. (Bottom) Cued items that were associated with higher WTP2 biases were more likely to be selected under both sleep and wake protocols, with no significant group differences between slopes. Each triangle represents a cued item, and the size of the triangle is proportional to the number of observations.
Figure 4 with 5 supplements
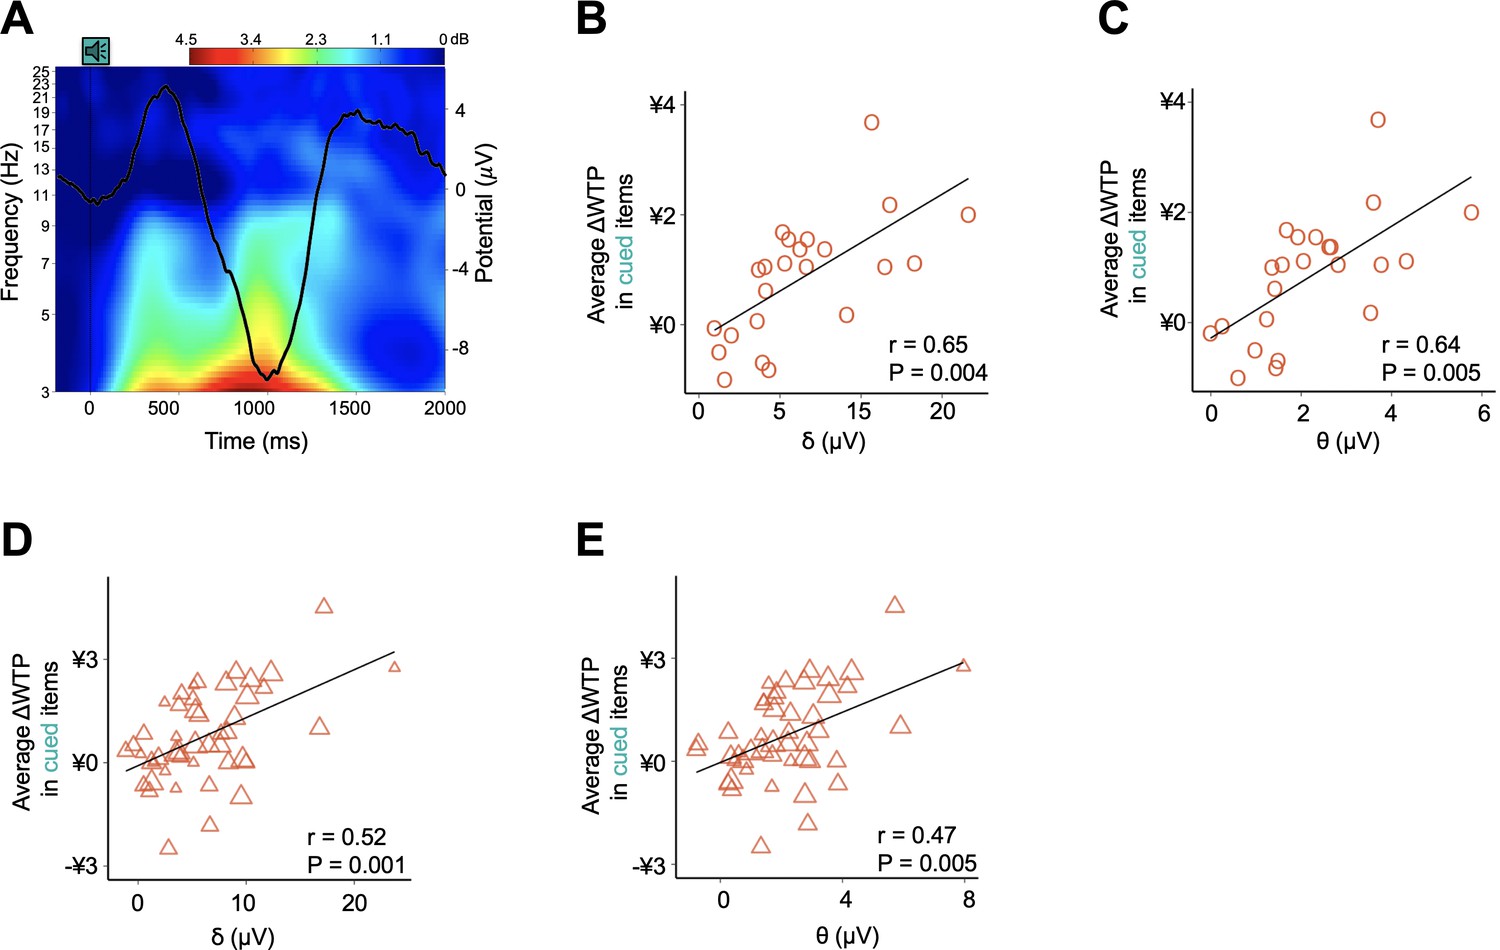
Neurophysiological responses to verbal stimuli during sleep and their contributions to post-sleep behavior (N = 23).
(A) Event-related potential (ERP) and event-related changes in spectral power (ERSPs) evoked by the onset of verbal cues. EEG analysis only encompasses 23 participants in the sleep group. The heatmap demonstrates the event-related changes in ERSPs and black line demonstrates the grand average ERP across participants and trials at the representative electrode F3. ERP topographies for other electrodes and the detailed statistical analyses are shown in Figure 4—figure supplement 1A and Supplementary file 1, Table 1F (also see Materials and methods). (B–C) Individual- and (D–E) item-level correlations between cue-induced power increased in low-frequency bands and ΔWTP for items presented during sleep.
Figure 4—figure supplement 1

Neurophysiological responses to verbal cueing during sleep (N = 23).
(A) Mean ERP amplitude averaged across all verbal stimuli and all subjects in six electrodes. By averaging ERP amplitudes measured over the interval from −200 to 1800 ms with respect to the onset of each verbal cue, we observed the cue-evoked neural response at the frontal electrodes and central electrodes during N2 sleep, which is similar to the well-established K-complexes (KCs) waveform that has been associated with the processing of sensory stimuli, including auditory cues, during N2 sleep (Supplementary file 1, Table 1F). (B) Mean spectrograms in the baseline period (left) and the period of stimulus presentation (right) measured at the representative electrode F3 during N2.
Figure 4—figure supplement 2
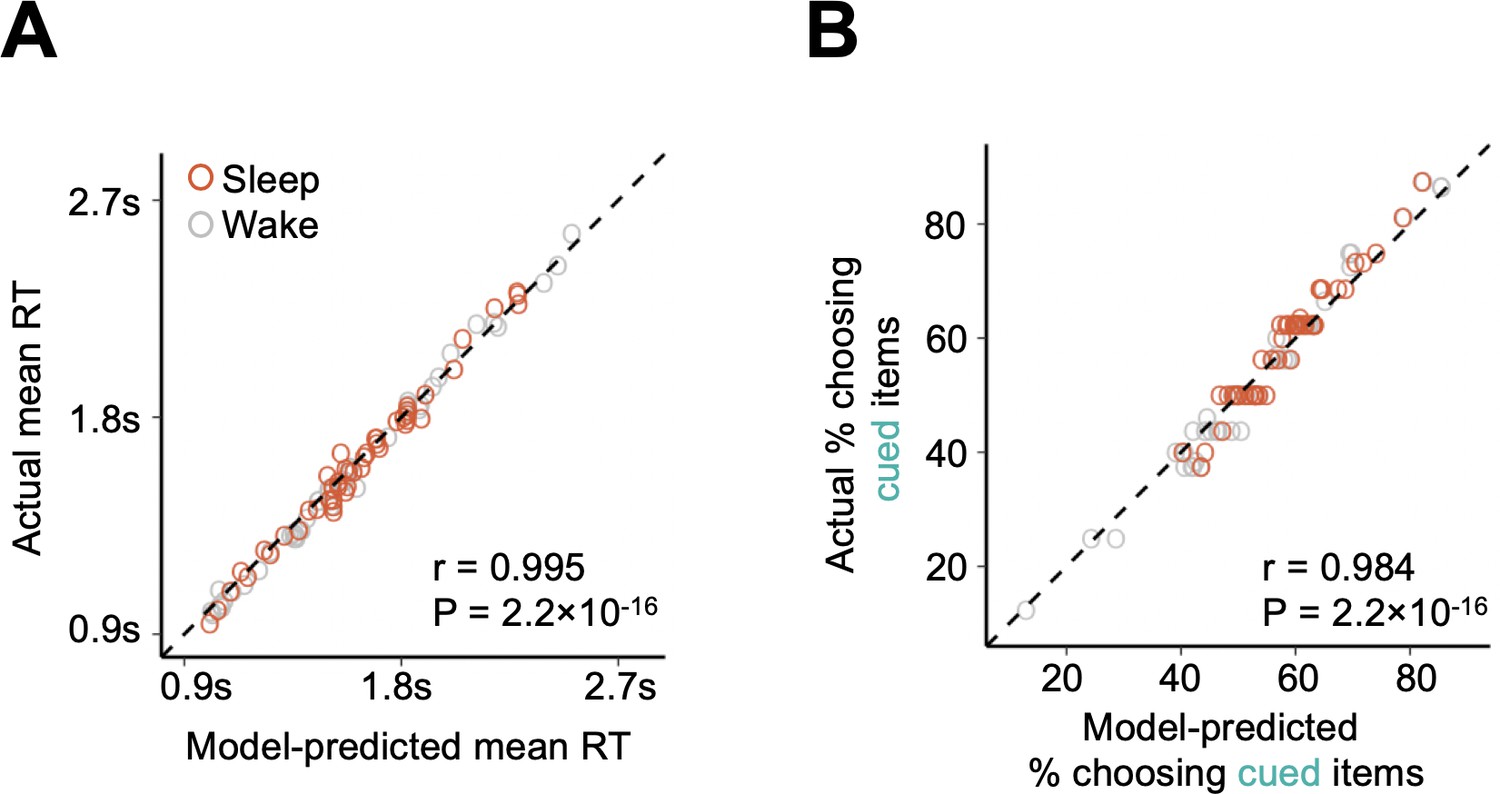
Linear ballistic accumulation model fit.
Observed reaction time (A) and probability of choosing cued over uncued items (B) plotted as a function of model prediction (RT: r = 0.995, p = 2.2 × 10⁻¹⁶; choice: r = 0.984, p = 2.2 × 10⁻¹⁶). No significant difference in the explanatory power was found between sleep and wake groups (RT: rsleep = 0.992, rwake = 0.997, F1,88 = 0.42, p = 0.52; choices: rsleep = 0.973, rwake = 0.988, F1,88 = 0.50, p = 0.480). Dashed line represents a perfect model fit. Each circle indicates a subject.
Figure 4—figure supplement 3

Bar plots for estimated LBA parameters of the sleep and wake group.
Drift rate estimates derived from LBA based on RT and choices in binary decisions demonstrated a pattern similar to that of ΔWTP as shown in Figure 2A. Besides non-decision time, there is no significant main effect in treatment. All Ps are Bonferroni corrected. Error bars represent S.E.M, *p < 0.05; **p < 0.01; ***p < 0.001.
Figure 4—figure supplement 4
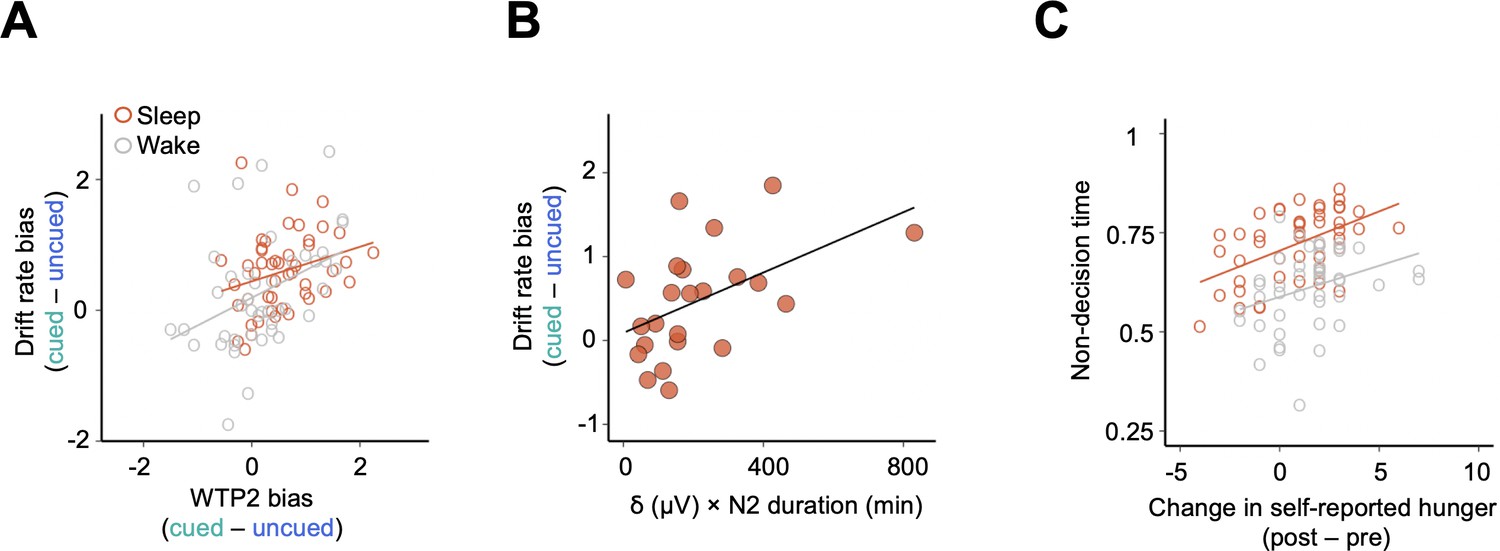
Across-subject differences in LBA estimates.
(A) Drift rate biases can be predicted by biases in WTP2 across all subjects (r = 0.37, p = 0.001), with no significant difference in the correlation coefficient across cohorts (sleep: r = 0.28; wake: r = 0.35; F1,88 = 0.50, p = 0.480). (B) Among sleep group participants with EEG recordings, the estimated drift rate bias was scaled with the amount of memory reactivation occurring during N2, as indexed by the duration of N2 multiplied by the degree of increase in delta band power evoked by verbal cues presented during N2 (r = 0.499, p = 0.015). (C) In both sleep and wake group, non-decision time estimates are correlated with the change of self-reported hunger before and after the stimulation session (r = 0.27, p = 0.009), with no significant difference in the correlation coefficient across cohorts (sleep: 0.51; wake: r = 032; F1,88 = 0.23, p = 0.633). Each circle indicates a subject.
Figure 4—figure supplement 5
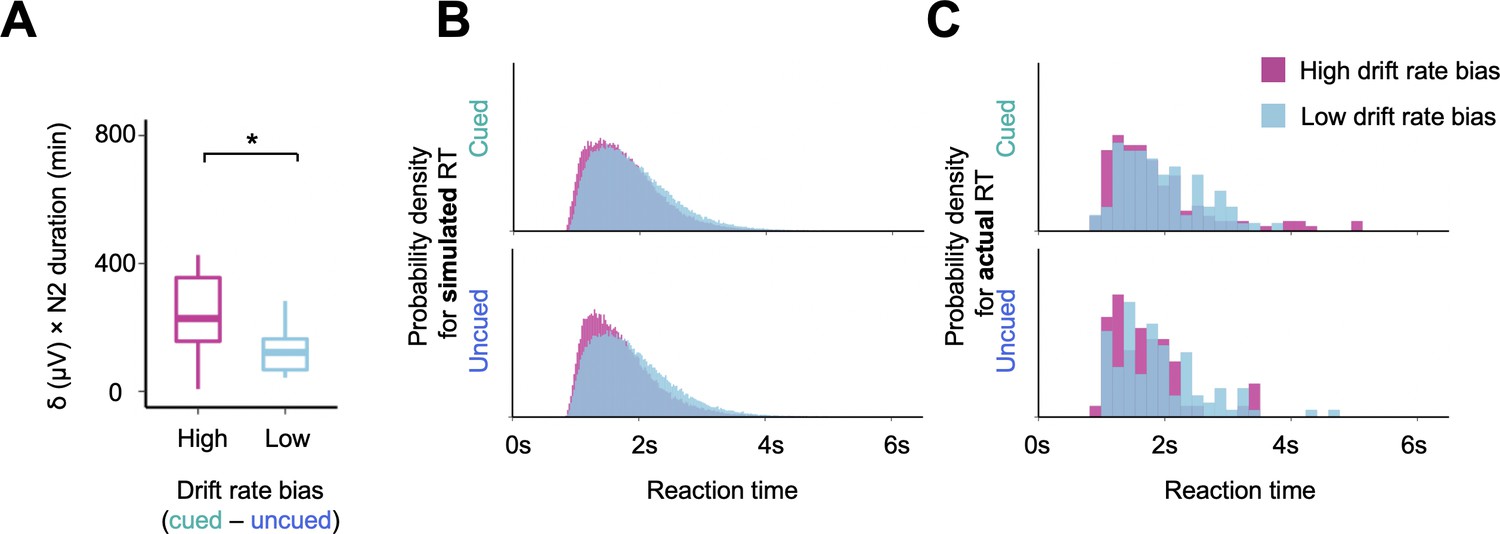
Posterior predictive simulation revealed that the between-subject variability in the estimated drift rates was related to the variation observed in RT distributions.
(A) Compared with subjects associated with low drift rate bias (median split within N = 23 subjects), those with high drift rate bias presented a significantly higher degree of reactivation during N2 sleep, as indexed by the product of N2 duration and the degree of increase in delta band power evoked by verbal stimulation during N2 (Wilcoxon rank-sum test, Z = 2.09, p = 0.036). (B–C) Simulated (for 1000 simulation runs) and actual (N = 23) probability density of RT for subjects with high vs. low drift rate bias choosing cued and uncued items (detailed percentiles of RT distributions are shown in Supplementary file 1, Table 1I).
Additional files
-
Supplementary file 1
Supplementary Tables 1A through 1I
(A) Table 1A. Subject information. All participants were asked to report their subjective level of hunger (from 1 = ‘not hungry at all’ to 8 = ‘very hungry’) and vigilance (from 1 = ‘very vigilant, not sleepy at all’ to 7 = ‘very sleepy, taking great efforts to keep awake’) before and after the verbal stimulation. Parentheses contain standard deviations. p-Values are calculated using two-tailed Student T test for comparing the difference in mean of each variable between the sleep and wake groups. Parentheses contain standard deviations. (B) Table 1B. Snack items included in the study together with their English translations. Snack items were selected based on a pilot experiment in which 49 subjects were recruited to assess the familiarity, valence, and subjective arousal (Self-Assessment-Manikin scale) of a pool of candidate snacks. Based on those ratings, we selected 60 items with median familiarity (mean ±SD: 3.51 ± 0.84), positive valence (mean ±SD: 5.08 ± 1.26), and median arousal level (mean ±SD: 4.65 ± 1.33) (associated with Figure 1). (C) Table 1C. Linear regressions on the effect of verbal cueing for sleep and wake groups after controlling for differences in age, gender, BMI, as well as self-reported familiarity and differences in vigilance and hunger before and after the cueing session. The dependent variable in the first regression is equal to the average difference of ΔWTP between cued and uncued items for each subject. The dependent variable in the second regression is equal to the likelihood of choosing cued over uncued item in the binary decision task for each subject. *p < 0.05; **p < 0.01; ***p < 0.001, two-tailed (associated with Figure 2). (D) Table 1D. Durations of sleep stages (in minutes) for sleep group subjects with or without ERP. There is no significant difference in the duration of sleep stages. Parentheses contain standard errors. p-Values were calculated using two-tailed Student T test for between-group comparisons (associated with Figure 4). (E) Table 1E. Effects of cueing on preferences and choices in sleep group subjects with or without ERP. There is no significant difference in the effect of verbal stimulation on either the ΔWTP or choice behavior in the binary decision task. Parentheses contain standard errors. p-Values are calculated using two-tailed Student T test for between-group comparisons (associated with Figure 4). (F) Table 1F. Average EEG amplitudes of positive/negative components of the K-complex-like evoked responses (KCs) at each electrode. We averaged the EEG amplitudes measured over the interval from 200 to 600 ms (for KC+) and from 600 to 1200 ms (for KC-) for each subject at each electrode. We found significant KC+/KC- at the frontal electrodes F3 and F4, and the central electrodes C3 and C4 (Student T-test, N = 23, all p values are Bonferroni corrected). For electrodes with significant KCs (F3, F4, C3, and C4), repeated measures ANOVA showed no significant difference among these four electrodes in both KC+ (F3,84 = 0.528, p = 0.664) and in KC- (F3,84 = 0.528, p = 0.664). *p < 0.05; **p < 0.01; ***p < 0.001, two-tailed (associated with Figure 4A). (G) Table 1G. Pearson correlations between ΔWTP and averaged cue-induced power for each frequency band at either subject- or item-levels. For across subject analysis, we examined the correlation between the ΔWTP and the power change of cue-induced band that were averaged over all cued items within each subject. For across item analysis, we examined the correlation between the ΔWTP and the power change of cue-induced band that were averaged over all subjects given the same cued item. All p-values are Bonferroni corrected. *p < 0.05; **p < 0.01; ***p < 0.001, two-tailed (associated with Figure 4B–D). (H) Table 1H. Priors used in the hierarchical Bayesian model estimation for LBA. We performed model estimation under the assumption that individual parameters are drawn from distributions for the sleep and wake group separately, with group level parameters sampled from joint prior distributions (associated with Figure 4—figure supplements 1–4). (I) Table 1I. Percentiles of RT distributions in panel B-C. These data show that a high drift rate bias (therefore high reactivation during N2) is associated with a more prominent change in the tail of the RT distribution and a smaller change in the leading ledge (associated with Figure 4—figure supplements 1–4).
- https://doi.org/10.7554/eLife.40583.013
-
Transparent reporting form
- https://doi.org/10.7554/eLife.40583.014
Download links
A two-part list of links to download the article, or parts of the article, in various formats.
Downloads (link to download the article as PDF)
Open citations (links to open the citations from this article in various online reference manager services)
Cite this article (links to download the citations from this article in formats compatible with various reference manager tools)
Promoting subjective preferences in simple economic choices during nap
eLife 7:e40583.
https://doi.org/10.7554/eLife.40583


