Targets and genomic constraints of ectopic Dnmt3b expression
- Harvard University, United States
- Max Planck Institute for Molecular Genetics, Germany
- Harvard Medical School, United States
- Boston Children's Hospital, United States
- Broad Institute of MIT and Harvard, United States
Figures
Figure 1 with 3 supplements
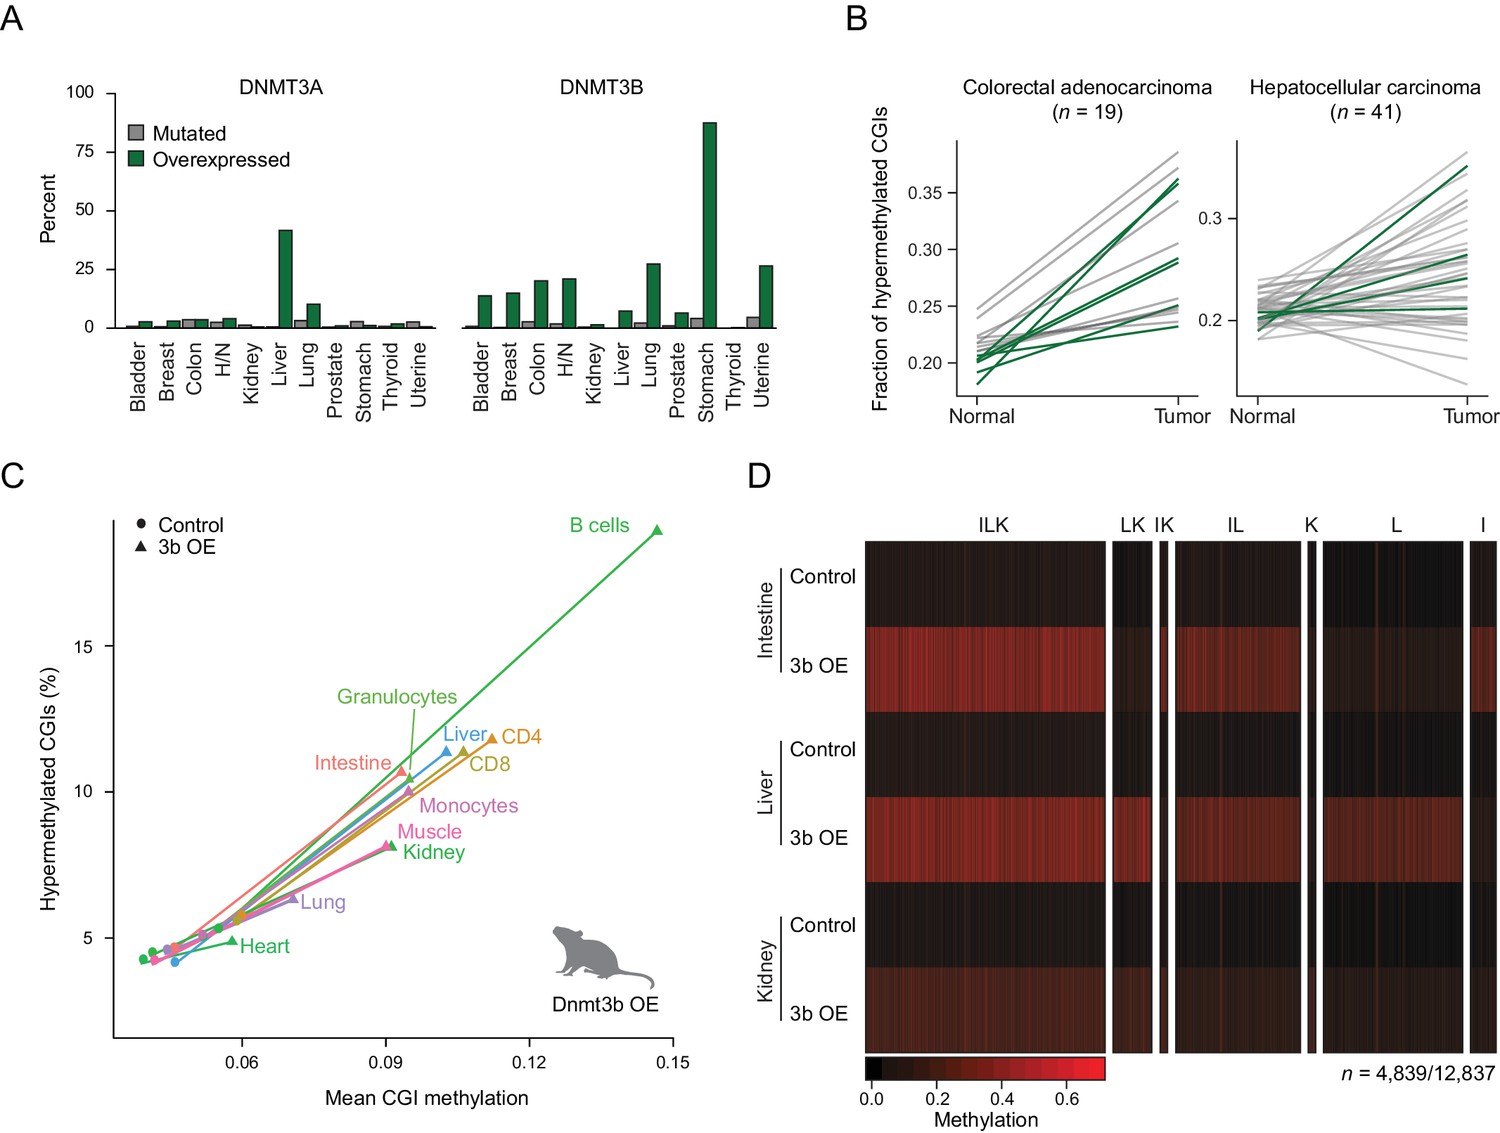
Dnmt3b overexpression in human cancer types and an ectopic mouse model.
(A) Incidence of DNMT3A and DNMT3B mutation and overexpression in human cancers, based on data from The Cancer Genome Atlas (TCGA). H/N = head and neck. (B) Fraction of hypermethylated (defined as ≥0.3 increase in average CpG methylation) CpG islands (CGIs) in liver hepatocellular carcinomas and colorectal adenocarcinoma. Each line represents a pair of matched normal and tumor samples from a single patient. Patients that show overexpression of DNMT3A or DNMT3B (z-score ≥ 2) in the tumor sample are shown in dark green. (C) Mean CGI methylation vs percentage of hypermethylated CGIs (methylation ≥ 0.3) for 11 tissues harvested from age-matched control and Dnmt3b overexpression (3b OE) mice (0 – 1.5M dox). Data are based on RRBS profiles for matched CGIs (n = 7,467). (D) Heatmap of methylation levels at differentially methylated CGIs (FDR q-value <0.05, methylation difference of ≥ 0.2) in intestine, liver, and kidney upon 3b OE (3 – 6M dox). Each sample is the mean of two technical and two biological replicates. CGIs are clustered by their methylation status in the three tissues. Clusters are labeled with I (intestine), L (liver), or K (kidney) according to whether that cluster of DMRs was hypermethylated in the labeled tissue.
Figure 1—figure supplement 1
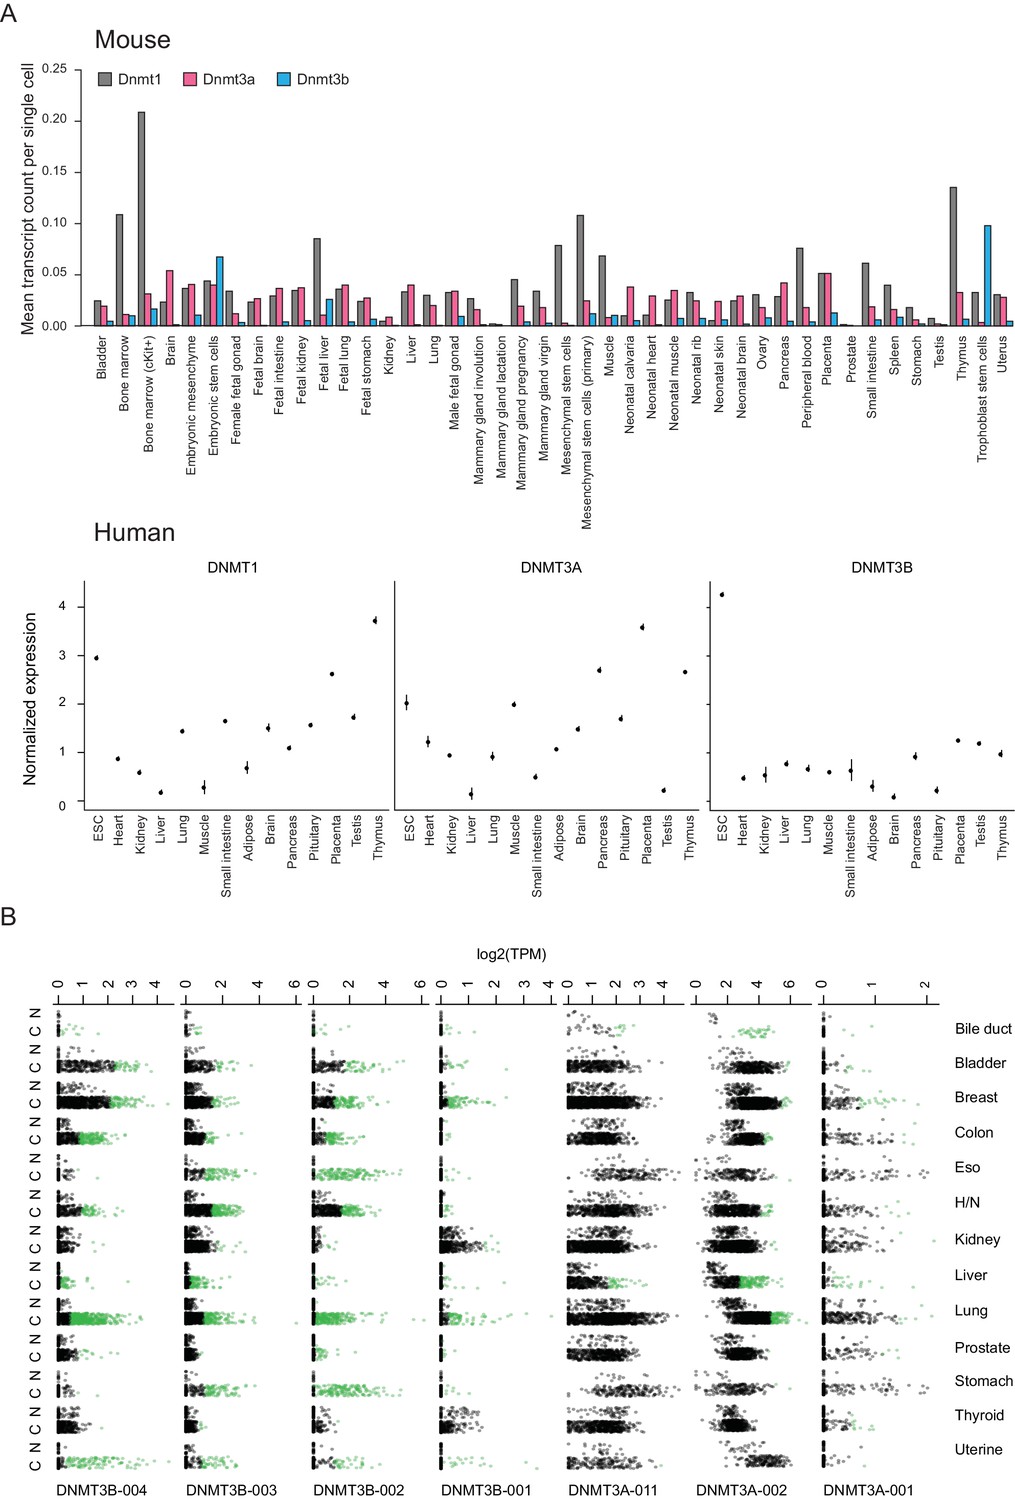
Normalized expression of mouse and human DNA methyltransferases across selected cell and tissue types as well as human DNMT isoform expression in TCGA samples.
(A) Top: Gene expression data for Dnmt1, Dnmt3a and Dnmt3b across a variety of mouse embryonic and somatic cell types based on single cell RNA-seq data from Han et al. (2018). Bottom: Gene expression data for DNMT1, DNMT3A, and DNMT3B in human embryonic stem cells (ESCs) and somatic tissues based on RNA-seq data from Yue et al. (2014). Dots are means and lines represent ±one standard error. (B) Expression of the different isoforms of DNMT3A and DNMT3B in normal and tumor samples as measured by RNA-seq from The Cancer Genome Atlas (TCGA). Patients exhibiting overexpression (z-score ≥3 based on null distribution of expression in normal samples) of an isoform in a tumor sample are shown as green dots. C = cancer, N = normal, H/N = head and neck.
Figure 1—figure supplement 2
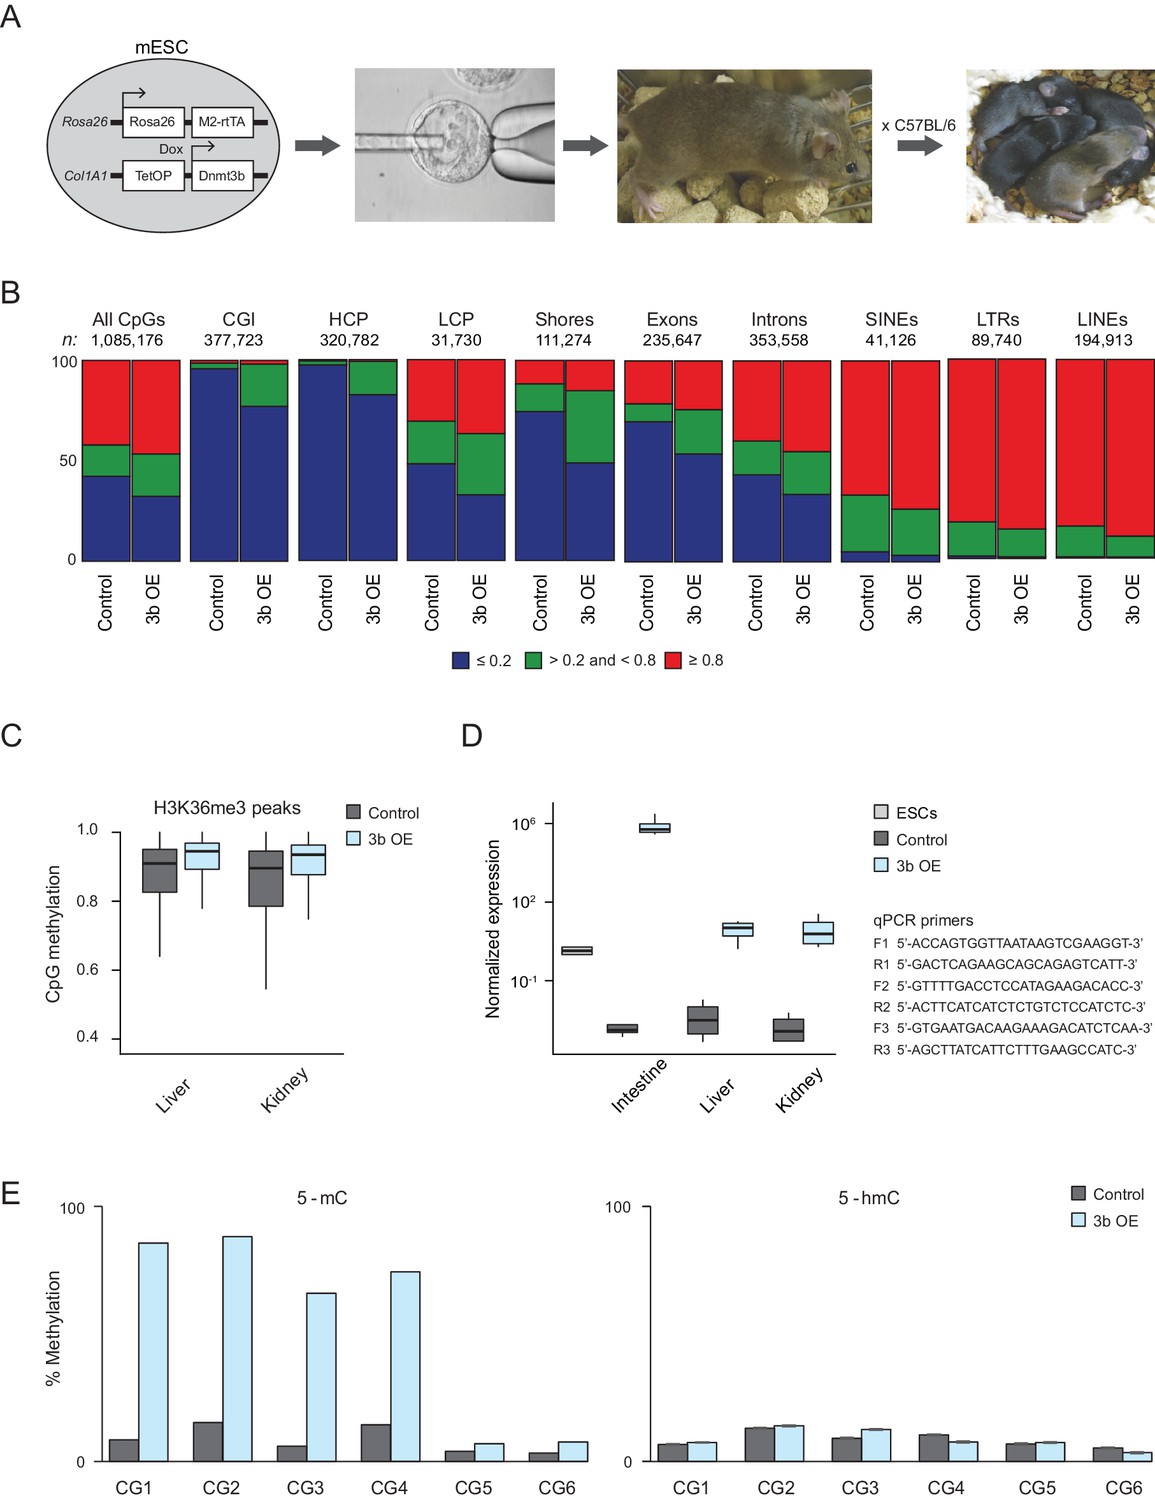
Characteristics of ectopic Dnmt3b-induced CGI hypermethylation.
(A) Experimental mice were obtained through blastocyst injections followed by breeding the chimeras (ESCs are C57BL/6 × 129/Sv) back to C57BL/6 mice. (B) Fraction of CpGs with high (≥0.8; red), intermediate (>0.2 and <0.8; green) and low (≤0.2; blue) methylation in liver from control and induced (3b OE) mice (3 – 6M dox). The total number of included CpGs and the number associated with each genomic feature is shown above each bar plot. (C) DNA methylation levels for CpGs overlapping with H3K36me3 peaks (from ENCODE) for control and induced kidney and liver. In both tissues, the difference in methylation levels was highly significant (P-value < 2.2×10⁻¹⁶, paired t-test). (D) Normalized expression levels using RT-qPCR analysis of Dnmt3b in intestine, liver and kidney in age-matched control and induced (3b OE) mice. The expression level of Dnmt3b in wild type mouse ESCs is presented for comparison. Errors bars were generated based on four technical replicates from two biological replicates. Boxes display the interquartile range and whiskers extend to the most extreme data point that is no more than 1.5 times the interquartile range; the bold line indicates the median value. Primer sequences are shown on the right, F = forward, R = reverse. (E) For six CpGs, the 5-methyl cytosine (5-mC) and 5-hydroxymethyl cytosine (5-hmC) levels in control and induced liver are shown. CG1: chr10:128174495, CG2: chr10:128093746, CG3: chr10:125224095, CG4: chr9:40679519, CG5: chr17:3084034, CG6: chr10:120867342.
Figure 1—figure supplement 3
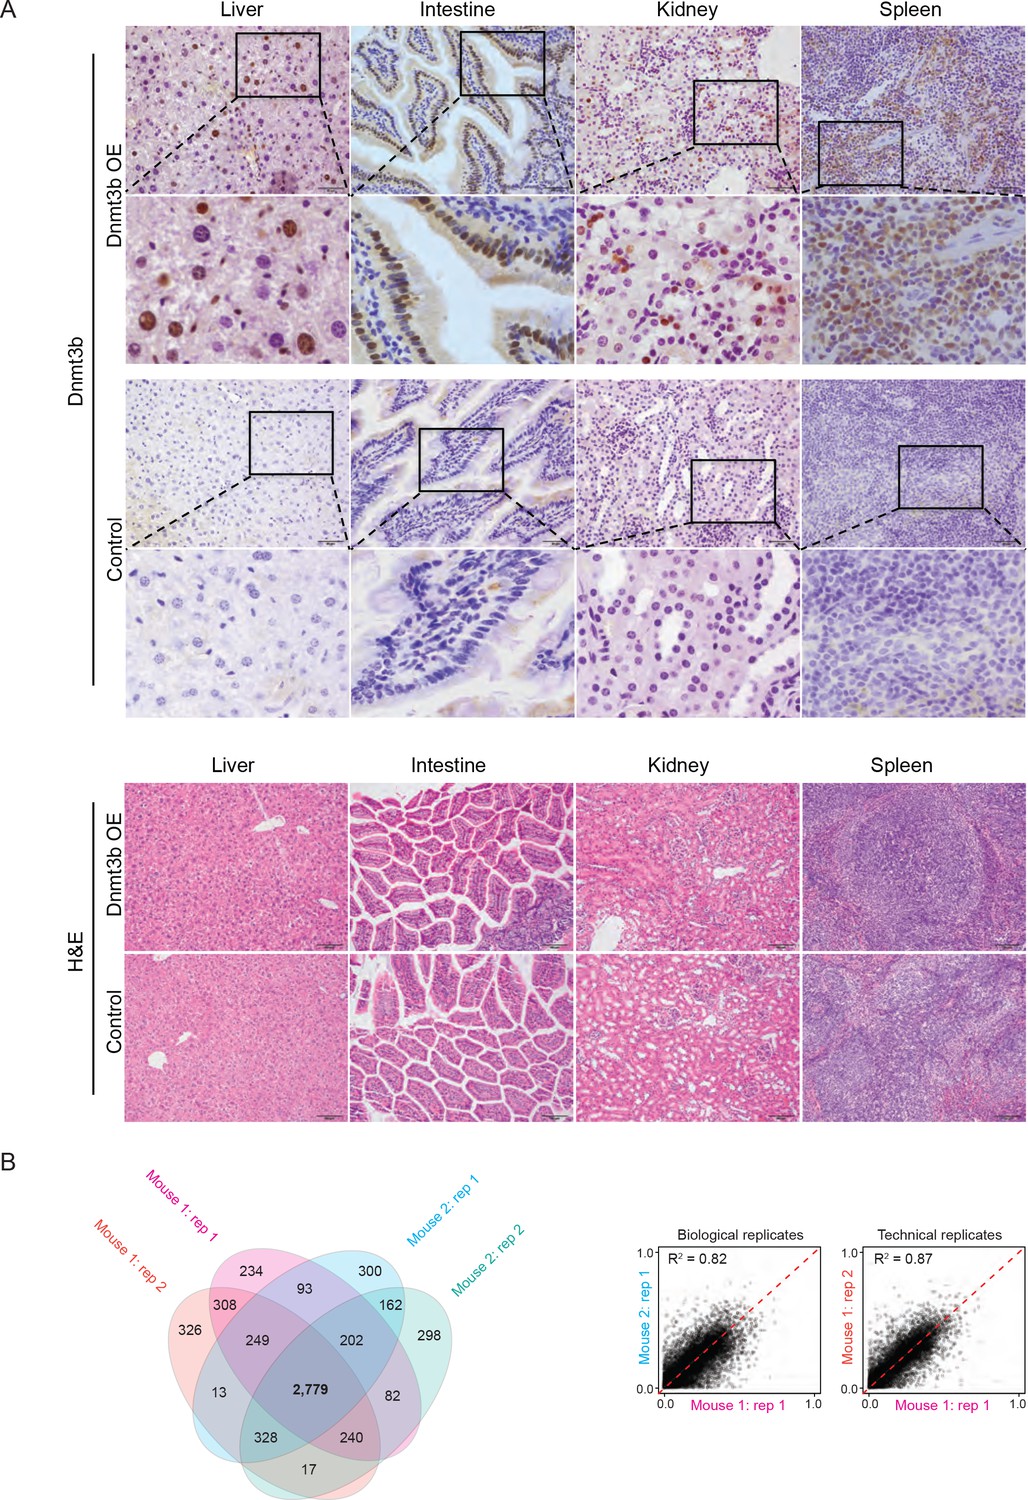
Tissues in which Dnmt3b is ectopically expressed are phenotypically normal and replicates show high reproducibility.
(A) Tissues stained for DNMT3B and hematoxylin and eosin (H and E) in control and Dnmt3b overexpression mice show no gross phenotypic changes. (B) For the liver, two technical replicates from two Dnmt3b OE and control mice (biological replicates, 3 – 6M dox) were compared to assess concordance between CGI hypermethylation. The number of CGIs with methylation >0.2 was calculated and is displayed in the venn diagram. Correlation between biological and technical replicates is displayed as scatter plots with the Pearson correlation coefficient shown.
Figure 2 with 1 supplement
Ectopic DNMT3B targets predominantly silent and lowly expressed genes.
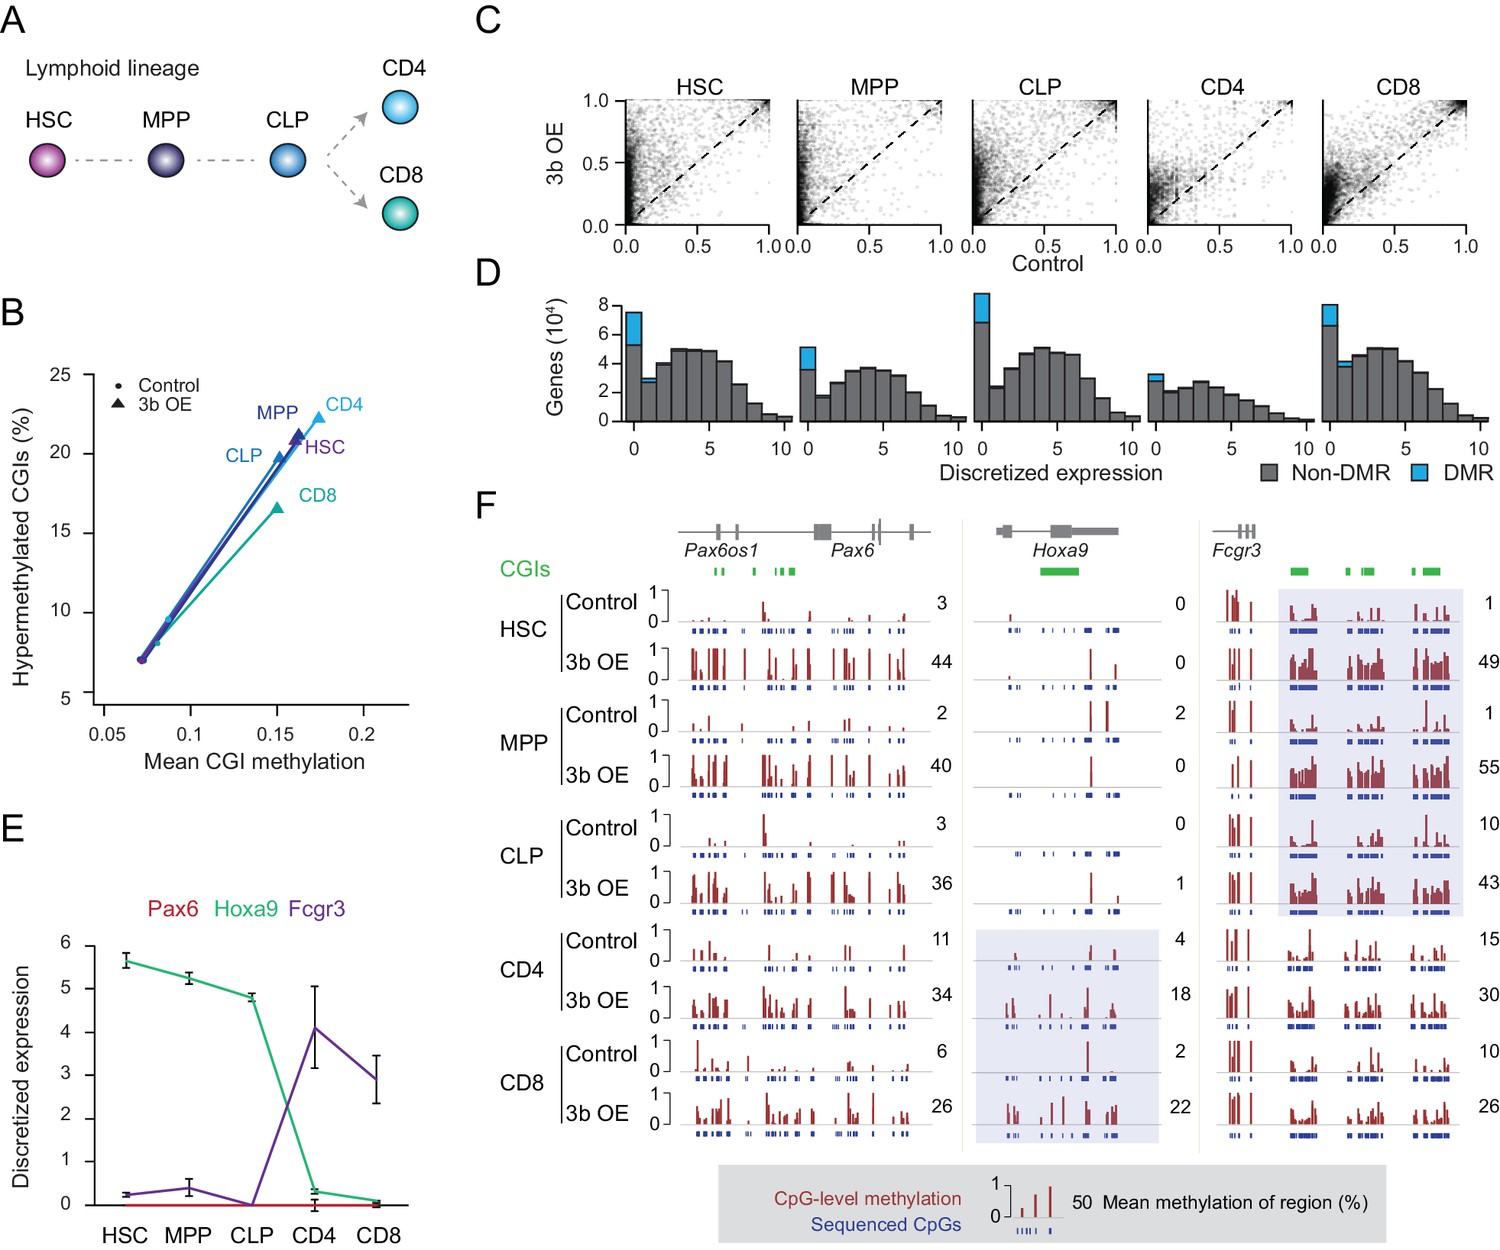
(A) Schematic of selected hematopoietic cell types isolated from Dnmt3b induced and control mice (0 – 3M dox). HSC: hematopoietic stem cell, MPP: multipotent progenitor, Flk2 positive, CLP: common lymphoid progenitor, CD4/8+: T lymphocytes. (B) Mean CGI methylation vs percentage of hypermethylated CGIs (methylation ≥0.3) for the different blood cell types sorted from age-matched control and Dnmt3b overexpression (3b OE) mice (0 – 3M dox). Data are based on RRBS profiles for matched CGIs (n = 9,283) (C) Scatter plots of DNA methylation level for consistently covered CGIs (n = 14,584) in induced and control mice. (D) Number of differentially methylated promoters in each cell type stratified by normalized expression value of the associated gene. Data are taken from normal lymphoid differentiation (Bock et al., 2012). (E) WT expression levels of Pax6, Hoxa9 and Fcgr3 across all five hematopoietic cell types assayed. Data are taken from normal lymphoid differentiation (Bock et al., 2012). (F) Matching DNA methylation data as genome browser tracks and mean methylation (number on the right) for the displayed regions around Pax6 (chr2:105,506,372–105,523,591), Hoxa9 (chr2:105,506,372–105,523,591) and Fcgr3 (chr1:172,986,522–173,013,977). The relevant DMRs at the Hoxa9 and Fcgr3 promoters in the blood cells are highlighted. For the CGIs located near to Fcgr3, comparing control and induced CLP samples generated highly significant P-values (2.5 × 10⁻¹¹ to 4.03 × 10⁻²²). Although the level of methylation gained at CGIs in CD4+ cells was clearly lower than in CLP cells (mean difference of 0.19 vs 0.37), the P-values for CD4+ 3bOE vs control were still significant (6.0 × 10⁻⁴ to 7.83 × 10⁻⁶). Blue boxes highlight the difference in methylation gain that correlates with change in gene expression.
Figure 2—figure supplement 1
Analysis of blood cell population frequencies and prevalence of DMRs by promoter class.
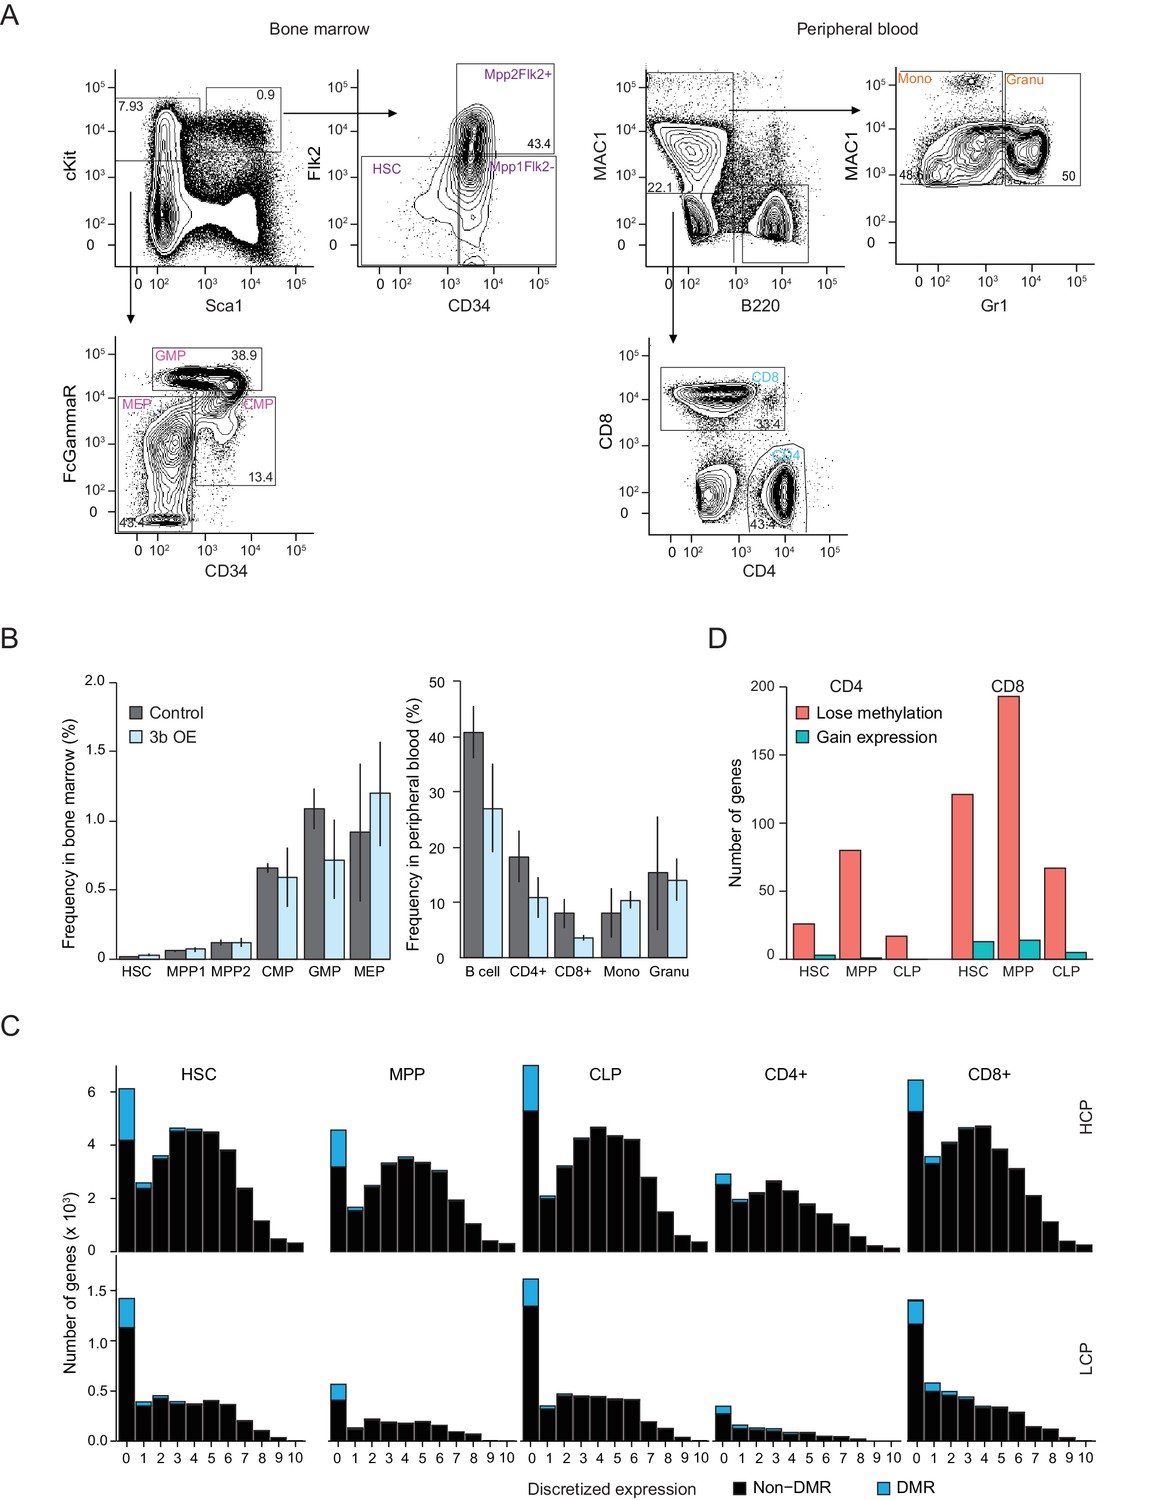
(A) Fluorescent activated cell sorting (FACS) of bone marrow or peripheral blood using established surface marker sets (see Materials and methods). Percentage of hematopoietic stem cells (HSCs) and progenitor cells including MPP1 (Flk2 positive), MPP2 (Flk2 negative), CMP (common myeloid progenitor), GMP (granulocyte-monocyte progenitor), MEP (megakaryocyte-erythroid progenitor) in bone marrow as well as the terminally differentiated B cells, T cells (CD4 positive and CD8 positive), Mono (monocytes) and Granu (granulocytes) in peripheral blood from control and inducible Dnmt3b mice (0 – 3M dox). (B) Frequency of different cell populations in bone marrow and peripheral blood from control and inducible Dnmt3b mice (0 – 3M dox). Error bars represent three biological replicates. (C) Frequency of DMRs and non-DMRs across discretized expression bins separated into high CpG dense promoters (HCPs, top) and low CpG dense promoters (LCP, bottom). (D) Number of genes with high CpG dense promoters (HCPs) that gain methylation in progenitor cells (HSC, MPP, CLP) upon expression of Dnmt3b (minimum gain of methylation 0.2, FDR q-value <0.05), but lose it in the terminally differentiated CD4 +and CD8+cells while Dnmt3b is being overexpressed (minimum loss of methylation 0.2, FDR q-value <0.05). A small fraction of these genes also show an increase in expression during differentiation from the respective progenitor to the terminally differentiated cell type in untreated cells.
Figure 3 with 1 supplement
Underlying chromatin landscape defines the ectopic DNMT3B target spectrum.
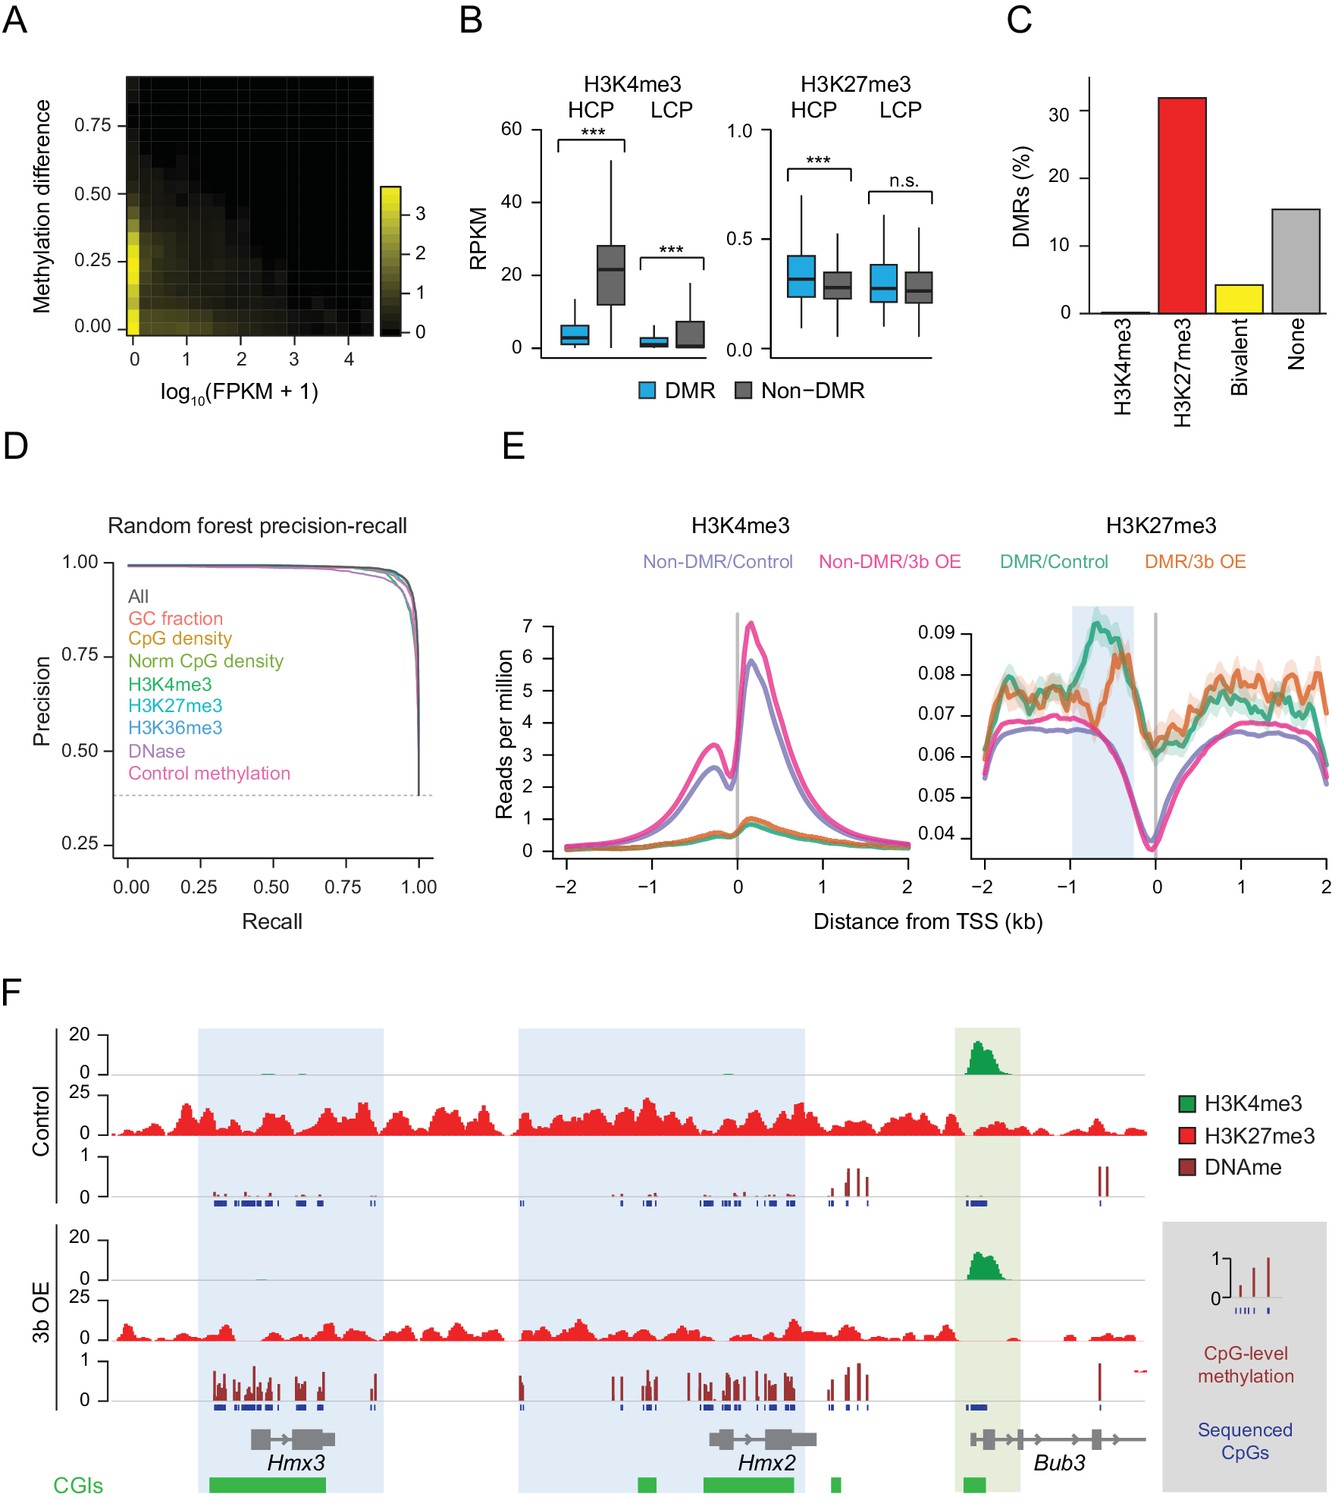
(A) Two-dimensional density plot of methylation gain at promoter CGIs vs. expression of corresponding genes in mouse liver (3–6M dox). (B) H3K4me3 and H3K27me3 enrichment at DMR vs non-DMR promoters prior to Dnmt3b induction (mouse liver). Promoters are classified into high CpG density promoters (HCP) and low CpG density promoters (LCP). The distributions of the chromatin marks were compared using a two-sample t-test. H3K4me3 was significantly lower at DMRs both for HCPs (P-value = 5×10−258) and LCPs (P-value = 3×10−46). H3K27me3 was slightly, but significantly (P-value = 9×10⁻⁸) enriched at HCP DMRs. Boxes display the interquartile range and whiskers extend to the most extreme data point that is no more than 1.5 times the interquartile range; the bold line indicates the median value. (C) Fraction of CGIs that are differentially methylated when Dnmt3b is overexpressed in liver, stratified into those enriched (FDR q-value < 0.05) for H3K4me3, H3K27me3, H3K4me3 and H3K27me3 (bivalent) or neither mark. (D) Prediction recall curves generated using a random forest classifier predicting the likelihood of a given DMR being a DMR for liver tissue (3 – 6M). ‘All’ uses all listed features as classifiers. For each labeled feature, the respective curve shows the shift in prediction when that feature is removed from the classifier. The top three most influential factors affecting prediction were H3K4me3, DNase and control methylation level. (E) Mean read density plots of H3K4me3 and H3K27me3 at DMR HCPs and non-DMR HCPs centered on transcription start sites (TSS) in liver from control and Dnmt3b induced mice (0 – 3M dox). The blue shading highlights the decrease in H3K27me3 upstream of the TSS under Dnmt3b induction. (F) Genome browser tracks for H3K27me3, H3K4me3 and DNA methylation (RRBS) over a representative genomic region (chr7:138,683,072–138,708,076). CGI DMRs overlapping the Hmx3 and Hmx2 loci are highlighted in light blue. A nearby CGI within the Bub3 promoter region appears protected and shows H3K4me3 enrichment in both control and induced (0 – 3M dox) livers (green highlight).
Figure 3—figure supplement 1
Cross-validation performance of logistic regression at predicting hypermethylated CGIs.
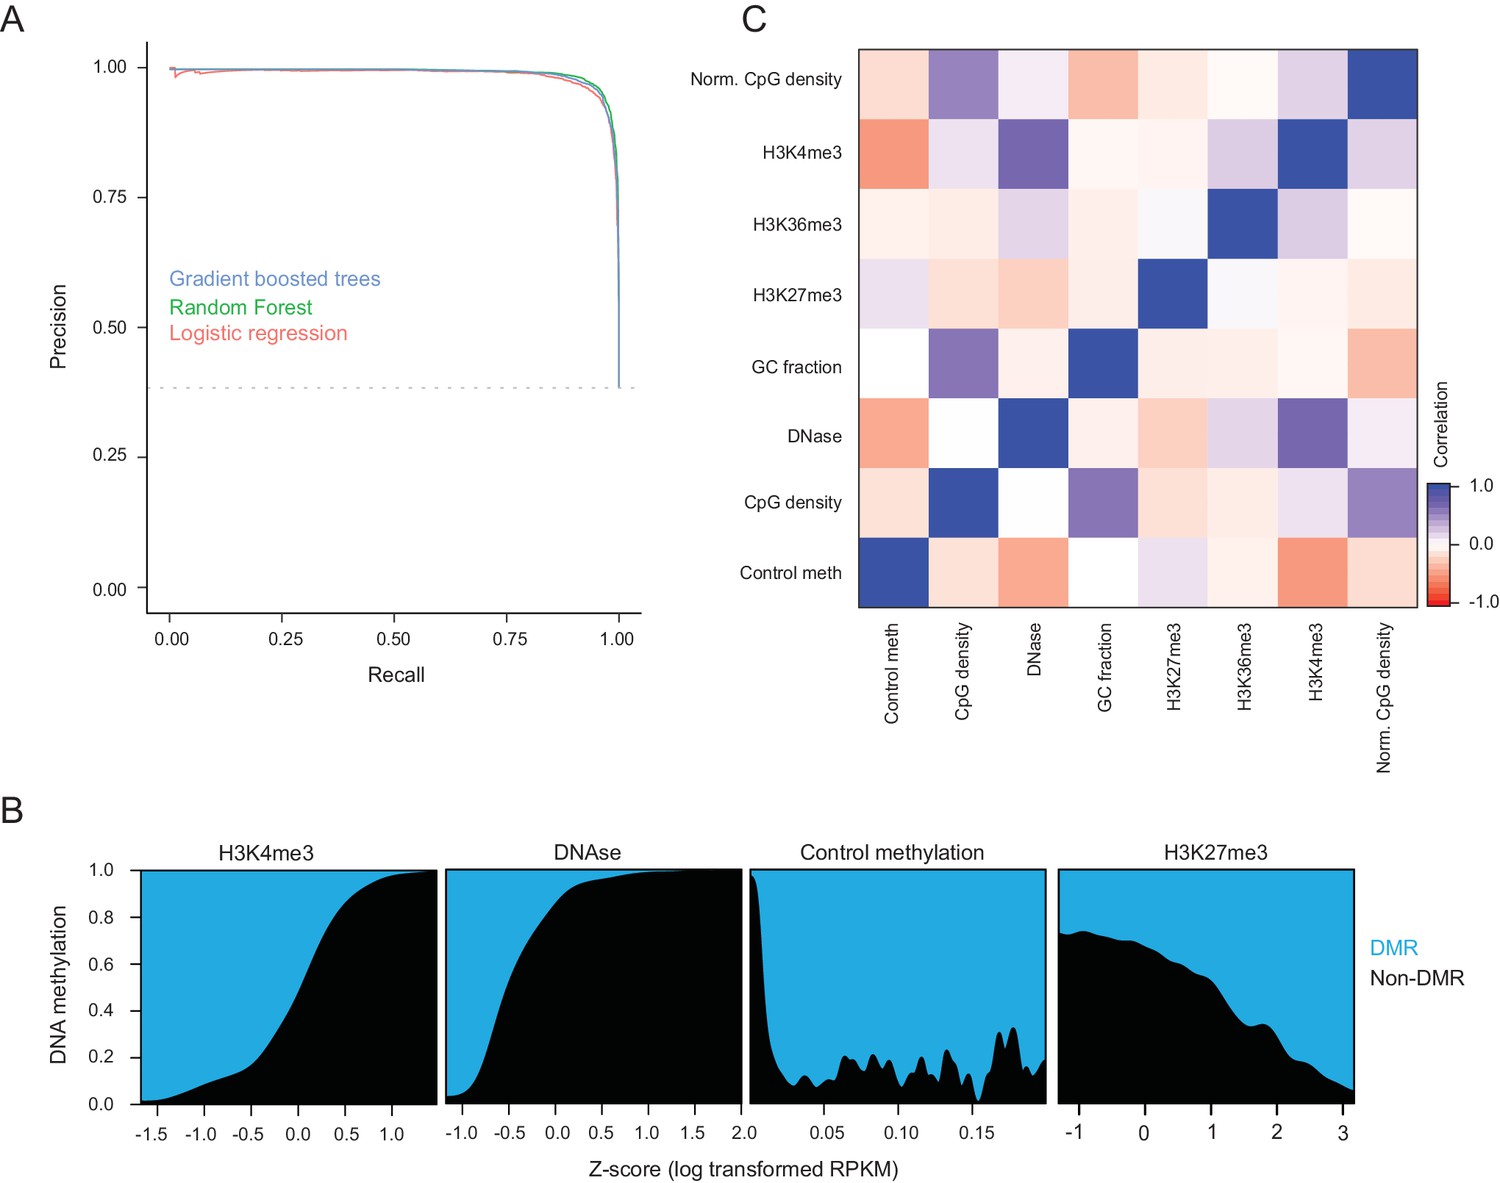
(A) Precision recall curves for DMR CGI prediction using logistic regression, Naive Bayes, decision tree, random forest, and gradient boosted trees with five-fold crossvalidation. DMRs were CGIs with gain in methylation of 0.15 or greater and FDR q-value of 0.05, while the negative set was CGIs that gained less than 0.05. Features used for classification were methylation in control liver, DNase-seq enrichment, H3K4me3 enrichment, H3K27me3 enrichment, raw CpG density, normalized CpG density (Saxonov et al., 2006), and GC content. The random forest classifier showed the best performance. (B) Fraction of CGIs that are DMRs across the dynamic range of each feature. (C) Pearson correlation coefficients between features used for DMR prediction of CGIs.
Figure 4 with 2 supplements

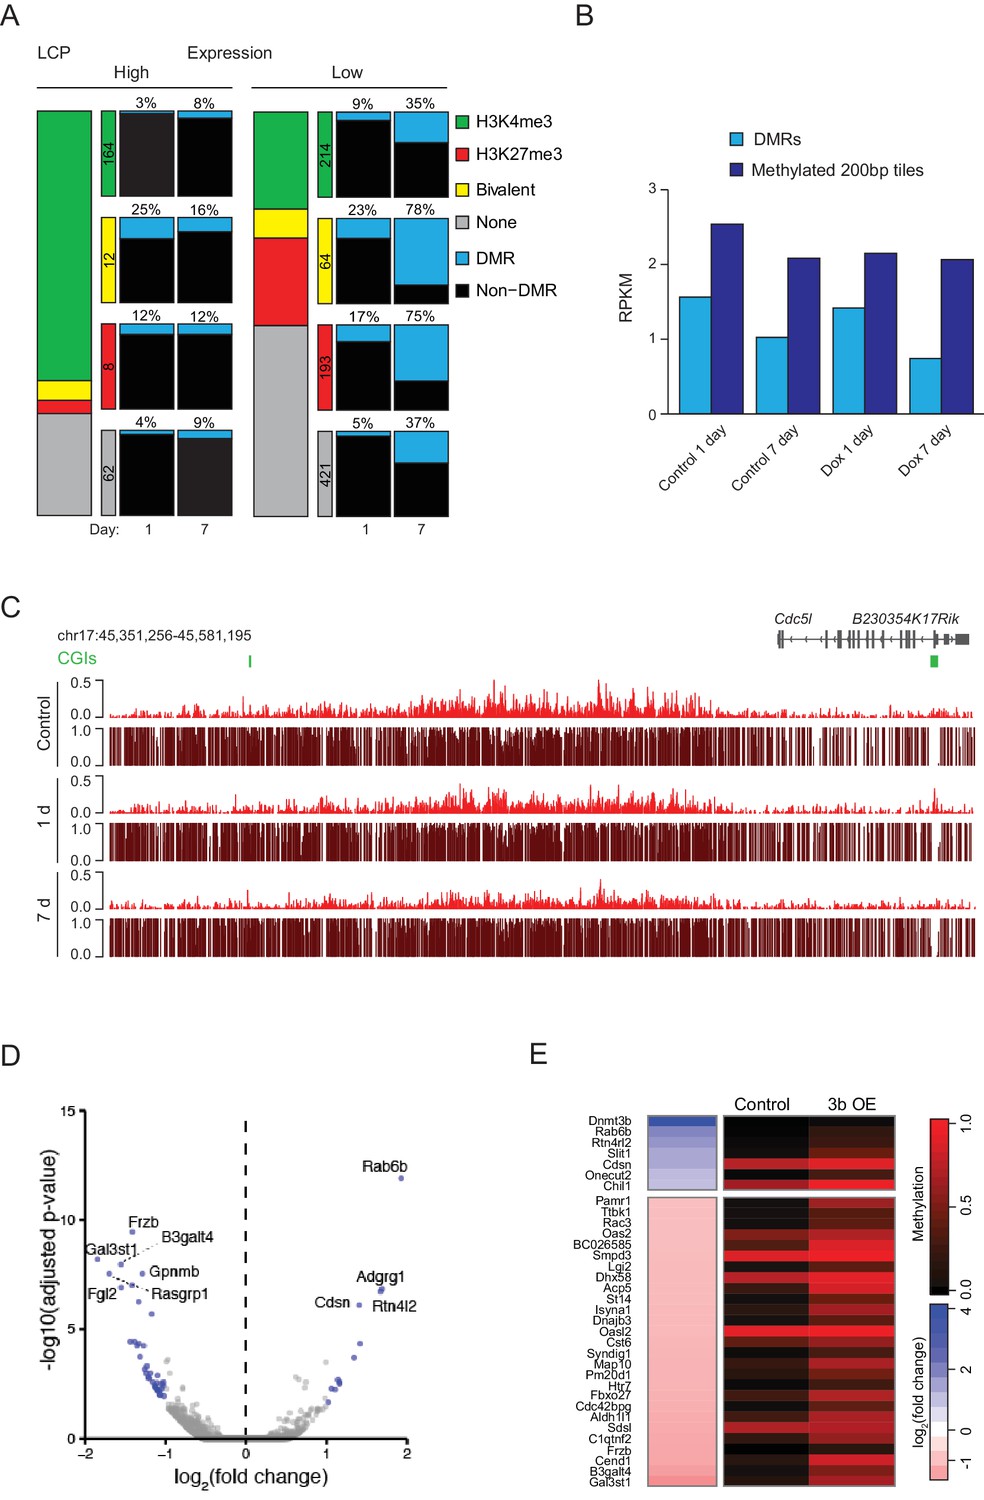
Dnmt3b induced hypermethylation co-occurs with and eventually displaces H3K27me3.
(A) Inducible mouse embryonic fibroblasts (MEFs) were isolated from E13.5 embryos. To minimize the effect of cell culture and study early dynamics, we used a short (one day: 1 d) and extended (seven day: 7 d) induction and collected time-matched uninduced controls. (B) Scatter plot showing the pairwise comparison of CGI methylation (n = 14,513) in control and induced MEFs (1 d and 7 d). (C) Correlation of differential methylation after 1 d and 7 d dox with gene expression, H3K4me3 and H3K27me3 status for HCPs in MEFs. Stacked bar plots show the division of CGIs by their chromatin state with color-coded boxes labeling the number of CGIs in each category. The boxes to the right show a representation of the percentage of CGIs methylated after 1d and 7d induction. (D) Boxplots showing the distribution of DNA methylation levels for all CGIs that are enriched for H3K27me3 (based on the ChIP-BS-seq data; not necessarily DMRs), from MEFs overexpressing Dnmt3b for 1 d and 7 d. Boxes display the interquartile range and whiskers extend to the most extreme data point that is no more than 1.5 times the interquartile range; the bold line indicates the median value. (E) Boxplots showing H3K27me3 enrichment at significant CGI-DMRs in MEFs after inducing Dnmt3b for 1 d and 7 d using ChIP-BS-seq data. Boxes display the interquartile range and whiskers extend to the most extreme data point that is no more than 1.5 times the interquartile range; the bold line indicates the median value. (F) IGV genome browser tracks for H3K27me3 and ChIP-BS-seq data at a representative genomic region (chr18: 64,488,248–64,511,818) in control and induced (1 d and 7 d) MEFs. (G) Control and Dnmt3b overexpression (3b OE) MEF samples were profiled by RRBS in the presence of no shRNA and two different shRNAs targeting the PRC2 component Eed. The heatmap displays mean methylation over all covered CGIs. For each CGI, the chromatin status for H3K4me3 and H3K27me3 is displayed. The Eed shRNA was introduced into WT MEFs before 3bOE was induced via lentiviral transduction. (H) For dox-treated samples, the genomic location of 3b OE targets that are not methylated when a given Eed shRNA is also present compared to the background distribution of CGIs in each category.
Figure 4—figure supplement 1
Ectopic Dnmt3b expression in MEFs.
(A) Correlation of DMRs to gene expression status, H3K4me3 and H3K27me3 enrichment in MEFs (1 d and 7 d dox) for all captured low CpG-density promoters (LCPs). (B) For DMR CGIs and 200 bp tiles that were highly methylated in the 1 d control sample (mean methylation >0.8), H3K27me3 enrichment for control and Dnmt3b overexpression 1 d and 7 d MEFs is displayed. (C) Browser shot displaying H3K27me3 enrichment and DNA methylation levels from each immunoprecipitated read (ChIP-BS) for control and induced MEFs. Globally, a small depletion in H3K27me3 was observed after 7 days in culture for both control and induced MEFs, however backgroud (non DMRs) with both H3K27me3 and DNA methylation in control cells showed no further gain in methylation and therefore no distinct depletion as is observed at DMRs (Figure 4F). (D) Volcano plot of RNA-seq data showing expression changes in MEFs after 7 d induction. Differentially expressed genes (adjusted P-value <0.05, fold change ≥1) are highlighted in blue. (E) Expression fold change (Dnmt3b OE vs. control) and promoter DNA methylation for up/downregulated genes in MEFs after 7 d dox. For genes with multiple promoters corresponding to multiple transcription start sites, the site with lowest methylation is shown.
Figure 4—figure supplement 2
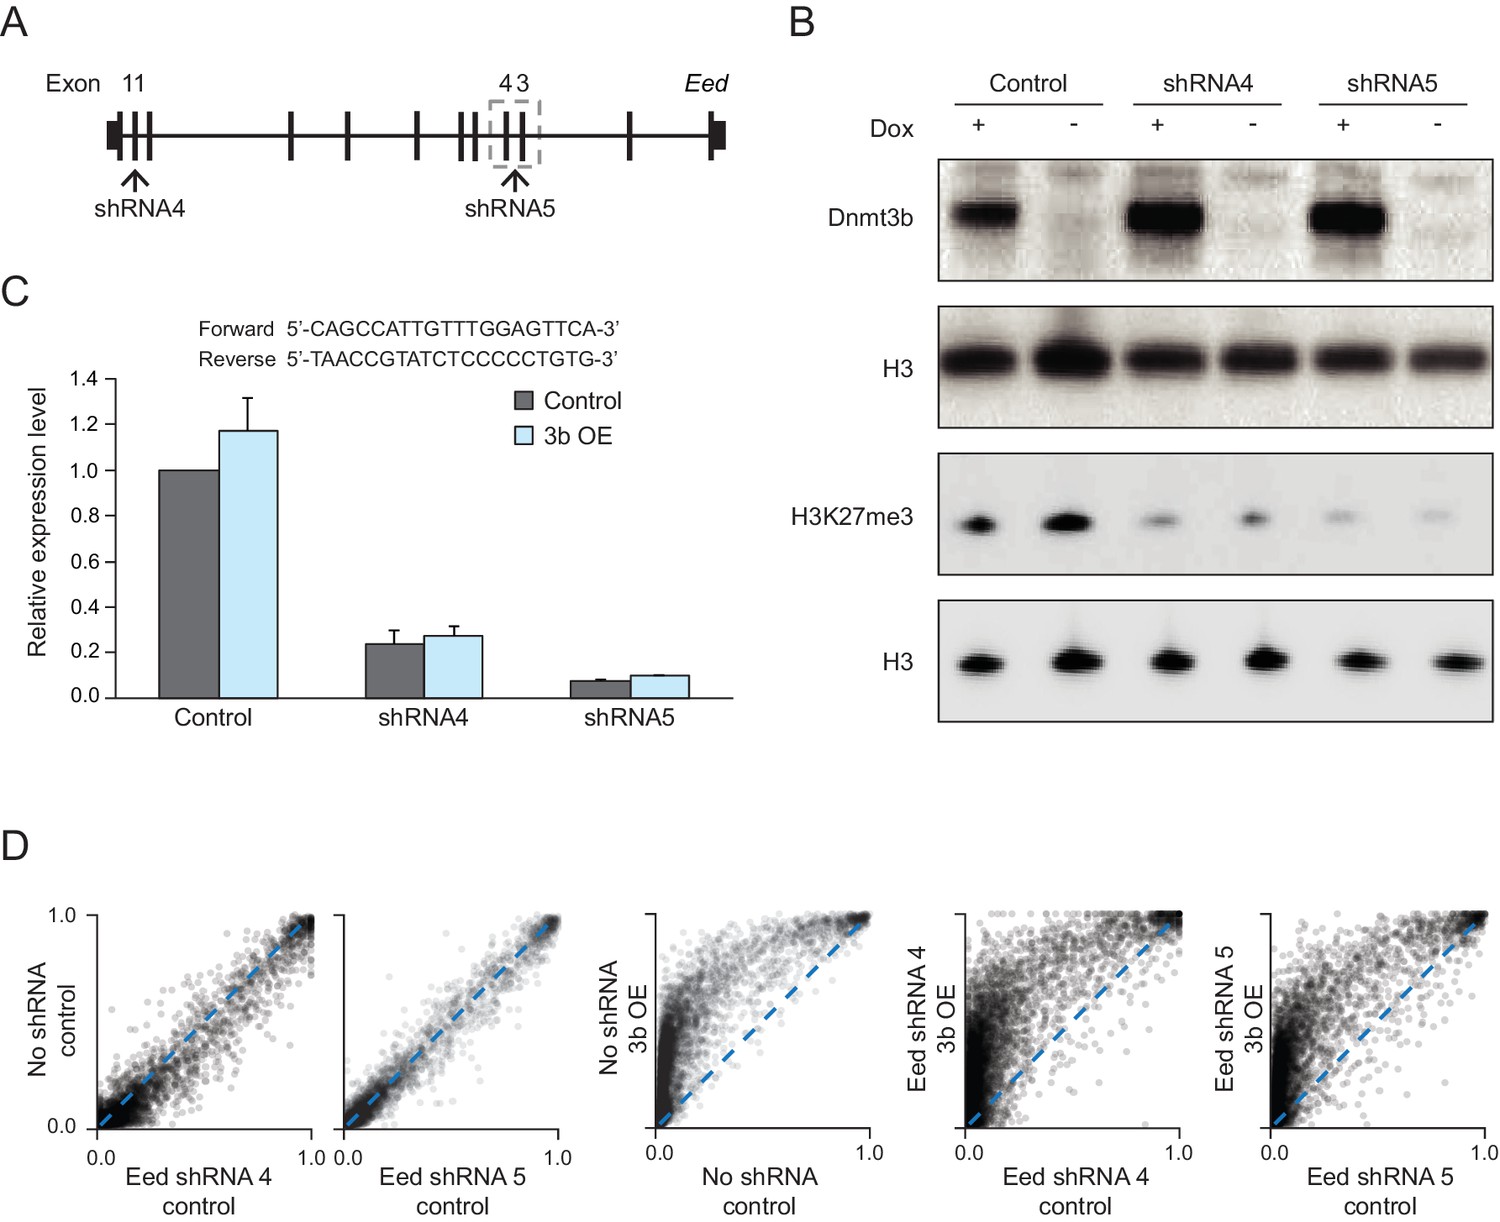
Eed knockdown in MEFs.
(A) Schematic for the target design of two shRNAs against the Eed transcript. Both shRNA4 (exon 11) and shRNA5 (exon 3 and 4) were cloned into the pSicoR-ef1a-GFP vector. (B) Western blot analysis for DNMT3B and H3K27me3 in control and Dnmt3b MEFs (7 d dox) expressing the Eed shRNAs. (C) RT-qPCR analysis for Eed transcript levels in control and Dnmt3b OE MEFs expressing the shRNAs. Data are represented as mean ±standard deviation. Primer sequences are shown underneath. (D) Scatter plots showing DNA methylation levels of CGIs (n = 13,357) in control MEFs and MEFs expressing the Eed shRNAs as well as MEFs that contain both the shRNA and inducible Dnmt3b.
Figure 5 with 1 supplement
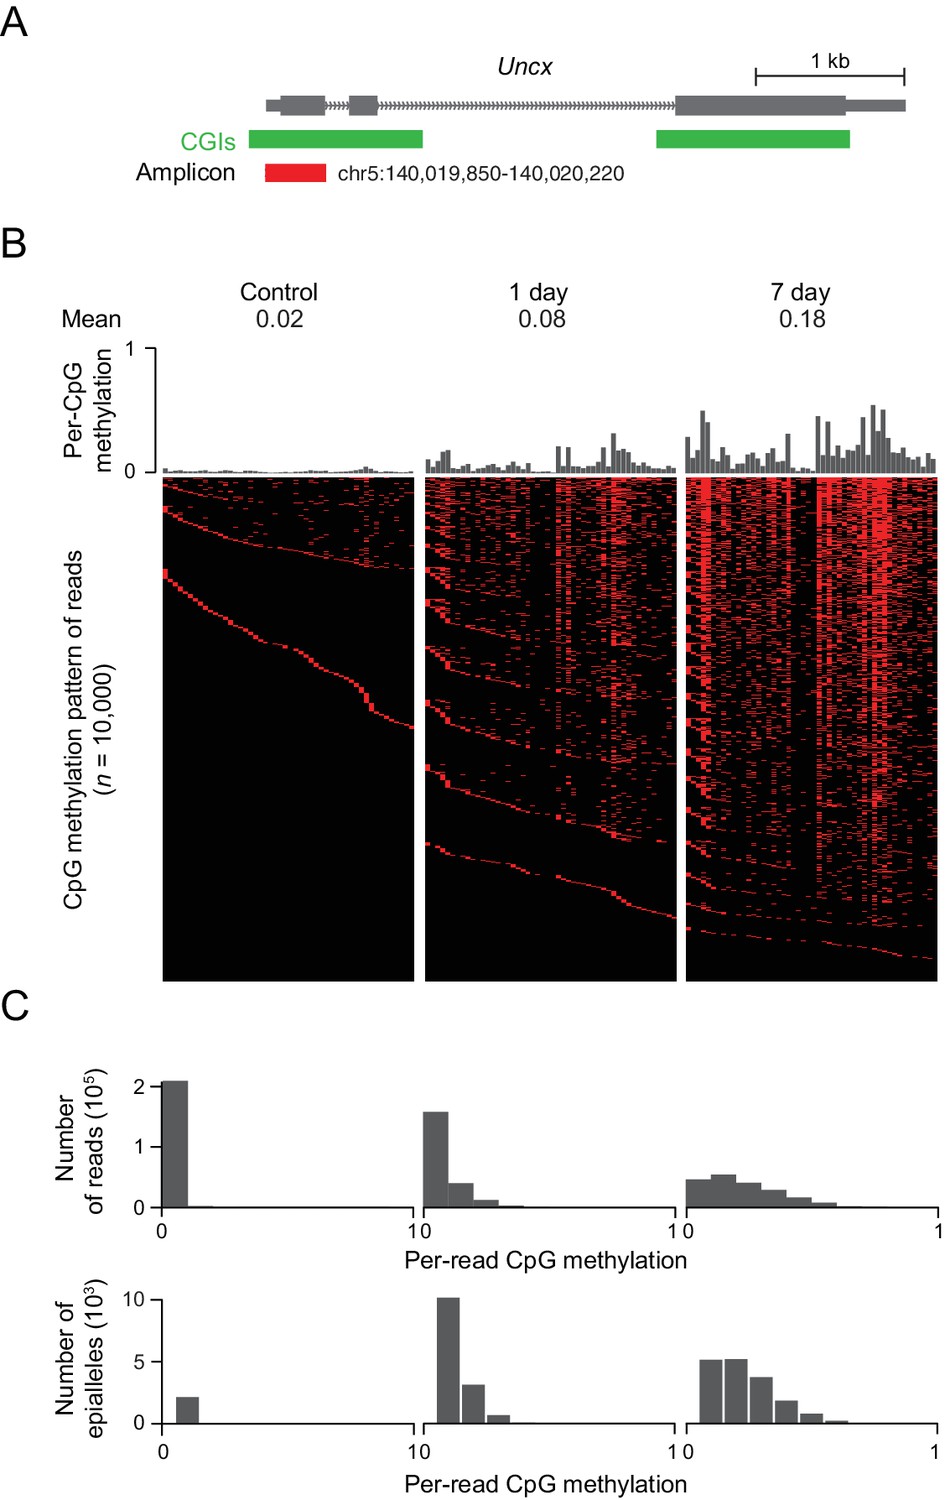
DNMT3B deposits heterogeneous methylation at CGIs.
(A) We selected the CGI promoter of the Uncx gene for ultra-deep bisulfite sequencing. The target amplicon covers 50 CpGs for which the mean methylation levels in control and induced (1 d and 7 d) MEFs are shown. (B) Top: Per CpG methylation over the amplicon region (not drawn to genomic scale). Bottom: Heatmap of individual reads (n = 10,000 randomly selected) showing the patterns (epialleles) of methylated and unmethylated CpGs within individual molecules. Black indicates unmethylated and red methylated C’s in the CpG dinucleotide context. (C) Distribution of per-read methylation and distribution of the number of epialleles across the number of methylated CpGs per molecule for all reads (n = 93,636–147,954).
Figure 5—figure supplement 1
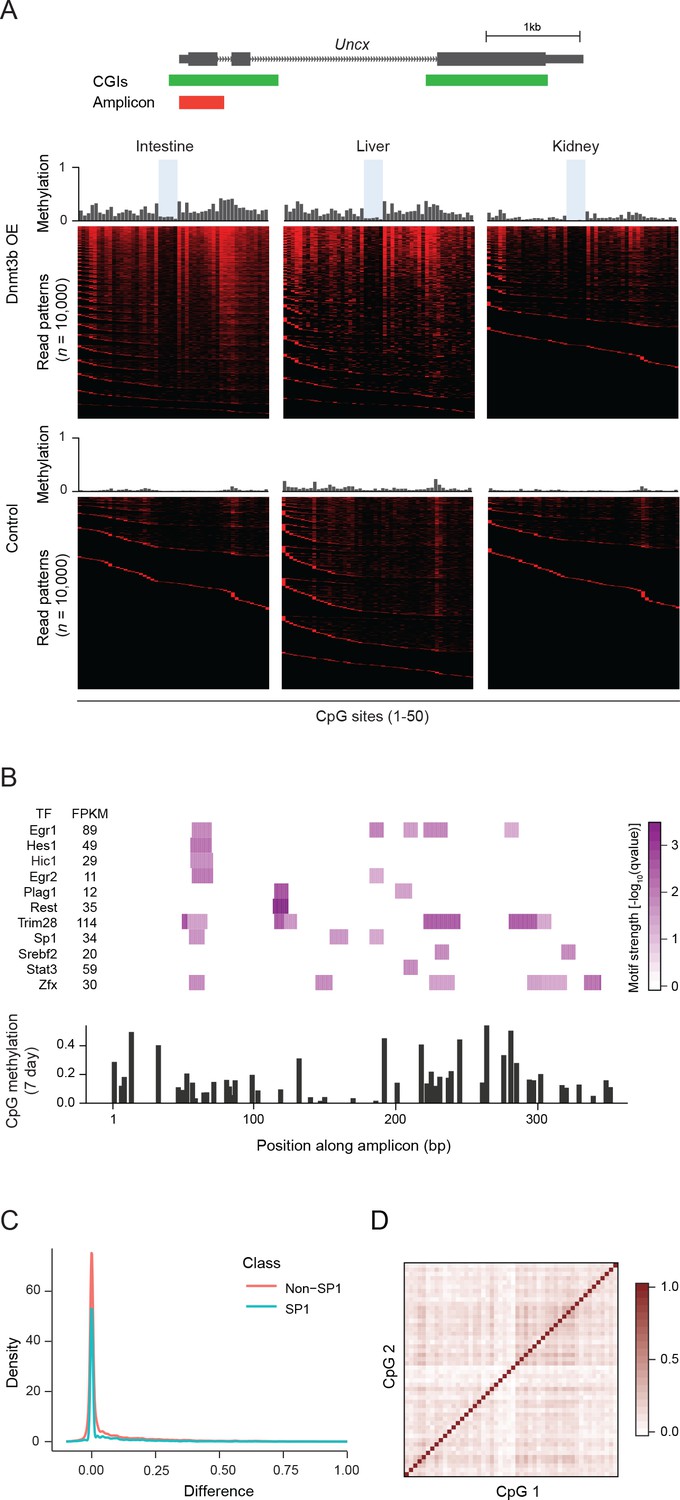
Ultra-deep amplicon-based bisulfite sequencing in mouse tissues and motif analysis.
(A) Amplicon design for the Uncx locus (same as Figure 5a). Mean methylation levels per CpG site (not drawn to genomic scale) of induced (3–6M dox) and control tissues are shown above the heatmaps. Heatmap of individual reads (n = 10,000, randomly selected) showing the patterns (epialleles) of methylated and unmethylated CpGs within individual molecules. Black indicates unmethylated Cs and red methylated Cs in the CpG dinucleotide context. Selected CpG sites that show consistent and stable low methylation level in different tissue/cell types are highlighted in blue. (B) For the Uncx amplicon (from Figure 5a), the level of significance for predicting the presence of a transcription factor motif is displayed (top). Below, the methylation level for each of the 50 CpGs within the amplicon is displayed for MEFs induced for 7 d. (C) For CpGs within Sp1 motifs and non-motif CpGs the difference in methylation for control and induced MEFs (7 d dox) is shown. (D) Pairwise correlation matrix for CpGs within the amplicon across reads.
Figure 6 with 2 supplements
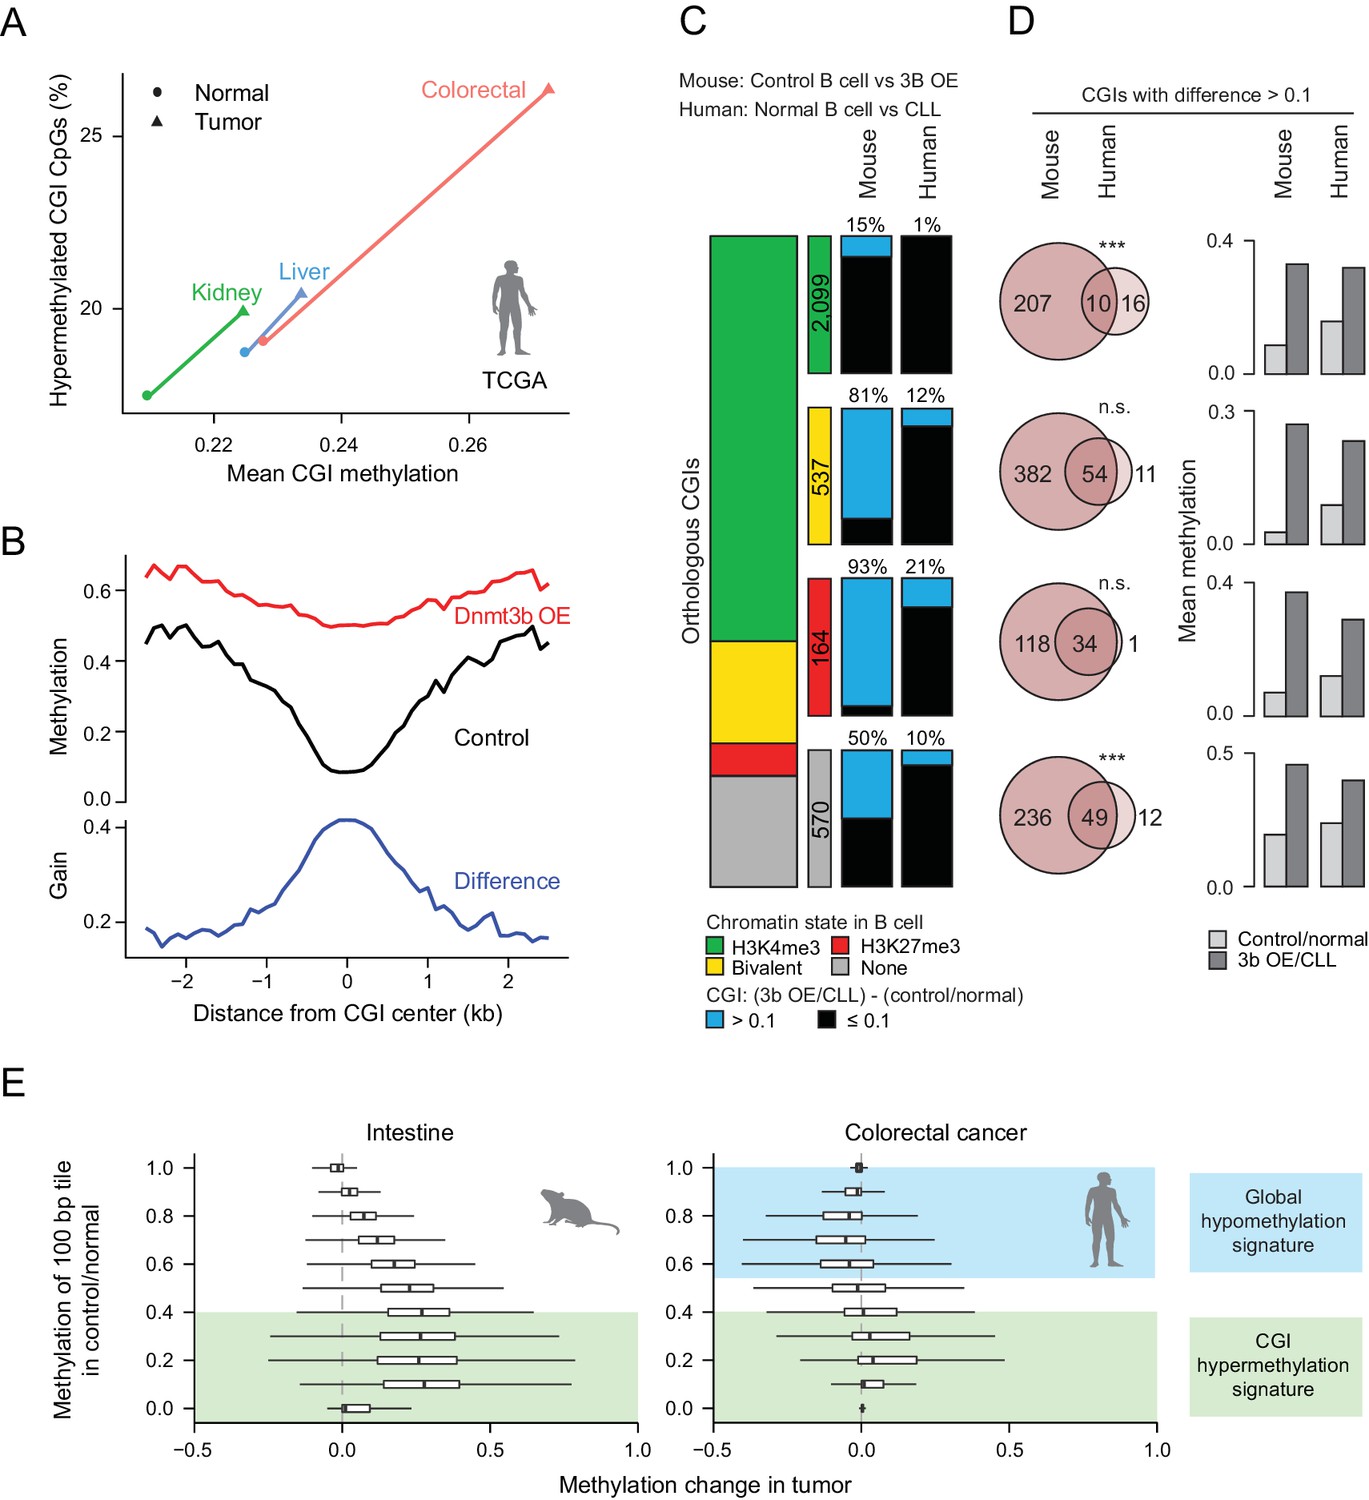
Comparison of features between the ectopic Dnmt3b expression and human cancers.
(A) Mean CGI hypermethylation in matched human samples (cancer and normal). Tumors show an increase in the mean methylation levels of CGIs (x-axis) driven by an overall increase in the fraction of hypermethylated CpGs (beta value >0) in CGIs (y-axis). Data are based on Illumina Infinium HumanMethylation450 BeadChip profiles generated by TCGA. (B) Composite plot of CGI DMRs in 3b OE (3–6M dox) and control mouse liver demonstrates that targeted methylation within the center of CGIs exhibits a higher net increase from control values than is observed in the periphery (CGI shores). (C) For orthologous CGIs that showed matched chromatin modification in both human and mouse normal B cells (n = 3,370), the proportion that fall into the categories K3K4me3, bivalent, H3K27me3 and neither are displayed as a stacked barplot with the number in each category displayed in the color-matched box to the right. Within each category, the number of CGIs that gain methylation (>0.1) in mouse 3b OE B cells (0 – 1.5M dox) vs control (left) or human CLL vs normal B cells (right) is displayed. (D) For CGIs that gained methylation (>0.1), the number of unique and overlapping CGIs as well as the significance of the overlap based on their hypergeometric distribution is displayed (left). The mean level of methylation for these same CGIs in control/normal and 3b OE/CLL is shown (right). (E) Comparison of global DNA methylation changes that occur in human colon cancer and in mouse intestine when Dnmt3b is overexpressed. The mean methylation level of 100 bp tiles was calculated for CpGs in control/normal samples (y-axis) and compared to the change in methylation in the dox-treated/cancer sample (x-axis). In colorectal cancer, DNA methylation decreases in hypermethylated regions, while some lowly methylated regions gain methylation. In the mouse 3b OE model, lowly methylated and intermediately methylated regions gain methylation, but the global cancer-specific hypomethylation is not observed.
Figure 6—figure supplement 1
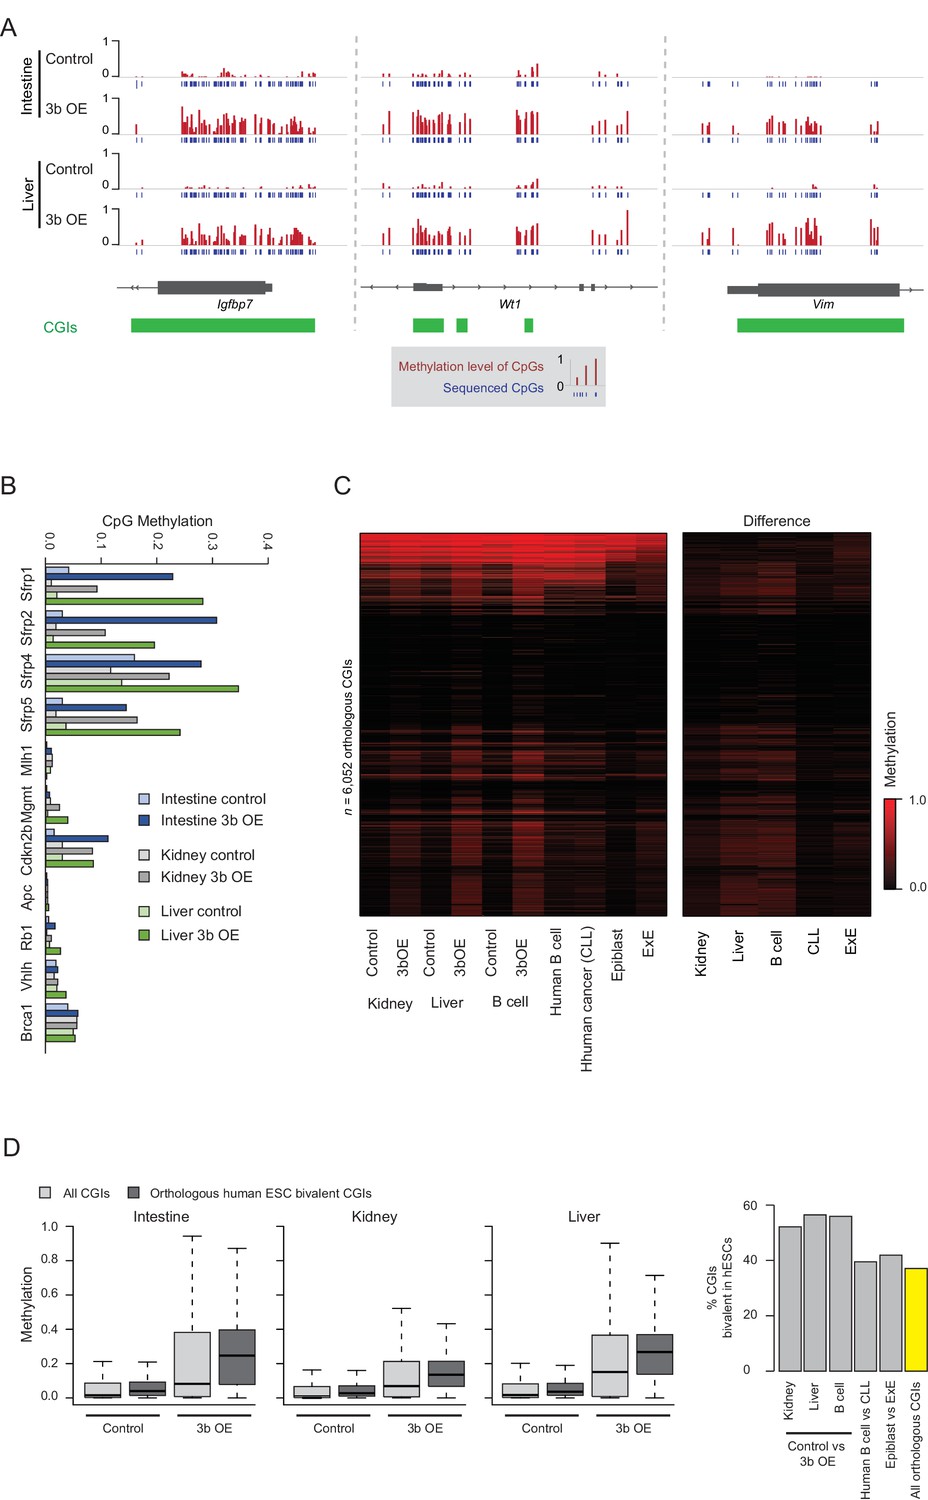
Ectopic Dnmt3b expression shows similarities to cancer CGI hypermethylation.
(A) IGV genome browser tracks of selected DMRs that overlap with known human tumor suppressor genes/biomarkers in tissues from the ectopic Dnmt3b mice (3 – 6M dox). (B) Mean methyation levels for CGI promoters of genes described in (Linhart et al., 2007) (Butcher and Rodenhiser, 2007), a previously described Dnmt3b OE mouse model. (C) Heatmap displays mean methylation levels for orthologous CGIs in mouse epiblast, extraembryonic ectoderm (ExE) (Smith et al., 2017) (Court and Arnaud, 2017), control and Dnmt3b overexpression (3b OE) mouse kidney, liver (3 – 6M dox) and B cells (0 – 1.5M dox), and human normal B cells and chronic lymphocytic leukemia (CLL) (Landau et al., 2014) (Gao et al., 2014). (D) For the intestine, liver and kidney, boxplots show the level of methylation in control and Dnmt3b overexpression (3b OE, 3 – 6M dox) tissues for all CGIs and for those that map to orthologous human CGIs that are marked with bivalent chromatin in ESCs. These are considered highly targeted across human cancers. The bar plot shows the percentage of CGIs that gain methylation in each respective comparison (difference >0.1) and their enrichment for bivalent human ESC CGIs compared to background.
Figure 6—figure supplement 2
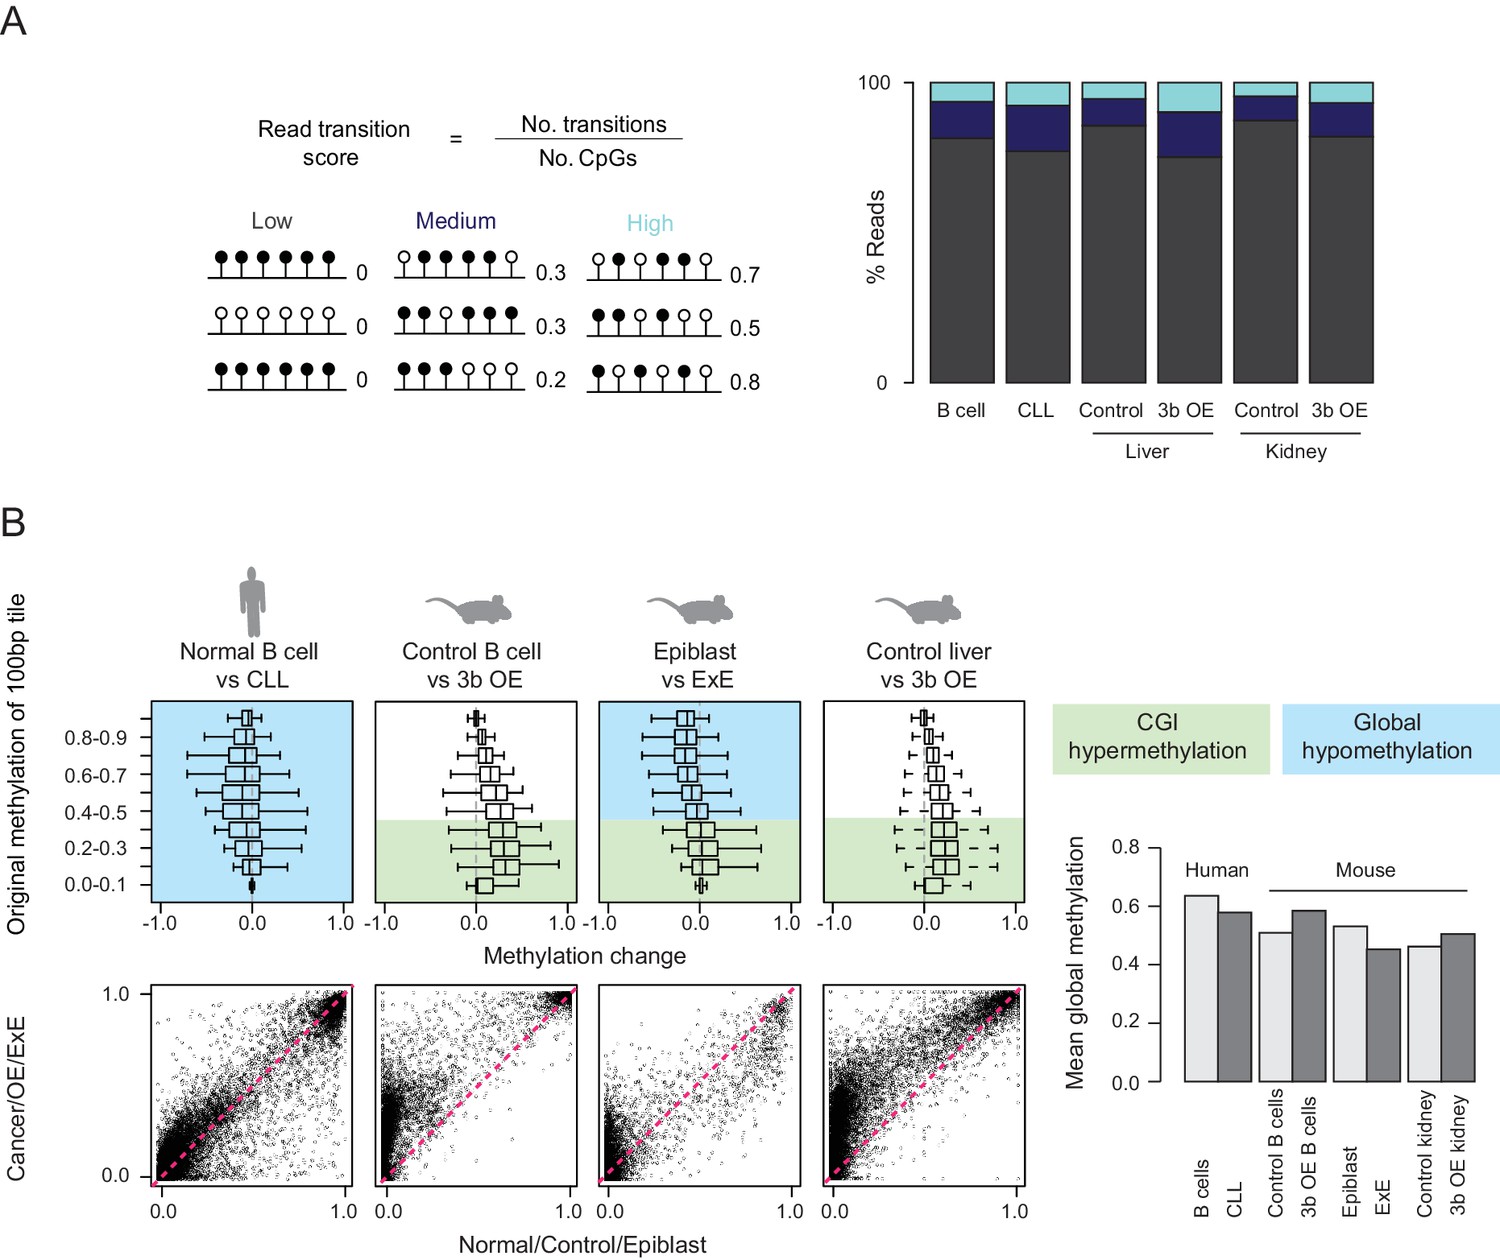
Increased methylation discordance but lack of global hypomethylation in ectopic Dnmt3b tissues.
(A) The read transition score was calculated according to the formula shown where a ‘transition’ refers to a change in methylation state between neighboring CpGs on the same sequencing read. For RRBS data, each read was scored and the percentage of reads falling into low, medium or high scoring transition states is shown for human B cells, chronic lymphoblastic leukemia (CLL) and mouse control and induced (3–6M dox) liver and kidney. (B) Boxplots display methylation levels for 100 bp tiles grouped by their respective control/normal methylation levels. Blue and green shading indicate global hypomethylation and CGI hypermethylation respectively. For human chronic lymphoblastic leukemia (CLL), global hypomethylation is observed, with a small increase at a subset of CGIs. Mouse ectopic Dnmt3b overexpression (3b OE, 3–6M dox) tissues show CGI hypermethylation and the mouse extraembryonic ectoderm (ExE) shows both CGI hypermethylation and global hypomethylation. Below, scatter plots are displayed for all 100 bp tiles. The barplot shows global mean methylation levels for all samples.
Additional files
-
Supplementary file 1
Sequence of primers used for RT-qPCR and bisulfitesequencing.
- https://doi.org/10.7554/eLife.40757.018
-
Transparent reporting form
- https://doi.org/10.7554/eLife.40757.019
Download links
A two-part list of links to download the article, or parts of the article, in various formats.
Downloads (link to download the article as PDF)
Open citations (links to open the citations from this article in various online reference manager services)
Cite this article (links to download the citations from this article in formats compatible with various reference manager tools)
Targets and genomic constraints of ectopic Dnmt3b expression
eLife 7:e40757.
https://doi.org/10.7554/eLife.40757


