Natural variation in sugar tolerance associates with changes in signaling and mitochondrial ribosome biogenesis
- University of Helsinki, Finland
- The University of North Carolina at Chapel Hill, United States
Figures
Figure 1 with 1 supplement
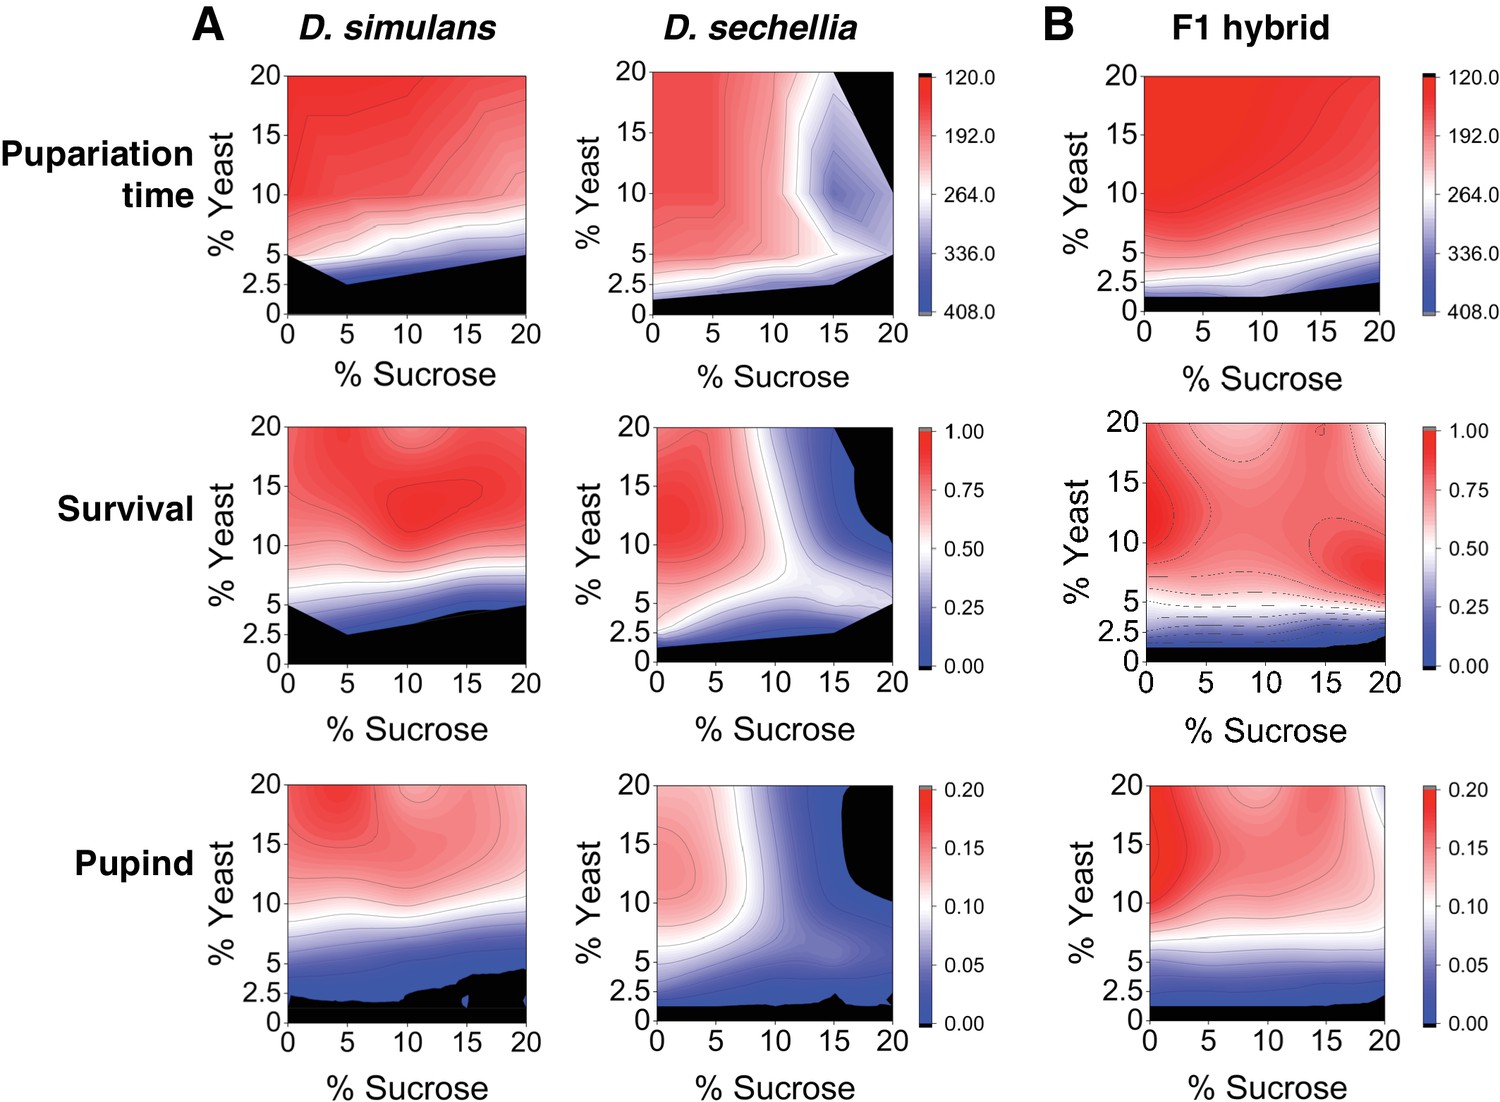
Differential macronutrient spaces of Drosophila simulans and sechellia with respect to sugar tolerance.
(A) Larvae of D. simulans and D. sechellia showed differential pupariation time (h after egg-laying) and survival on high dietary sugar. Larval development was monitored on a 5 × 5 grid of varying yeast and sucrose levels. Pupariation index takes into account both survival and pupariation time. n = 5 replicates of 30 larvae/replicate for each genotype and diet. (B) Tolerance of high dietary carbohydrate was restored in the D. sechellia x D. simulans F1 hybrids. n = 5 replicates of 30 larvae/replicate for each diet.
-
Figure 1—source data 1
Source data for Figure 1A.
- https://doi.org/10.7554/eLife.40841.005
-
Figure 1—source data 2
Source data for Figure 1B.
- https://doi.org/10.7554/eLife.40841.006
Figure 1—figure supplement 1
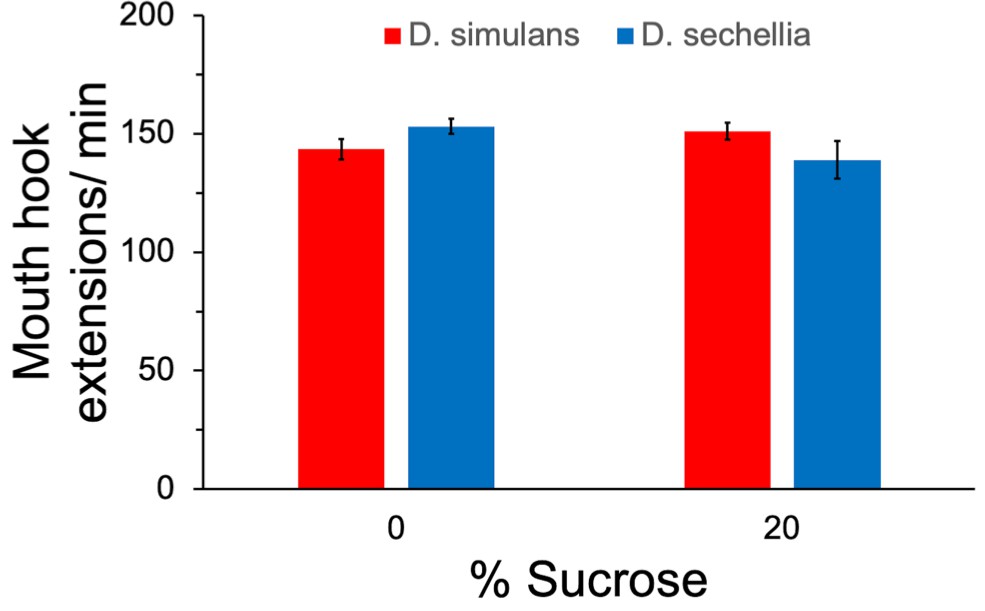
Feeding behavior did not differ significantly between the species.
The rate of mouth hook extensions was quantified in the presence and absence of 20% sucrose. n = 4 replicates of 10 larvae/replicate for each genotype and diet. Error bars display standard error of the mean. ANOVA showed no significant difference between the groups.
Figure 2
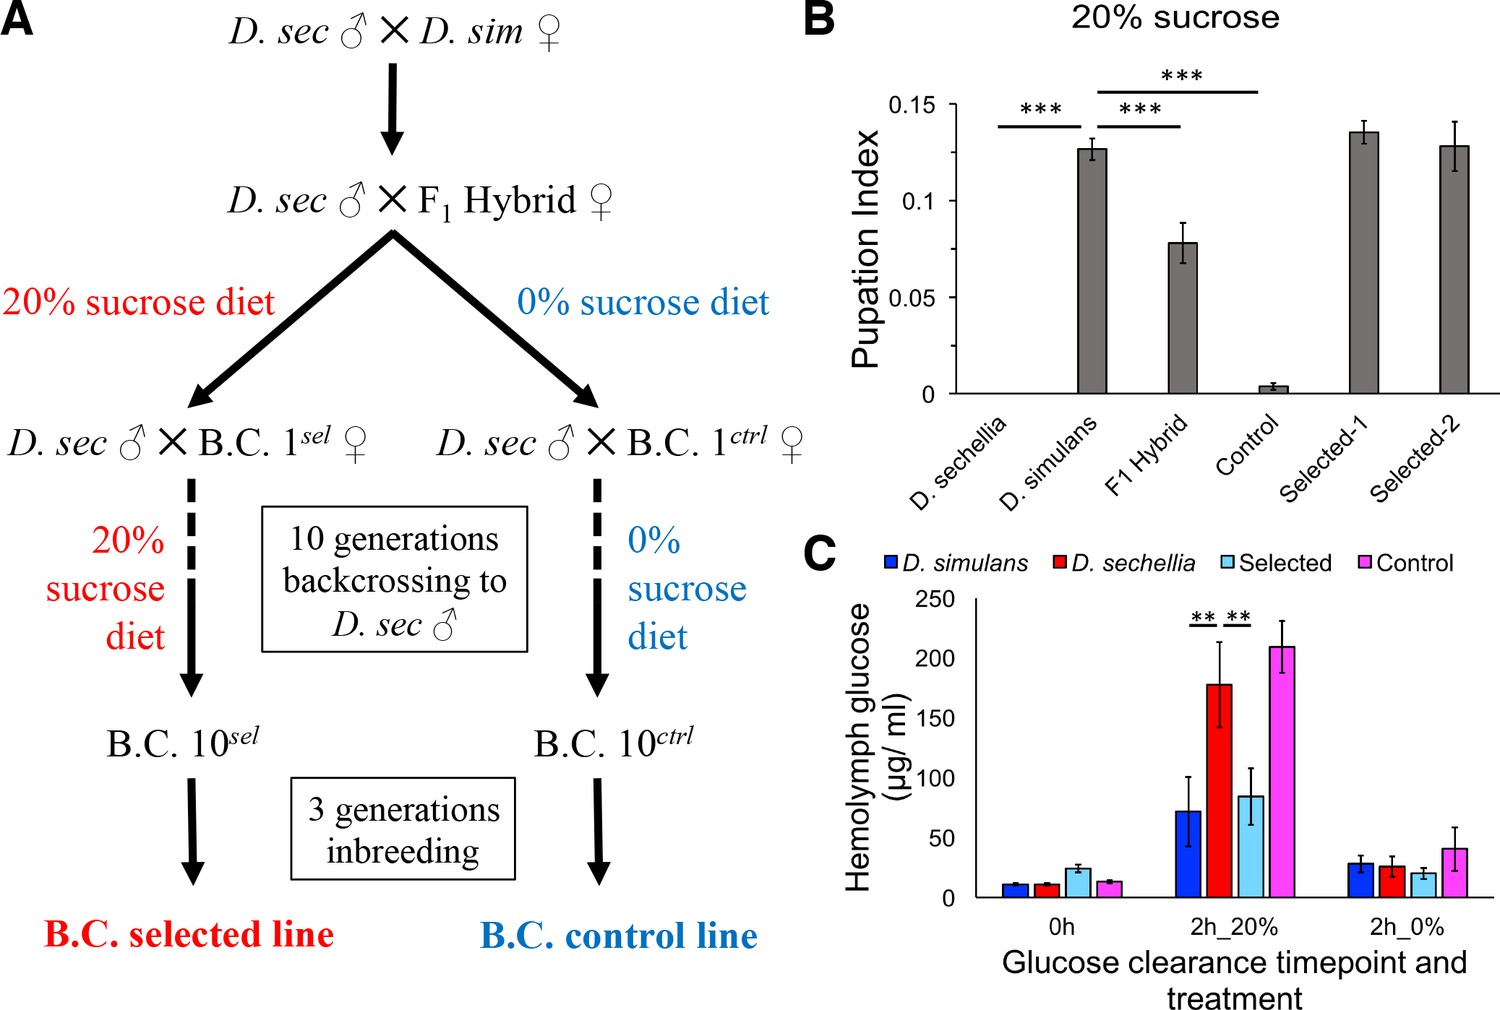
Introgression of D. simulans sugar tolerance into D. sechellia genome through repeated backcrosses on selective diet.
(A) Construction of the sugar selected and control backcross (B.C.) lines through phenotype-based introgression. Dietary sugar content of 20% provided a strong selection, since no survivors of the D. sechellia parental line were observed in these conditions. (B) Sugar tolerance of selected lines was similar to that in the parental D. simulans line, while the sugar tolerance of the control line resembled to that of D. sechellia. Error bars display standard error of the mean. n = 5 replicates of 30 larvae/replicate for each genotype. Dunnett’s test (|d| = 2.70, α = 0.05) showed that D. sechellia and the control backcross line had significantly reduced sugar tolerance compared to D. simulans while sugar tolerance of the two HSD-selected backcross lines did not differ from that of D. simulans. (C) The sugar intolerant control line showed impaired clearance of hemolymph glucose, similar to D. sechellia. Hemolymph glucose was measured from larvae on LSD, after 2 hr on HSD, and after 2 hr of transferring of HSD-fed larvae back to LSD. Error bars display standard error of the mean. n = 5 replicates of 10 larvae/replicate for each genotype and diet. Dunnett’s test (|d| = 2.62, α = 0.05) showed that after feeding for 2 hr on HSD, D. sechellia and the control backcross line had significantly elevated hemolymph glucose compared to that of D. simulans while that of the selected line did not differ from the D. simulans level. **p < 0.01, ***p < 0.001.
Figure 3
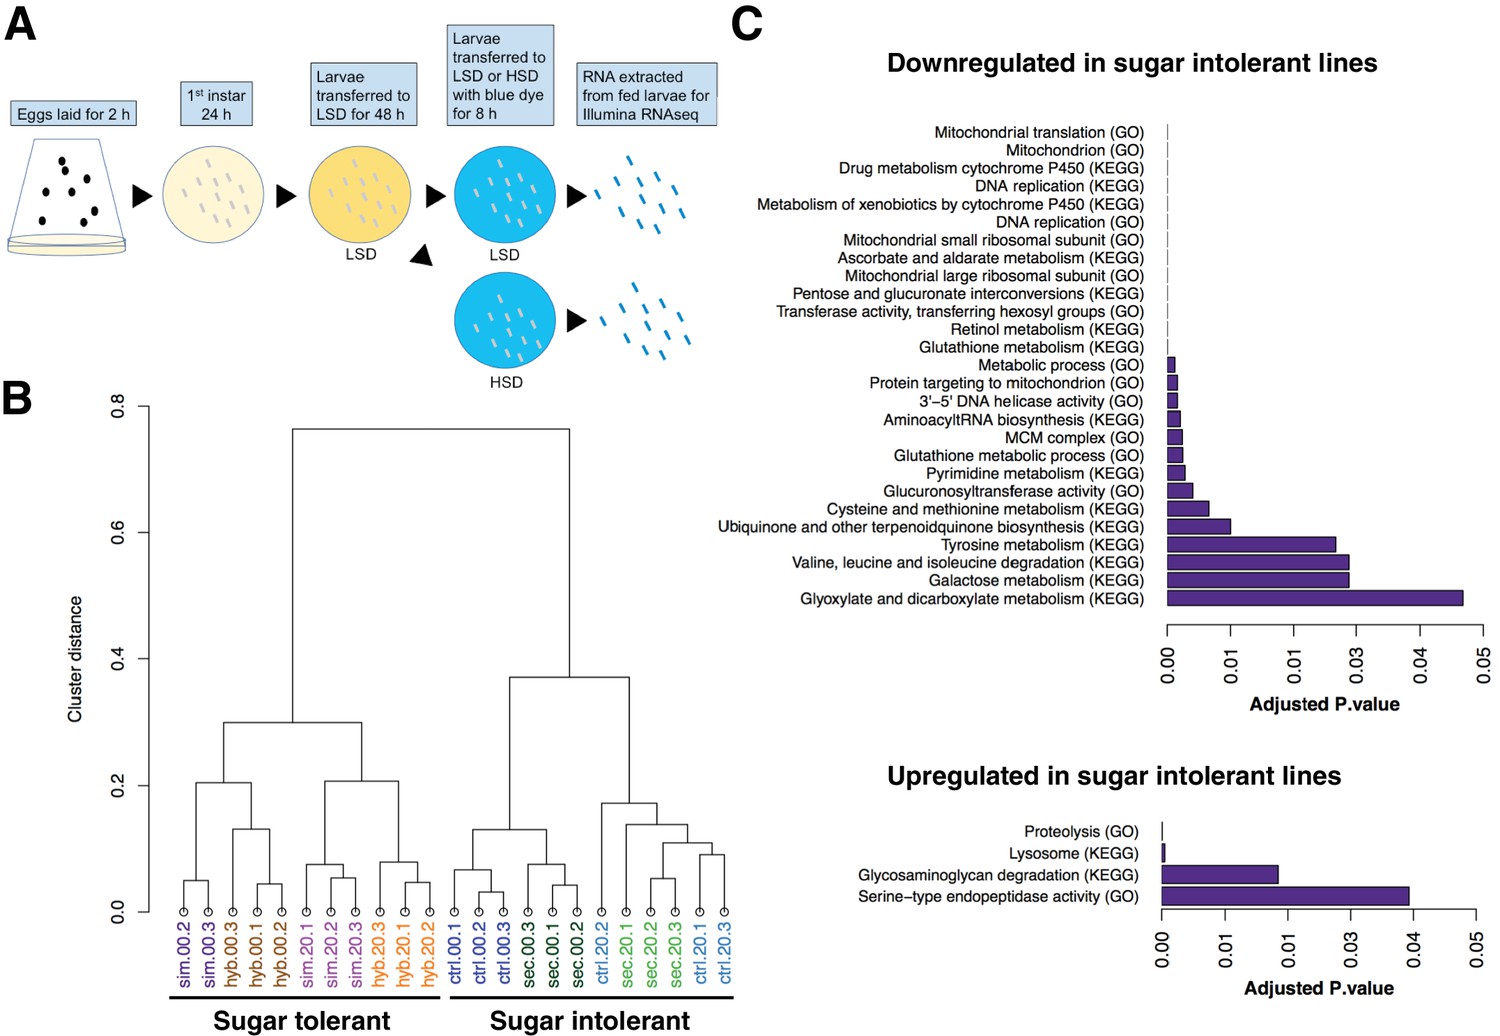
Global gene expression changes associated with sugar tolerance.
(A) Schematic representation of RNAseq sample preparation. Parental lines and backcrossed hybrid lines were fed on LSD or transferred acutely (8 hr) on HSD, followed by RNA extraction and RNA sequencing. (B) Sample clustering reveals tight association between global gene expression profiles and sugar tolerance. Sample clustering was based on Pearson correlation and it was performed using R/Bioconductor package pvclust. Correlation was used as distance matrix. (C) Summary of selected functional groups significantly enriched among genes displaying differential expression in sugar tolerant vs. intolerant lines.
Figure 4
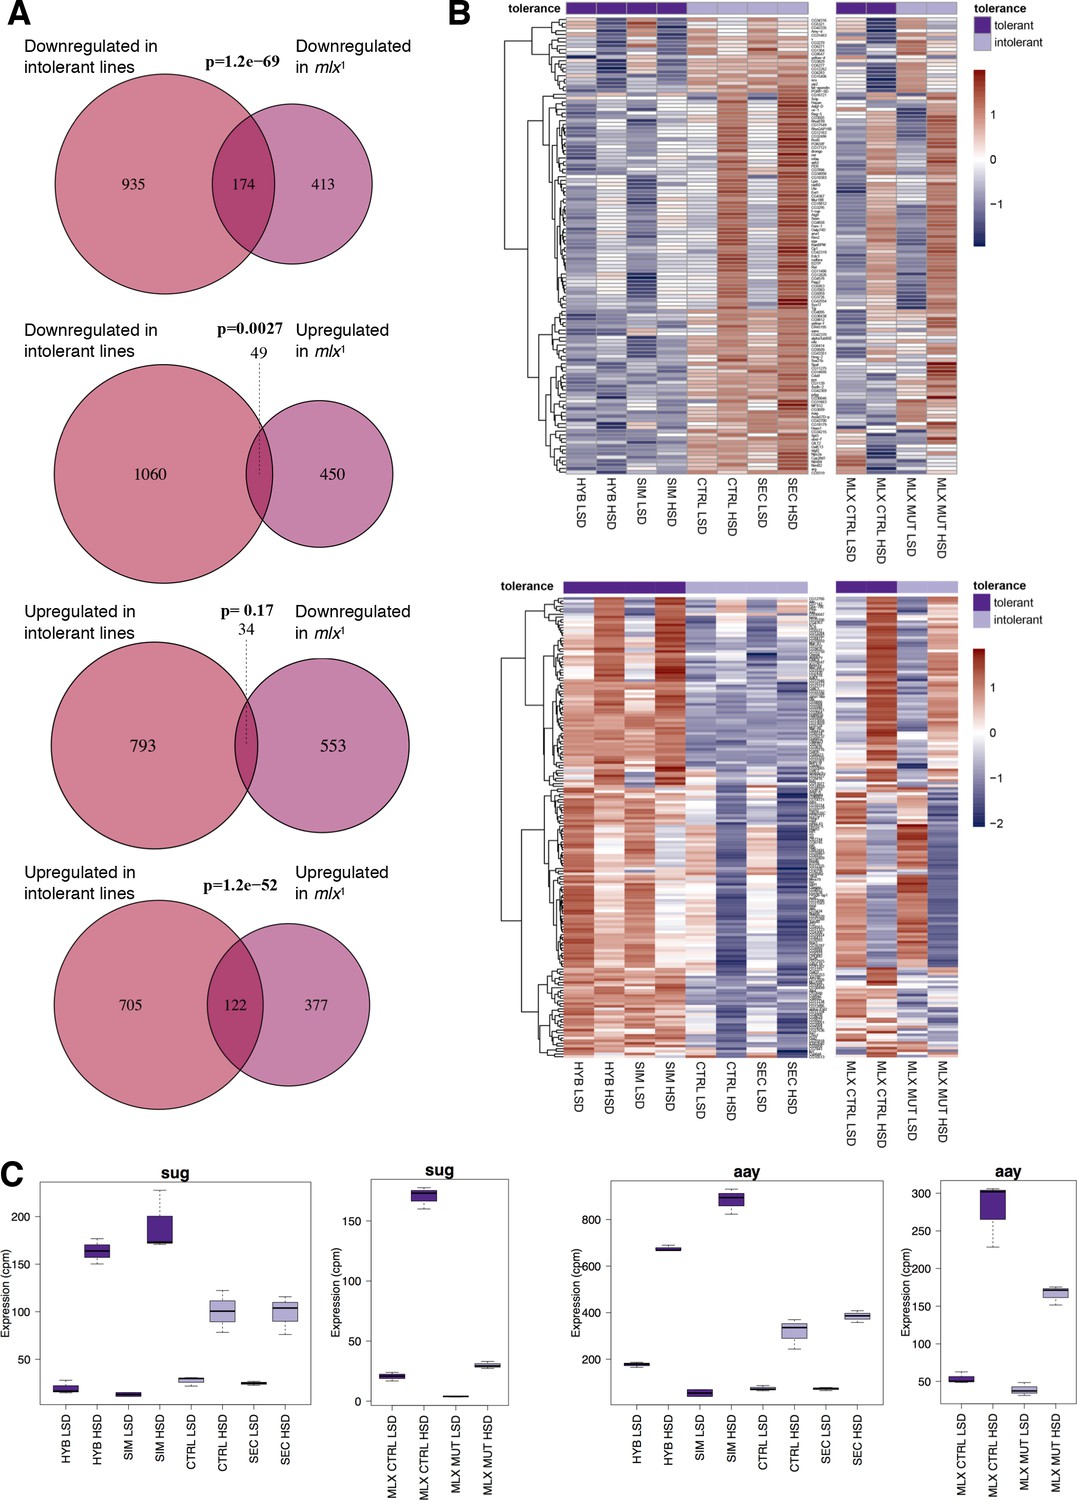
Significant overlap between gene expression profiles of sugar intolerant lines and mlx mutants.
(A) Comparison of genes differentially expressed in sugar tolerant vs. intolerant lines with Mlx target genes. Gene expression profiles associated with sugar intolerance show highly significant overlap with profiles of mlx1 mutants. (B) Heat maps of the overlapping gene sets show similarities in gene sugar responsiveness in sugar intolerant lines and mlx1 mutants. Sugar tolerance/intolerance phenotypes of the analyzed lines are indicated in color. (C) Known sugar tolerance genes sugarbabe (sug) and astray (aay) show weaker sugar induction in sugar intolerant lines, resembling mlx1 mutants.
Figure 5

D. simulans SNP signature was introgressed into a mostly D. sechellia SNP signature background.
(A) Color shows the frequency distribution of D. simulans-specific SNPs displayed along the chromosomes. (B) Frequency distribution of D. simulans-specific SNPs displayed on chromosome arm 2R for the sugar selected (top) and not-selected control (bottom) backcross lines. Black lines above the heat maps indicate the three sugar tolerance-associated introgressed regions. (C) Limited overlap between introgressed genes and genes that are either up- or downregulated in sugar tolerant lines.
Figure 6 with 1 supplement
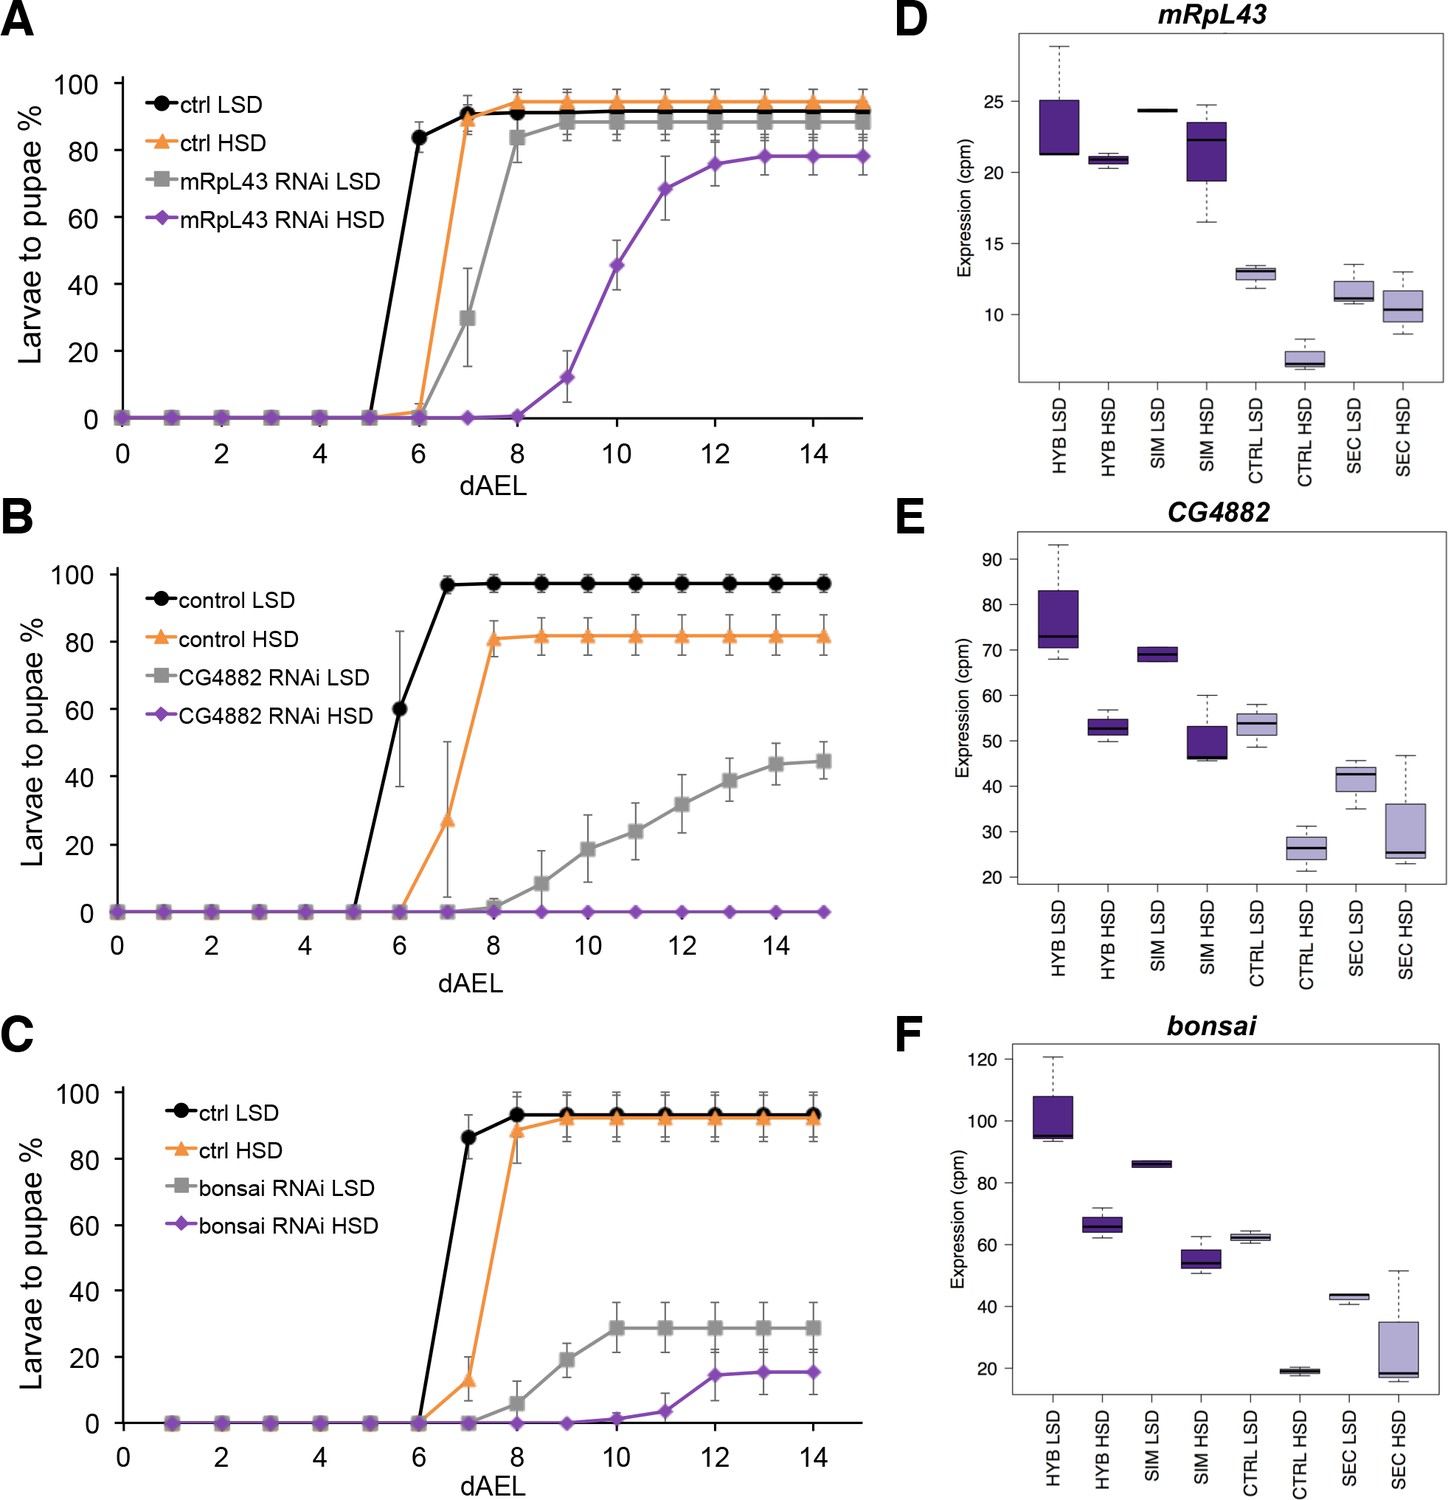
Low expression of mitochondrial ribosome genes contributes to sugar intolerance.
(A) Pupariation kinetics of control and mRpL43 RNAi larvae (Ubi-GAL4>), n = 7 replicates of 30 larvae/replicate for each genotype and diet. Error bars display standard deviation. (B) Pupariation kinetics of control and CG4882 RNAi larvae (Ubi-GAL4>), n = 8 replicates of 30 larvae/replicate for each genotype and diet. Error bars display standard deviation.(C) Pupariation kinetics of control and bonsai RNAi larvae (Fb-GAL4>), n = 3 replicates of 30 larvae/replicate for each genotype and diet. Error bars display standard deviation. (D–F) Relative expression of mRpL43, CG2882, and bonsai genes in sugar tolerant (hybrid and D. simulans) and intolerant (ctrl and D. sechellia) lines on low- and high-sugar diets identified by RNAseq. dAEL: days after egg laying.
-
Figure 6—source data 1
Source data for Figure 6A.
- https://doi.org/10.7554/eLife.40841.016
-
Figure 6—source data 2
Source data for Figure 6B.
- https://doi.org/10.7554/eLife.40841.017
-
Figure 6—source data 3
Source data for Figure 6C.
- https://doi.org/10.7554/eLife.40841.018
Figure 6—figure supplement 1
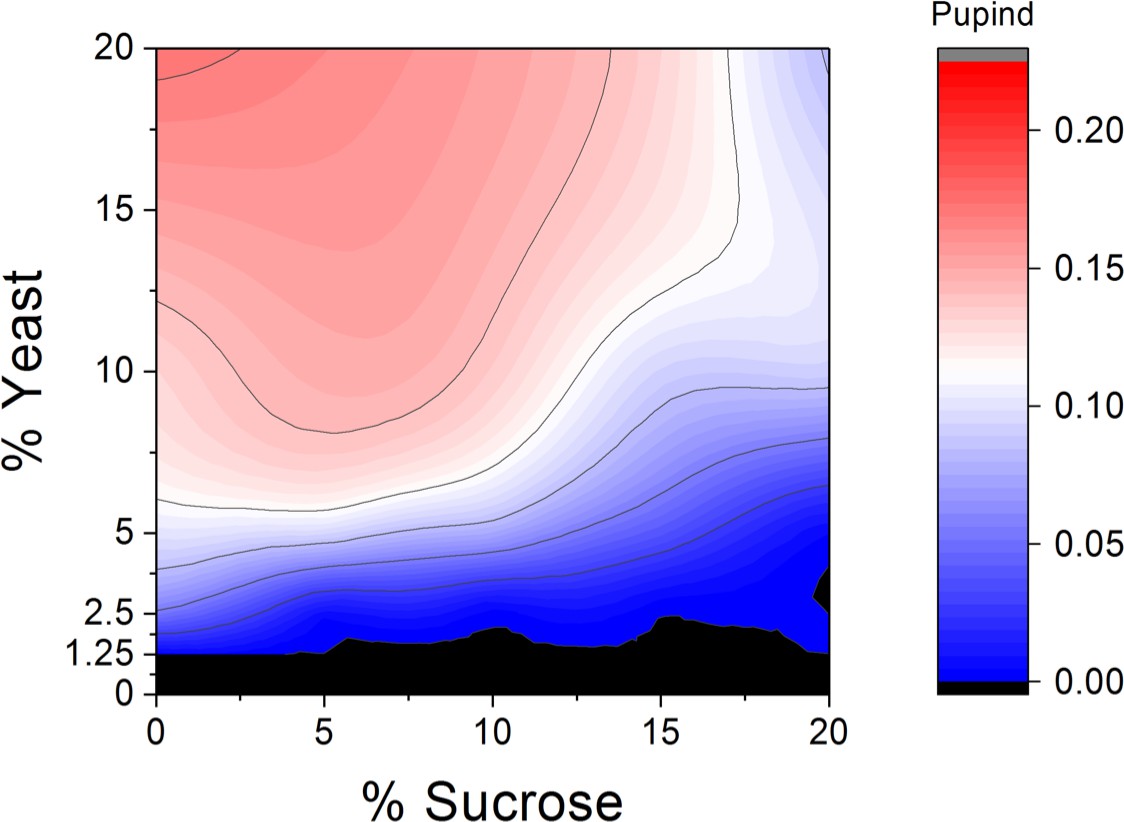
Macronutrient space of Drosophila melanogaster shows high sugar tolerance.
Larval development was monitored on a 5 × 5 grid of varying yeast and sucrose levels. Pupind: pupariation index. n = 5 replicates of 30 larvae/replicate for each diet.
Figure 7 with 1 supplement
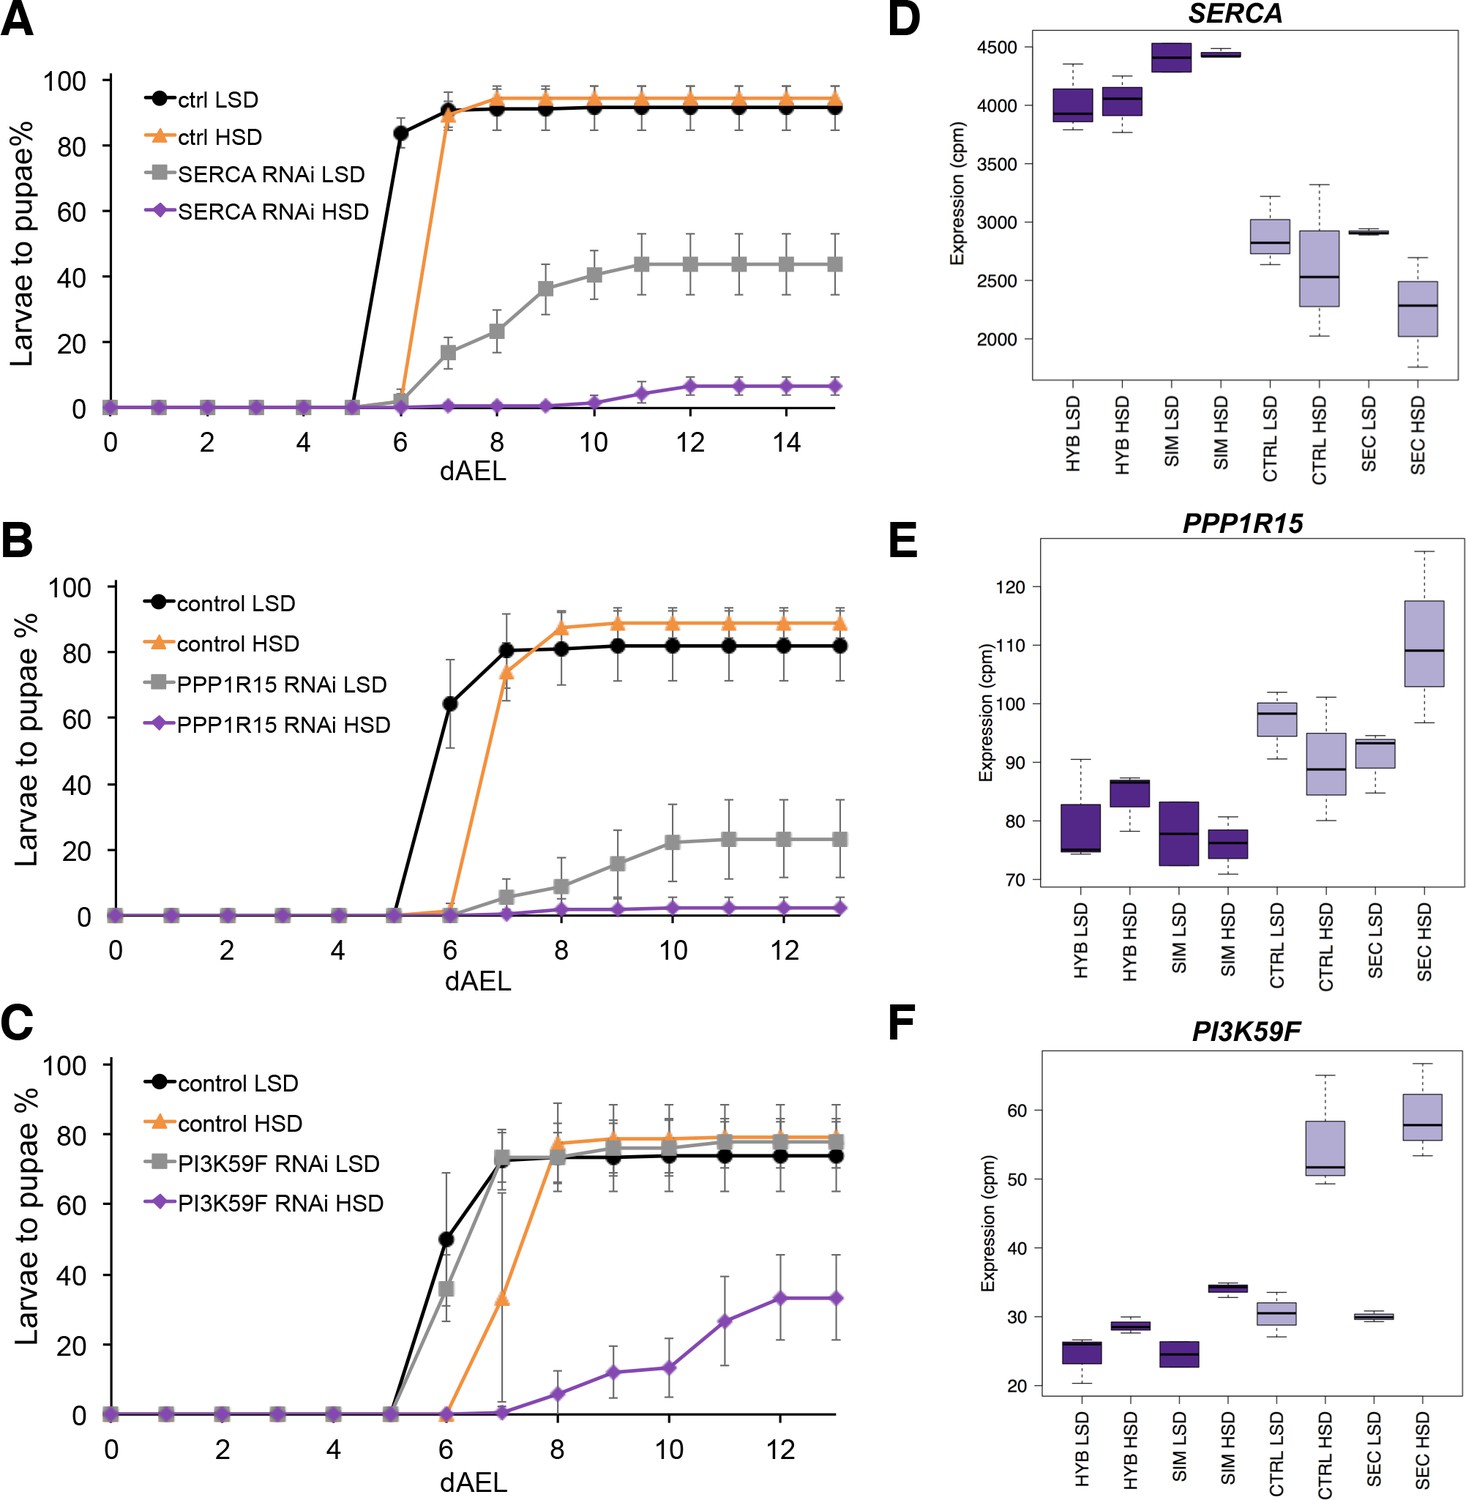
Several genes involved in signaling influence sugar tolerance.
(A) Pupariation kinetics of control and SERCA RNAi larvae (Ubi-GAL4>), n = 7 replicates of 30 larvae/replicate for each genotype and diet. Error bars display standard deviation. (B) Pupariation kinetics of control and PPP1R15 RNAi larvae (Ubi-GAL4>), n = 13 replicates of 30 larvae/replicate for each genotype and diet. Error bars display standard deviation. (C) Pupariation kinetics of control and Pi3K59F RNAi larvae (Tub-GAL4>), n = 5 replicates of 30 larvae/replicate for each genotype and diet. Error bars display standard deviation. (D–F) Relative expression of SERCA, PPP1R15, and PI3K59F genes in sugar tolerant (hybrid and D. simulans) and intolerant (ctrl and D. sechellia) lines on low- and high-sugar diets identified by RNAseq. dAEL: days after egg laying.
-
Figure 7—source data 1
Source data for Figure 7A.
- https://doi.org/10.7554/eLife.40841.021
-
Figure 7—source data 2
Source data for Figure 7B.
- https://doi.org/10.7554/eLife.40841.022
-
Figure 7—source data 3
Source data for Figure 7C.
- https://doi.org/10.7554/eLife.40841.023
Figure 7—figure supplement 1
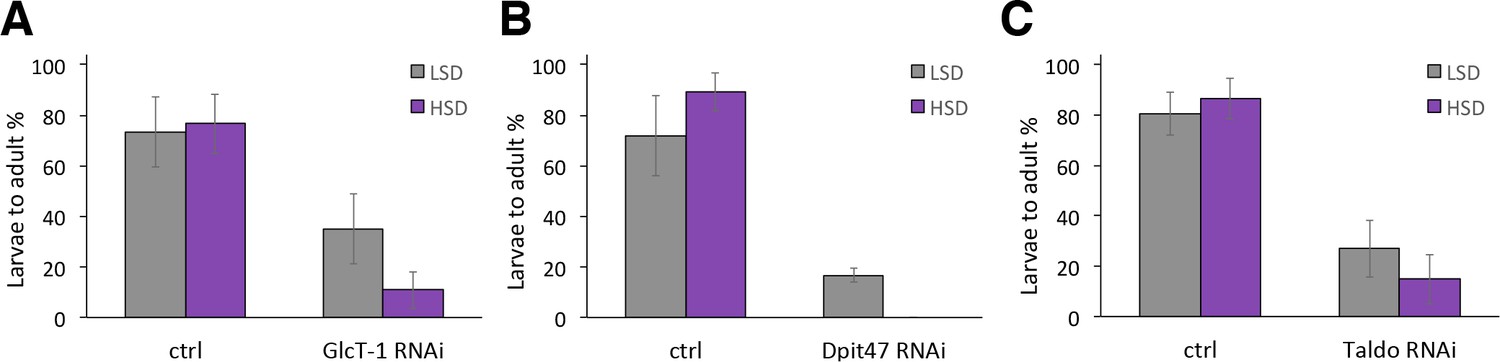
Genes with a modest impact on sugar tolerance.
(A) Total eclosion % of control and GlcT-1 RNAi larvae (tub-GAL4>), n = 4 replicates of 30 larvae/replicate for each genotype and diet. (B) Total eclosion % of control and Dpit47 RNAi larvae (Ubi-GAL4>), n = 4 replicates of 30 larvae/replicate for each genotype and diet. (C) Total eclosion % of control and Taldo RNAi larvae (Ubi-GAL4>), n = 19 replicates of 30 larvae/replicate for each genotype and diet. Error bars display standard deviation.
Figure 8 with 1 supplement
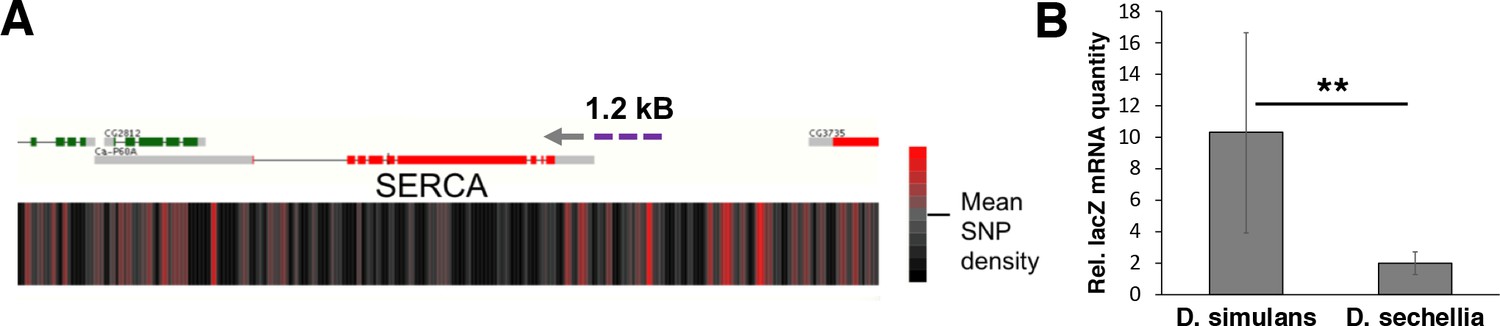
Genomic variation of SERCA promoter leads to differential promoter activity.
(A) SNP density maps comparing D. sechellia to D. simulans on regions surrounding the SERCA (Ca-P60A) gene. mRNA transcript models for each gene region are shown above SNP density heat maps with green and red representing coding regions on the (+) and (-) strand, respectively, and grey indicating non-coding regions. Direction of transcription is also indicated with a grey arrowhead. Heatmaps represent the density of SNP differences between D. sechellia and D. simulans in overlapping windows of 100 nt slid in 25 nt increments along the region. The promoter fragment cloned into the in vivo reporter is indicated as violet dashed line. (B) Relative mRNA (qPCR) expression of lacZ reporter gene downstream of 1.2 kB fragments of D. simulans and D. sechellia SERCA promoters reveals lower activity of D. sechellia-derived promoter. n = 8 replicates of 8 larvae/replicate for each genotype and diet. Error bars display standard deviation. **p < 0.01 (student’s t-test).
Figure 8—figure supplement 1

Genomic variation in the mitochondrial ribosome encoding gene regions.
SNP density maps comparing D. sechellia to D. simulans on regions surrounding the CG4882, mRpL43, and bonsai genes. mRNA transcript models for each gene region are shown above SNP density heat maps with green and red representing coding regions on the (+) and (-) strand, respectively, and grey indicating non-coding regions. Direction of transcription is also indicated with a grey arrowhead. Heatmaps represent the density of SNP differences between D. sechellia and D. simulans in overlapping windows of 100 nt slid in 25 nt increments along the region.
Figure 9 with 1 supplement
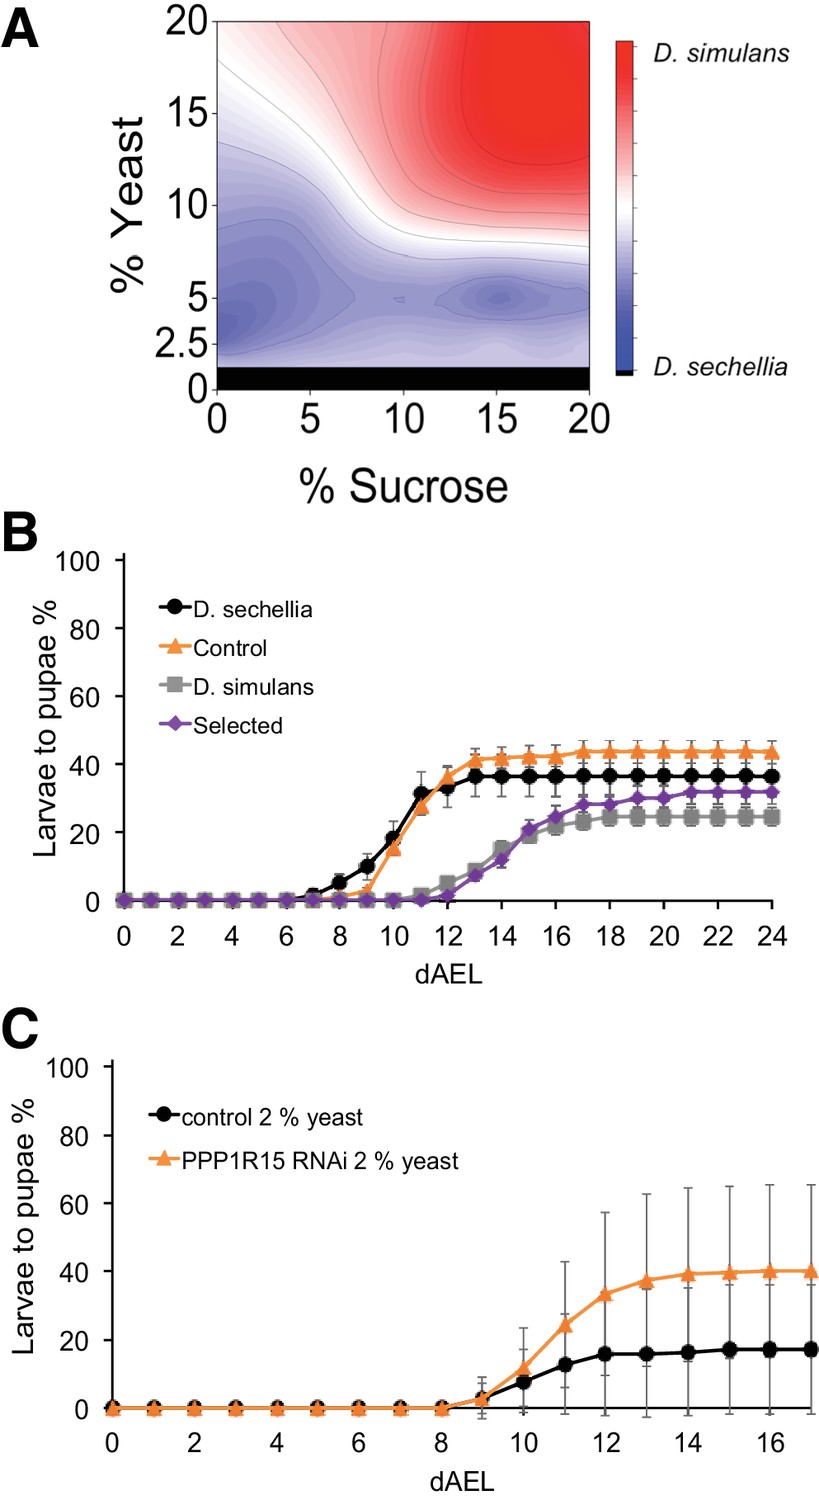
Trade-off between sugar tolerance and growth on low-energy diet.
(A) Compared to D. simulans, D. sechellia larvae had lower tolerance of sugar, but showed an advantage in pupariation on low nutrient diets. Surface shows |(D. sechellia pupind) - (D. simulans pupind)|. (B) On a low nutrient (2.5% yeast) diet, D. sechellia and the sugar intolerant control lines had shorter egg to pupa time and greater larval survival than did D. simulans and the sugar-selected lines. Error bars display standard error of the mean. n = 5–9 replicates of 30 larvae/replicate for each genotype and diet. (C) Pupariation kinetics of PPP1R15 RNAi (cg-GAL4>) on 2% yeast diet, n = 28 replicates of 30 larvae/replicate for each genotype and diet. Error bars display standard deviation. dAEL: days after egg laying.
-
Figure 9—source data 1
Source data for Figure 9B.
- https://doi.org/10.7554/eLife.40841.029
-
Figure 9—source data 2
Source data for Figure 9C.
- https://doi.org/10.7554/eLife.40841.030
Figure 9—figure supplement 1
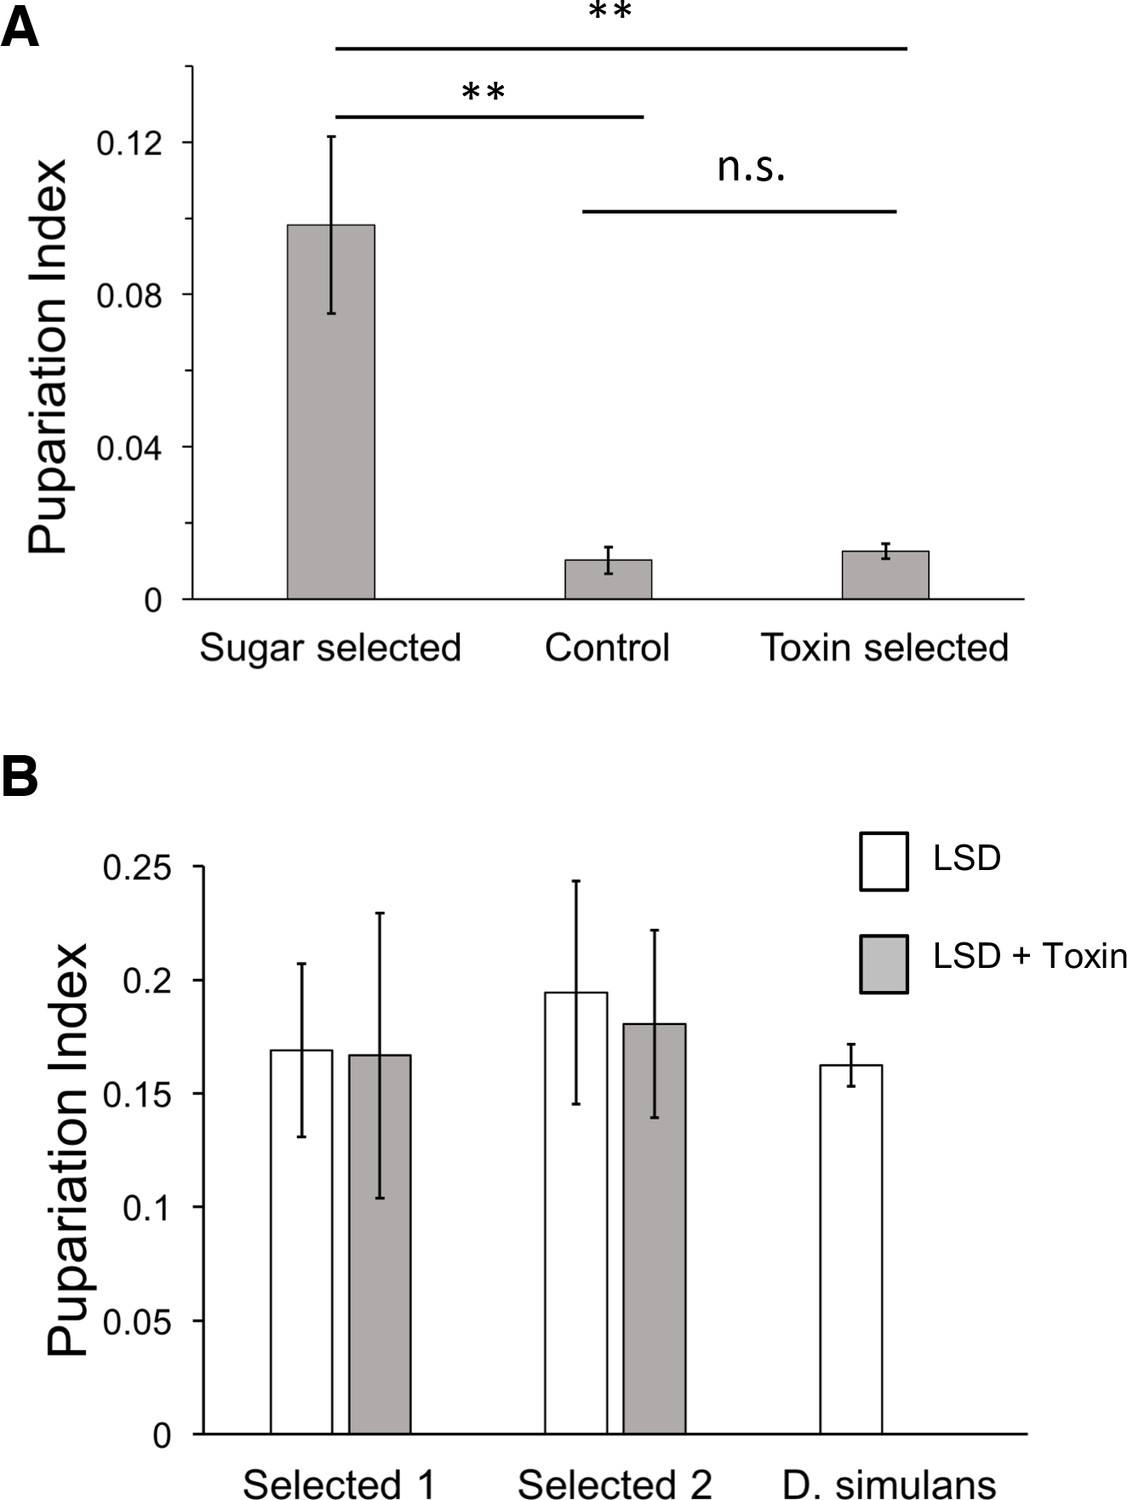
Morinda toxin tolerance is not associated with sugar tolerance.
(A) Pupariation indices on HSD of lines after three generations of introgression and selection on HSD, LSD, and LSD + Morinda toxins. Mean of 5 replicate (30 larvae/replicate for each genotype and diet) vials were compared by Student’s t-test. ** p < 0.01. (B) Two sugar-selected introgression lines show full tolerance to Morinda toxins, in contrast to parental D. simulans line. n = 5 replicates of 30 larvae/replicate for each genotype and diet.
Tables
Table 1
Correlation analysis of nutrient space metrics.
https://doi.org/10.7554/eLife.40841.007| Pearson correlation coefficient | ||
|---|---|---|
| % Yeast | % Sucrose | |
| Larval development time | ||
| D. simulans | −0.76*** | 0.21 |
| D. sechellia | −0.45*** | 0.59*** |
| F1 hybrid | −0.82*** | 0.12 |
| Larval survival | ||
| D. simulans | 0.88*** | −0.08 |
| D. sechellia | 0.36*** | −0.58*** |
| F1 hybrid | 0.69*** | −0.09 |
| Pupariation Index | ||
| D. simulans | 0.93*** | −0.12 |
| D. sechellia | 0.42*** | −0.69*** |
| F1 hybrid | 0.76*** | −0.19* |
-
*P < 0.05; **P < 0.01, ***P < 0.001
Table 2
Generalized linear model (GLM) details for pupariation index (Pupind), larval survival, and development time.
Models assumed a normal distribution and used an identity link function. Error d.f. = 300 for all comparisons.
| Trait | Effect | d.f. | Log ratio χ2 | P |
|---|---|---|---|---|
| Pupind | Genotype | 2 | 297.84 | <0.001*** |
| Sugar | 4 | 383.41 | <0.001*** | |
| Yeast | 4 | 1064.98 | <0.001*** | |
| Genotype × Sugar | 8 | 177.07 | <0.001*** | |
| Genotype × Yeast | 8 | 489.76 | <0.001*** | |
| Sugar × Yeast | 16 | 286.75 | <0.001*** | |
| Genotype × Sugar × Yeast | 32 | 218.40 | <0.001*** | |
| Survival | Genotype | 2 | 205.79 | <0.001*** |
| Sugar | 4 | 270.76 | <0.001*** | |
| Yeast | 4 | 971.02 | <0.001*** | |
| Genotype × Sugar | 8 | 240.94 | <0.001*** | |
| Genotype × Yeast | 8 | 416.18 | <0.001*** | |
| Sugar × Yeast | 16 | 135.45 | <0.001*** | |
| Genotype × Sugar × Yeast | 32 | 303.48 | <0.001*** | |
| Dev. time | Genotype | 2 | 96.40 | <0.001*** |
| Sugar | 4 | 109.69 | <0.001*** | |
| Yeast | 4 | 476.02 | <0.001*** | |
| Genotype × Sugar | 8 | 53.95 | <0.001*** | |
| Genotype × Yeast | 8 | 150.31 | <0.001*** | |
| Sugar × Yeast | 16 | 30.67 | <0.05 * | |
| Genotype × Sugar × Yeast | 32 | 125.34 | <0.001*** |
Table 3
Effect sizes by trait and genotype.
https://doi.org/10.7554/eLife.40841.009| Trait | Genotype | Effect | -log(P) | ω2 |
|---|---|---|---|---|
| Pupind | D. simulans | Sugar | 12.79 | 0.01 |
| Yeast | 99.04 | 0.94 | ||
| Sugar × Yeast | 9.43 | 0.02 | ||
| D. sechellia | Sugar | 43.52 | 0.35 | |
| Yeast | 41.83 | 0.33 | ||
| Sugar × Yeast | 26.61 | 0.22 | ||
| F1 hybrid | Sugar | 18.62 | 0.04 | |
| Yeast | 83.58 | 0.86 | ||
| Sugar × Yeast | 16.73 | 0.85 | ||
| Larval survival | D. simulans | Sugar | 5.15 | 0.01 |
| Yeast | 95.39 | 0.93 | ||
| Sugar × Yeast | 13.71 | 0.03 | ||
| D. sechellia | Sugar | 40.15 | 0.34 | |
| Yeast | 41.58 | 0.36 | ||
| Sugar × Yeast | 22.47 | 0.19 | ||
| F1 hybrid | Sugar | 4.15 | 0.01 | |
| Yeast | 76.78 | 0.88 | ||
| Sugar × Yeast | 11.76 | 0.05 | ||
| Dev. time | D. simulans | Sugar | 3.53 | 0.01 |
| Yeast | 75.52 | 0.90 | ||
| Sugar × Yeast | 7.00 | 0.03 | ||
| D. sechellia | Sugar | 11.34 | 0.18 | |
| Yeast | 18.28 | 0.34 | ||
| Sugar × Yeast | 3.78 | 0.09 | ||
| F1 hybrid | Sugar | 5.58 | 0.05 | |
| Yeast | 36.39 | 0.62 | ||
| Sugar × Yeast | 5.80 | 0.08 |
Table 4
Nucleotide substitution differences between D. simulans and D. sechellia in genes identified as hits in the D. melanogaster RNAi screen.
AA: amino acid.
| Gene | AA changing | Silent | ka/ks |
|---|---|---|---|
| PPP1R15 (CG3825) | 10 | 5 | 0.58 |
| Pi3K59F (CG5373) | 2 | 23 | 0.03 |
| CG4882 | 4 | 8 | 0.15 |
| Taldo (CG2827) | 1 | 6 | 0.05 |
| Dpit47 (CG3189) | 4 | 9 | 0.13 |
| GlcT-1 (CG6437) | 3 | 10 | 0.01 |
| bonsai (CG4207) | 2 | 8 | 0.13 |
| mRPL43 (CG5479) | 1 | 13 | 0.03 |
| SERCA (CG3725) | 6 | 16 | 0.13 |
Key resources table
| Reagent type (species) or resource | Designation | Source or reference | Identifiers | Additional information |
|---|---|---|---|---|
| Gene (Drosophila melanogaster) | mRPL43 | NA | FLYB: FBgn0034893 | |
| Gene (D. melanogaster) | CG4882 | NA | FLYB: FBgn0025336 | |
| Gene (D. melanogaster) | bonsai | NA | FLYB: FBgn0026261 | |
| Gene (D. melanogaster) | SERCA | NA | FLYB: FBgn0263006 | |
| Gene (D. melanogaster) | PPP1R15 | NA | FLYB: FBgn0034948 | |
| Gene (D. melanogaster) | Pi3K59F | NA | FLYB: FBgn0015277 | |
| Strain, strain background (D. simulans C167.4) | D. Simulans C167.4 | The National Drosophila Species Stock Center, College of Agriculture and Life Science, Cornell University | Drosophila Species Stock Center: 14021-0251-199 | |
| Strain, strain background (D. sechellia SynA) | D. sechellia SynA | The National Drosophila Species Stock Center, College of Agriculture and Life Science, Cornell University | Drosophila Species Stock Center: 14021-0248-28 | |
| Strain, strain background (D. melanogaster Oregon R) | D. melanogaster | other | A gift from Tapio Heino, University of Helsinki | |
| Strain, strain background (D. Simulans and D. Sechellia hybrid) | B.C. selected line | this paper | See Materials and methods section 'Genetic introgression' | |
| Strain, strain background (D. Simulans and D. Sechellia hybrid) | B.C. control line | this paper | See Materials and methods section 'Genetic introgression' | |
| Genetic reagent (D. melanogaster) | kk control | Vienna Drosophila RNAi Center | VDRC: 60100 | Genotype: y,w[1118];P{attP,y[+],w[3`] |
| Genetic reagent (D. melanogaster) | mRPL43 RNAi (VDRC 104466) | Vienna Drosophila RNAi Center | VDRC: 104466; FLYB: FBgn0034893 | FlyBase symbol: P{KK109027} VIE-260B |
| Genetic reagent (D. melanogaster) | CG4882 RNAi (VDRC 106629) | Vienna Drosophila RNAi Center | VDRC: 106629; FLYB: FBgn0025336 | FlyBase symbol: P{KK107150} VIE-260B |
| Genetic reagent (D. melanogaster) | bonsai RNAi (VDRC 104412) | Vienna Drosophila RNAi Center | VDRC: 104412; FLYB: FBgn0026261 | FlyBase symbol: P{KK108444}VIE-260B |
| Genetic reagent (D. melanogaster) | SERCA RNAi (VDRC 107446) | Vienna Drosophila RNAi Center | VDRC: 107446; FLYB: FBgn0263006 | FlyBase symbol: P{KK107371}VIE-260B |
| Genetic reagent (D. melanogaster) | PPP1R15 RNAi (VDRC 107545) | Vienna Drosophila RNAi Center | VDRC: 107545; FLYB: FBgn0034948 | FlyBase symbol: P{KK104106} VIE-260B |
| Genetic reagent (D. melanogaster) | Pi3K59F RNAi (VDRC 100296) | Vienna Drosophila RNAi Center | VDRC: 100296; FLYB: FBgn0015277 | FlyBase symbol: P{KK107602}VIE-260B |
| Genetic reagent (D. melanogaster) | ubi-Gal4 | Bloomington Drosophila Stock Center | BDSC: 32551; FLYB: FBst0032551 | FlyBase symbol: w*; P{Ubi-GAL4.U}2/CyO |
| Genetic reagent (D. melanogaster) | tub-Gal4 | Bloomington Drosophila Stock Center | BDSC: 5138; FLYB: FBst0005138 | FlyBase symbol: y1 w*; P{tubP-GAL4} LL7/TM3, Sb1 Ser1 |
| Genetic reagent (D. melanogaster) | cg-Gal4 | Bloomington Drosophila Stock Center | BDSC: 7011; FLYB: FBst0007011 | FlyBase symbol: w1118; P{Cg-GAL4.A}2 |
| Genetic reagent (D. melanogaster) | fb-Gal4 | PMID: 12676093 | FLYB: FBti0013267 | Genotype: P{GAL4}fat |
| Genetic reagent (D. melanogaster) | D. simulans SERCA lacZ reporter | this paper | Progenitors: D. simulans SERCA lacZ plasmid; D. melanogaster with landing site attP2(3L)68A4 (GenetiVision) | |
| Genetic reagent (D. melanogaster) | D. sechellia SERCA lacZ reporter | this paper | Progenitors: D. sechellia SERCA lacZ plasmid; D. melanogaster with landing site attP2(3L)68A4 (GenetiVision) | |
| Recombinant DNA reagent | placZ-2.attB (vector) | PMID: 23637332 | ||
| Recombinant DNA reagent | D. simulans SERCA lacZ plasmid | this paper | Progenitors: PCR, D. simulans C167.4 flies; vector placZ-2.attB | |
| Recombinant DNA reagent | D. sechellia SERCA lacZ plasmid | this paper | Progenitors: PCR, D. sechellia SynA flies; vector placZ-2.attB | |
| Sequence-based reagent | SERCA F (primer) | this paper | Sequence: 5’- TAAGCGGCCGCTCTTCGTTCAGTGGCCTGTG-3’ | |
| Sequence-based reagent | SERCA R (primer) | this paper | Sequence: 5’-TAACTCGAGTCGTGATAAGGATTTCAGTTCG-3’ | |
| Sequence-based reagent | LacZ F (primer) | this paper | Sequence: 5’-CGAATCTCTA TCGTGCGGTG-3’ | |
| Sequence-based reagent | LacZ R (primer) | this paper | Sequence: 5’-CCGTTCAGCA GCAGCAGAC-3’ | |
| Sequence-based reagent | Act42A F (primer) | PMID: 23593032 | Sequence: 5’-CCGTACCACAG GTATCGTGTTG-3’ | |
| Sequence-based reagent | Act42A R (primer) | PMID: 23593032 | Sequence: 5’- GTCGGTTAAATC GCGACCG-3’ | |
| Commercial assay or kit | Glucose Oxidase/ Peroxidase assay kit (Sigma) | Sigma | Sigma: GAGO20-1KT | |
| Commercial assay or kit | PureGene DNA extraction kit (Qiagen) | Qiagen | Qiagen: 158667 | |
| Commercial assay or kit | Nucleospin RNA II kit (Macherey- Nagel) | Macherey-Nagel | ||
| Commercial assay or kit | SensiFast cDNA Synthesis kit (Bioline) | Bioline | ||
| Commercial assay or kit | SensiFAST SYBR No-ROX kit (Bioline) | Bioline | ||
| Software, algorithm | JMP | SAS Institute, Cary, NC | RRID:SCR_014242 | |
| Software, algorithm | PSI-seq method | PMID: 21940681 | ||
| Software, algorithm | FASTQC (v.0.11.2) | RRID:SCR_014583 | ||
| Software, algorithm | Trimmomatic (v.0.33) | RRID:SCR_011848 | ||
| Software, algorithm | Tophat (v.2.1.0) | RRID:SCR_013035 | ||
| Software, algorithm | HTseq (v.2.7.6) | RRID:SCR_005514 | ||
| Software, algorithm | R/Bioconductor package limma | RRID:SCR_010943 | ||
| Software, algorithm | R/Bioconductor package pvclust | URL: https://CRAN.R-project.org/package=pvclust | ||
| Software, algorithm | BWA-MEM (Burrows- Wheeler alignment software package) | PMID: 19451168 | ||
| Software, algorithm | Geneious 11.1.5 software | Biomatters Ltd., Aukland, NZ | RRID:SCR_010519 |
Table 5
Estimated caloric content of the 25 Yeast-Sugar diets (kcal/100 g).
https://doi.org/10.7554/eLife.40841.031| % Yeast | ||||||
|---|---|---|---|---|---|---|
| 1.25 | 2.5 | 5 | 10 | 20 | ||
| % Sugar | 0 | 4.1 | 8.1 | 16.3 | 32.5 | 65.0 |
| 5 | 24.4 | 28.4 | 36.6 | 52.8 | 85.3 | |
| 10 | 44.7 | 48.7 | 56.9 | 73.1 | 105.6 | |
| 15 | 65.0 | 69.0 | 77.2 | 93.4 | 125.9 | |
| 20 | 85.3 | 89.3 | 97.5 | 113.7 | 146.2 | |
Additional files
-
Supplementary file 1
D. melanogaster genes corresponding to the D. simulans/sechellia genes in the introgressed genomic regions.
Genes which were up- or downregulated in both sugar intolerant genotypes when compared to both sugar tolerant genotypes are indicated as well as the genes that were screened by RNAi.
- https://doi.org/10.7554/eLife.40841.032
-
Transparent reporting form
- https://doi.org/10.7554/eLife.40841.033
Download links
A two-part list of links to download the article, or parts of the article, in various formats.
Downloads (link to download the article as PDF)
Open citations (links to open the citations from this article in various online reference manager services)
Cite this article (links to download the citations from this article in formats compatible with various reference manager tools)
Natural variation in sugar tolerance associates with changes in signaling and mitochondrial ribosome biogenesis
eLife 7:e40841.
https://doi.org/10.7554/eLife.40841


