The transcription factors TFE3 and TFEB amplify p53 dependent transcriptional programs in response to DNA damage
- National Heart, Lung, and Blood Institute, National Institutes of Health, United States
Figures
Figure 1 with 1 supplement
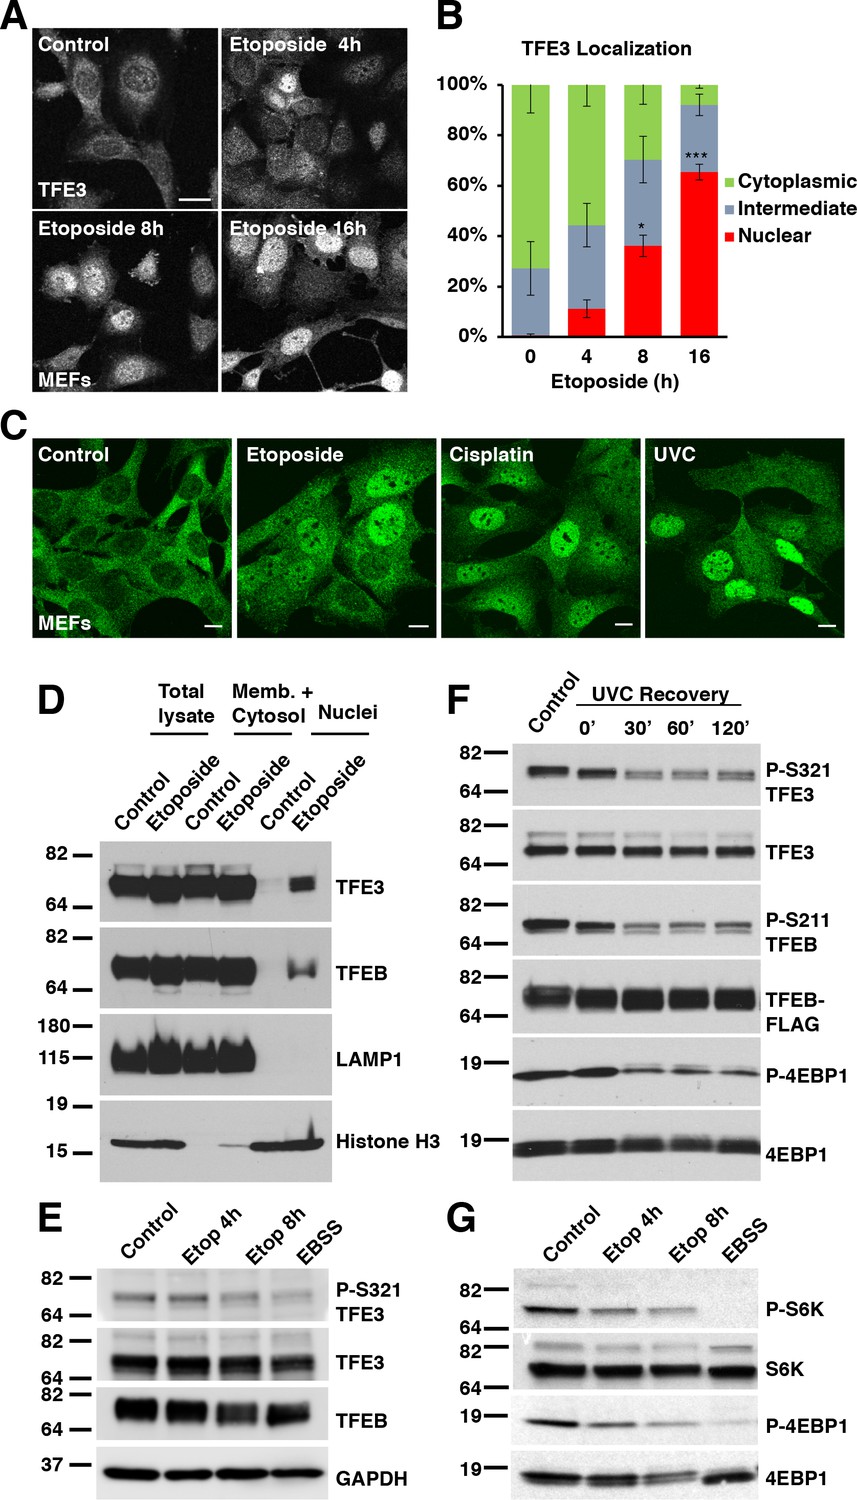
TFE3 and TFEB translocate to the nucleus in response to genotoxic stress.
(A) Immunofluorescence images of WT MEFs treated with 100 μM etoposide for up to 16 hr. Scale bar = 20 μm. (B) Quantification of TFE3 localization from cells shown in A. Levels represent mean ± standard deviation with n = 3 experiments and > 200 cells counted per trial. Significance determined with Student’s t-test (*p < 0.05, ***p < 0.001). (C) Immunofluorescence images displaying TFE3 translocation in WT MEFs in response to different DNA damaging agents: etoposide, cisplatin, and UVC irradiation, and Scale bar = 10 μm. (D) Representative Western blot showing TFE3 and TFEB nuclear distribution by subcellular fractionation of WT MEFs exposed to etoposide for 10 hr. (E) Representative Western blot showing TFE3 de-phosphorylation at Ser321 and gel shift in TFEB in WT MEFs exposed to etoposide for up to 8 hr. EBSS for 2 h hours used as a positive control for de-phosphorylation of TFE3 and TFEB. (F) Representative Western blot showing TFE3 and TFEB de-phosphorylation in HeLa cells in response to UV-C light. (G) Representative Western blot showing mTORC1 inhibition due to S6K and 4EBP1 de-phosphorylation in response to increasing etoposide treatment time. EBSS for 2 hr used as a positive control for maximum mTORC1 inhibition. All the western blots are representative of three independent experiments.
-
Figure 1—source data 1
TFE3 localization with etoposide treatment.
- https://doi.org/10.7554/eLife.40856.003
Figure 1—figure supplement 1
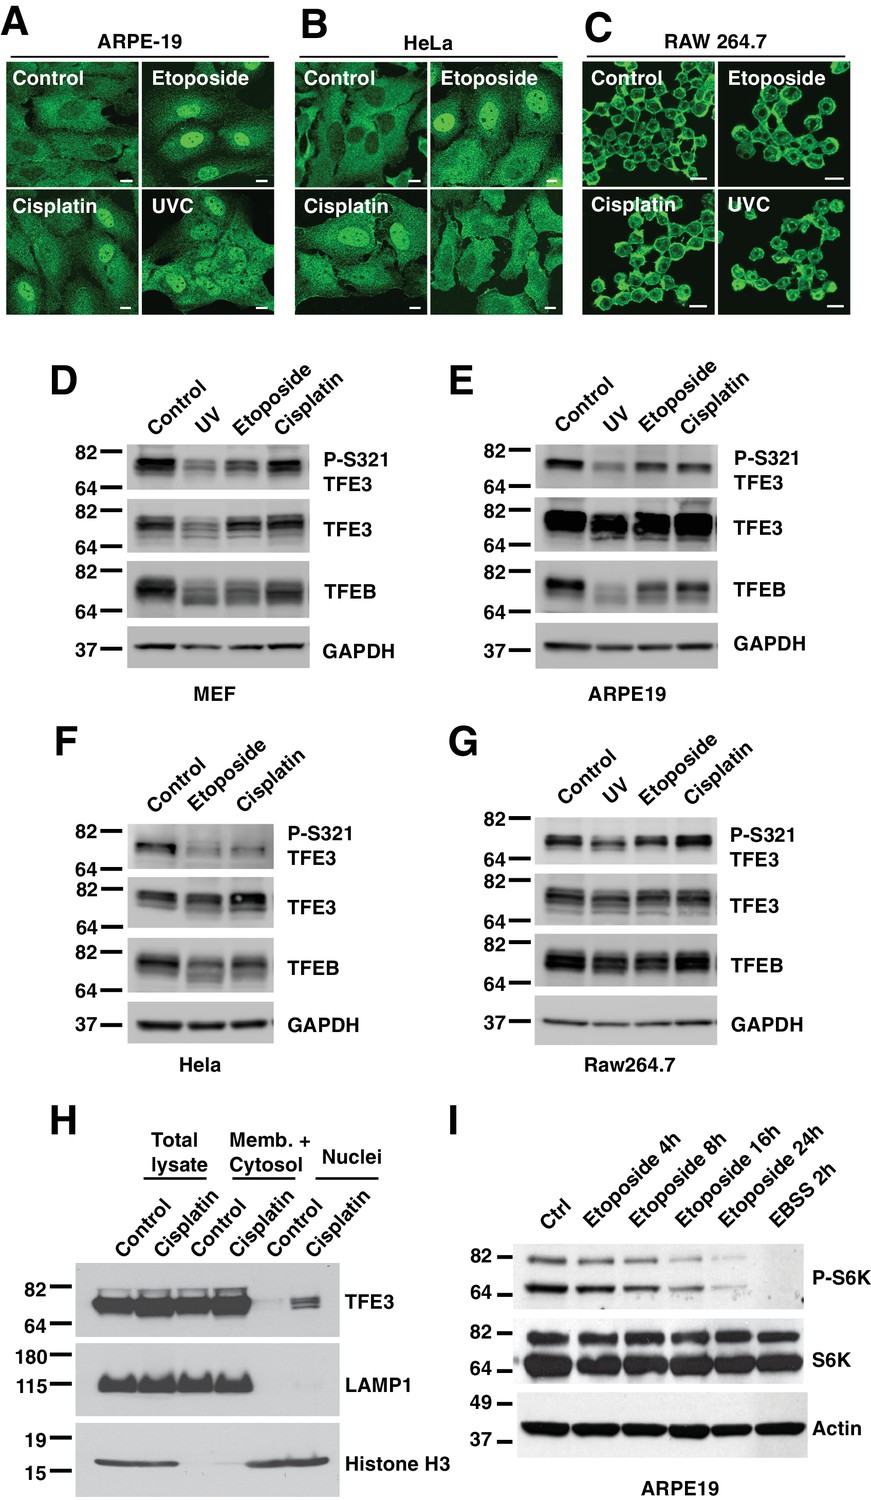
(A) Immunofluorescence images of ARPE-19 cells treated with 100 μM etoposide or 50 μM Cisplatin for 24 hr or 10 hr after UVC irradiation.
Scale bar = 10 μm. (B) Immunofluorescence images of HeLa cells treated with 100 μM etoposide for 24 hr or 50 μM Cisplatin for 12 hr and 4 hr after UVC irradiation. Scale bar = 10 μm. (C) Immunofluorescence images of RAW 264.7 cells treated with 100 μM etoposide for 10 hr or 35 μM Cisplatin for 10 hr or 4 hr after UVC irradiation. Scale bar = 10 μm. (D) Representative Western blot showing TFE3 de-phosphorylation at Ser321 and gel shift in TFEB in WT MEFs exposed to 100 μM etoposide for 8 hr or 50 μM Cisplatin for 10 hr or 10 hr after UVC irradiation. (E) Representative Western blot showing TFE3 de-phosphorylation at Ser321 and gel shift in TFEB in ARPE19 cells exposed to 100 μM etoposide for 24 hr or 50 μM Cisplatin for 24 hr or 24 hr after UVC irradiation. (F) Representative Western blot showing TFE3 de-phosphorylation at Ser321 and gel shift in TFEB in HeLa cells exposed to 100 μM etoposide for 24 hr or 50 μM Cisplatin for 18 hr. (G) Representative Western blot showing TFE3 de-phosphorylation at Ser321 and gel shift in TFEB in RAW 264.7 cells exposed to 100 μM etoposide for 8 hr or 50 μM Cisplatin for 8 hr or 4 hr after UVC irradiation. (H) Representative Western blot showing TFE3 nuclear distribution by subcellular fractionation of WT MEFs exposed to 50 μM Cisplatin for 10 hr. (I) Western blot showing etoposide dependent S6K de-phosphorylation in ARPE19 cells. All the immunoblots are representative of three independent experiments.
Figure 2 with 1 supplement
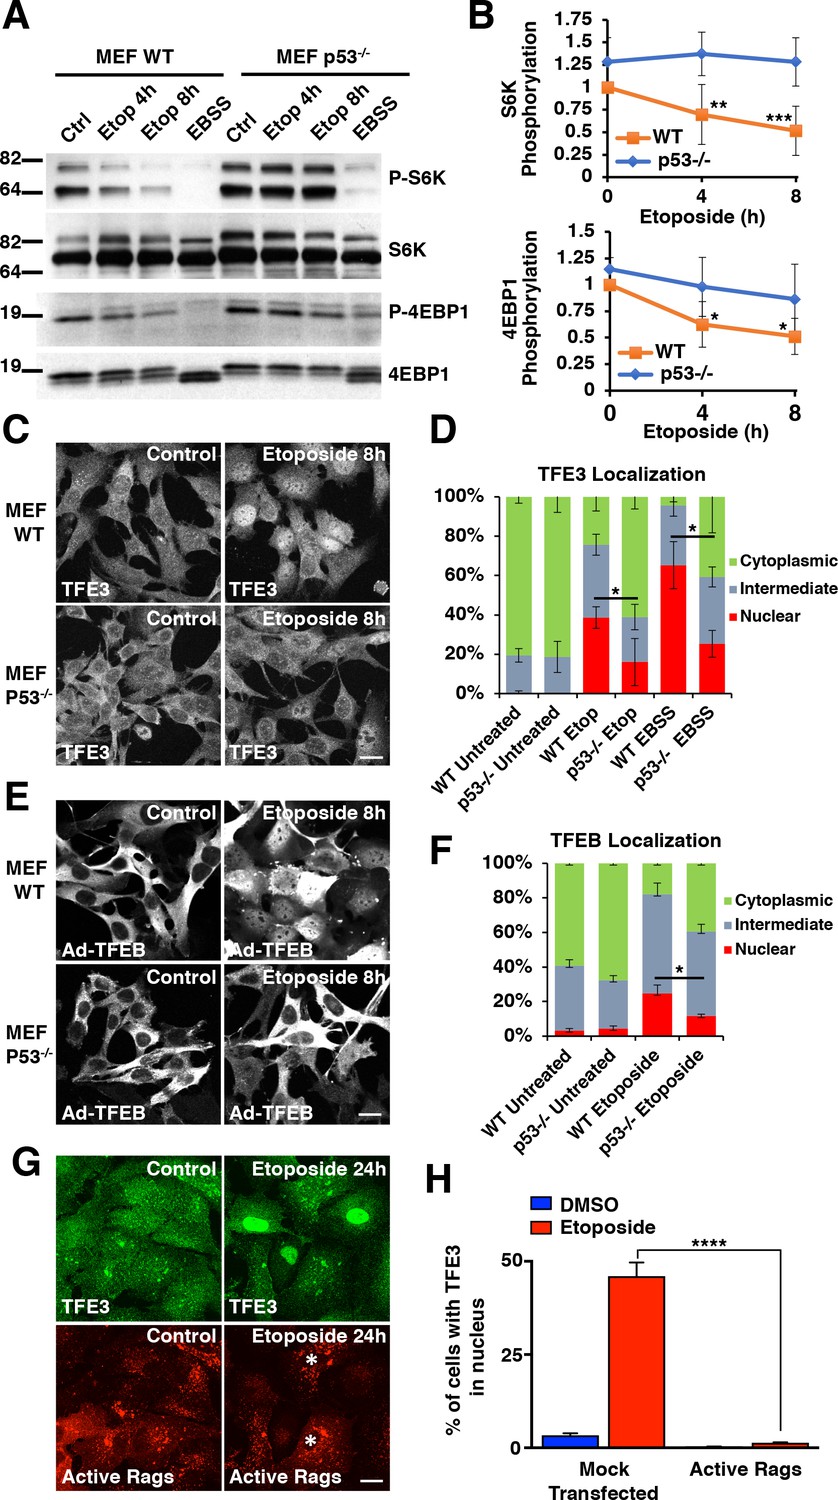
DNA damage-induced TFE3 and TFEB activation is a p53 and mTORC1 dependent process.
(A) Representative Western blot showing p53-dependent inhibition of mTORC1 in response to etoposide treatment in WT and p53-/- MEFs. EBSS for 2 hr was used as a positive control for mTORC1 inhibition and was relatively unaffected by p53 status. (B) Quantification of Western blot data shown in A. Values represent mean ± standard deviation with n = 5. Significance determined with Two-way ANOVA with Sidak’s multiple comparisons test (*p < 0.05, **p < 0.01, ***p < 0.001). (C) Immunofluorescence images displaying TFE3 translocation after 8 hr etoposide in WT MEFs compared to p53-/- MEFs. Scale bar = 20 μm. (D) Quantification of results from C. Levels represent mean percentage of cells localized in the nucleus, cytosol, or evenly distributed between both with n = 3 and > 80 cells counted per condition per trial. Significance determined with Student’s t-test (*p < 0.05). (E) Immunofluorescence images displaying TFEB translocation after 8 hr etoposide in WT and p53-/- MEFs infected with Ad-TFEB-FLAG. Scale bar = 20 μm. (F) Quantification of results from E. Levels represent mean percentage of cells localized in the nucleus, cytosol, or evenly distributed between both with n = 2 and > 80 cells counted per condition per trial. Significance determined with Student’s t-test (*p < 0.05). (G) Immunofluorescence images displaying TFE3 cellular distribution after 24 hr etoposide in ARPE-19 cells expressing active Rag heterodimers. Asterisks indicate transfected cells. Scale bar = 10 μm. (H) Quantification of results from G. Values represent mean ± standard deviation of the percentage of cells with nuclear TFE3 with n = 2 experiments and > 300 cells counted per trial (****p < 0.0001).
-
Figure 2—source data 1
Phosphorilation of S6K and 4EBP1 in WT and p53-/- MEFs.
- https://doi.org/10.7554/eLife.40856.006
-
Figure 2—source data 2
TFE3 localization in WT and p53-/- MEFs.
- https://doi.org/10.7554/eLife.40856.007
-
Figure 2—source data 3
TFEB localization in WT and p53-/- MEFs.
- https://doi.org/10.7554/eLife.40856.008
-
Figure 2—source data 4
TFE3 nuclear translocation in response to etoposide in cells transfected with active Rags.
- https://doi.org/10.7554/eLife.40856.009
Figure 2—figure supplement 1
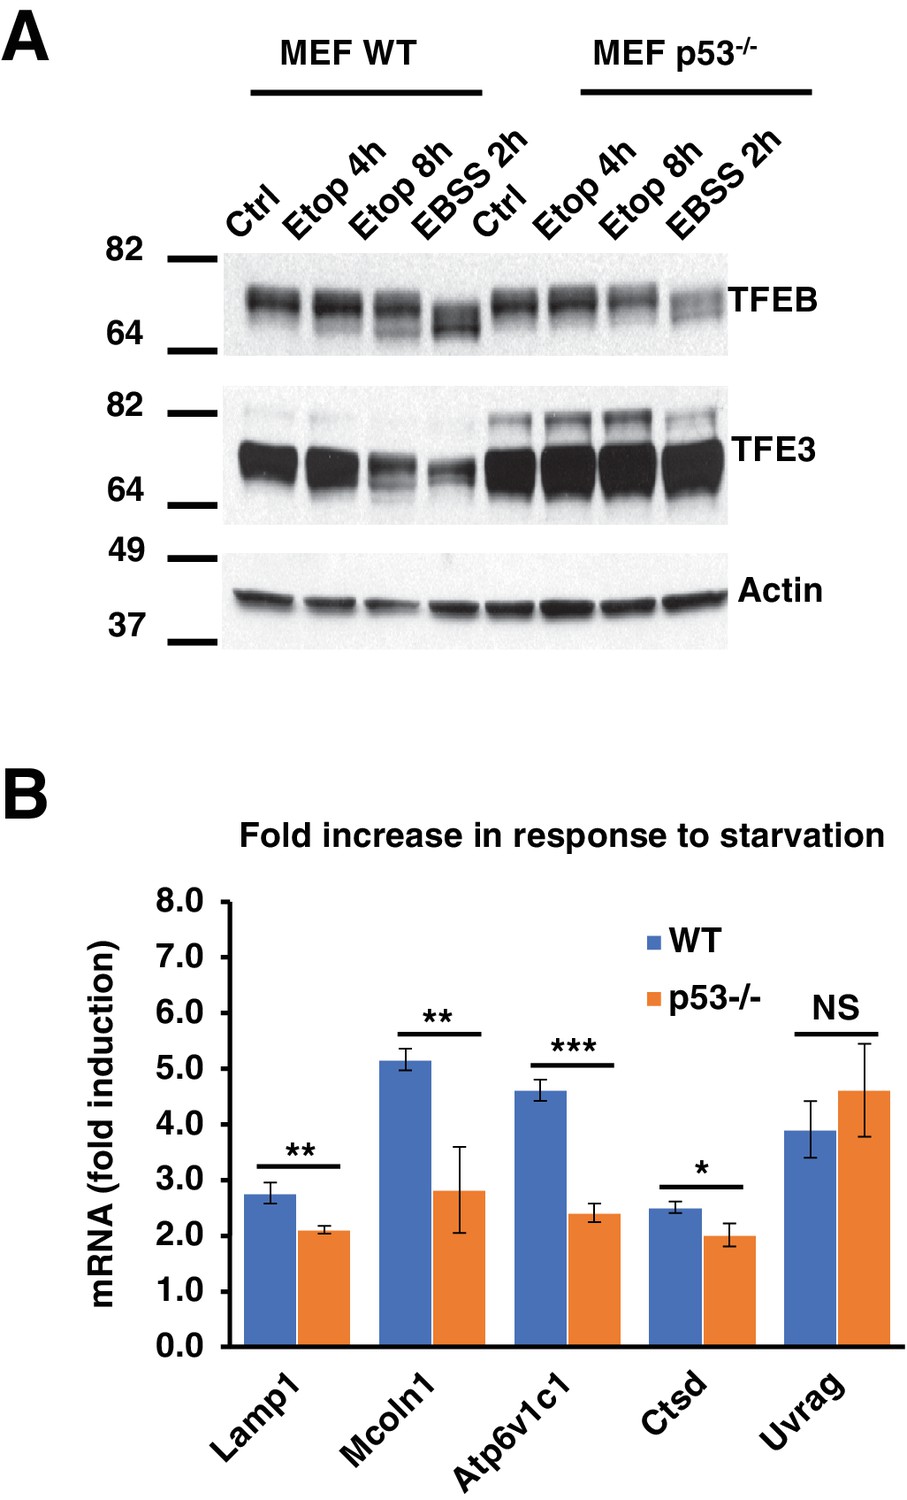
(A) Representative Western blot showing TFEB and TFE3 gel shifts in response to etoposide in WT MEF, but not in p53-/- MEF.
All the immunoblots are representative of three independent experiments. (B) qPCR data showing relative induction of lysosomal-autophagy genes in response to starvation in WT and p53-/- MEF. Data normalized to untreated cells and represents geometric means ± standard deviation and significance determined with Student’s t-test (*p < 0.05, **p < 0.01, ***p < 0.001).
-
Figure 2—figure supplement 1—source data 1
qPCR data for lysosomal-autophagy genes.
- https://doi.org/10.7554/eLife.40856.011
Figure 3 with 1 supplement
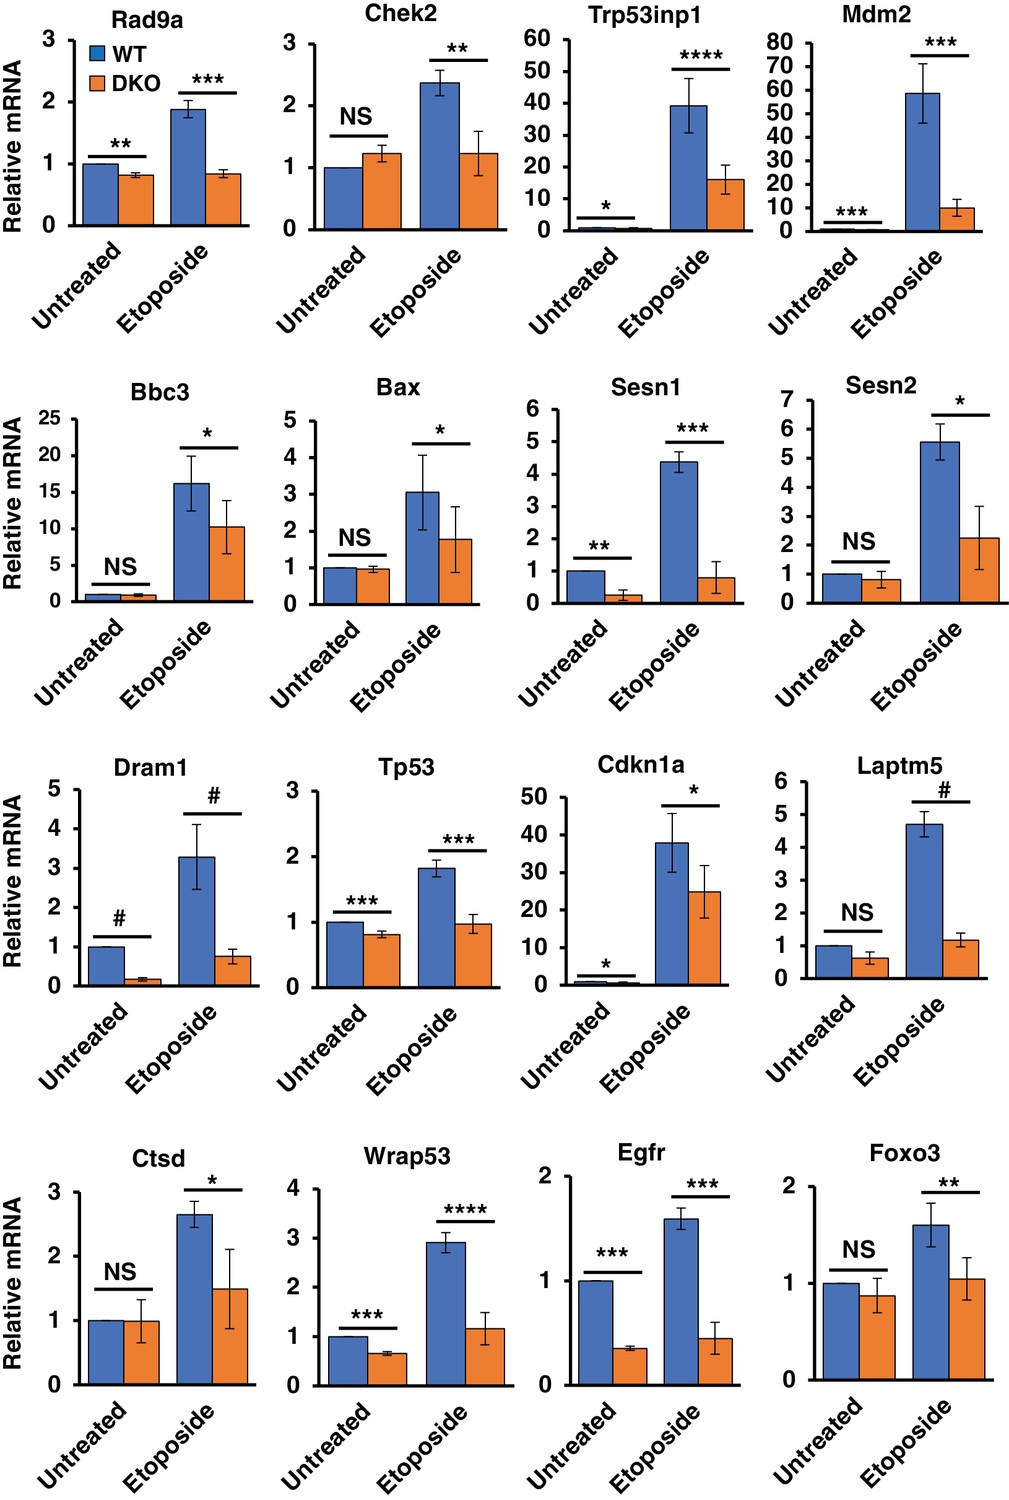
Differentially regulated genes in WT versus TFEB/TFE3 DKO MEFs undergoing DNA damage.
qRT-PCR-based quantification of basal and etoposide induced mRNA levels of Rad9a, Chek2, Trp53inp1, Mdm2, Bbc3, Bax, Sesn1, Sesn2, Dram1, Tp53, Cdkn1a, Laptm5, Ctsd, Wrap53, Egfr and Foxo3 in WT vs TFEB/TFE3 DKO MEFs. All qRT-PCR data represented as geometric mean ± standard deviation and significance tested using Student’s t-test (*p < 0.05, **p < 0.01, ***p < 0.001, ****p < 0.0001, #p < 0.00001).
-
Figure 3—source data 1
Differentially regulated genes in WT and TFEB/TFE3 DKOs.
- https://doi.org/10.7554/eLife.40856.013
Figure 3—figure supplement 1
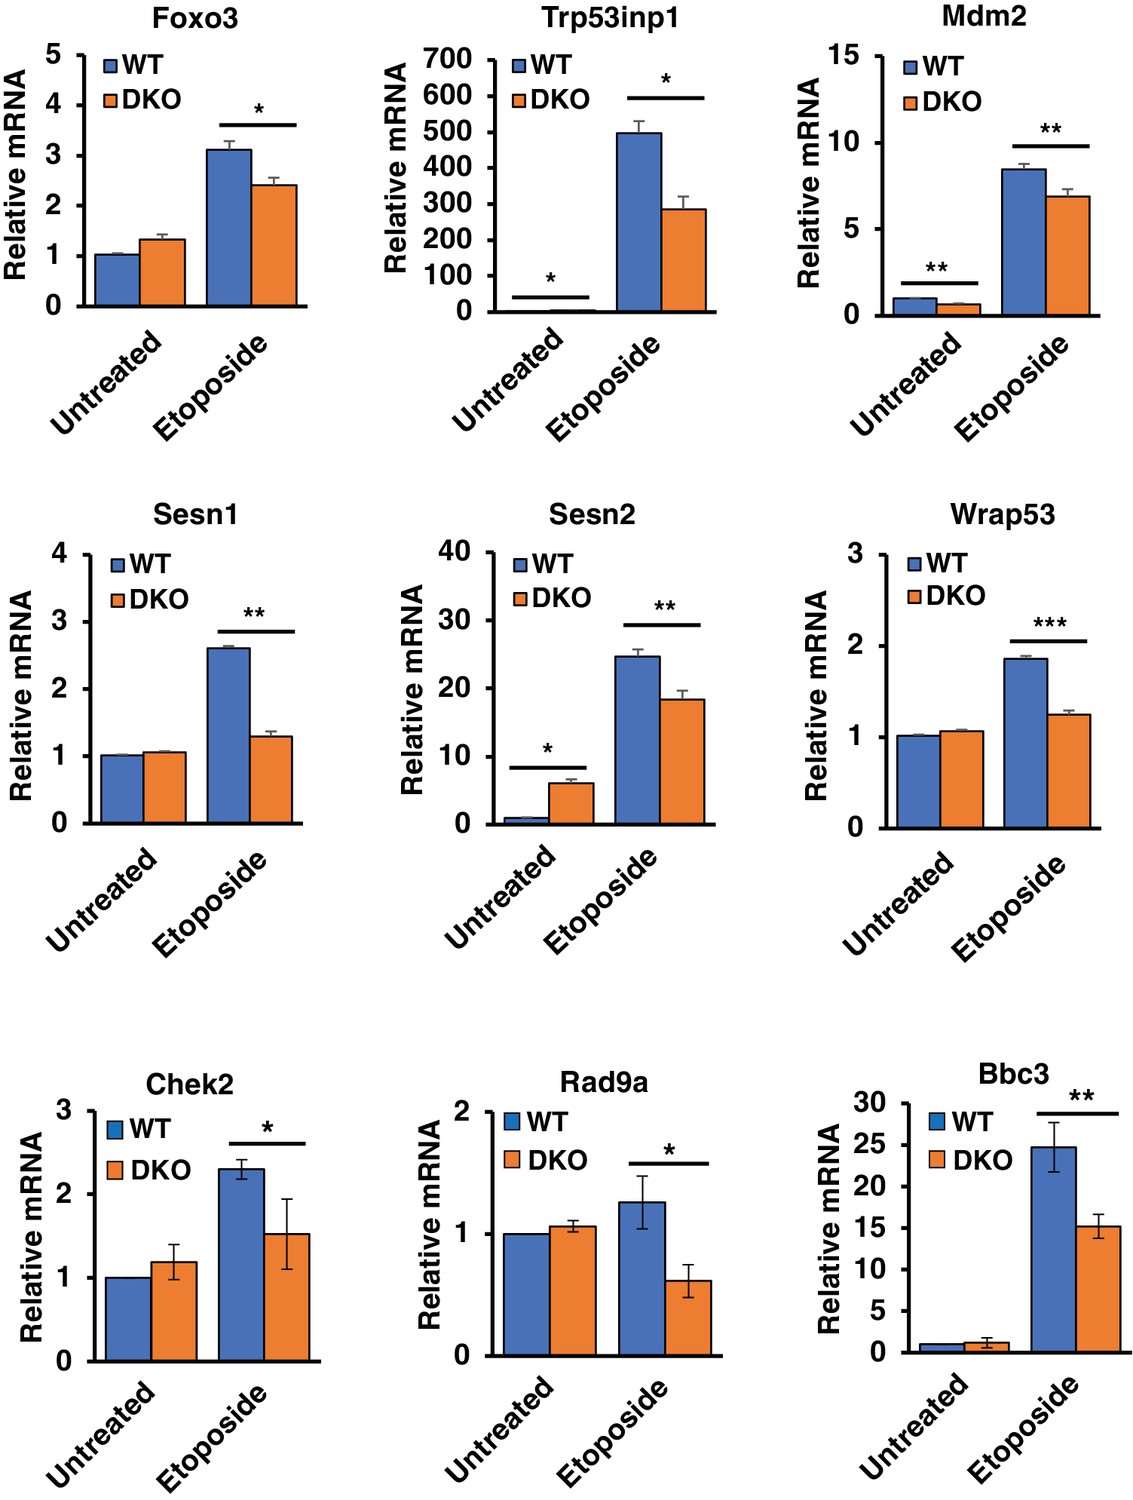
qRT-PCR analysis of differentially expressed p53 upstream regulators and downstream effectors in WT versus TFEB/TFE3 DKO RAW264.7 cells.
All data represented as geometric mean ± standard deviation and significance tested using Student’s t-test with n = 3 (*p < 0.05, **p < 0.01).
-
Figure 3—figure supplement 1—source data 1
qPCR analysis of differentially expressed p53 upstrem regulators and downstream effectors.
- https://doi.org/10.7554/eLife.40856.015
Figure 4
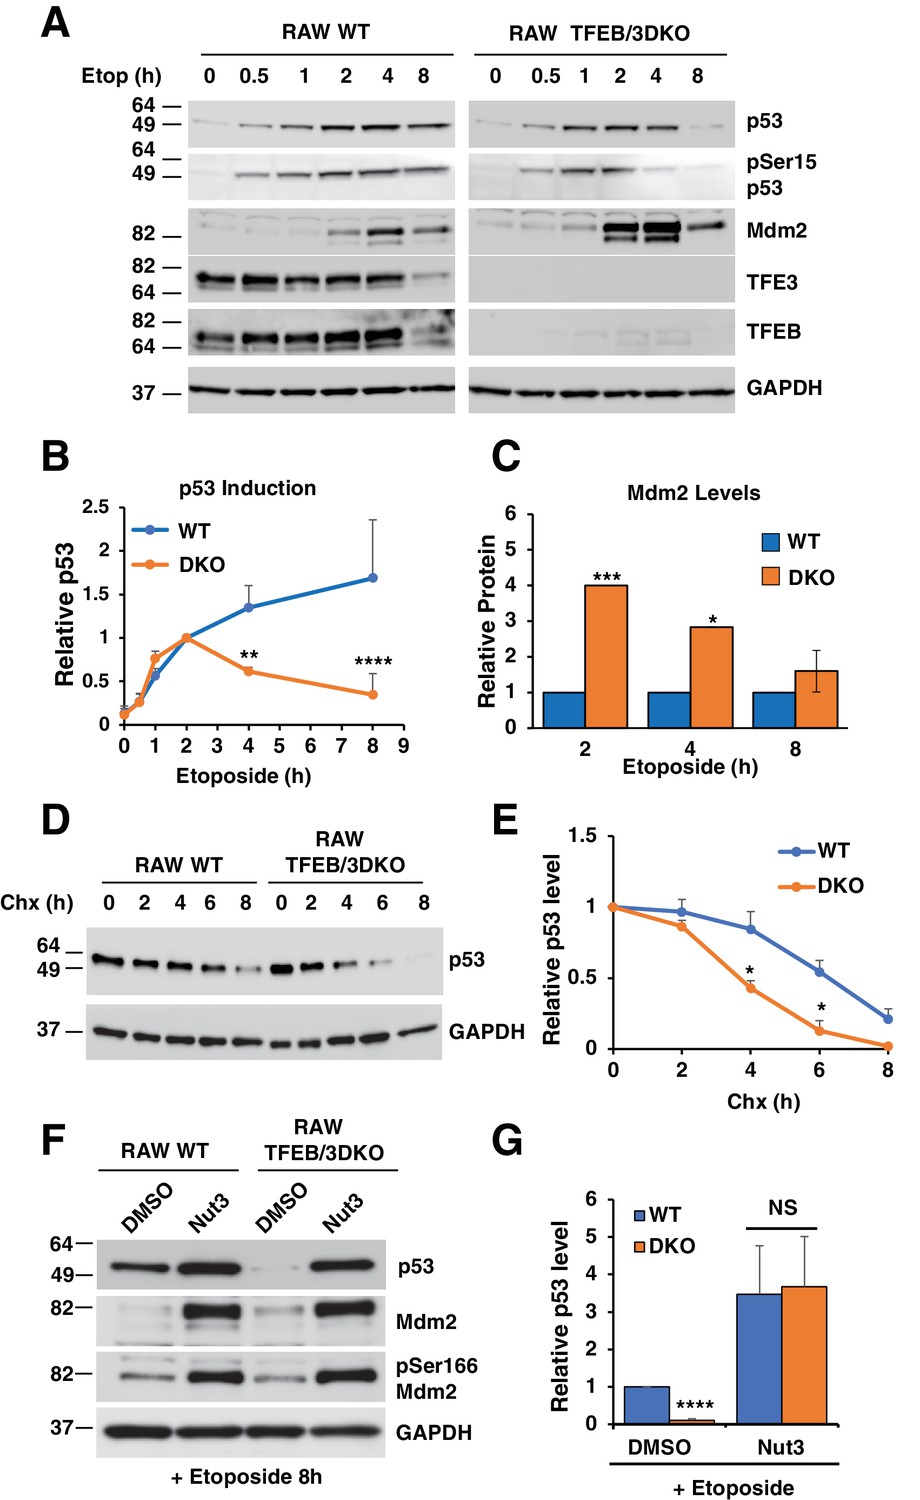
p53 induction in response to DNA damage is impaired in TFEB/TFE3 DKO RAW264.7.
7 cells. (A) Representative Western blot showing p53 induction, p53 Ser15 phosphorylation, and Mdm2 levels in WT and TFE3/TFEB DKO RAW264.7 cells following etoposide treatment up to 8 hr. (B) Quantification of p53 induction from data shown in A. Data represents mean relative p53 level ± standard deviation with n = 3. Significance tested with two-way ANOVA with Sidak’s multiple comparisons test (**p < 0.01, ****p < 0.0001). (C) Quantification of data shown in A. Total Mdm2 levels are significantly increased in TFEB/TFE3 DKO RAW264.7 cells compared to WT controls at 2- and 4 hr etoposide treatment. Data represents mean relative Mdm2 levels ± standard deviation with n=3. Significance tested with Student’s test (*p < 0.05, ***p < 0.001). (D) Representative Western blot of cycloheximide chase assay showing decreased p53 half-life in TFEB/TFE3 DKO RAW264.7 cells compared to WT controls. Cells were pre-treated with etoposide 2 hr to induce p53 expression and were chased in the presence of etoposide and cycloheximide. (E) Quantification of p53 levels from data shown in D. Data represents mean relative p53 level ± standard deviation with n = 3. Significance tested with Student’s test (*p < 0.05). (F) Representative Western blot showing rescue of p53 expression levels by treatment with nutlin-3 in TFEB/TFE3 DKO RAW264.7 cells after 8 hr etoposide treatment. (G) Quantification of p53 levels shown in F. Data represents mean relative p53 level ± standard deviation with n = 3. Significance tested using Student’s t-test (****p < 0.0001).
-
Figure 4—source data 1
Quantification of p53 induction in WT and TFEB/TFE3 DKO Raw264.7 cells.
- https://doi.org/10.7554/eLife.40856.017
-
Figure 4—source data 2
Quantification of Mdm2 levles in WT and TFEB/TFE3 DKO Raw264.7 cells.
- https://doi.org/10.7554/eLife.40856.018
-
Figure 4—source data 3
Quantification of p53 levels in chx-treated WT and TFEB/TFE3 DKO Raw264.7 cells.
- https://doi.org/10.7554/eLife.40856.019
-
Figure 4—source data 4
Quantification of p53 levels in Nut3-treated WT and TFEB/TFE3 DKO Raw264.7 cells.
- https://doi.org/10.7554/eLife.40856.020
Figure 5 with 1 supplement
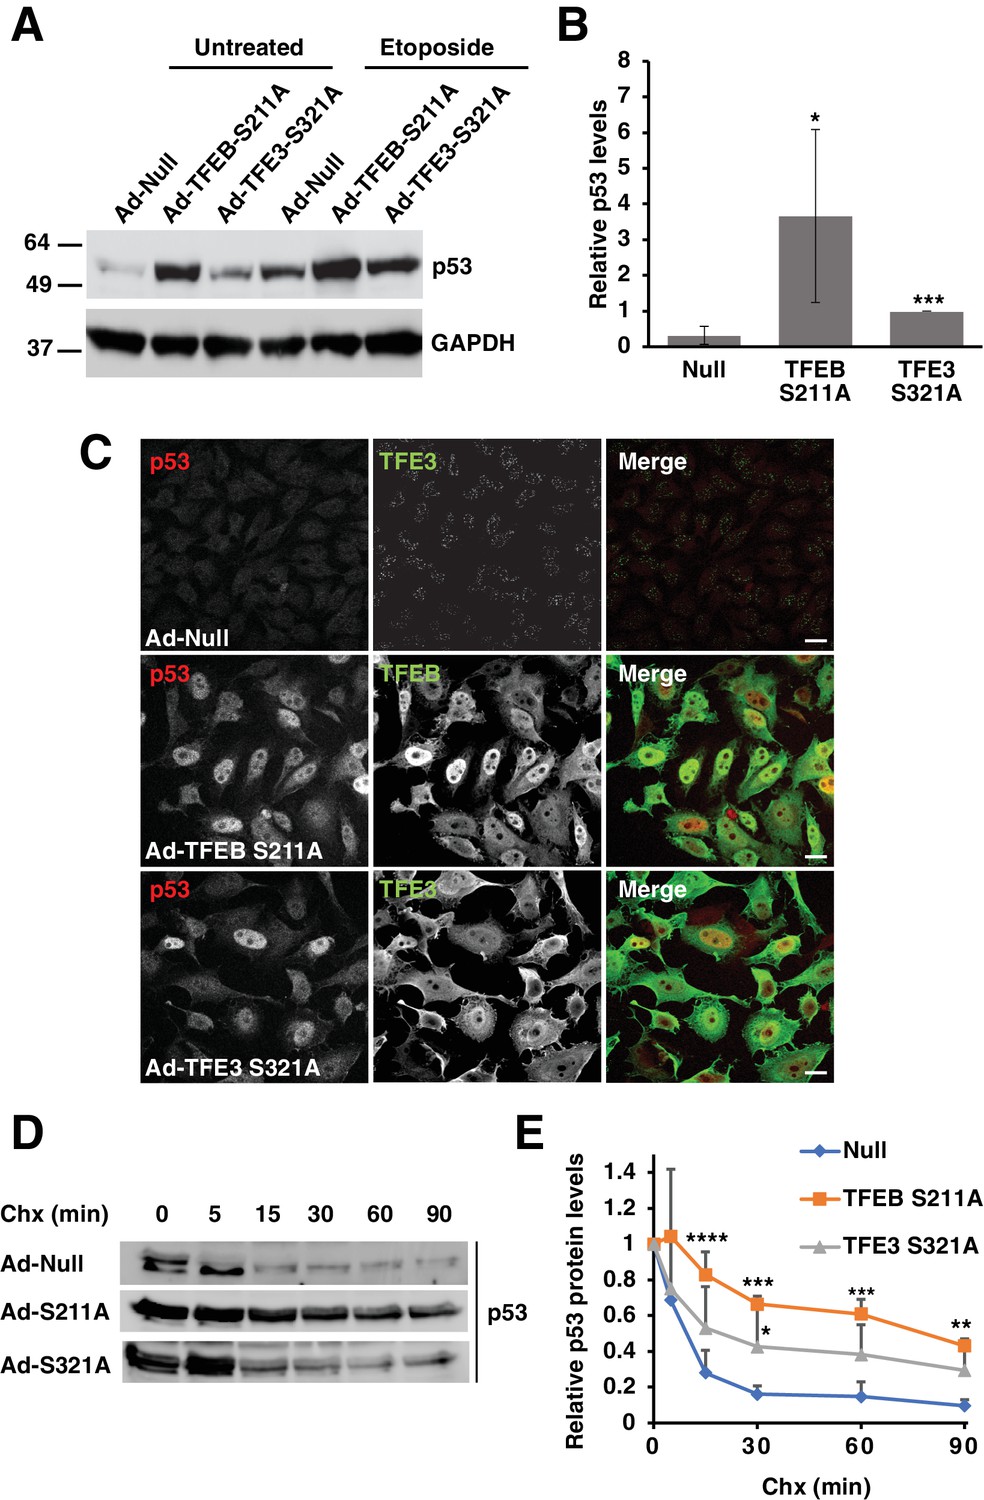
Expression of constitutively active TFEB and TFE3 in HeLa cells increases total p53 protein levels and its extends half-life.
(A) Representative Western blot showing elevated p53 protein levels in adenovirus infected HeLa cells expressing constitutively active mutants of TFEB and TFE3. Further p53 protein level increases are seen with constitutively active TFEB and TFE3 after treatment with etoposide 8 hr. (B) Quantification of basal p53 protein level in HeLa cells expressing constitutively active TFEB and TFE3. Due to the high dynamic range and low detectability of basal endogenous p53 in control cells, values were normalized to intermediate expression samples, TFE3 S321A. Data represents mean relative p53 level ± standard deviation with n = 5 (*p < 0.05, ***p < ). (C) Immunofluorescence images of HeLa cells expressing constitutively active TFEB and TFE3 exhibit robust p53 accumulation in the nucleus compared to control cells. Scale bar = 20 μm. (D) Representative Western blot of cycloheximide chase assay showing increased stability of p53 in HeLa cells infected with control (Null) adenovirus or adenovirus expressing constitutively active TFEB and TFE3. (E) Quantification of cycloheximide chase assay shown in D. Values represent mean p53 protein levels ± standard deviation and each condition normalized relative to time 0 for that cell population with n = 4. Significance tested with two-way ANOVA with Dunnett’s multiple comparisons test (*p < 0.05, **p < 0.01, ***p < 0.001, ****p < 0.0001).
-
Figure 5—source data 1
Quantification of p53 levels in cells transfected with TFEB and TFE3 active mutants.
- https://doi.org/10.7554/eLife.40856.022
-
Figure 5—source data 2
Quantification of p53 levels in chx-treated HeLa cells.
- https://doi.org/10.7554/eLife.40856.023
Figure 5—figure supplement 1
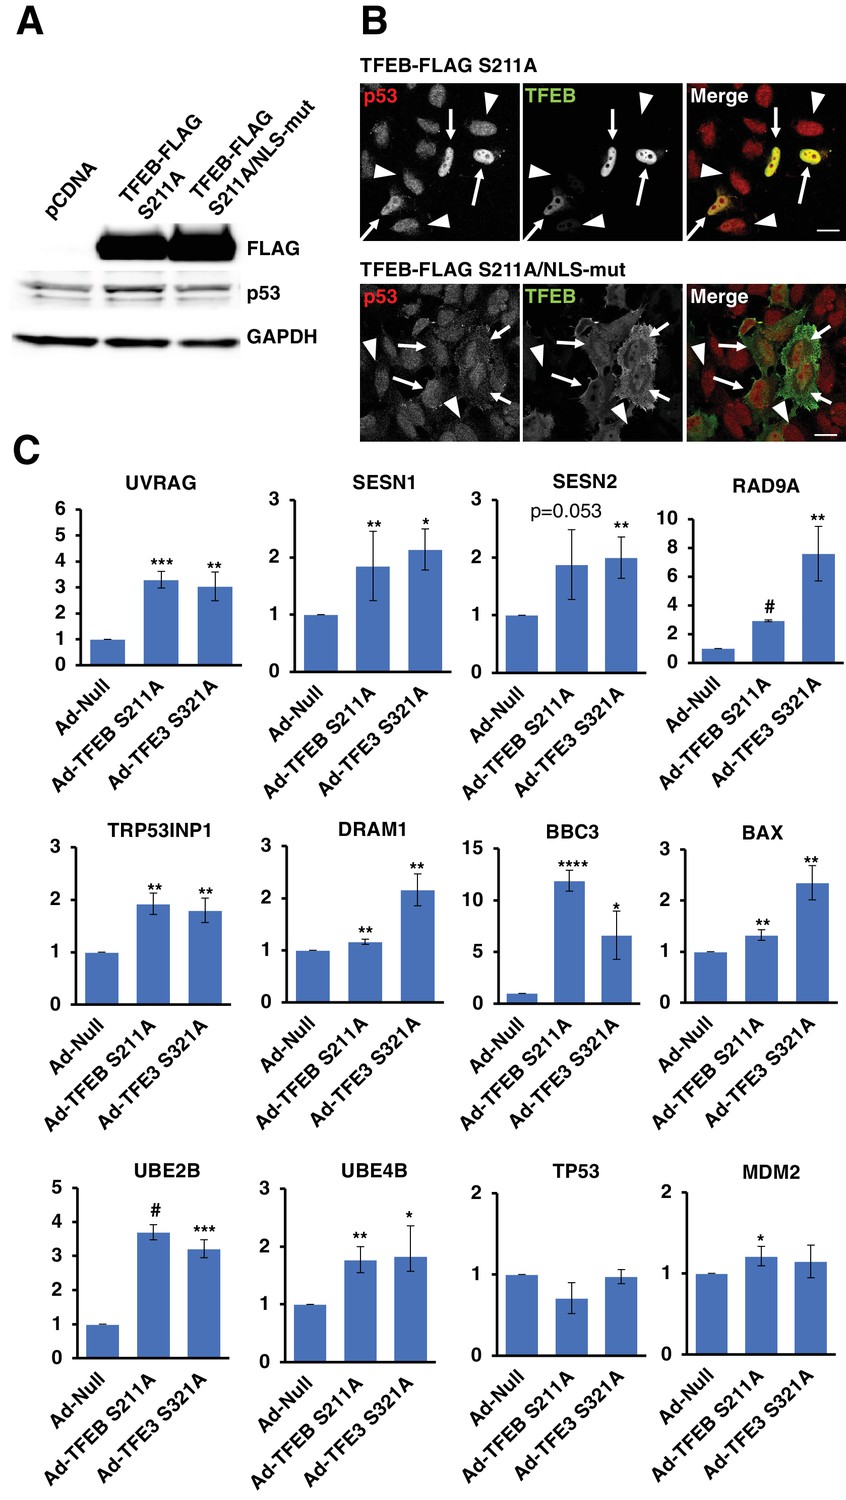
(A) Western blot showing that TFEB-S211A expression, but not the NLS mutant, increases p53 protein levels in HeLa cells.
(B) Immunofluorescence images of HeLa cells expressing either TFEB-S211A or TFEB-S211A/NLSmut. Only the nuclear localized TFEB-S211A expressing cells show appreciable p53 nuclear accumulation. Transfected cells indicated with arrows and untransfected cells indicated with arrowheads. Scale bar = 20 μm. (C) qRT-PCR analysis of TFEB-S211A and TFEB-S321A expressing HeLa cells for expression of DNA damage response and p53-dependent genes. All qRT-PCR data represented as geometric mean ± standard deviation and significance tested using Student’s t-test with n = 3 (*p < 0.05, **p < 0.01, ***p < 0.001, ****p < 0.0001, #p < 0.00001).
-
Figure 5—figure supplement 1—source data 1
qPRC analysis of DDR and p53-dependent gene expression.
- https://doi.org/10.7554/eLife.40856.025
Figure 6

TFEB and TFE3 are essential for etoposide-induced lysosomal membrane permeabilization in MEFs.
(A) Immunofluorescence images showing LMP in MEFs. Red galectin-1 puncta appear co-localized or within the lumen of green Lamp1 positive lysosomes. No LMP is detected under basal conditions in either WT or TFEB/TFE3 DKO MEFs. Treatment with etoposide induces profound LMP in WT, but not TFEB/TFE3 DKO cells. No differences in LMP induction were detected in LLOMe treated cells, regardless of genotype. Scale bar = 20 μm, inset = 2 μm. (B) WT MEFs exhibit a time-dependent increase in LMP after etoposide treatment. Quantification of data shown in A of galectin-1+/Lamp1 + LMP puncta per WT MEF cell. Data represent mean number of puncta per cell ± standard deviation from randomly selected confocal images, with > 20 cells per counted for each time point over three separate experiments. (C) Quantification of total number of galectin-1+/Lamp1+ LMP puncta per cell in WT vs TFE3/TFEB DKO MEFs treated for 8 hr with etoposide. Distribution is representative of one of the three independent experiments performed and shows 29 randomly selected WT MEF cells and 51 randomly selected TFEB/TFE3 DKO MEF cells. Significance determined using Student’s t-test (****p < 0.0001). (D) Quantification of overall galectin-1+/Lamp1+ LMP puncta distribution after 8 hr etoposide treatment in WT versus TFE3/TFEB DKO MEFs. Data were binned from three separate experiments with > 100 cells represented in each category and a minimum of 29 cells from each trial.
-
Figure 6—source data 1
Quantification of LMP following etoposide treatment.
- https://doi.org/10.7554/eLife.40856.027
-
Figure 6—source data 2
Quantification of galectin-1/lamp1-positive puncta in WT and DKO MEFs treated with etoposide.
- https://doi.org/10.7554/eLife.40856.028
Figure 7
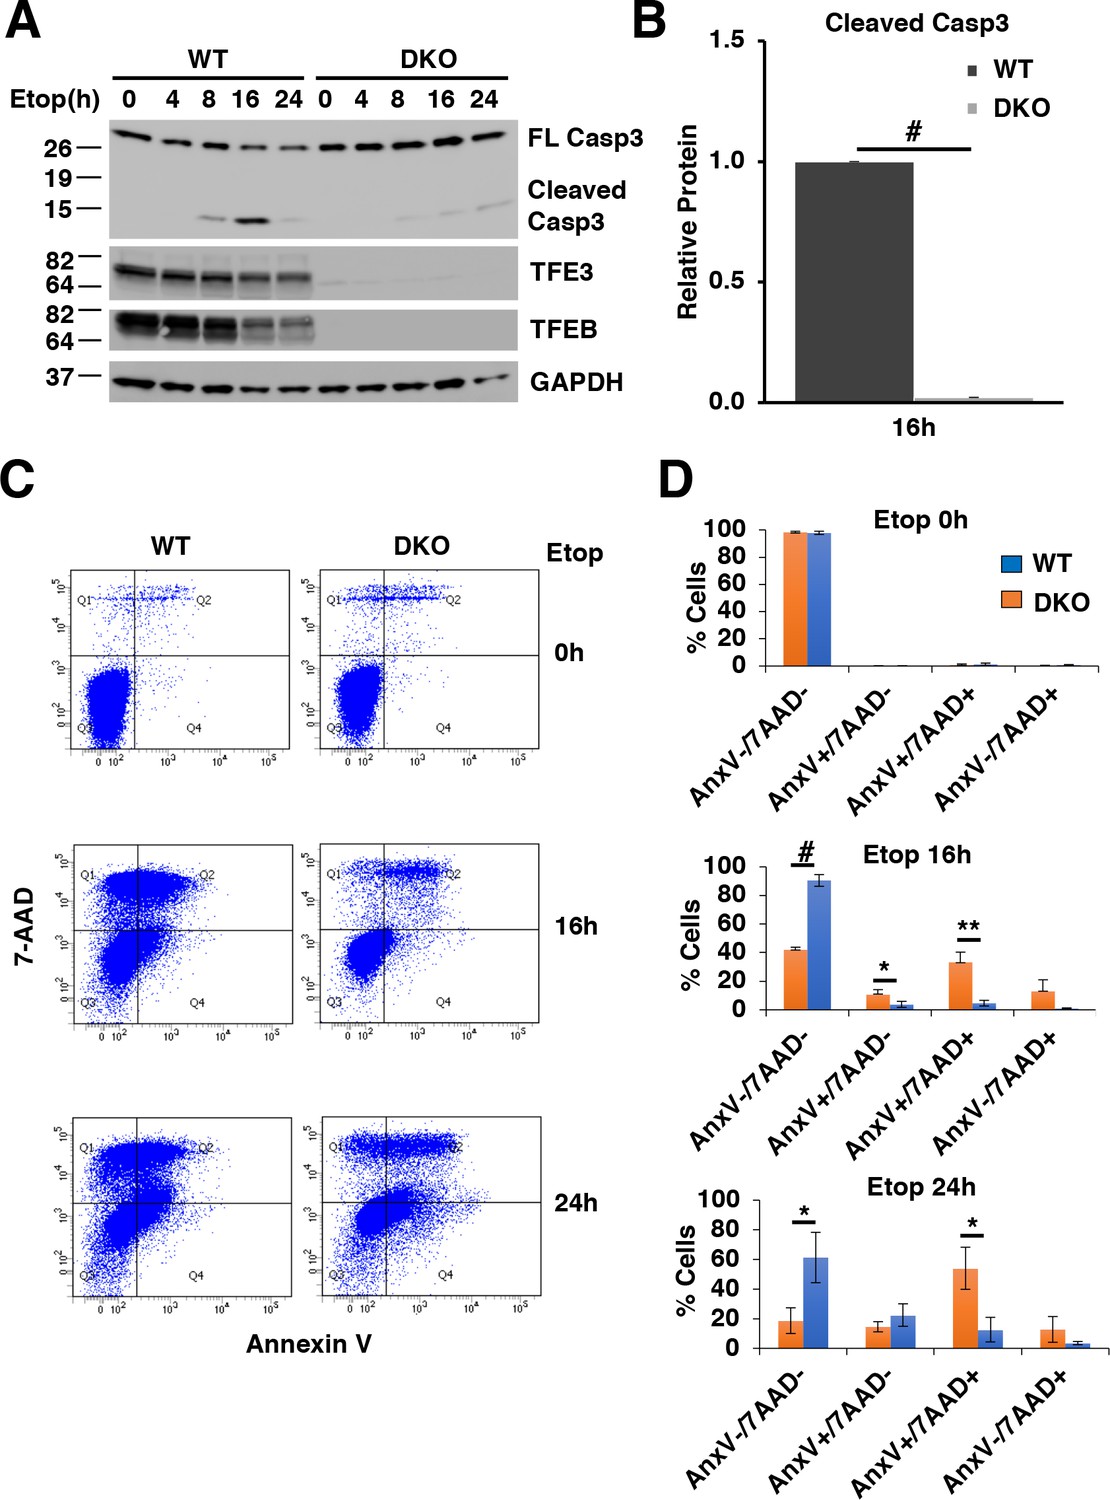
TFE3 and TFEB are necessary for proper execution of apoptosis in response to DNA damage in RAW264.7 cells.
(A) Representative Western blot showing Caspase-3 cleavage in response to increasing time of etoposide treatment. (B) Quantification of data shown in A indicating defects in Caspase-3 cleavage in TFEB/TFE3 DKO RAW264.7 cells. Cleaved Caspase-3 levels are normalized to WT cells after 16 hr etoposide treatment with n = 3. Significance tested with Student’s t-test (#p < 0.00001). (C) Annexin V/7-AAD flow cytometry assay data showing an impaired progression through early (AnnexinV+/7-AAD-) and late (AnnexinV+/7-AAD+) apoptosis in TFEB/TFE3 DKO RAW264.7 cells after 16 and 24 hr etoposide treatment. (D) Quantification of data shown in C. Data taken from three independent experiments and significance tested using Student’s t-test (*p < 0.05, **p < 0.01, #p < 0.00001).
-
Figure 7—source data 1
Quantification of cleaved Caspase-3 levels.
- https://doi.org/10.7554/eLife.40856.030
-
Figure 7—source data 2
Quantification of AnnexinV/7AAD levels by flow cytometry assays.
- https://doi.org/10.7554/eLife.40856.031
Figure 8 with 1 supplement
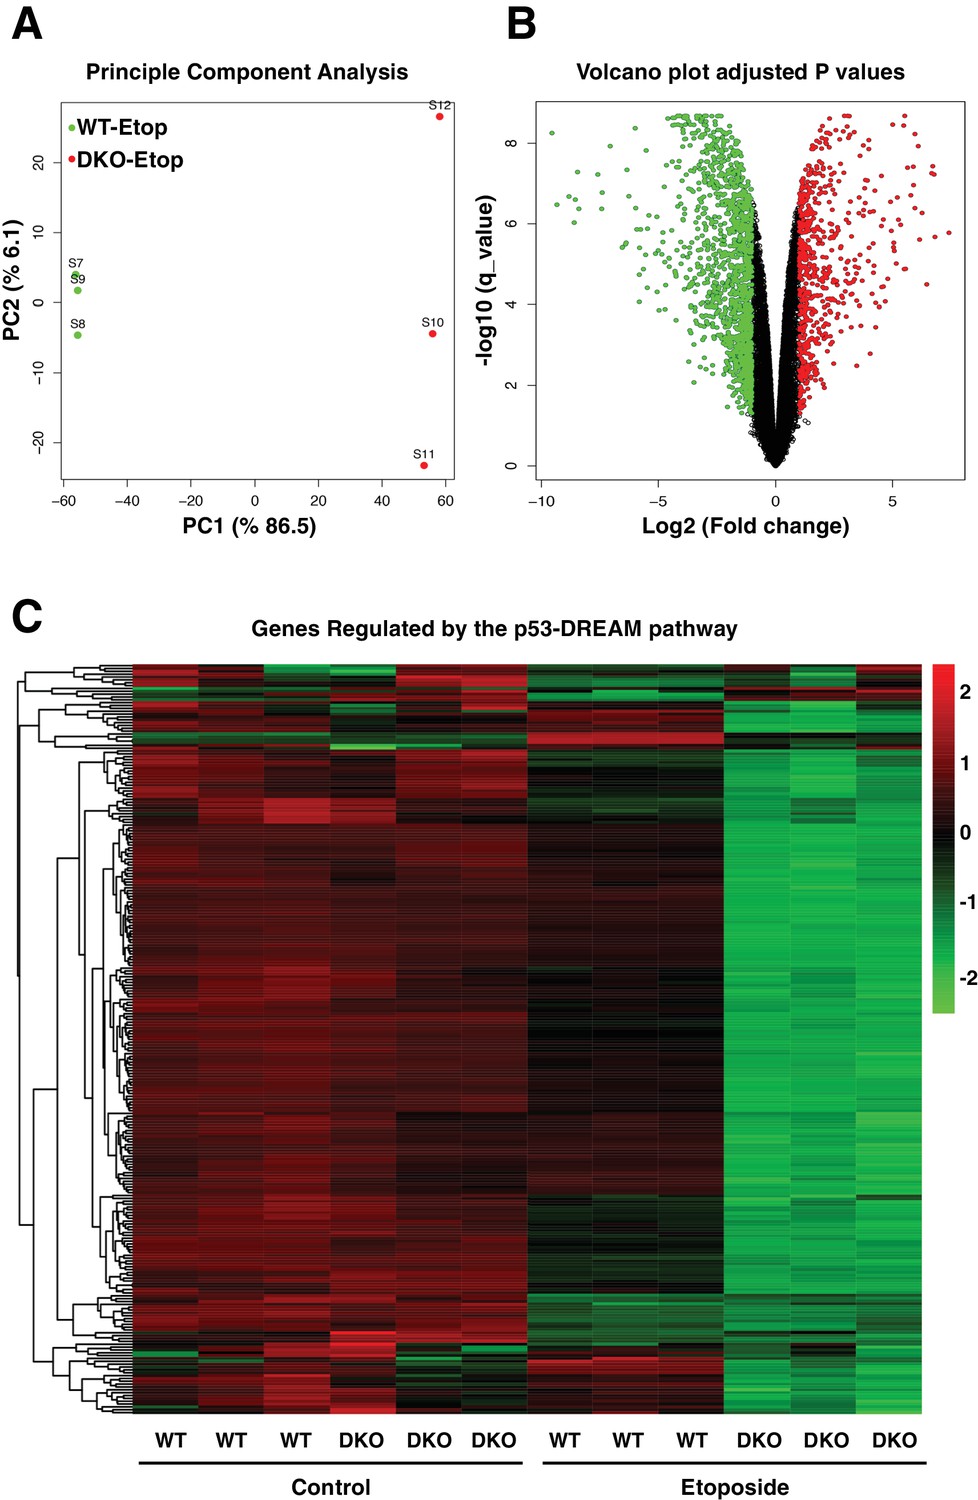
Comparative gene expression of etoposide-treated WT and TFEB/TFE3-DKO RAW264.7 cells.
(A) Principal component analysis of genes with q-value < 0.05 reveals distinct clustering of WT and TFEB/TFE3 DKO RAW 264.7 cells exposed to etoposide. (B) Volcano plot indicating distribution of genes significantly down- and up-regulated in WT versus TFEB/TFE3 DKO RAW264.7 cells exposed to etoposide for 8 hr. Cutoffs indicate genes with q-value < 0.05. (C) Hierarchical cluster heat map showing expression of DREAM pathway genes in three independent samples of WT and TFEB/TFE3 DKO RAW264.7 cells following etoposide treatment for 8 hr. Each row shows the relative expression level of a single mRNA. Each column shows the expression level of a single sample. Up-regulated mRNAs are shown in red and down-regulated mRNAs are shown in green.
Figure 8—figure supplement 1
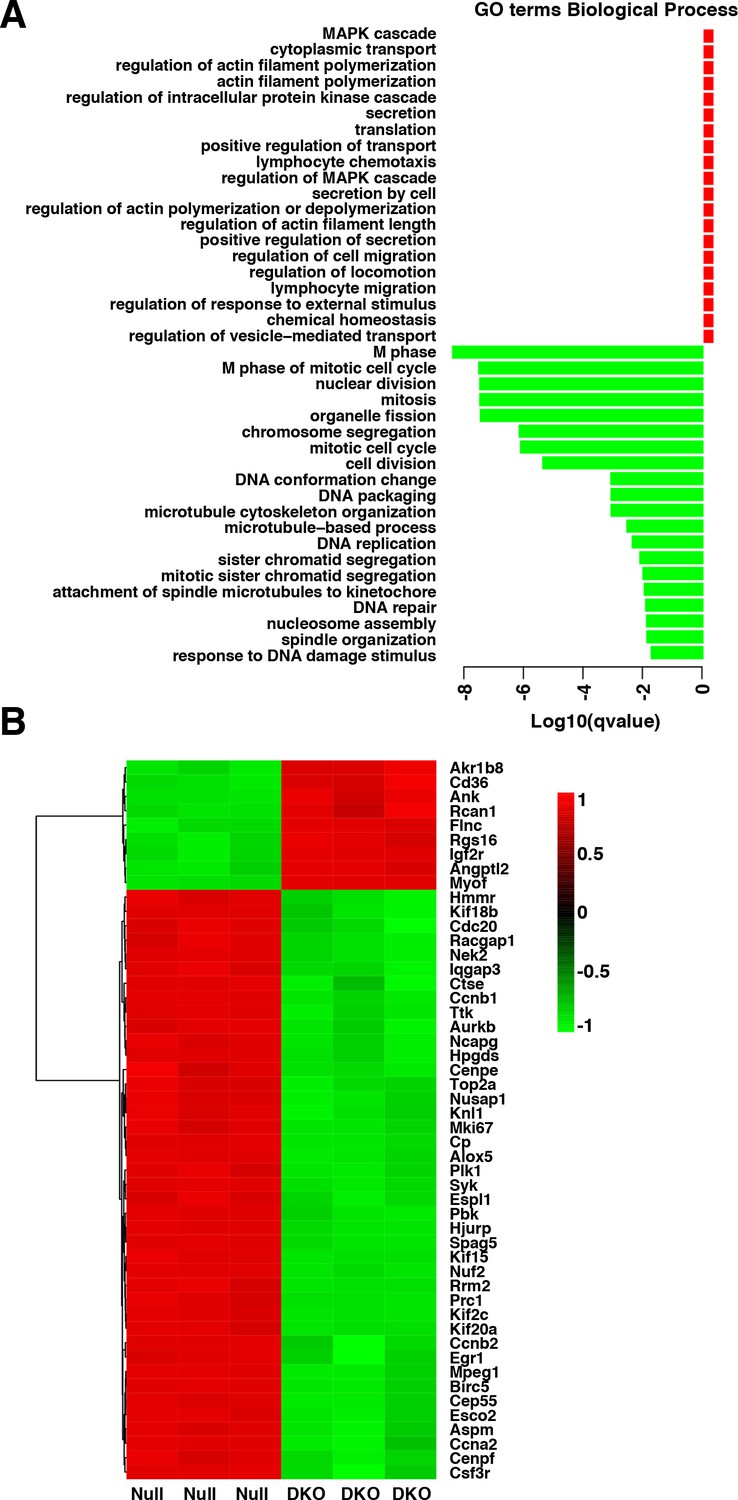
(A) Enriched GO terms in the ‘Biological Process’ category of differentially expressed genes between etoposide-treated WT and TFEB/TFE3 DKO RAW264.7 cells.
GO terms are ranked by q value (< 0.05). (B) Heatmap showing unsupervised hierarchical clustering of the 50 most significantly (q value < 0.05) differentially expressed genes between WT and TFEB/TFE3 DKO RAW264.7 cells following 8 hr of etoposide treatment. Up-regulated genes are shown in red, down-regulated genes are shown in green.
Figure 9

TFEB and TFE3 promote expression of cell cycle regulators.
(A) Profiles of Chip-seq analysis for TFE3 in CDK4 and CDK7 promoters in RAW264.7 cells under stress condition. (B) qPCR-based quantification of CDK4 and CDK7 mRNA levels in adenovirus infected HeLa cells expressing control (Null) or constitutively active mutants of TFEB and TFE3. Data represented as geometric mean ± standard deviation and significance tested using Student’s t-test with n = 3 (***p < 0.001, ****p < 0.0001). (C) Representative Western blot showing CDK4 and CDK7 levels in adenovirus infected HeLa cells expressing constitutively active mutants of TFEB and TFE3. Quantification of protein levels are shown on the right panels. Data represents mean relative CDK4 and CDK7 to GAPDH levels ± standard deviation. Significance tested using Student’s t-test with n = 3 (*p < 0.05, **p < 0.01, ***p < 0.001, ****p < 0.0001). (D) Representative Western blot showing the expression of cell cycle regulators in response to etoposide treatment in WT versus TFEB/TFE3 DKO RAW264.7 cells. (E) Representative Western blot showing Mdm2 and p53 levels in WT and TFEB/TFE3 DKO RAW264.7 cells following etoposide treatment. EBSS, indicated as E, was used for 2 hr as a positive control for maximum mTORC1 inhibition. All the western blots are representative of three independent experiments. (F) Quantification of phospho-Rb/total-RB ratios from data shown in D. Data represents mean relative phospho-Rb to total Rb level ± standard deviation with n = 3. Significance tested using Student’s t-test (*p < 0.05, **p < 0.01).
-
Figure 9—source data 1
qPCR data showing CDK4 and CDK7 levels in cells expressing TFEB and TFE3 active mutants.
- https://doi.org/10.7554/eLife.40856.035
-
Figure 9—source data 2
Quantification of CDK4 and CDK7 protein levels.
- https://doi.org/10.7554/eLife.40856.036
-
Figure 9—source data 3
Quantification of phospho-RB/total-RB ratio.
- https://doi.org/10.7554/eLife.40856.037
Figure 10
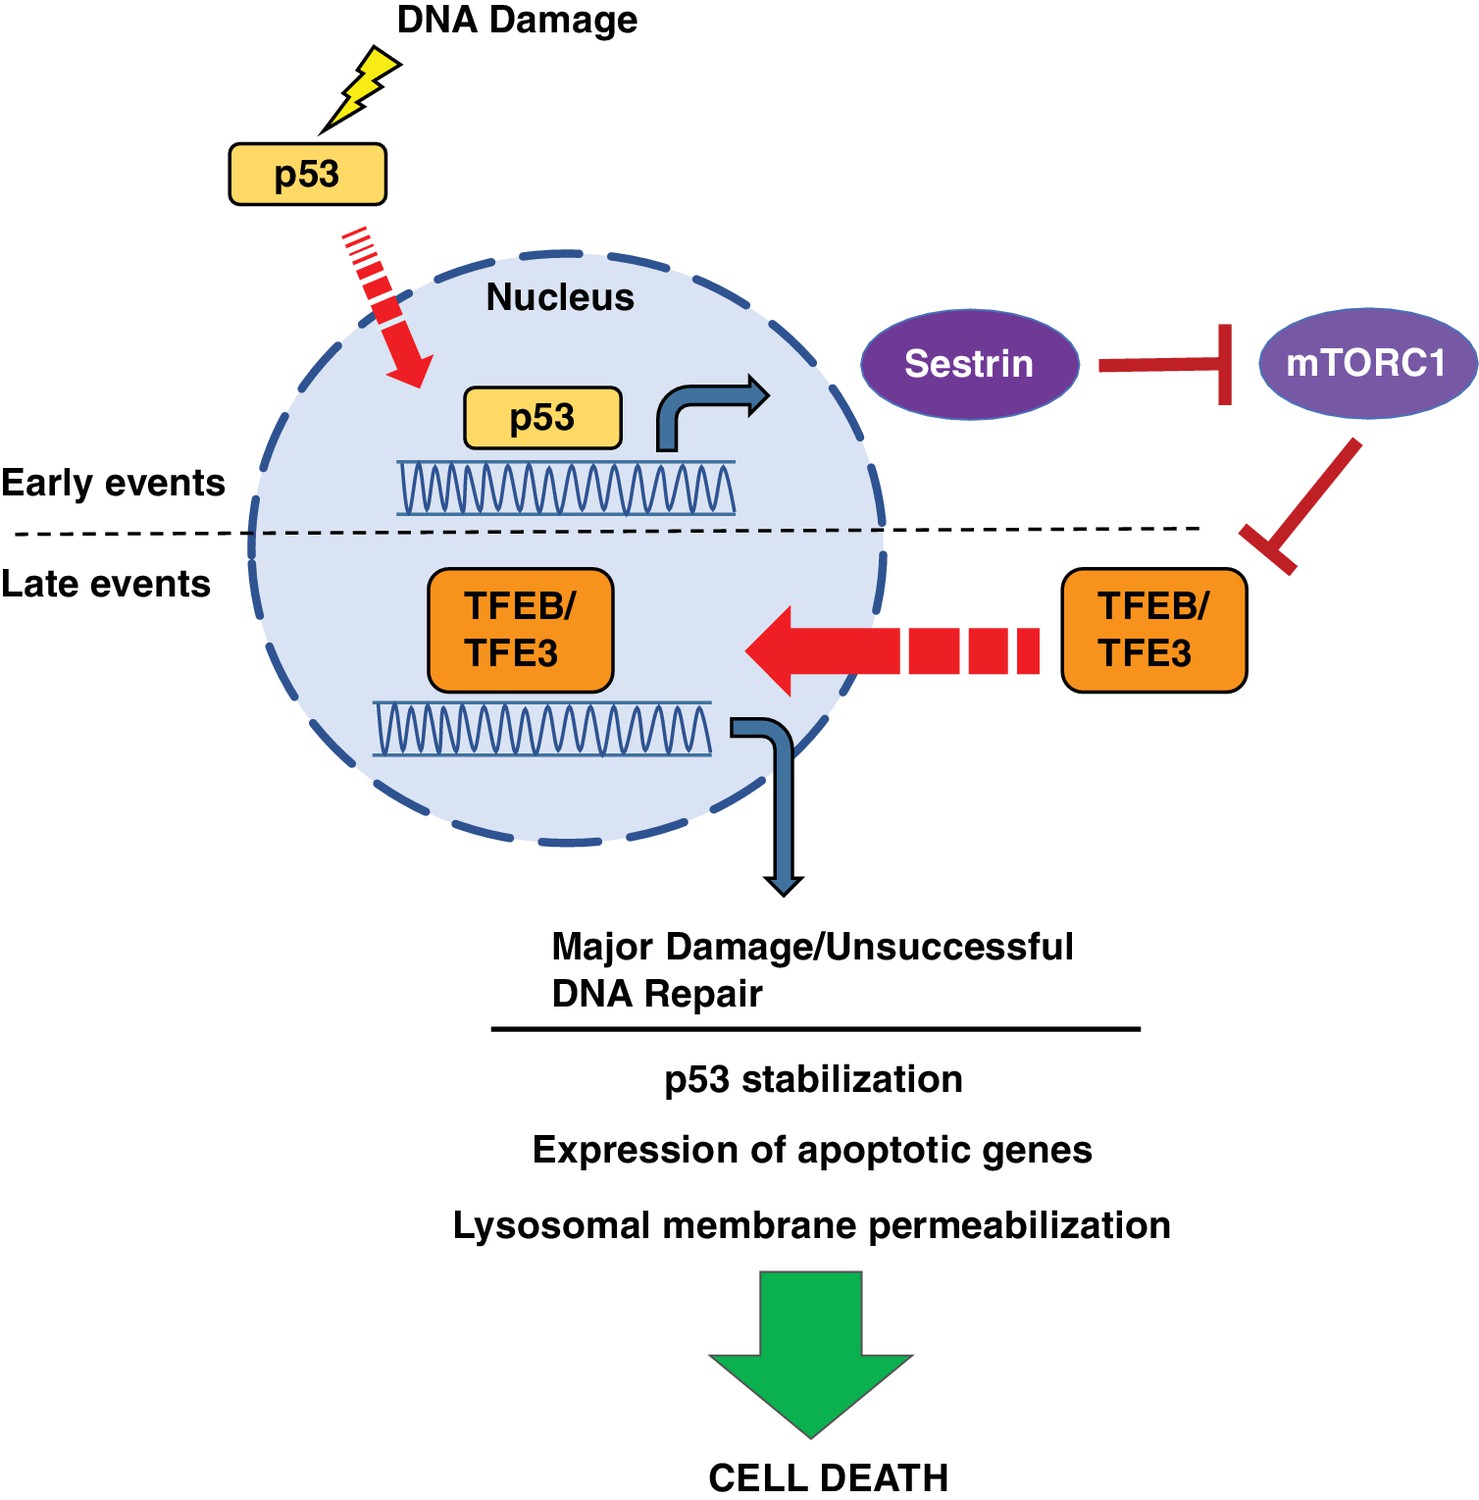
Schematic representation of a novel p53-mTORC1-TFEB/TFE3 pathway activated by DNA damage stress.
Following DNA damage stress, p53 rapidly promotes the transcription of numerous downstream targets involved in DNA repair, cell cycle arrest and apoptosis. Some p53 targets, such as the members of the sestrin family, cause a reduction in mTORC1 activity, thus leading to TFEB and TFE3 activation. This p53-dependent activation of TFEB and TFE3 results in enhanced p53 signaling.
Author response image 1
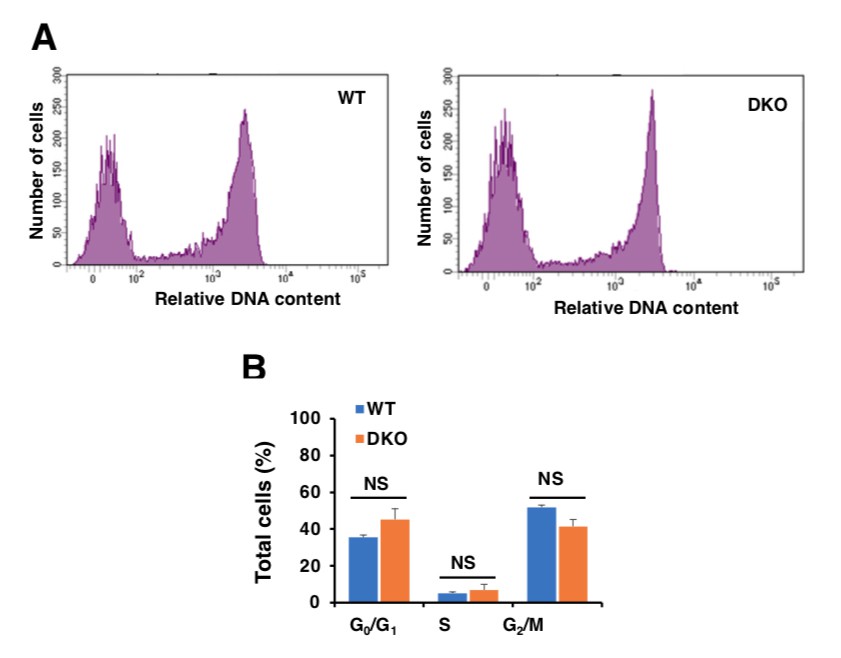
Analysis of cell cycle in WT and TFEB/TFE3 DKO RAW 264.7 cells.
A.WT and TFE3/TFEB DKO Raw264.7 cells were treated with 10 μM EdU for 2 hours, DNA contents were detected with Alexa Flour 488 fluorescence by flow cytometry according to the recommended staining protocol. B.Data taken from three independent experiments and significance tested using Student’s t-test.
Tables
Key resources table
| Reagent type (species) or resource | Designation | Source or reference | Identifiers | Additional information |
|---|---|---|---|---|
| Cell line (Mus musculus) | MEF | ATCC | Cat. #: CRL-2977 | |
| Cell line (Mus musculus) | MEF p53-/- | MEF p53-/- | David J. Kwiatkowski (Brigham and Women's Hospital) | |
| Cell line (Mus musculus) | MEF TFEB/TFE3 DKO | PMID: 26813791 | ||
| Cell line (Mus musculus) | Raw264.7 TFEB/TFE3 DKO | PMID: 27171064 | ||
| Cell line (Homo sapiens, |human) | HeLa | ATCC | Cat. #: CCL-2 RRID: CVCL_0030 | |
| Cell line (Homo sapiens, human) | HeLa (CF7) TFEB | PMID: 19556463 | Andrea Ballabio (Baylor College of Medicine) | |
| Cell line (Homo sapiens, |human) | ARPE19 | ATCC | Cat. #: CRL-2302 RRID: CVCL_0145 | |
| Adenovirus | TFEB (WT, S211A) | Welgen | PMID: 24448649 | |
| Adenovirus | TFE3 S321A | Welgen | PMID: 23401004 | |
| Transfected construct | pRK5-HA-GST-RagBGTP | Addgene | plasmid 19303 | PMID: 18497260 |
| Transfected construct | pRK5-HA-GST-RagDGDP | Addgene | plasmid 19308 | PMID: 18497261 |
| Transfected construct | pcDNA3.1-TFEB | Invitrogen | PMID: 19556463 | |
| Antibody | Rabbit anti-TFE3 | Sigma-Aldrich | Cat. #: HPA023881 RRID: AB_1857931 | WB (1:1000) |
| Antibody | Rabbit anti-phospho S321 TFE3 | YenZym Antibodies | WB (1:1000) | |
| Antibody | Rabbit anti-TFEB | Bethyl Laboratories | Cat. #: A303-673A RRID: AB_11204751 | WB (1:5000) |
| Antibody | Rabbit anti-TFEB | Cell Signaling Technology | Cat. #: 4240 RRID: AB_11220225 | WB (1:1000) |
| Antibody | Rabbit anti-phospho S211 TFEB | YenZym Antibodies | WB (1:1000) | |
| Antibody | Mouse anti-Flag | Sigma-Aldrich | Cat. #: F3165 clone M2 RRID: AB_259529 | WB (1:5000) IF (1:1000) |
| Antibody | Mouse anti-actin | BD Transduction Laboratories | Cat. #: 612656 RRID: AB_2289199 | WB (1:1000) |
| Antibody | Mouse anti-HA | Covance | Cat. #: MMS-101P RRID: AB_2314672 | IF (1:3000) |
| Antibody | Rat anti-LAMP1 | DSHB | Cat. #: 1D4B RRID: AB_2134500 | WB (1:1000) |
| Antibody | Rabbit anti-Histone H3 | Cell Signaling Technology | Cat. #: 9003 | WB (1:1000) |
| Antibody | Rabbit anti- p70 S6 Kinase | Cell Signaling Technology | Cat. #: 2708 RRID: AB_390722 | WB (1:1000) |
| Antibody | Rabbit anti-phospho-p70 S6 Kinase | Cell Signaling Technology | Cat. #: 9205 RRID: AB_330944 | WB (1:1000) |
| Antibody | Rabbit anti-4E-BP1 | Cell Signaling Technology | Cat. #: 9644 RRID: AB_2097841 | WB (1:1000) |
| Antibody | Rabbit anti-phospho-4E-BP1 | Cell Signaling Technology | Cat. #: 2855 RRID: AB_560835 | WB (1:1000) |
| Antibody | Rabbit anti-p53 | Cell Signaling Technology | Cat. #: 32532 | WB (1:1000) |
| Antibody | Mouse anti-p53 | Cell Signaling Technology | Cat. #: 2524 | WB (1:1000) |
| Antibody | Rabbit anti-acetyl-Lys379-p53 | Cell Signaling Technology | Cat. #: 2570 RRID: AB_823591 | WB (1:1000) |
| Antibody | Rabbit anti-phospho-Ser392-p53 | Cell Signaling Technology | Cat. #: 9281 RRID: AB_331462 | WB (1:1000) |
| Antibody | Rabbit anti-phospho-Ser15-p53 | Cell Signaling Technology | Cat. #: 9284 RRID: AB_331464 | WB (1:1000) |
| Antibody | Rabbit anti-Mdm2 | R and D Systems | Cat. #: AF1244 RRID: AB_2143538 | WB (1:800) |
| Antibody | Rabbit anti-Galectin-1 | Cell Signaling Technology | Cat. #: 12936 | WB (1:1000) |
| Antibody | Rabbit anti-Caspase-3 | Cell Signaling Technology | Cat. #: 9662 RRID: AB_331439 | WB (1:1000) |
| Antibody | Rabbit anti-CDK4 | Cell Signaling Technology | Cat. #: 12790 RRID: AB_2631166 | WB (1:1000) |
| Antibody | Rabbit anti-CDK7 | Cell Signaling Technology | Cat. #: 2090 RRID: AB_2077140 | WB (1:1000) |
| Antibody | Rabbit anti-phospho-Ser639-RBL2 | Thermo Fisher Scientific | Cat. #: PA564769 RRID: AB_2662148 | WB (1:1000) |
| Antibody | Rabbit anti-RBL2 | Cell Signaling Technology | Cat. #: 13610 | WB (1:1000) |
| Antibody | Rabbit anti-phospho-Ser807/811-Rb | Cell Signaling Technology | Cat. #: 8516 RRID: AB_11178658 | WB (1:1000) |
| Antibody | Rabbit anti-Rb | Cell Signaling Technology | Cat. #: 9313 RRID: AB_1904119 | WB (1:1000) |
| Antibody | Rabbit anti-phospho-Ser345-Chk1 | Cell Signaling Technology | Cat. #: 2348 RRID: AB_331212 | WB (1:1000) |
| Antibody | Mouse anti-Chk1 | Cell Signaling Technology | Cat. #: 2360 RRID: AB_2080320 | WB (1:1000) |
| Antibody | Rabbit anti-phospho-Tyr15-cdc2 | Cell Signaling Technology | Cat. #: 4539 RRID: AB_560953 | WB (1:1000) |
| Antibody | Rabbit anti-cdc2 | Cell Signaling Technology | Cat. #: 77055 RRID: AB_2716331 | WB (1:1000) |
| Antibody | Rabbit anti-phoshpo-Thr199-NPM | Cell Signaling Technology | Cat. #: 3541 RRID: AB_331497 | WB (1:1000) |
| Antibody | Rabbit-anti-NPM | Cell Signaling Technology | Cat. #: 3542 RRID: AB_2155178 | WB (1:1000) |
| Antibody | Mouse anti-GAPDH | Santa Cruz Biotechnology | Cat. #: sc-365062 RRID: AB_10847862 | WB (1:1000) |
| Antibody | HRP conjugated donkey anti-rabbit | Cell Signaling Technology | Cat. #: 7074 RRID: AB_2099233 | WB (1:5000) |
| Antibody | HRP conjugated donkey anti-mouse | Cell Signaling Technology | Cat. #: 7076 RRID: AB_330924 | WB (1:5000) |
| Antibody | HRP conjugated goat anti-rat | Cell Signaling Technology | Cat. #: 7077 RRID: AB_10694715 | WB (1:5000) |
| Antibody | Alexa Fluor 488 donkey anti-mouse | Life Technologies | Cat. #: A-21202 RRID: AB_141607 | IF (1:5000) |
| Antibody | Alexa Fluor 488 goat anti-rat | Life Technologies | Cat. #: A-11006 RRID: AB_2534074 | IF (1:5000) |
| Antibody | Alexa Fluor 594 donkey anti-rabbit | Life Technologies | Cat. #: A-21207 RRID: AB_141637 | IF (1:5000) |
| Antibody | Alexa Fluor 594 donkey anti-mouse | Life Technologies | Cat. #: A-21203 RRID: AB_141633 | IF (1:5000) |
| Commercial assay or kit | Pacific Blue AnnexinV apoptosis detection kit | BioLegend | Cat. #: 640926 | |
| Chemical compound or drug | Etoposide | Cell Signaling Technology | Cat. #: 2200 | |
| Chemical compound or drug | dimethylformamide | Sigma-Aldrich | Cat. #: D4551 | |
| Chemical compound or drug | Cisplatin | Sigma-Aldrich | Cat. #: 479306 | |
| Chemical compound or drug | LLOMe | Sigma-Aldrich | Cat. #: L7393 | |
| Chemical compound or drug | Cycloheximide | Sigma-Aldrich | Cat. #: C1988 | |
| Chemical compound or drug | Nutlin-3 | R and D Systems | Cat. #: 3984 | |
| Chemical compound or drug | Earle’s Balanced Salt Solution | Thermo Fisher Scientific | Cat. #: 14155063 |
Additional files
-
Supplementary file 1
RNA-Seq data displaying differential gene expression from WT versus TFE3/TFEB DKO MEFs exposed to 100 μM etoposide for 8 hr.
- https://doi.org/10.7554/eLife.40856.039
-
Supplementary file 2
RNA-Seq data displaying differential gene expression from WT versus TFE3/TFEB DKO RAW264.
7 cells exposed to 100 μM etoposide for 8 hr.
- https://doi.org/10.7554/eLife.40856.040
-
Supplementary file 3
Expression of genes regulated by the p53-DREAM pathway in WT and TFEB/TFE3 DKO RAW264.
7 cells under control and etoposide-treated conditions.
- https://doi.org/10.7554/eLife.40856.041
-
Supplementary file 4
List of all primers used in this study.
- https://doi.org/10.7554/eLife.40856.042
-
Transparent reporting form
- https://doi.org/10.7554/eLife.40856.043
Download links
A two-part list of links to download the article, or parts of the article, in various formats.
Downloads (link to download the article as PDF)
Open citations (links to open the citations from this article in various online reference manager services)
Cite this article (links to download the citations from this article in formats compatible with various reference manager tools)
The transcription factors TFE3 and TFEB amplify p53 dependent transcriptional programs in response to DNA damage
eLife 7:e40856.
https://doi.org/10.7554/eLife.40856


