Attention periodically samples competing stimuli during binocular rivalry
- Monash University, Australia
- The University of Sydney, Australia
- University of Canberra, Australia
Figures
Figure 1
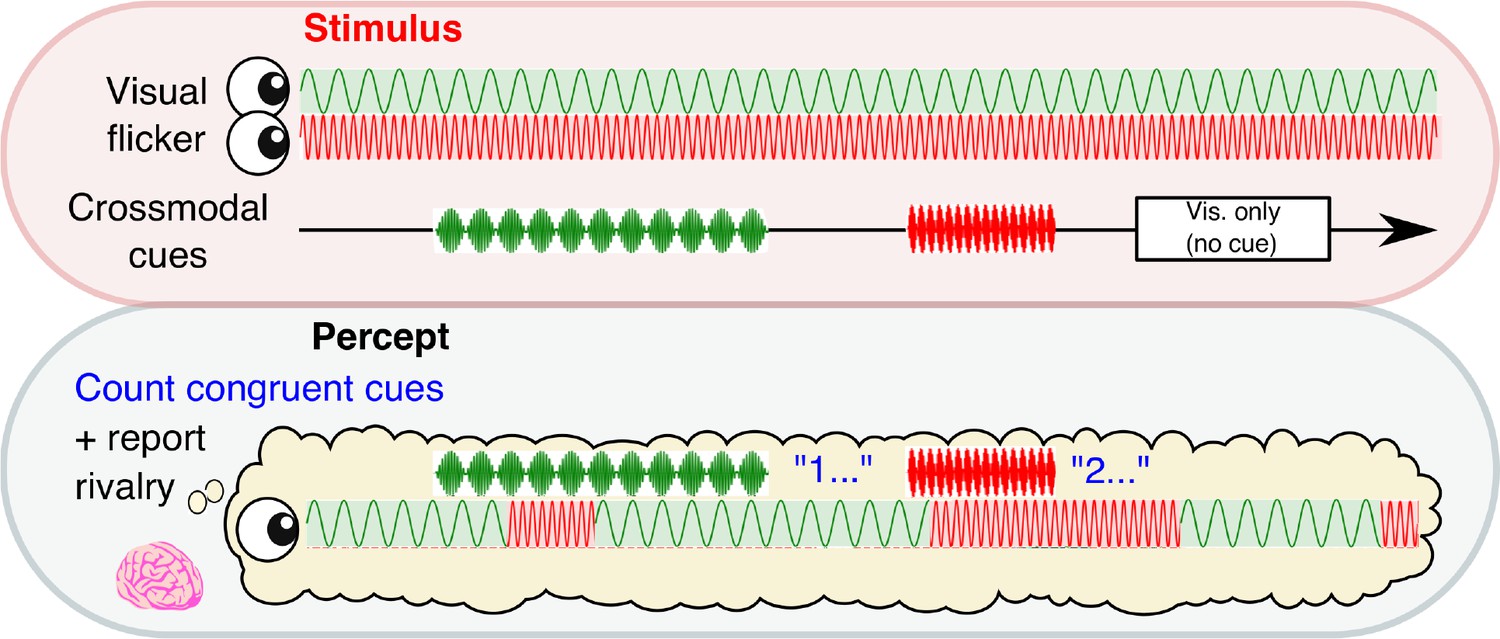
Experimental paradigm.
A schematic time course showing stimulus presentation and reported visual percept. Each eye was presented with a 4.5 or 20 Hz sinusoidal flicker throughout 3 min blocks. Subjects reported their perceptual state through button-press. Crossmodal cues (also 4.5 or 20 Hz; 2, 3.1 or 4 s in duration) or visual-only periods (2.6 s in duration) were separated by inter-stimulus intervals of 7–10 s.
Figure 2 with 2 supplements

Behavioral results.
(a) Button-press data, aligned at cue onset, were averaged over all crossmodal cue and visual-only periods per subject, then averaged over subjects for each cue condition. Y-axis represents the proportion of button-presses reporting congruent crossmodal and visual flicker at each time point, sampled at 60 Hz (or every 16.7 ms). Colored lines and their shading show mean ± 1 standard error across 34 subjects during attended and ignored cues (thick and thin lines) for low- and high-frequency (green and red colors). Black lines represent the equivalent probability for visual-only periods, serving as baseline (Materials and methods). Asterisks indicate a significant difference between cues at each time point (repeated-measures ANOVA followed by planned comparisons). We use FDR q = 0.05 for the statistical threshold unless noted otherwise. (b) Crossmodal effects are mediated by task-relevant attention. Our measure of crossmodal effects, the perceptual switch index (PSI, y-axis), is defined as the mean difference for the probability of seeing congruent flicker during 1–4 s after the cue onset for attended-low-frequency cues (thick green in panel a) compared to other cue types. Attention-task performance (x-axis) is the correlation coefficient between the reported and actual congruent stimuli when comparing between rivalry percepts and crossmodal cues at offset (See Materials and methods for details). The across-subject correlation between the two variables was strong (r(32) = .46, p = 0.006, two-tailed), demonstrating the crossmodal effects were strongly dependent on performance during the attention task. (c) and (d) Button-press data aligned at cue onset, with lines and shading as in panel (a). Y-axis showing the proportion of button-presses reporting the mismatched flicker at each time point, after (c) visual-crossmodal mismatch, or (d) visual-crossmodal match at cue onset. Only the data of the attended low-frequency condition differed significantly from visual-only periods.
-
Figure 2—source data 1
Attended low-frequency cues alter rivalry dynamics.
- https://doi.org/10.7554/eLife.40868.008
Figure 2—figure supplement 1
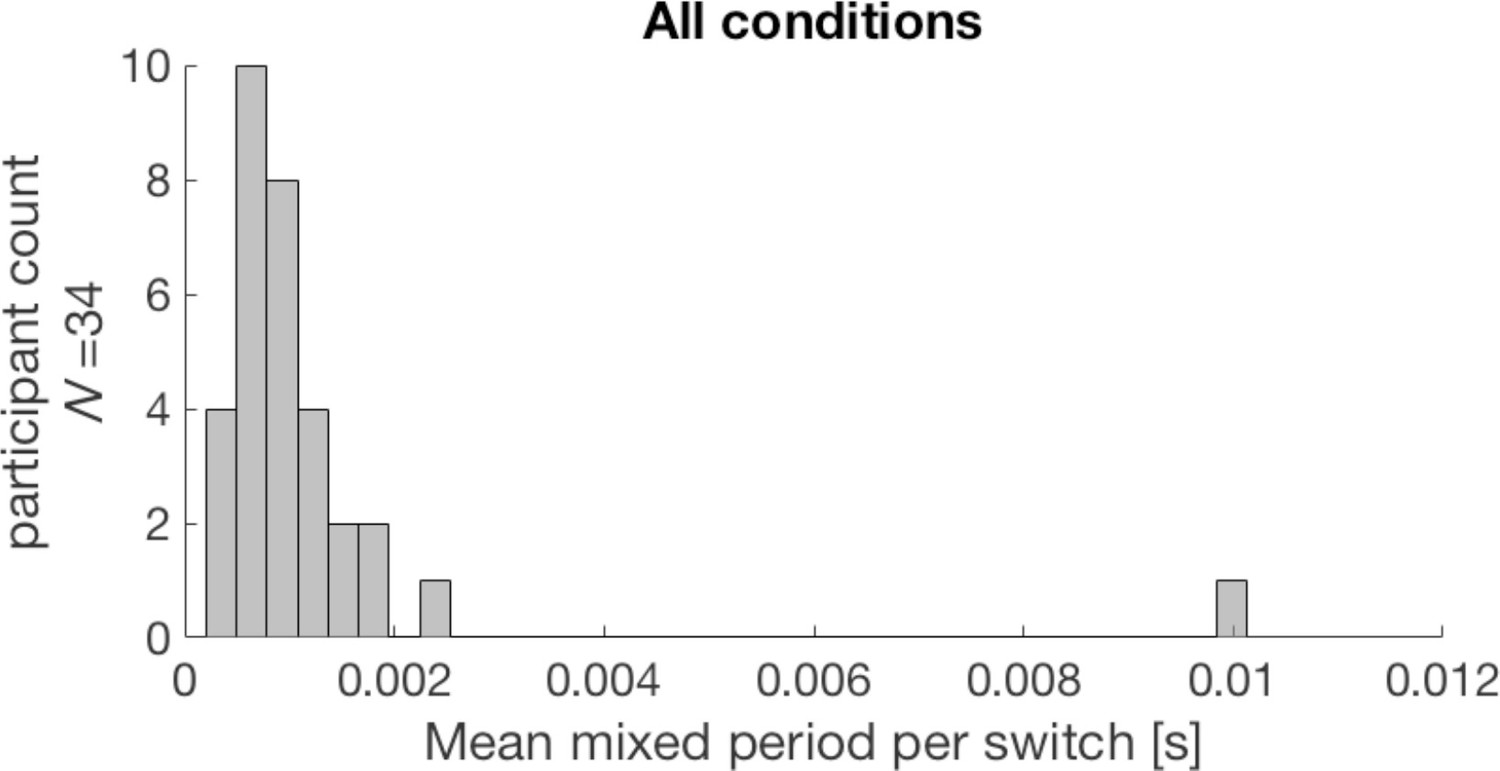
Across all experimental periods, the average duration of mixed periods per switch per subject was less than 16.7 ms (our binning width), thus showing that mixed percepts are unlikely to have contributed to an increase in the variance of perceptual report timing.
Switches happened instantly, with zero or one mixed frame (16.7 ms) on average.
-
Figure 2—figure supplement 1—source data 1
Mean mixed periods per switch per participant.
- https://doi.org/10.7554/eLife.40868.005
Figure 2—figure supplement 2
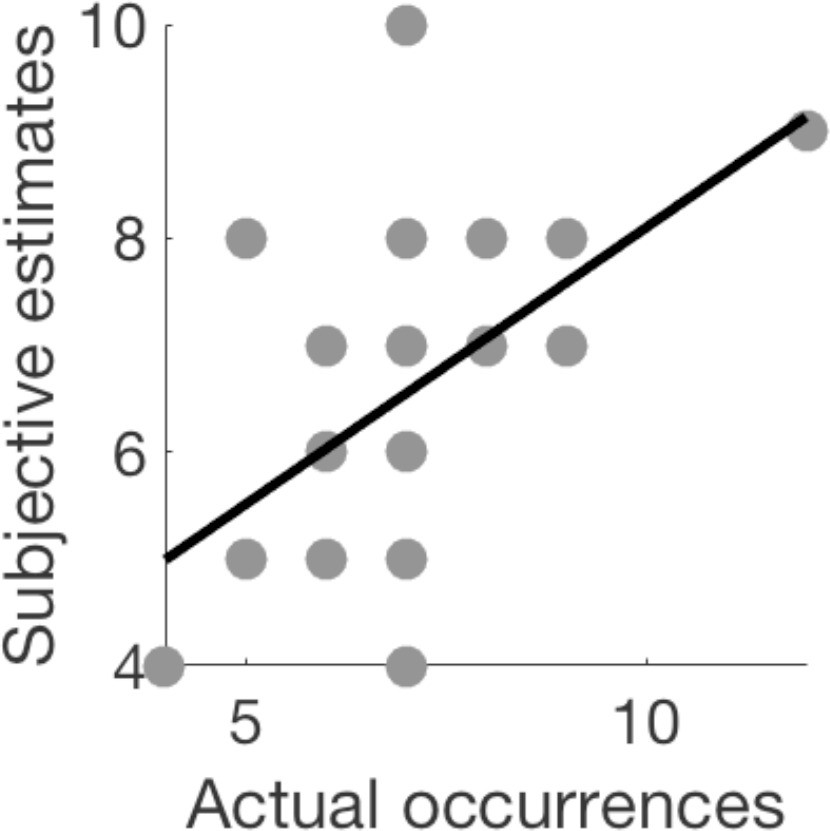
Definition of ‘attention to cues’ in Figure 1c.
Y- and x-axes of this figure are the subjective and actual congruent crossmodal and visual stimuli in the attended sessions from one exemplary subject. We defined the correlation coefficient between the two (here, r = 0.55) as the ‘attention to cue’ index used as x-axis in Figure 1c.
-
Figure 2—figure supplement 2—source data 1
Examplary subject 'attention to cues'.
- https://doi.org/10.7554/eLife.40868.007
Figure 3 with 3 supplements
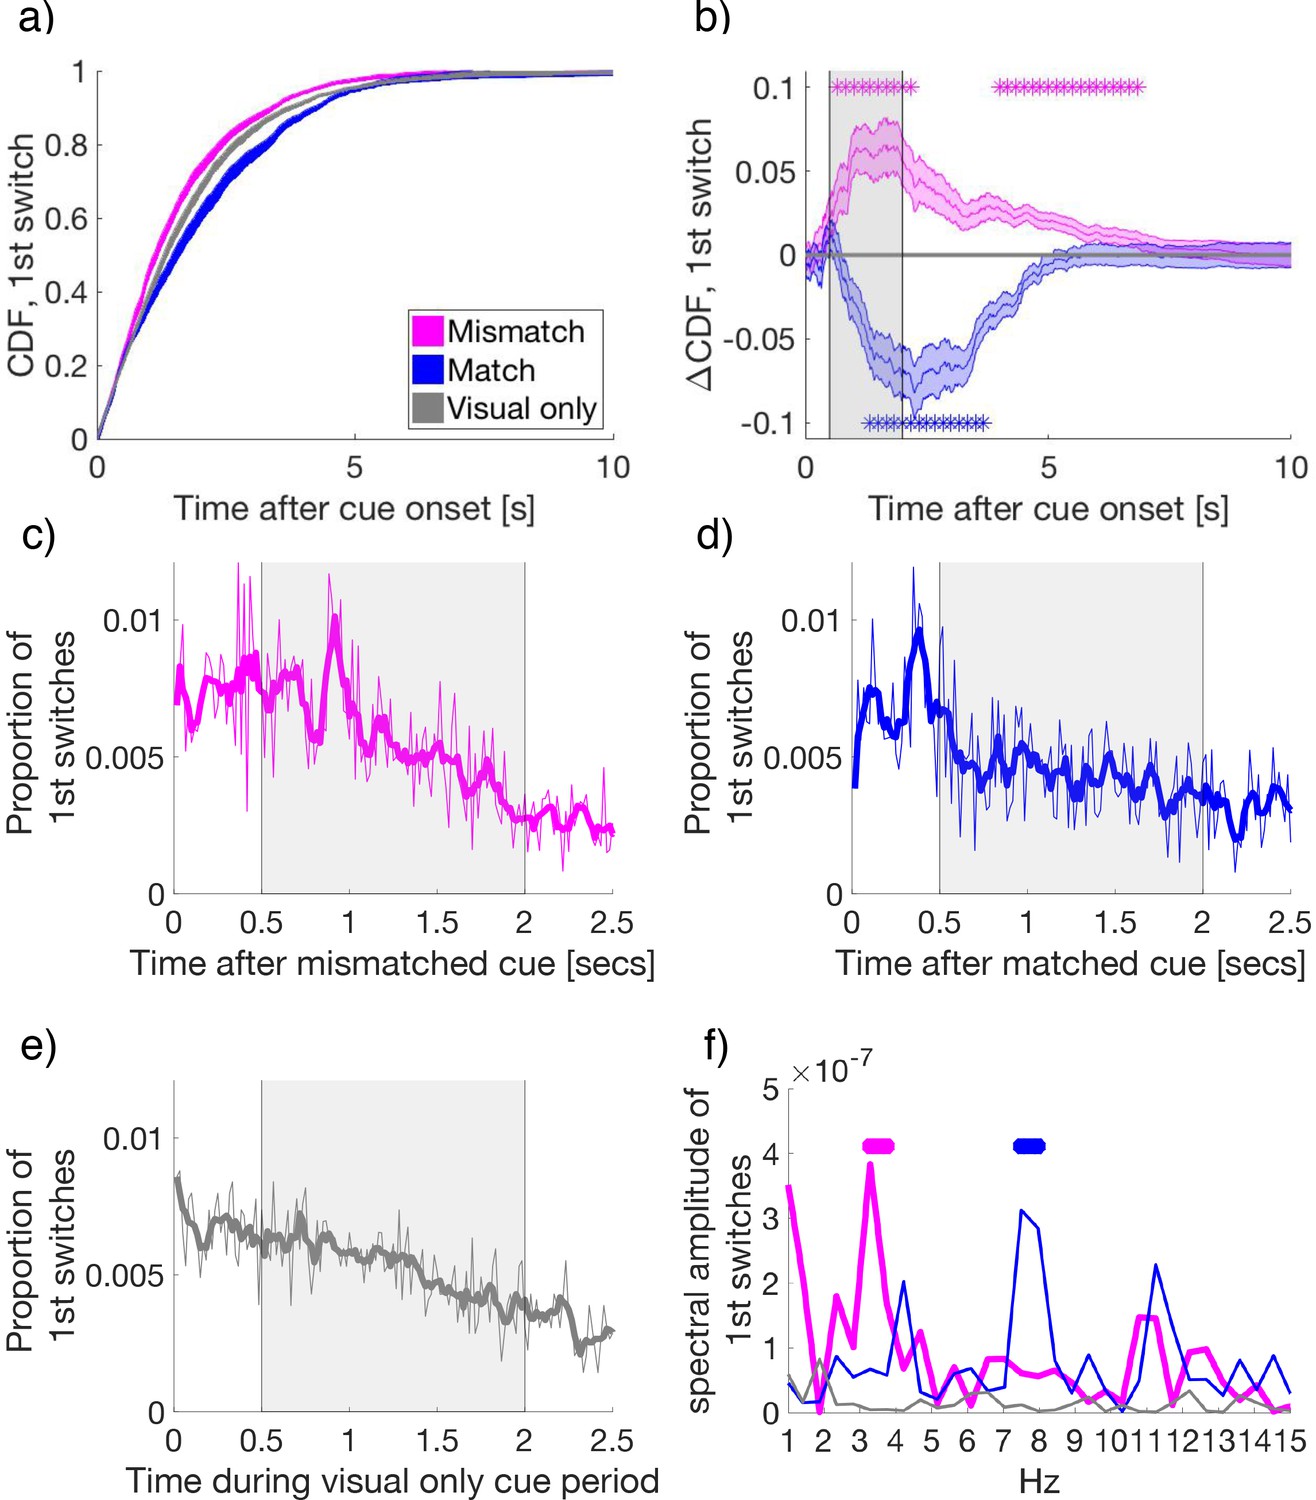
Binocular rivalry dynamics during mismatched and matched cues.
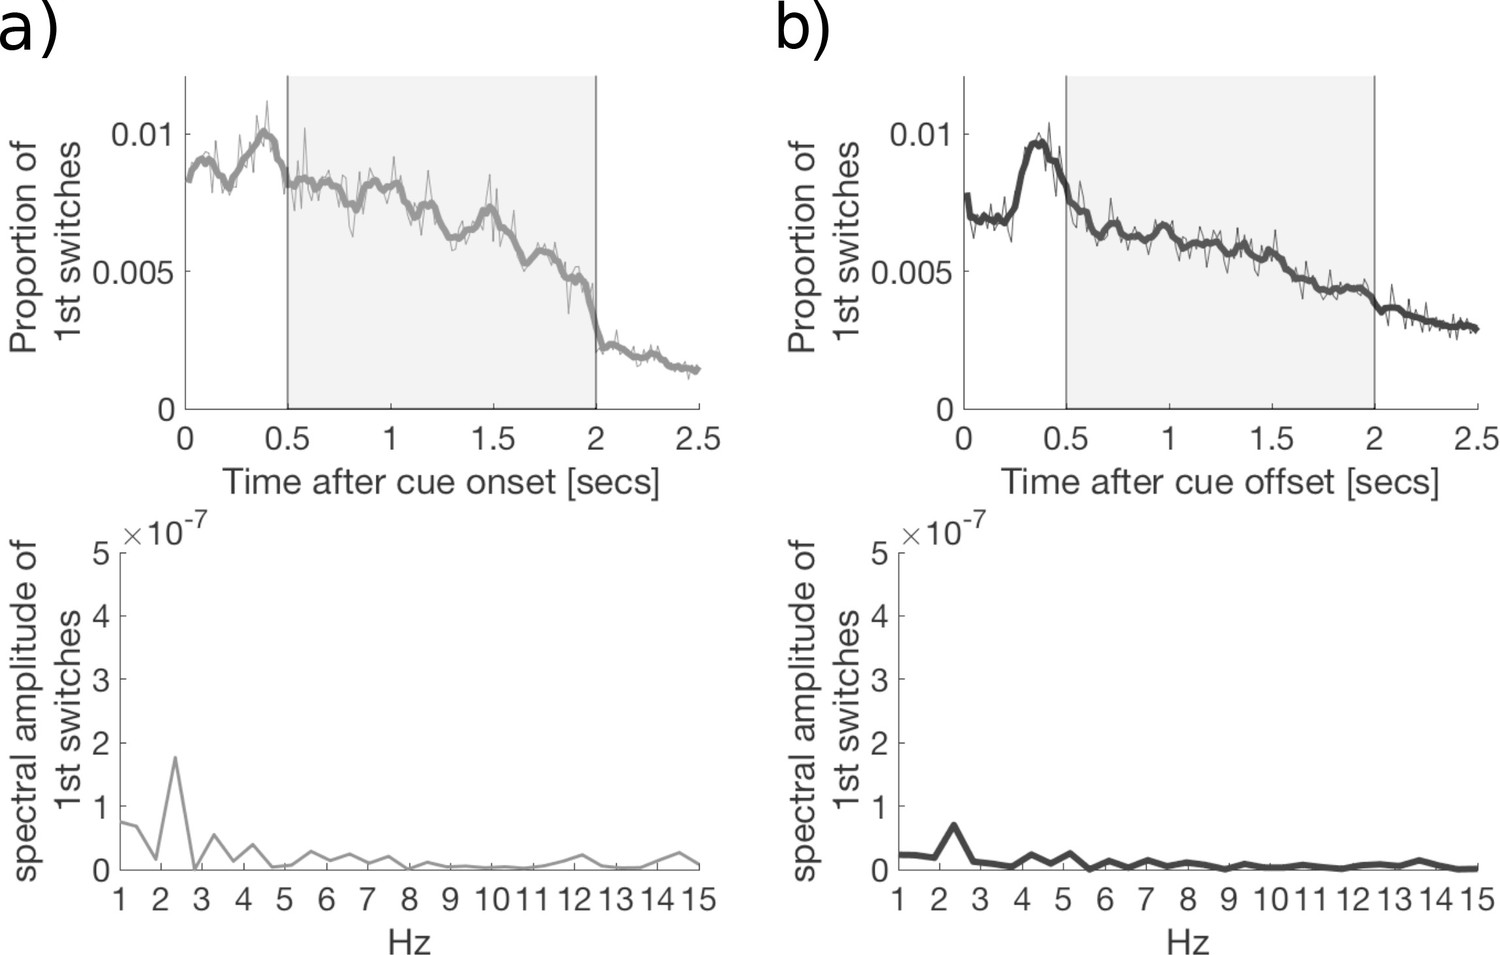
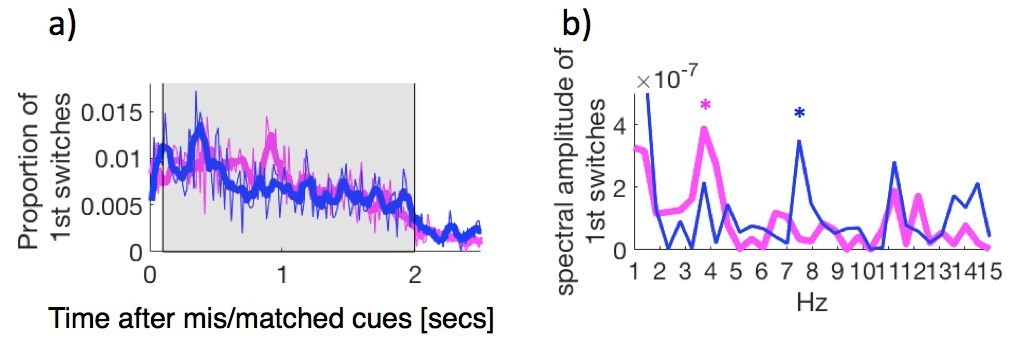
(a) The cumulative density function (CDF) of the time to first-switch. Mismatched, matched, and visual-only conditions are colored in magenta, blue, and grey in all panels a–f. Lines and shading show mean and standard error across subjects (N = 34) for a and b. (b) The difference in CDFs between conditions. Asterisks mark statistical significance (paired-samples t-tests) comparing mismatched or matched cues to visual-only periods. FDR q = 0.05. (c–e) The time course of the proportion of first switches made after cue onset in (c) mismatched, (d) matched, and (e) visual-only conditions. Thin lines show the mean proportion of first-switches, binned in 16.7 ms increments and averaged across subjects. Thick lines show the smoothed data for visualization. Grey-shaded regions show the time window used for spectral analysis in (f). (f) The amplitude spectra for the time course of switches in conditions in (c-e). Asterisks indicate significant clusters (at least two neighboring frequency bins) after permutation and cluster-based corrections for multiple comparisons (see Materials and methods). The permuted null distribution and critical value for the identified clusters in f) are shown in Figure 3—figure supplement 2.
-
Figure 3—source data 1
Source data for FIgure 3
- https://doi.org/10.7554/eLife.40868.013
Figure 3—figure supplement 1
First switches for any cues, and outside of cue periods.
The time course of the proportion of first switches made at each time point; following any crossmodal cue onset (a), and following crossmodal cue offset (b). An analysis of the time-course of perceptual switches reveals no significant spectral peaks at 3.5 or 8 Hz. Y-axis scaled as per Figure 3f. The presence of an early peak (0–0.5 s) in the proportion of first switches suggests that these changes may be due to stimulus transients, rather than the cue-conditional allocation of attention. As such this early time-window was omitted from subsequent analysis.
Figure 3—figure supplement 2
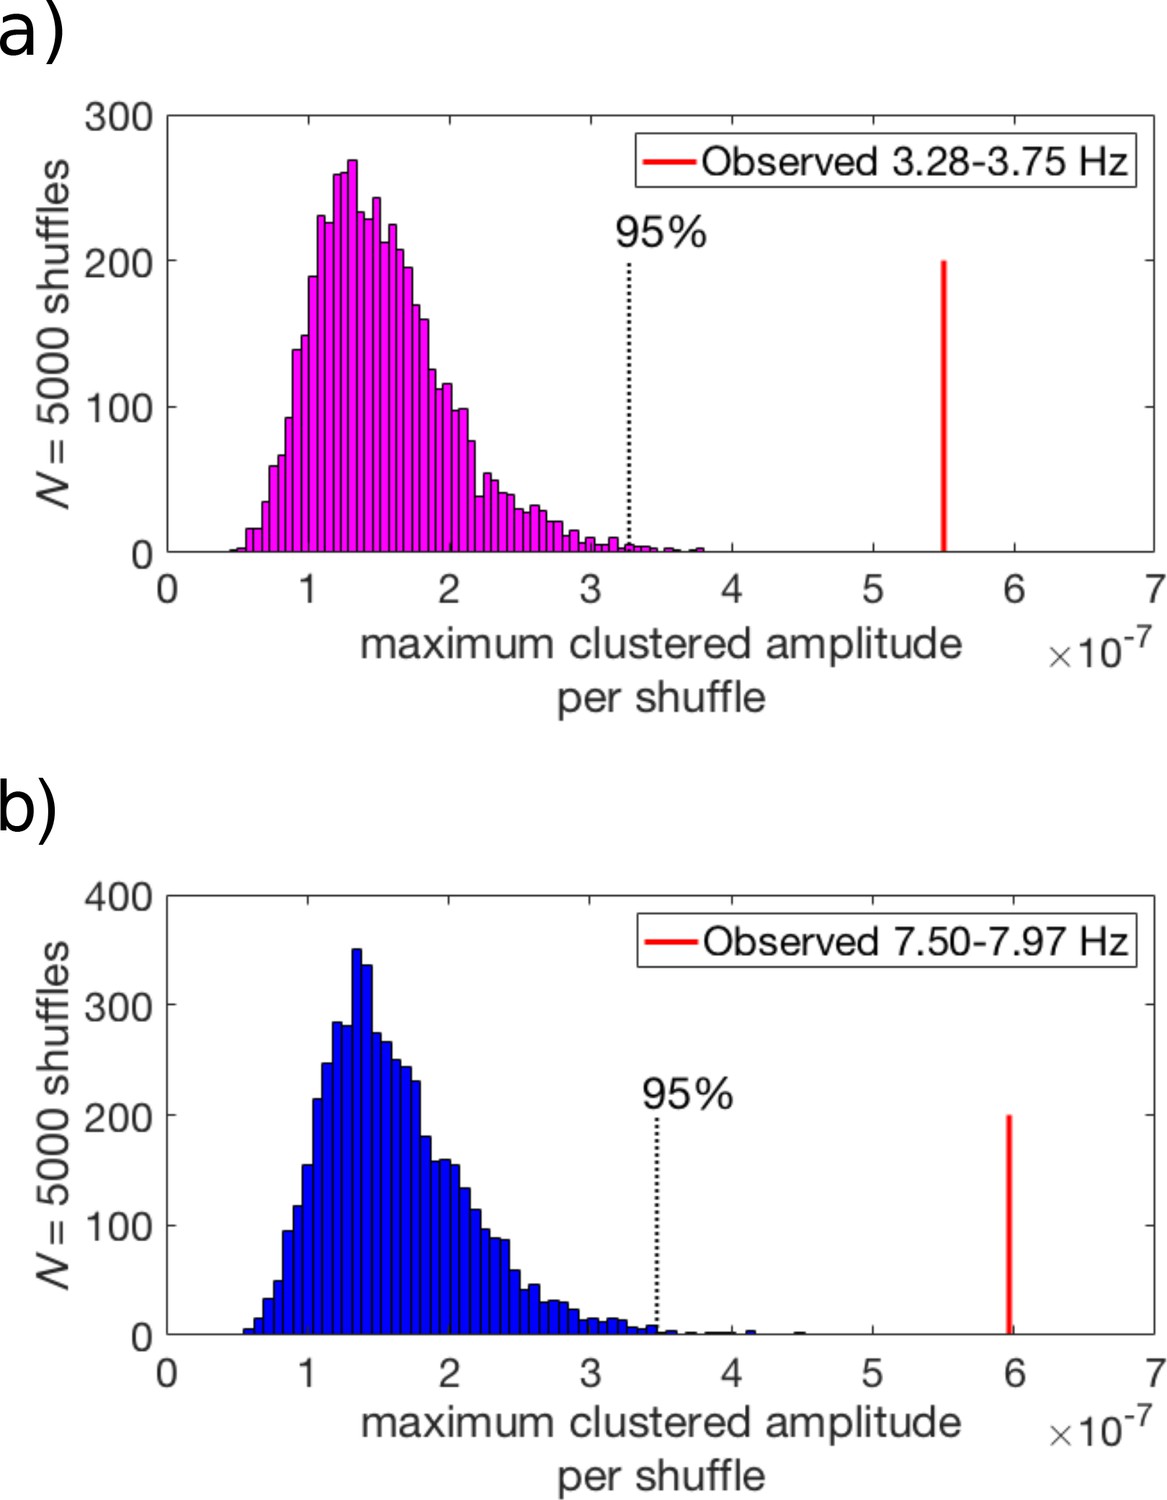
The null-distributions for the surrogate datasets generated by the randomization procedure, and the actually observed values of second-stage statistics (i.e., maximum and its highest neighbor’s summed Fourier amplitude).
After satisfying first-level criteria (p<0.005 uncorrected for two neighboring frequencies), we proceeded to this second-stage statistical test. The observed second-stage statistics (red line) were regarded as significant after cluster corrections for multiple comparisons at p<0.05 level; exceeding the top 95% of the null distribution.
Figure 3—figure supplement 3
Cumulative Density Functions for remaing crossmodal cue types
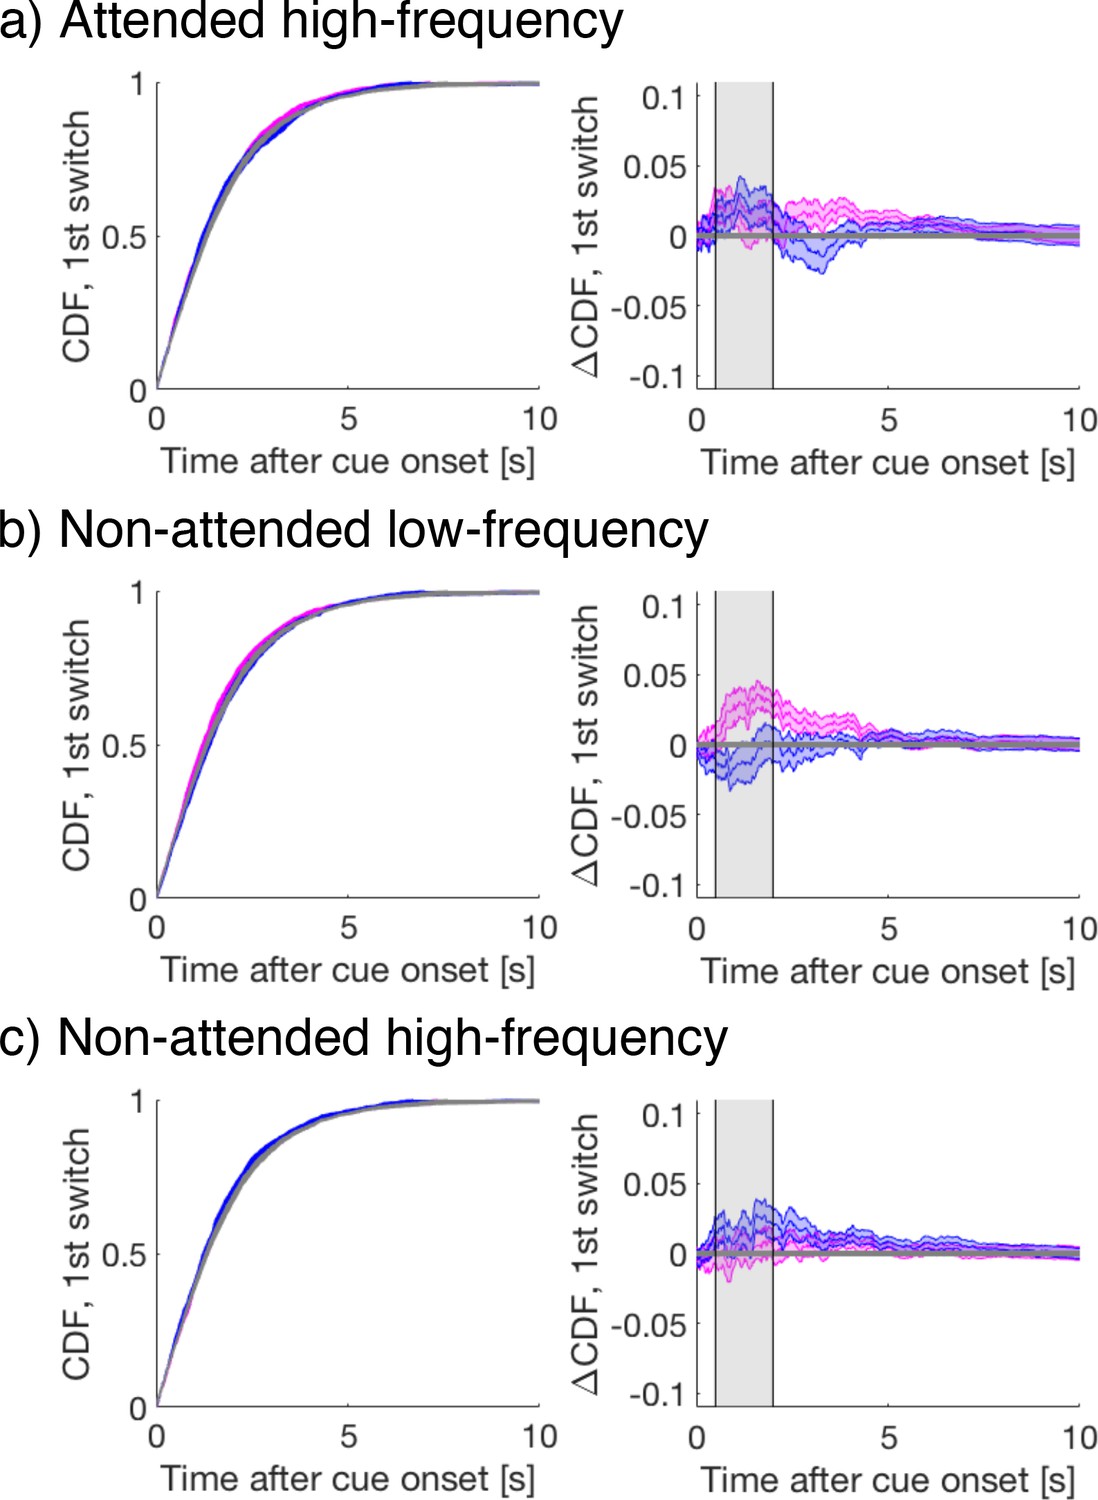
Left column) The cumulative density function (CDF) of the time to first-switch for all conditions other than attended low-frequency. Mismatched, matched, and visual-only conditions are colored in magenta, blue, and grey in all panels. Lines and shading show mean and standard error across subjects (N = 34). Right column) the difference in CDF between conditions, each of which failed to exhibit any significant crossmodal effects on perceptual switches compared to visual-only periods (FDR q = 0.05). Thus, we did not pursue further spectral or neural analyses of these conditions.
Figure 4 with 1 supplement
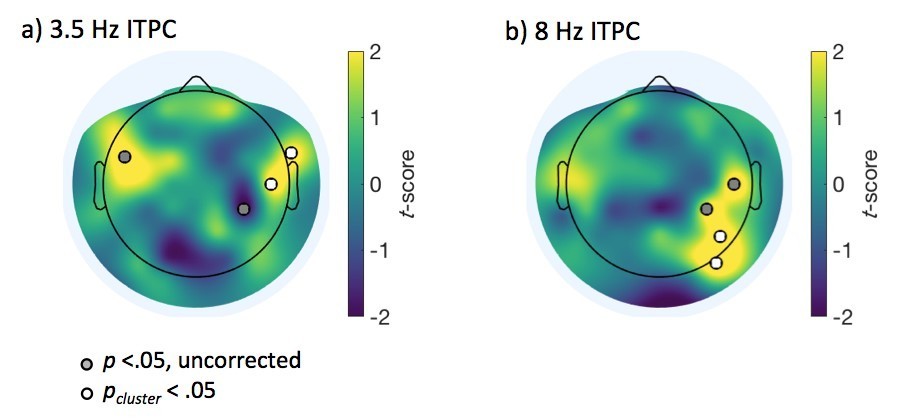
Evoked ITPC at 3.5 Hz mediates the probability of switches during mismatched and matched cues.
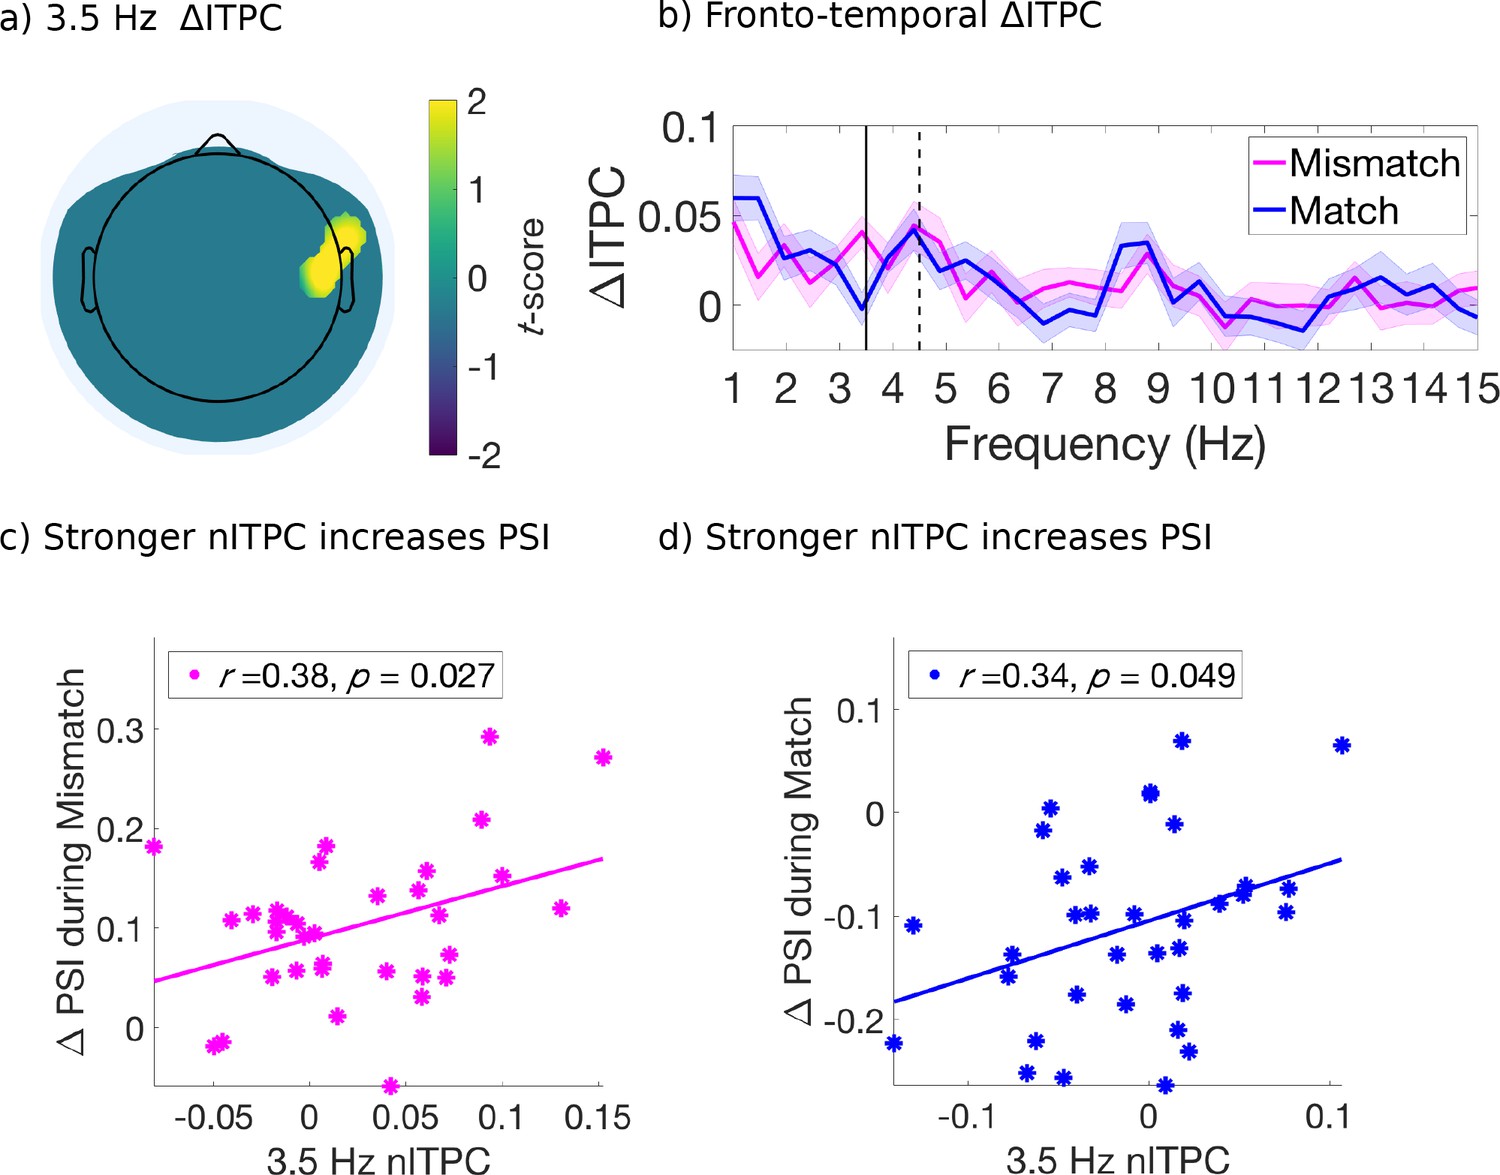
(a) Significant differences in evoked ITPC between mismatched and matched cue conditions (multiple comparisons corrected using a cluster-based criterion; Materials and methods). Non-significant electrodes after spatial-cluster-based corrections are masked. (b) Evoked ITPC spectra at significant regions in (a). The magenta and blue lines and their shading show mean ±1 standard error of the mean across 34 subjects for mismatched and matched cues, respectively. Solid and dotted vertical black lines mark the behaviorally observed attentional sampling frequency at 3.5 Hz, stimulus frequency at 4.5 Hz respectively. (c, d): Stronger 3.5 Hz nITPC correlates with increased PSI during (c) mismatched and (d) matched conditions. The x and y-axes represent the normalized ITPC and perceptual switch index, respectively (see text for definitions). Straight lines represent least-squares regression predicting PSI from nITPC.
-
Figure 4—source data 1
Source data for Figure 4.
- https://doi.org/10.7554/eLife.40868.017
Figure 4—figure supplement 1
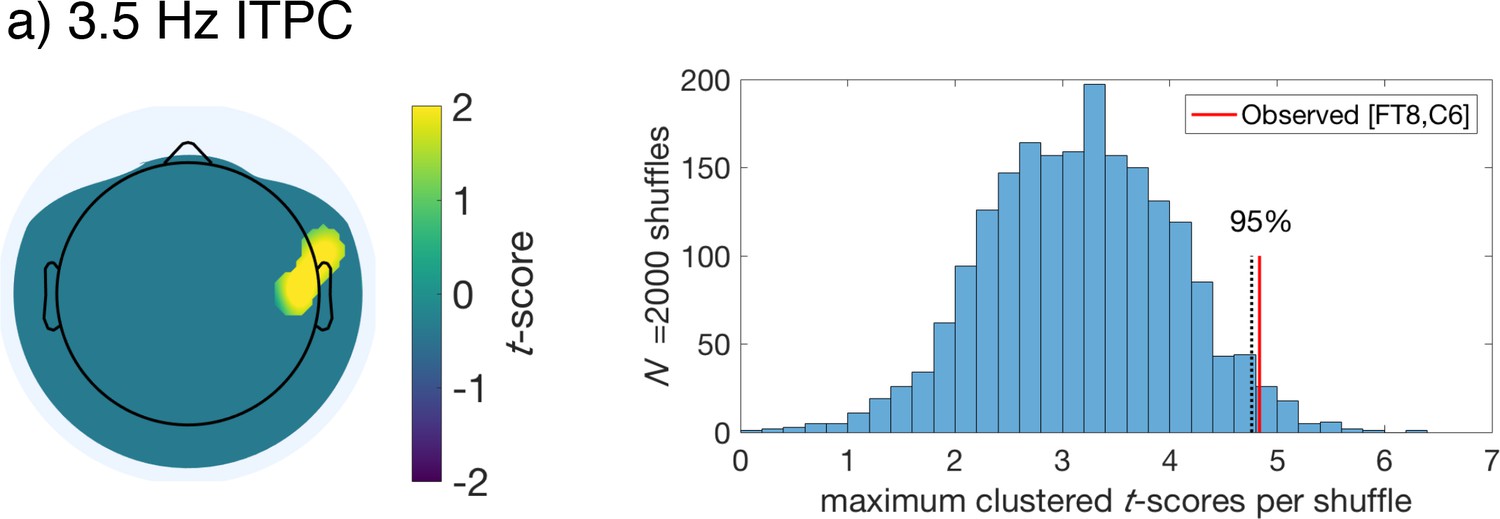
Displayed are the regions selected for correlation analysis after satisfying our two-stage statistical tests on evoked ITPC, comparing mismatched and matched conditions at 3.5 Hz.
The right panels display the resulting null distributions obtained after the permutation of condition labels (mismatched vs matched) and performing t-tests across subjects on the mean evoked ITPC for each electrode after upsampling (see Materials and methods). The maximum clustered t-scores per shuffle were retained to create the null distributions. The observed sum of t-scores is displayed as a vertical red line, while the top 95% of the distribution is marked with a vertical dotted back line.
-
Figure 4—figure supplement 1—source data 1
Source data for Figure 4—figure supplement 1.
- https://doi.org/10.7554/eLife.40868.016
Figure 5 with 1 supplement
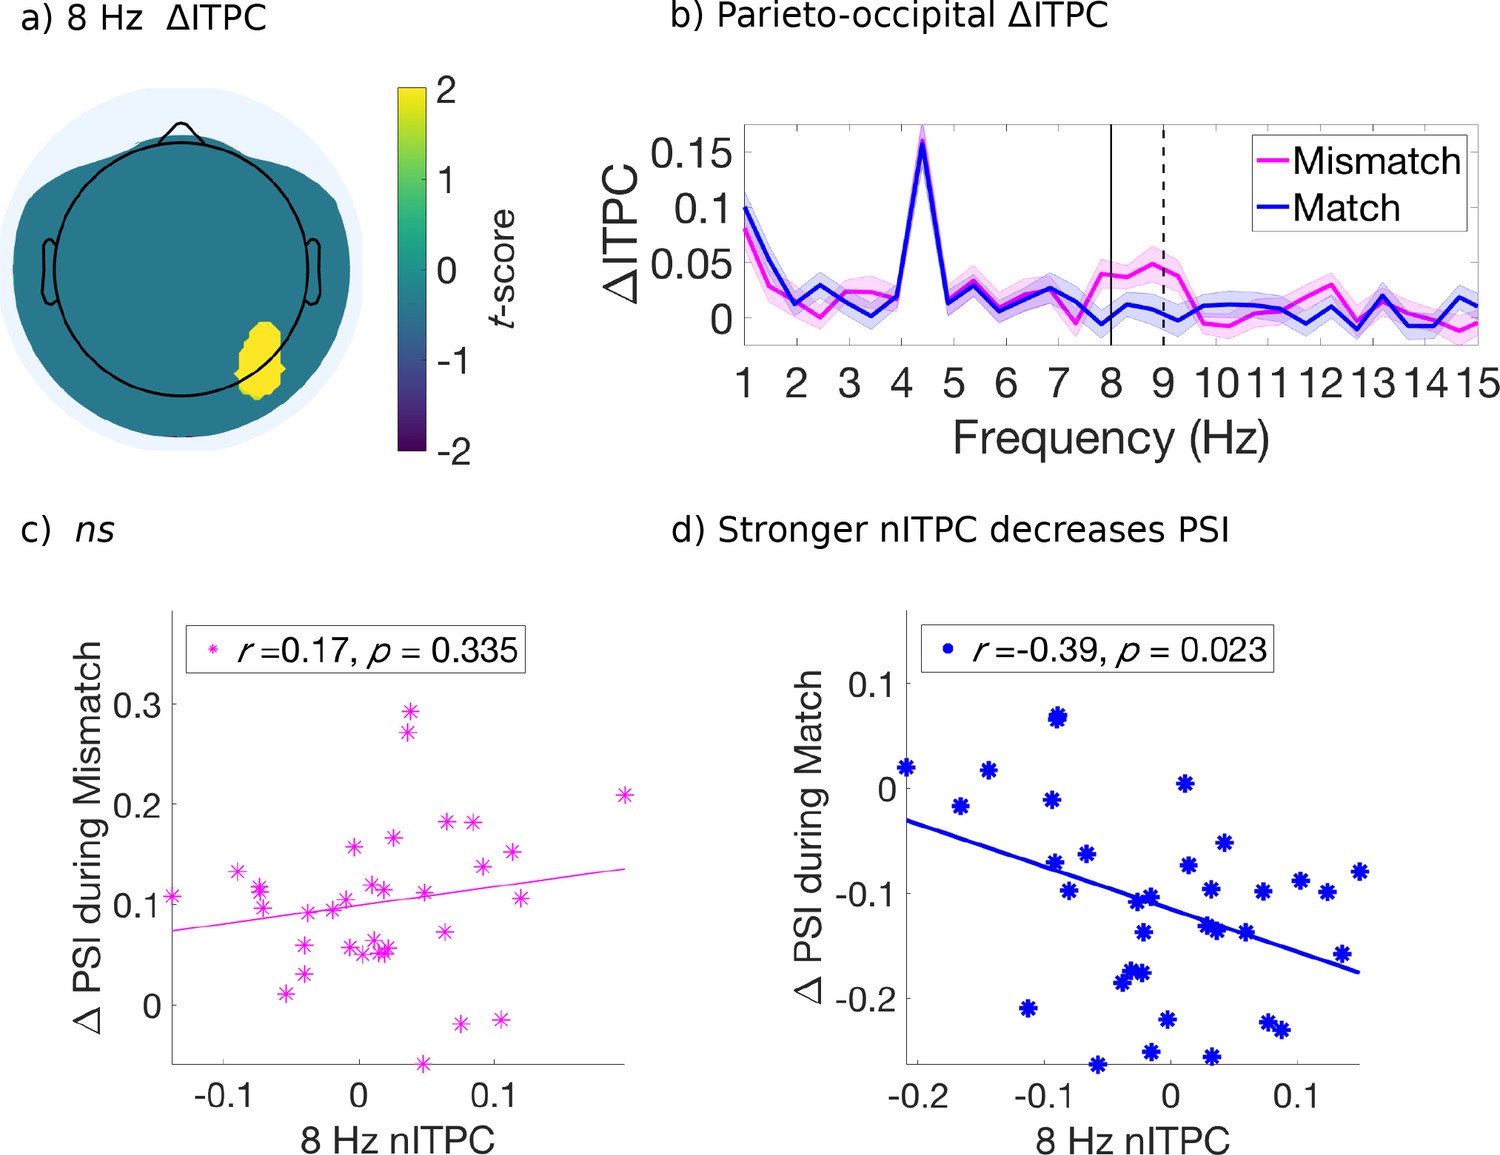
Evoked ITPC at 8 Hz mediates the probability of switches during matched cues only.
(a) Significant differences in evoked ITPC between mismatched and matched cue conditions (multiple comparisons corrected using a cluster-based criterion; Methods). Non-significant electrodes after spatial-cluster-based corrections are masked. (b) Evoked ITPC spectra at significant regions in (a). The magenta and blue lines and their shading show mean ±1 standard error of the mean across 34 subjects for mismatched and matched cues, respectively. Solid and dotted vertical black lines mark in (b) the 8 Hz sampling frequency observed behaviorally and stimulus harmonic, respectively. (c,d): Stronger 8 Hz nITPC correlates with a decreased PSI for (d) matched, but not the (c) mismatched condition. The x and y-axes represent the normalized ITPC and perceptual switch index, respectively (see text for definitions). Straight lines represent least-squares regression predicting PSI from nITPC.
-
Figure 5—source data 1
Source data for Figure 5.
- https://doi.org/10.7554/eLife.40868.021
Figure 5—figure supplement 1
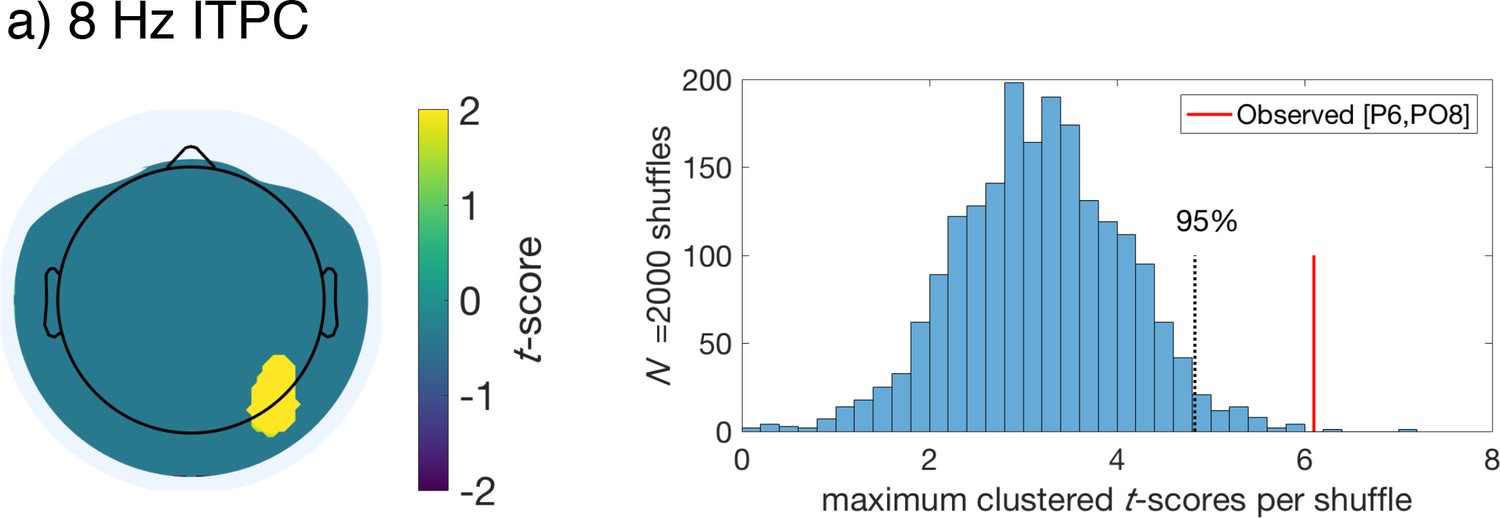
Displayed are the regions selected for correlation analysis after satisfying our two-stage statistical tests on evoked ITPC, comparing mismatched and matched conditions at 8 Hz.
All conventions as in Figure 4—figure supplement 1.
-
Figure 5—figure supplement 1—source data 1
Source data for Figure 5—figure supplement 1.
- https://doi.org/10.7554/eLife.40868.020
Figure 6
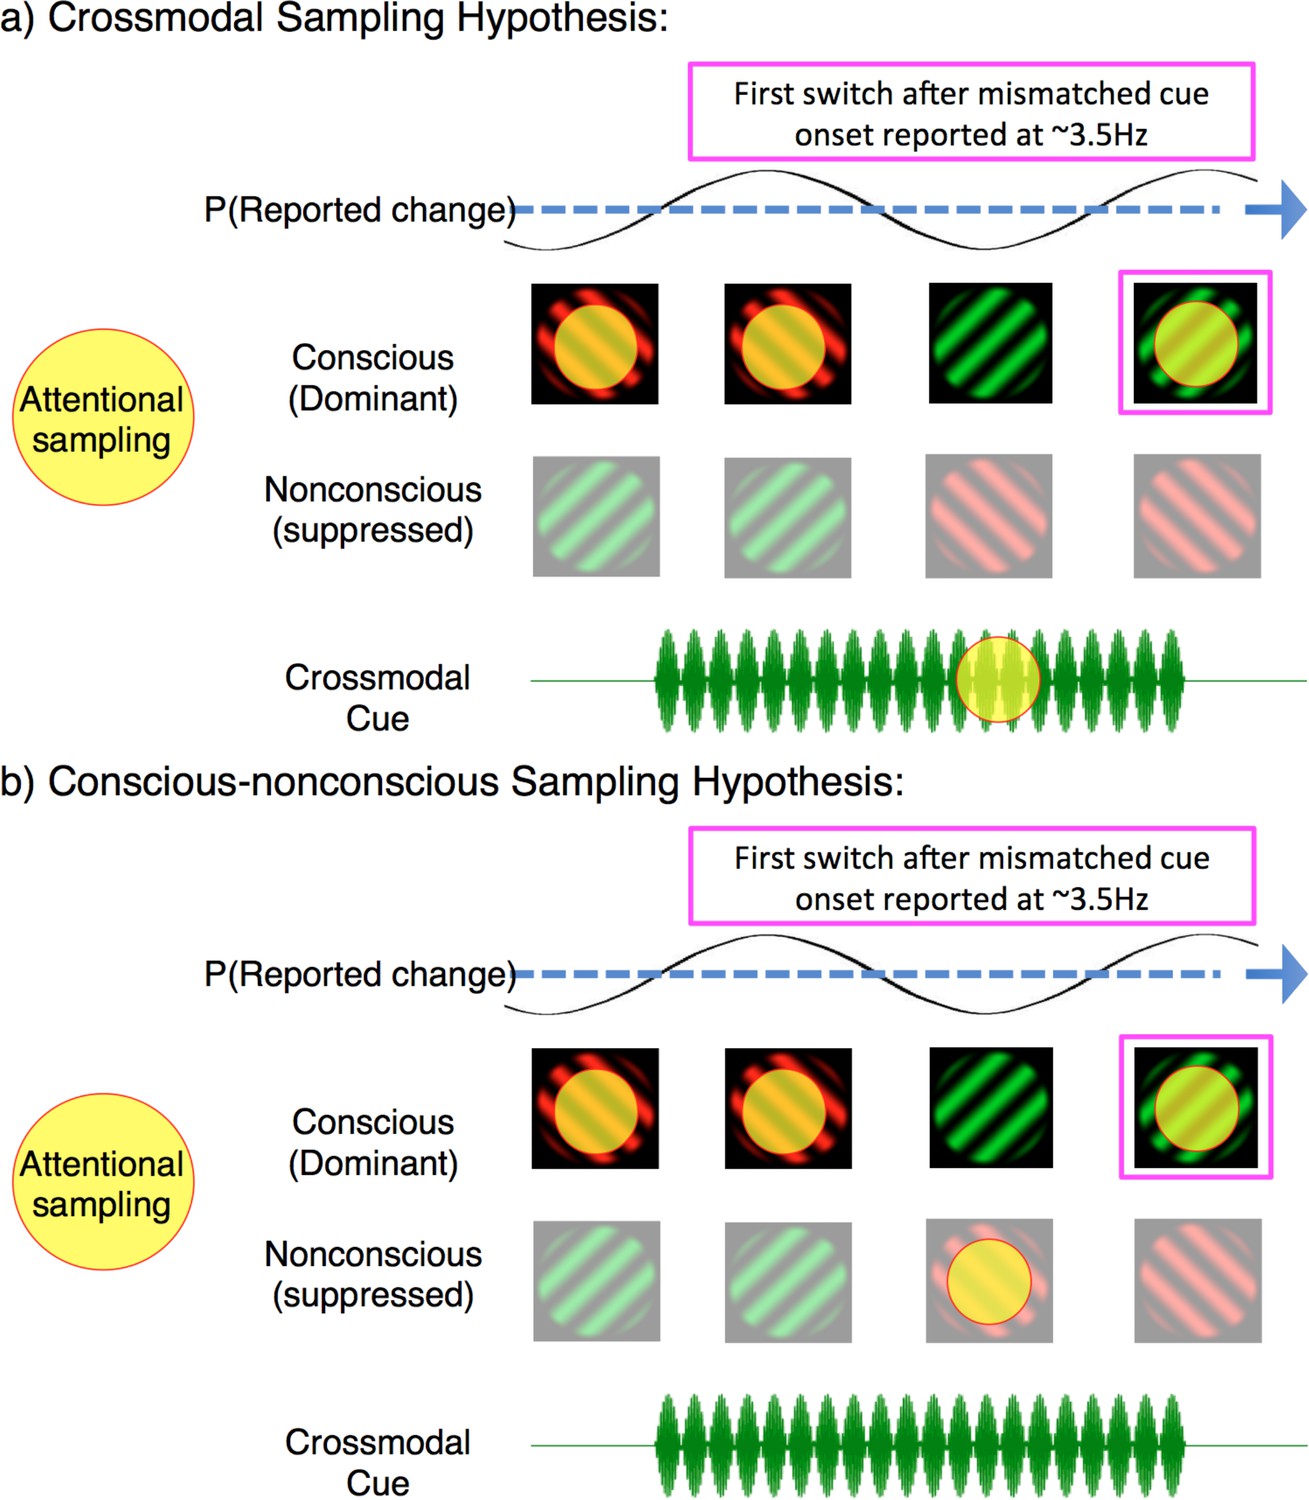
Two possible interpretations of attentional sampling during mismatched crossmodal cues. Schematic representation of attentional sampling and perceptual oscillations during binocular rivalry.
(a) Crossmodal sampling hypothesis: While perceiving the high-frequency visual flicker, an attended low-frequency crossmodal cue mobilises attention to sample between the dominant image and mismatched crossmodal cue at ~3.5 Hz. As a consequence, the likelihood of the first perceptual switch is modulated at ~3.5 Hz. (b) Conscious-nonconscious sampling hypothesis: The onset of a mismatched cue prompts attention to sample between separate visual features, which in our paradigm consists of dominant and suppressed visual images. We do not suggest that these are the only mechanisms of attentional sampling during binocular rivalry, and only illustrate the interpretations discussed.
Author response image 1
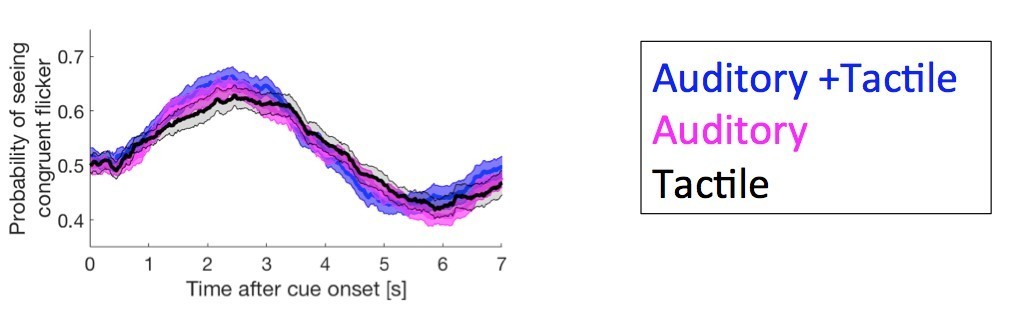
The effect of crossmodal cue modality on behavioural switch dynamics.
Crossmodal cue modalities are shown for auditory cues in magenta, tactile cues in black and auditory plus tactile in blue. The probability of perceiving congruent flicker during attended low-frequency cues (related to manuscript Figure 2A). No significant difference between cue modalities emerged when comparing the time-course of this effect (repeated measures ANOVA at each time-point followed by FDR correction for multiple comparisons).
Author response image 2

Changes in frequency-tagged power (in the unit of signal to noise ratio, log SNR) around the time of button presses for perceptual switches.
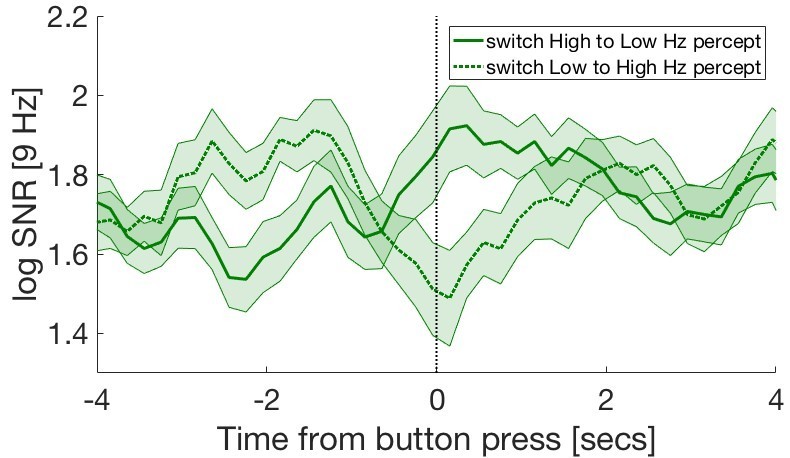
(a) In visual-only conditions, around the time of button presses, the time course of the power of EEG at the occipital areas (electrode P08) at 4.5 Hz tracks perceptual alternations, consistent with previous investigations using frequency-tagged binocular rivalry. For each subject, we computed the mean across trials, then took the average across subjects, with the error bars reflecting the standard error across subjects. The solid line is for the mean across the trials with perceptual changes from high-frequency (20 Hz) flicker to low-frequency (4.5 Hz) flicker. The dotted line is for the opposite direction (perception changing from low to high flicker). b) Comparison between the visual-only and crossmodal conditions in perceptual-switch related EEG power, but here only focusing on the trials when percepts change from a high flicker to low flicker. In crossmodal conditions, where low-frequency (4.5Hz) auditory and/or tactile stimuli were delivered to subjects, log SNR for 4.5 Hz increased compared to the perceptual switches that happened when no crossmodal stimuli were presented. Here we only used the segment around the first perceptual switch after the onset of crossmodal cue.
Author response image 3
Adjusting the window for spectral analysis, from 0.5 to 2 seconds, to 0.1 to 2 seconds, produces equivalent results, with significant attentional sampling frequencies ~3.5 and 7-8 Hz.
https://doi.org/10.7554/eLife.40868.027
Author response image 4
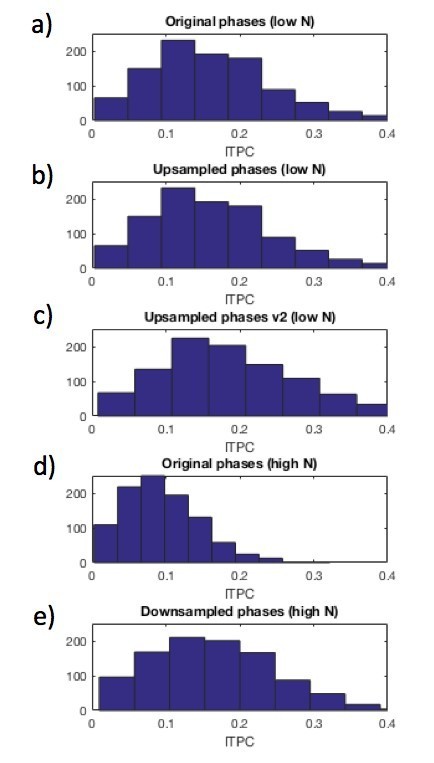
Results from Matlab code comparing downsampling and upsampling measures on ITPC bias.
The critical comparisons are between 4A and 4C, and 4D and 4E. Compared to the original ITPC values with a low trial count (4A), upsampling introduces a minimal bias (4C). Compared to original ITPC values with a high trial count (4D) downsampling introduces a large bias (4E).
Author response image 5
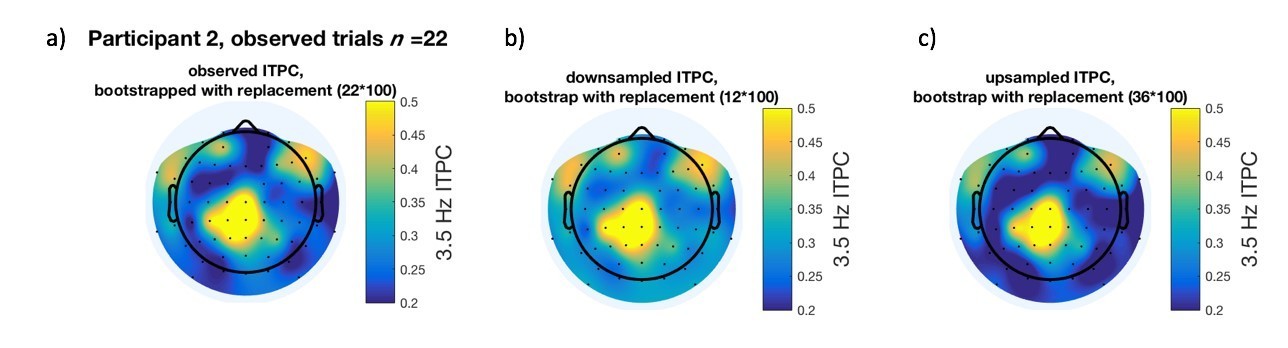
Subject level 3.5 Hz ITPC after bootstrapping with replacement for attended low-frequency auditory and tactile cues.
(a) The observed topographic ITPC after bootstrapping with replacement using the observed number of trials for this subject and cue-type (n = 22, bootstrapped 100 times). b and c) Topographic ITPC b) with downsampling (12 trials) and bootstrapping with replacement and c) with upsampling (36 trials) and bootstrapping with replacement.
Author response image 6
Alternate display of topoplots in manuscript Figures 4 and 5.
At the first stage of analysis, electrodes which are significant at p <.05 uncorrected were identified (shown in grey). Those which survived our spatial cluster-based criterion to account for multiple comparisons across electrodes are shown in white.
Author response image 7
Frequency-tagged changes during binocular rivalry at PO8.
SNR at 9 Hz during visual-only conditions tracks the contents of consciousness during a change to the low-frequency (4.5 Hz) percept.
Author response image 8
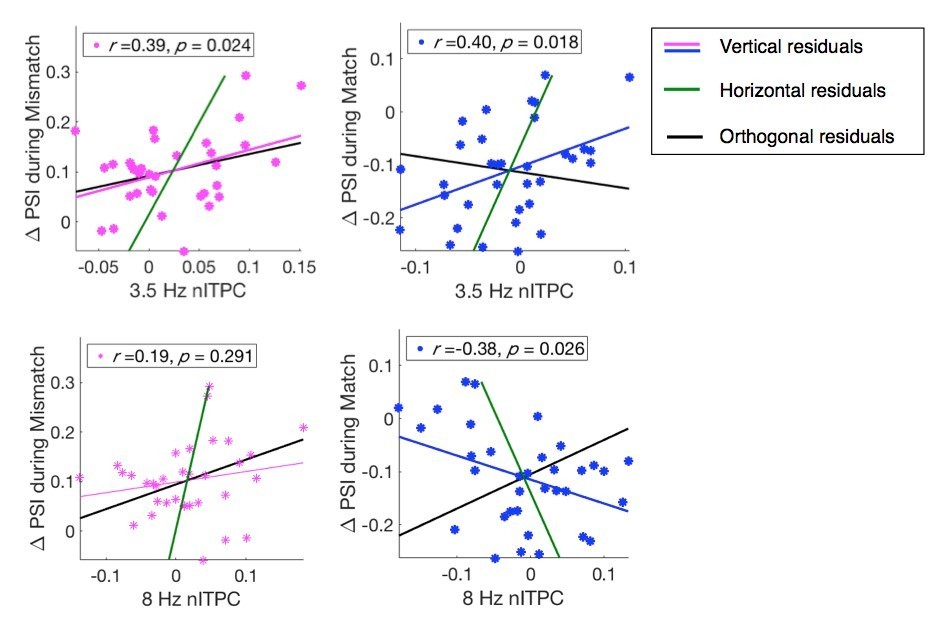
Differentiation between Deming (orthogonal) regression and linear least-squares regression for our critical comparisons, related to manuscript Figures 4 and 5.
In all panels, Deming regression lines are plotted in black. Regression lines for horizontal residuals are displayed in green.
Additional files
-
Transparent reporting form
- https://doi.org/10.7554/eLife.40868.023
Download links
A two-part list of links to download the article, or parts of the article, in various formats.
Downloads (link to download the article as PDF)
Open citations (links to open the citations from this article in various online reference manager services)
Cite this article (links to download the citations from this article in formats compatible with various reference manager tools)
Attention periodically samples competing stimuli during binocular rivalry
eLife 7:e40868.
https://doi.org/10.7554/eLife.40868


