The proneural wave in the Drosophila optic lobe is driven by an excitable reaction-diffusion mechanism
- University of Cambridge, United Kingdom
Figures
Figure 1
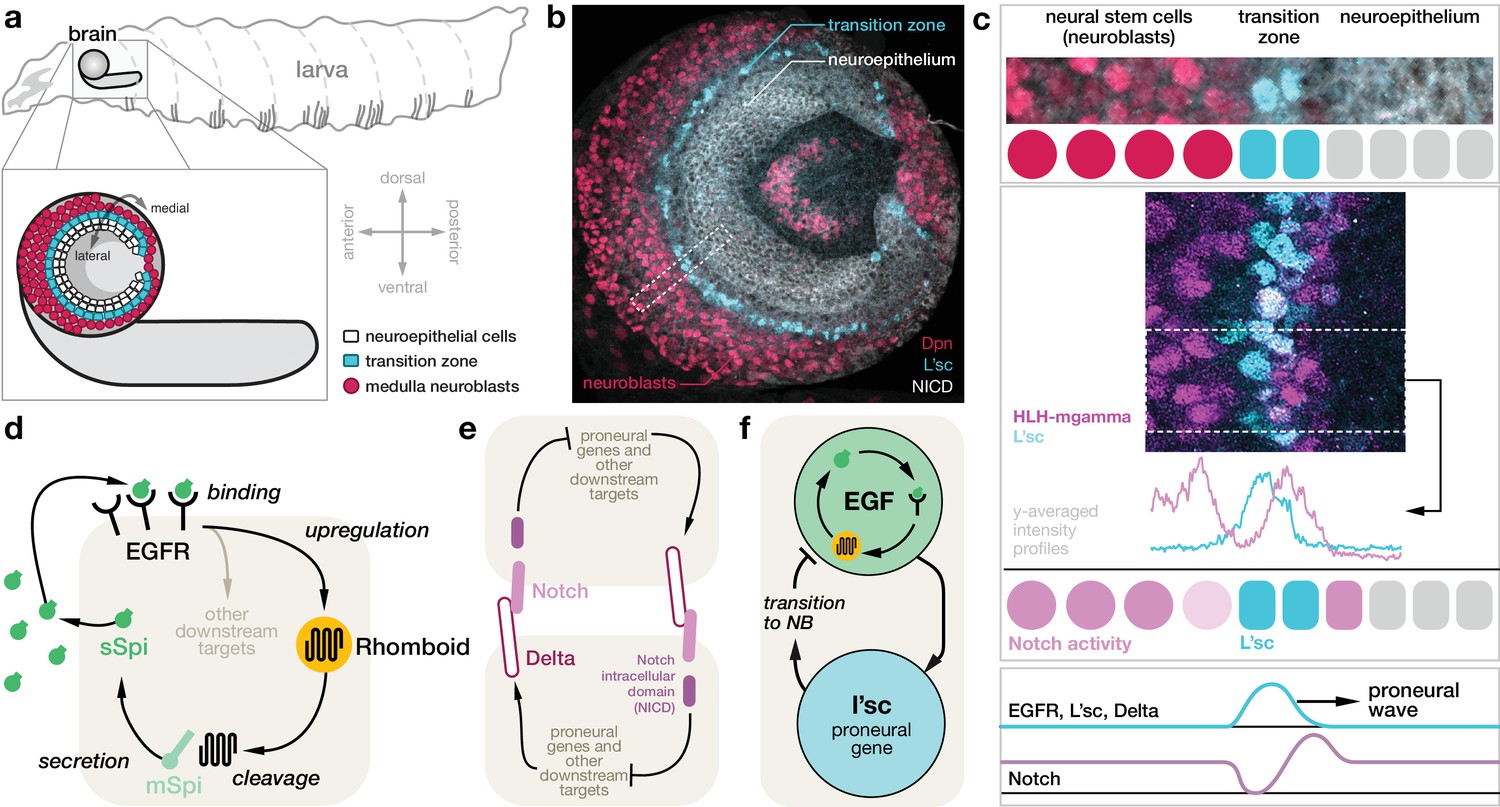
Molecular basis for the proneural wave in the Drosophila optic lobe.
(a) Schematic depiction of the Drosophila larva at the late 3rd instar stage when the proneural wave is transforming the neuroepithelium into medulla neuroblasts. (b) Optic lobe in a lateral view showing the neuroepithelium (labelled with Notch intracellular domain (NICD), white), the transition zone (L’sc, cyan) and the neuroblasts (Dpn, red). (c) L’sc expression and Notch signalling activity around the transition zone. Top: Magnification of the region outlined in (b), showing neuroblasts (Dpn, red), L’sc expression (cyan) and the neuroepithelium (NICD, white). Middle: Confocal image showing that Notch signalling activity (HLH-mgamma, purple) increases just before the transition zone (marked by L’sc, cyan), drops during the transition and then increases again in neuroblasts. Bottom: The proneural wave, characterised by expression of L’sc as well as EGF receptor (EGFR) and Notch signalling activity, sequentially converts the neuroepithelium into neuroblasts. (d) EGFR signalling in the transition zone activates expression of the transmembrane protein Rhomboid, which in turn cleaves the membrane-tethered form of the EGFR ligand Spitz (mSpi) to generate its active secreted form (sSpi). (The shaded region depicts an individual cell in the neuroepithelium.) sSpi can bind to the EGFR on the same cell and neighbouring cells. (e) Delta-Notch signalling is a contact-dependent signalling pathway active in both the neuroepithelium and the neuroblasts. The Delta ligand binds to Notch receptors on adjacent cells upon which their intracellular domain (NICD) is cleaved. The NICD regulates target genes, which, in turn, affects expression of Delta. (f) Active EGFR signalling promotes the expression of L’sc within the same cell, which is sufficient for the neuroepithelium to neuroblast transition and which in turn downregulates EGFR signalling.
Figure 2
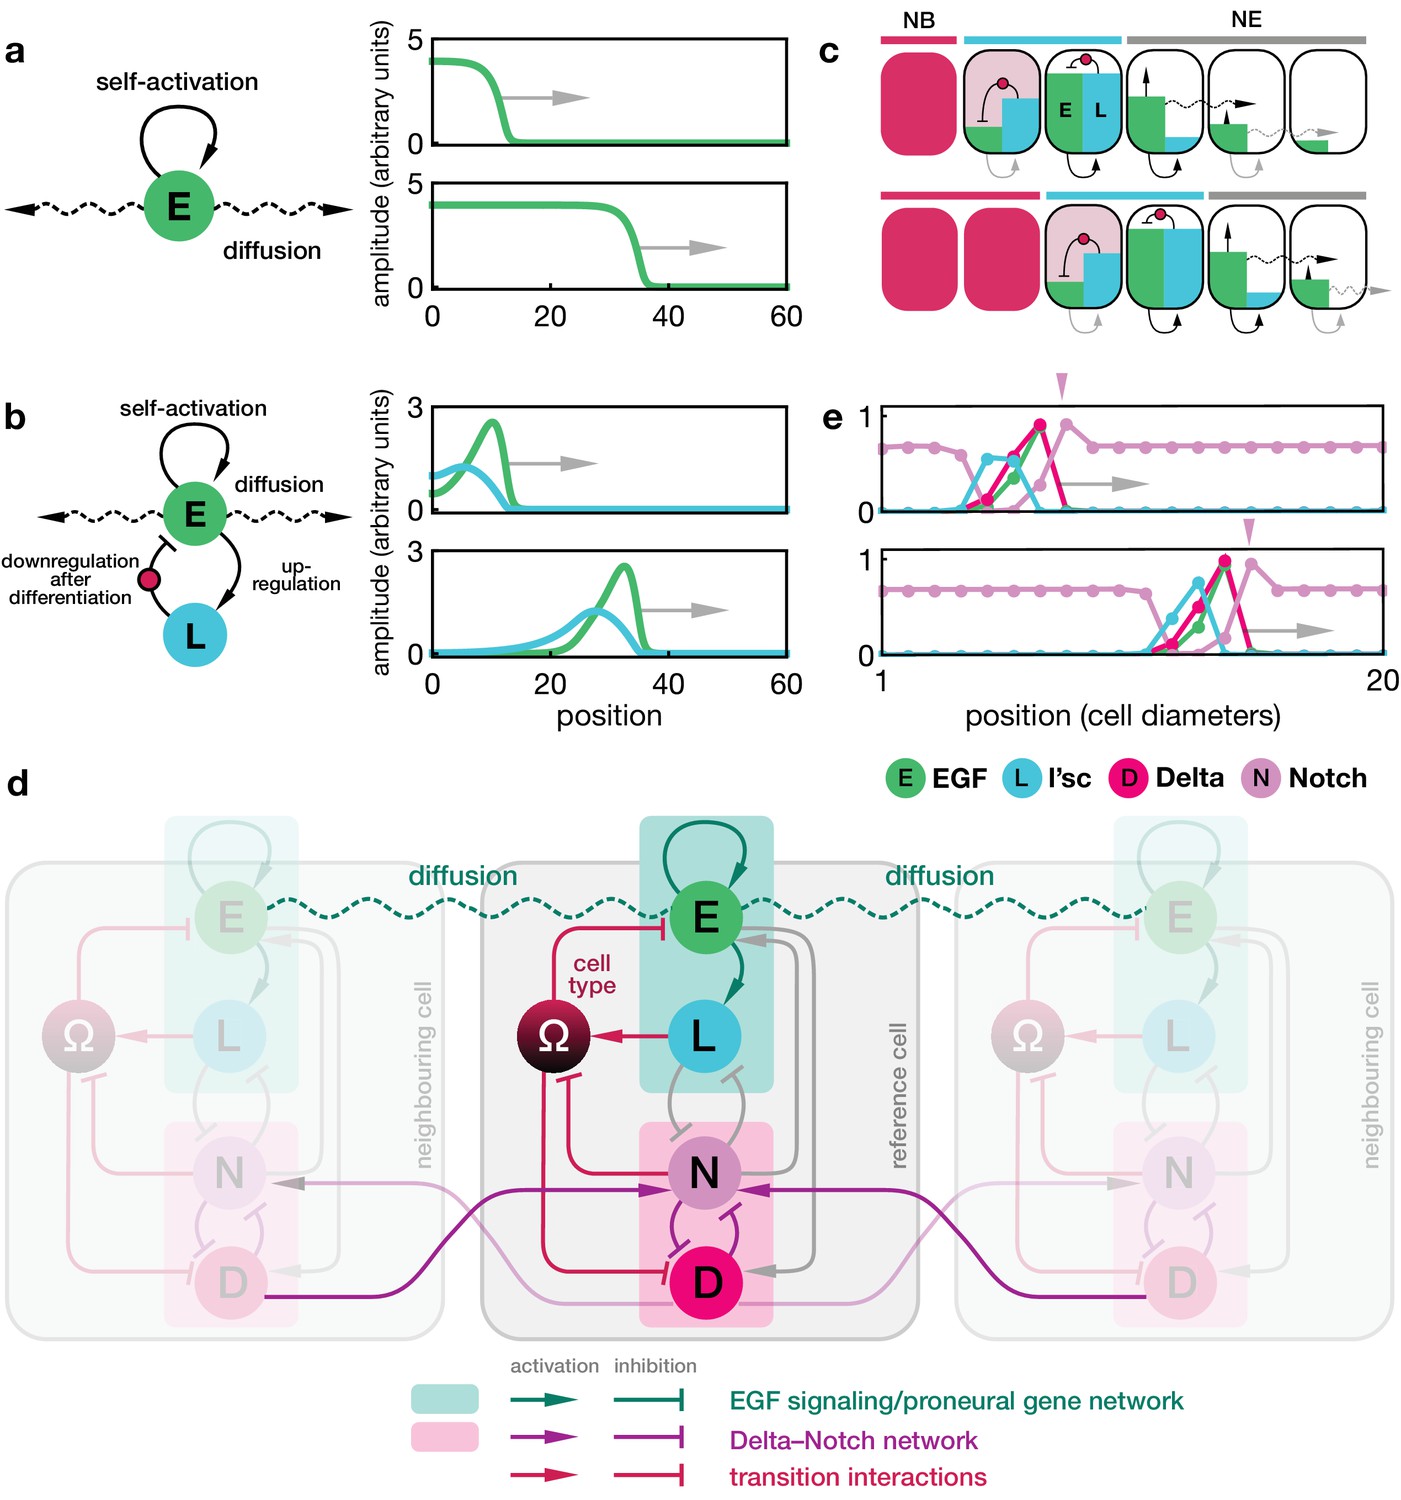
Dynamics of the proneural wave as an excitable reaction-diffusion system.
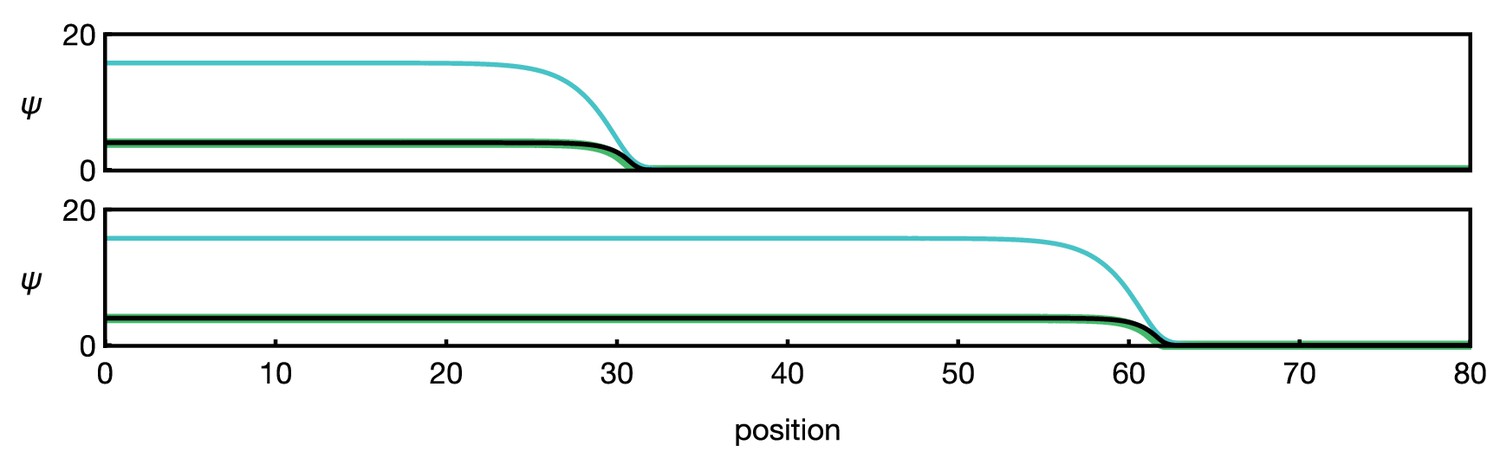
(a) Minimal model of EGFR signalling. The dynamics of the EGFR/Rhomboid/Spitz feedback loop is condensed in a single component ‘E’ (green), which is diffusible between cells and able to self-activate (for details, see Appendix 1). This single component represents a proxy for the activity of the feedback loop shown in Figure 1c, for example the local concentration of the active form of Spitz. The corresponding reaction-diffusion system, Equation 1, can give rise to a propagating front that leaves behind an elevated signalling state. Plots show the numerical solution of Equation 1 in a one-dimensional representation of tissue (for simplicity) at two time points with initially elevated levels of E at the left-hand side of the domain. Specifying position in units of the diffusion length and time in units of the decay time , the remaining chosen parameters are and . (b) Model of EGFR signalling interacting with the proneural gene l’sc. EGFR signalling activates L’sc expression (component ‘L’, blue), which effectively inhibits EGFR signalling by driving the NE to NB transition (for details, see Appendix 2). The corresponding reaction-diffusion system, Equation 2, can give rise to a propagating localised pulse of signalling activity and proneural gene expression corresponding to the transition zone. Parameters for E are the same as in panel a; parameters for L are , . (c) Schematic depiction of the mechanism giving rise to a localised transition zone, shown in panel b. Diffusion of signalling components (E, green) into the neuroepithelium leads to activation of the positive feedback loop, which locally excites signalling and proneural gene expression (L, blue) (Materials and methods). The excitation ceases as downregulation of signalling occurs, a consequence of the transition triggered by L’sc expression. (d) Regulatory network of the refined model including Delta-Notch signalling (D and N) and a local variable indicating the cell state ( indicates neuroepithelial cells and indicates neuroblasts; for details, see Appendix 3). Each shaded cell indicates one lattice site corresponding to one cell of the tissue. (e) Simulation of the integrated model of EGFR signalling, L’sc expression, Delta-Notch signalling and the NE to NB transition in a one-dimensional array of cells. The emerging spatial signalling and gene expression profile is characterised by a pulse of EGFR signalling, L’sc and Delta, and a drop in Notch signalling activity within the transition zone. The drop in Notch is preceded by a pulse of Notch signalling activity (pink arrowheads), which is due to a local lateral inhibition effect mediated by Delta-Notch signalling. Parameters are given in Appendix 3—table 1 except for .
Figure 3
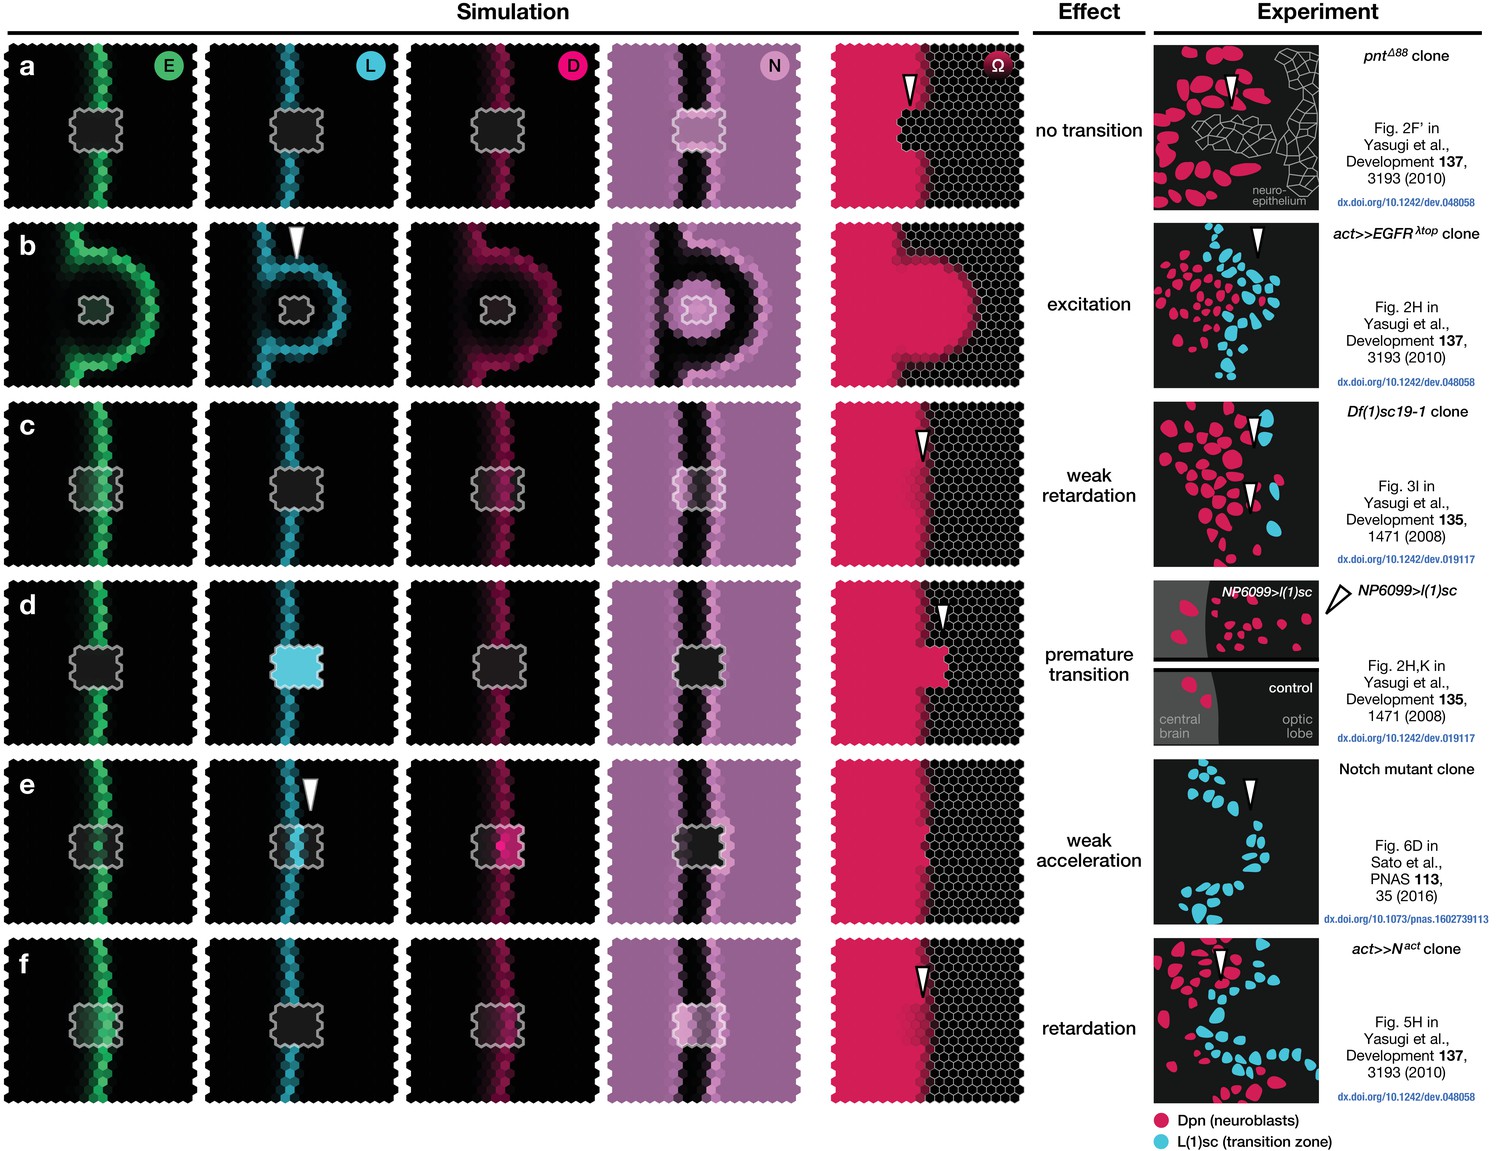
Simulations of the proneural wavefront as well as clones (outlined cells) capturing different mutant and transgenic conditions.
(a) Knockout of EGFR signalling ( within the clone), (b) EGFR signalling constitutively active (E signalling always active within the clone), (c) L’sc knockout ( within the clone), (d) L’sc constitutively active (L synthesis always active within the clone), (e) Notch downregulation ( within the clone), (f) Notch upregulation (additional N synthesis with rate within the clone). In all panels, white arrowheads indicate advancements and retardations of the wavefront as compared to wildtype tissue due to the respective genetic alterations of the clones. The system given by Equations 17–19 was numerically simulated on a hexagonal lattice with initially localised levels of E in the first three columns at the left boundary of the system so that the wave travels to the right. All other parameters are given in Appendix 3—table 1. All shown simulation snapshots are taken at time , except for panel B, which is taken at . The column ‘Experiment’ shows sketches of experiments with mutant and transgenic clones and animals and refer to the corresponding original literature.
Figure 4
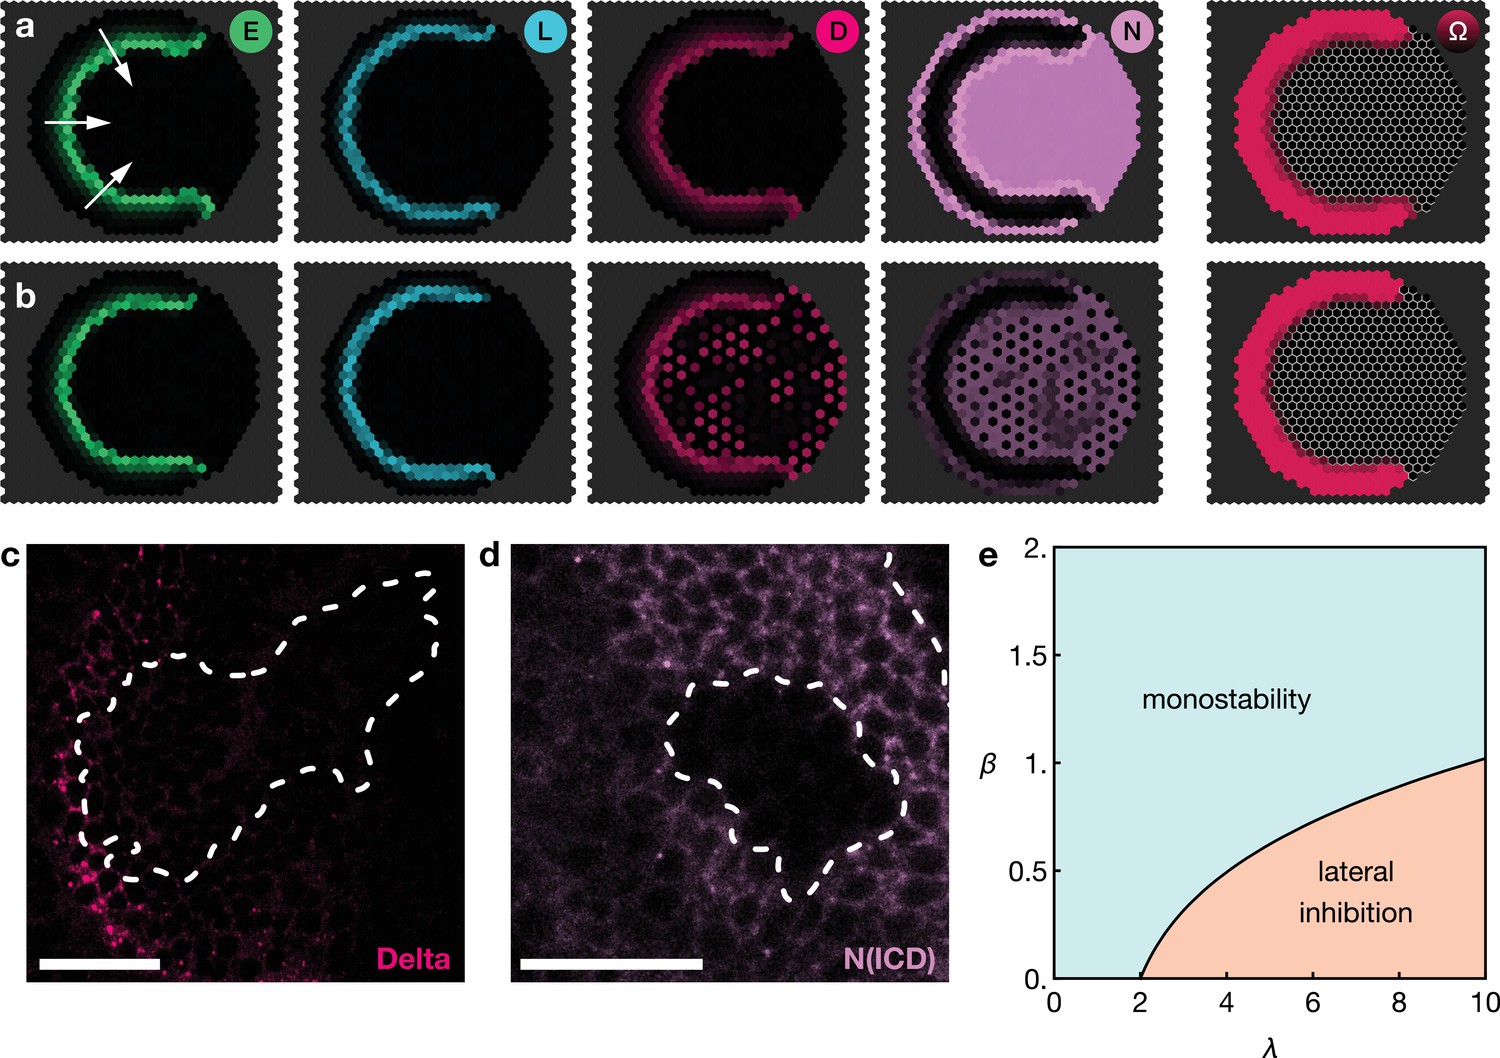
Basal Notch activity suppresses lateral inhibition patterns.
The panels show snapshots of the proneural wave model Equation 17–Equation 20 simulated on a hexagonal lattice with circular geometry with a radius of 15 lattice sites. White arrows indicate the direction of wave progression. Transient lateral inhibition patterns can occur if basal Notch levels are low compared to the thresholds for activation and inhibition of the Delta–Notch interactions: (a) In the scenario with basal Notch activity, lateral inhibition patterns are suppressed (basal Notch gain rate ). (b) In the scenario with downregulated basal Notch activity, lateral inhibition patterns appear (basal Notch gain rate ). Other parameters are given in Appendix 3—table 1; both panels are simulated with biochemical noise strength (see Equation 20). Initial conditions were localised elevated levels of E in those outer boundary cells that have angles between and as measured from the center of the circular lattice. (c) Downregulation of Notch levels by expressing Notch RNAi in clones does not result in the emergence of a salt-and-pepper expression pattern of Delta (pink). Clone outlines are marked by white dotted lines. (d) Expressing Notch RNAi in clones results in the complete loss of detectable Notch (N(intracellular domain, ICD), purple) within the clones. Clone outlines are marked by white dotted lines. (e) Phase diagram for the occurrence of lateral inhibition in the two-cell system (for details, see Appendix 5). Here, denotes the basal production rate and denotes the gain rate. (c) and (d) are single section confocal images, scale bars represent 20 m.
Figure 5
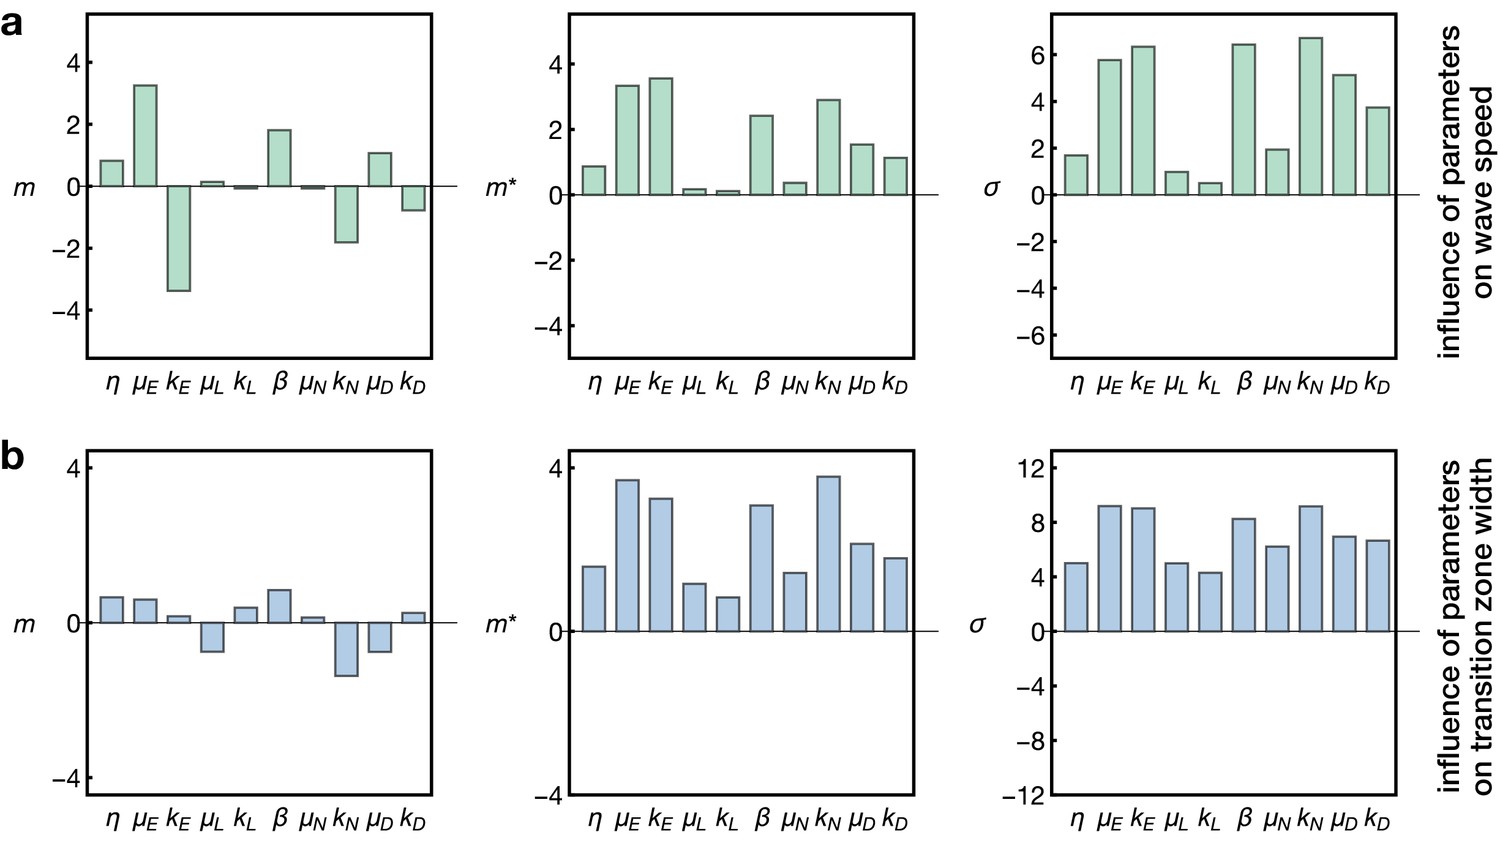
Sensitivity analysis of the model.
Plots show the Morris indices , and as described in the main text and Appendix 7, indicating the effect of a parameter on (a) the wave speed and (b) the width of the transition zone. The indices and indicate the influence of a parameter on the respective output with comprising positive and negative effects and measuring the absolute effect, whereas non-zero values of indicate a nonlinear influence and/or interactions with other parameters. The and denote the gain and decay rates for the respective components , denotes the diffusion constant of the component ‘E’ and denotes the basal Notch gain rate (see Equation 17).
Figure 6
As in Notch mutant clones (Egger et al., 2010; Reddy et al., 2010; Yasugi et al., 2010), the proneural wave is accelerated in clones expressing Notch RNAi, see also Figure 3e.
(a) Expression of Notch RNAi resulted in the downregulation of Notch (N(ICD), purple) and accelerated the transformation (which requires L’sc, cyan) of neuroepithelial cells to neuroblasts (Dpn, red) within clones. (b) The downregulation of Notch appears to decrease the width of the transition zone, as assessed by L’sc (cyan) and Delta (pink) expression within Notch RNAi clones. Dotted white lines mark clone boundaries and yellow arrows indicate the position of the transition zone within Notch RNAi clones. Images are single section confocal slices, scale bars represent 20 m.
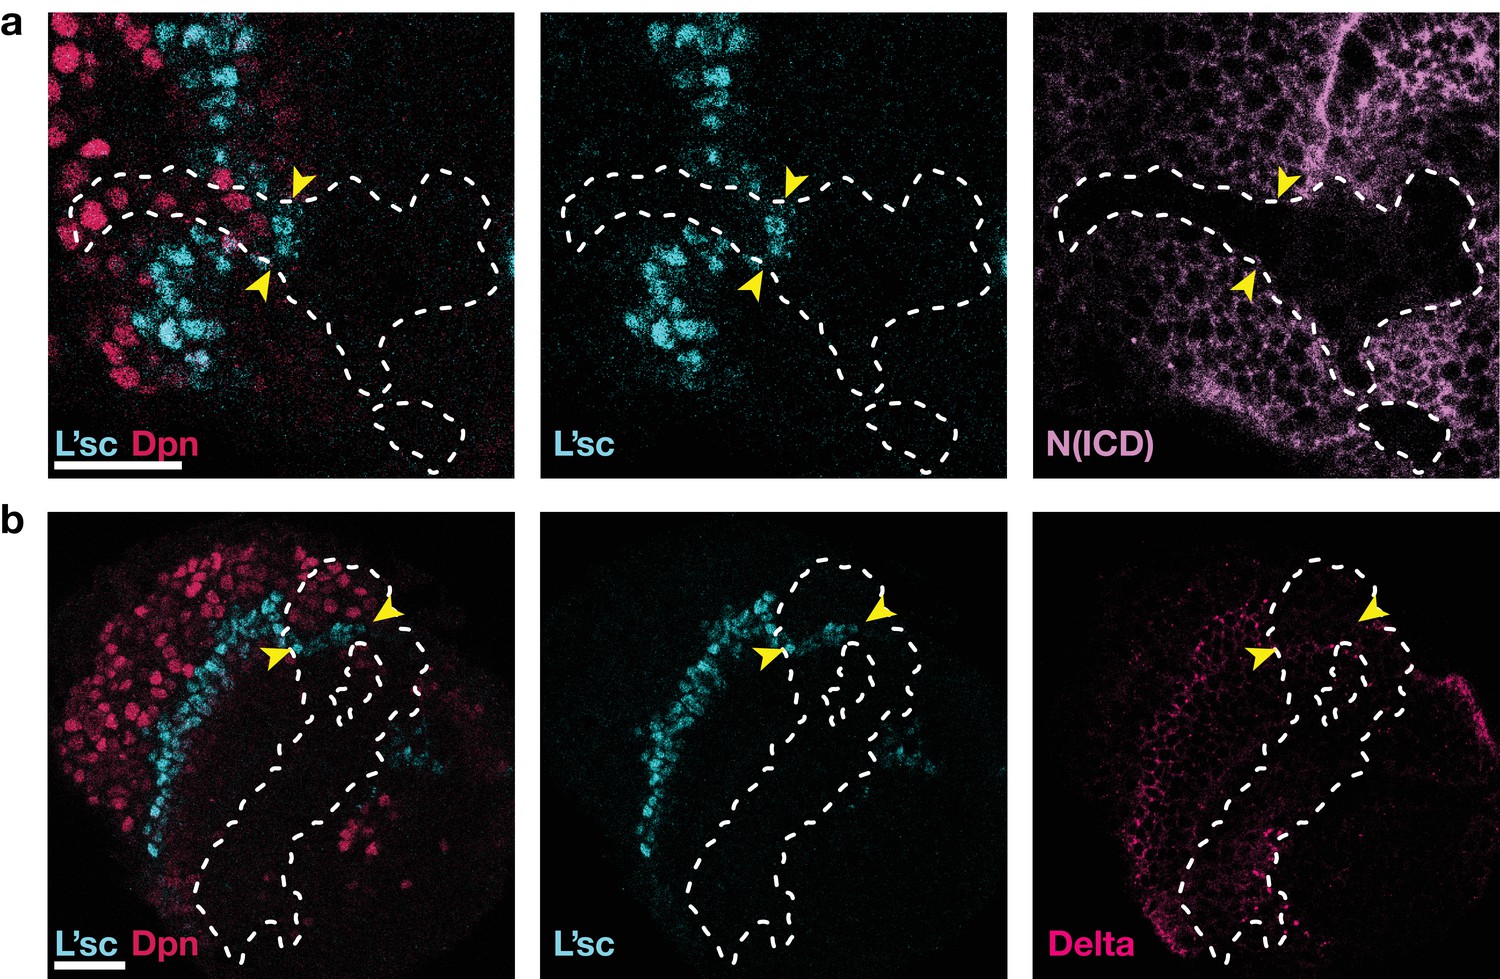
Figure 7
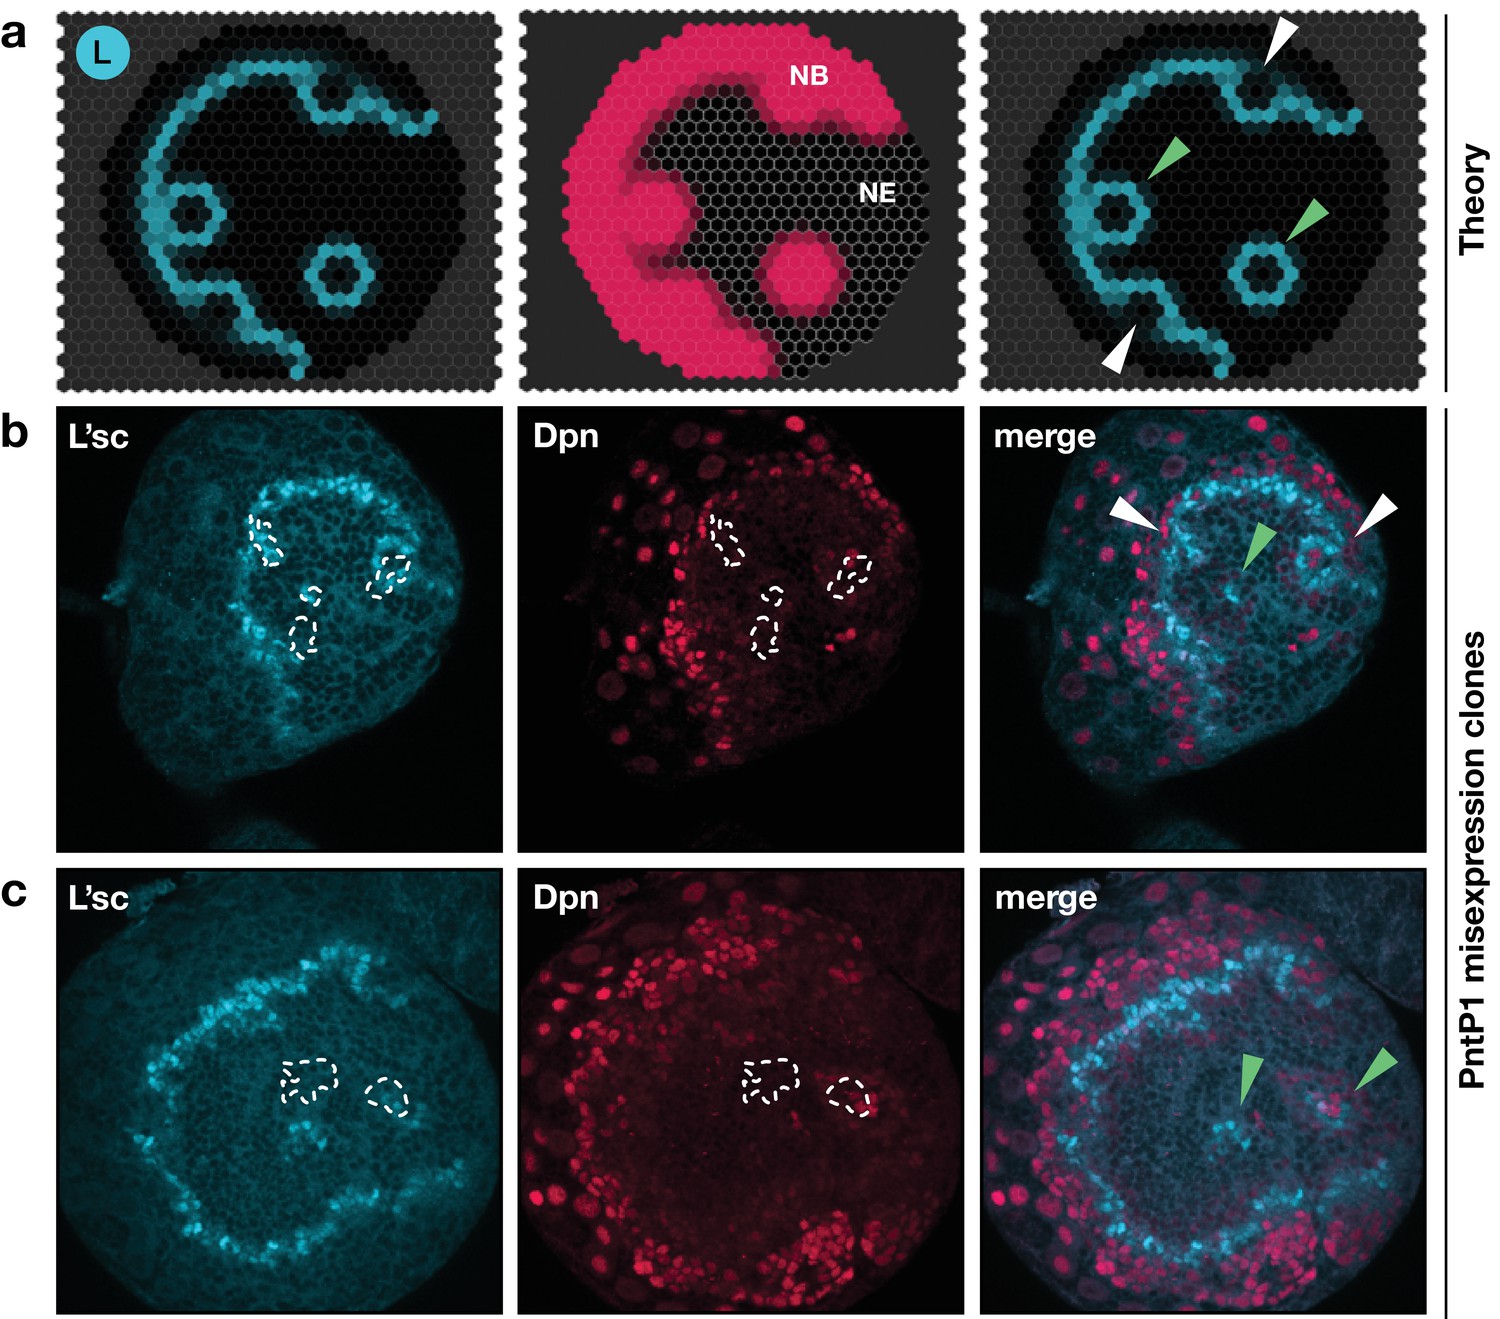
Integrated model of EGFR signalling, L’sc expression, Delta-Notch signalling and the NE to NB transition predicts key features of proneural wave progression in wildtype tissue and following perturbation.
The effect of constitutively active EGFR signalling outside the transition zone: Comparison between the model prediction and experiment. (a) Snapshots of a model simulation on a two-dimensional hexagonal lattice representing the neuroepithelium with randomly distributed clones derived as target waves centred on the site (cell) in which EGFR signalling has been activated (see Materials and methods and Video 5). Cyan indicates levels of L’sc, red indicates neuroblasts (NB) and the grey grid the neuroepithelium (NE). The third column shows a merged image. (b,c) Ectopic expression of PntP1 within the neuroepithelium induces L’sc expression and a NE to NB transition. Clones expressing PntP1, a downstream effector of the EGFR signalling pathway, are indicated by white outlines or green arrowheads. Clones that merge with the transition zone are marked with white arrowheads. Clones within the neuroepithelium that are clearly separated from the transition zone, are marked by green arrowheads; clones that merge with the transition zone are marked with white arrowheads. L’sc is labelled in cyan; neuroblasts are labelled in red by expression of the Hes family transcription factor Deadpan (Dpn).
Appendix 1—figure 1
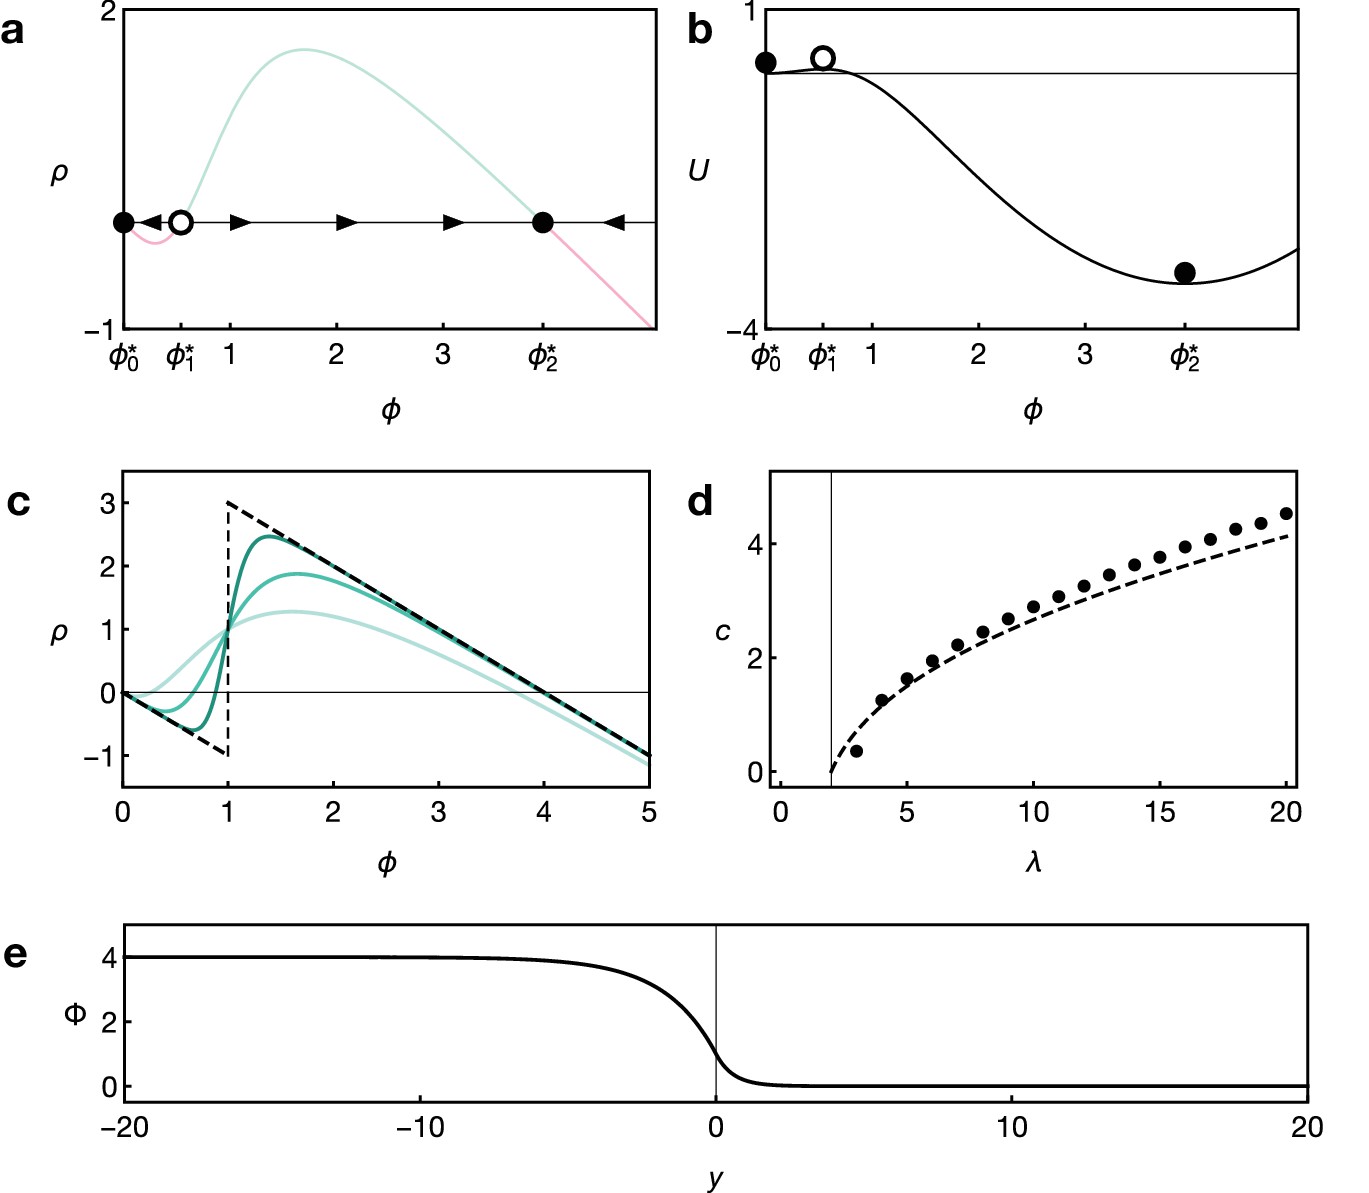
Key features of reaction dynamics leading to bistable front propagation.
(a) Reaction term as given by Equation 6. Dots indicate the fixed points with for which . Filled dots indicate stable fixed points, the open dot indicates the unstable fixed point. (b) Potential associated with the reaction term shown in panel A and defined by . Parameters in both panels are and . (c) Reaction term as given by Equation 6 for Hill exponents (light green), (green), (dark green), and the limiting case (dashed black), given by Equation 9, for . (d) Front velocity as a function of . Numerical solutions obtained from simulations of Equation 6 with Hill exponent and analytical approximation Equation 11 for the limit. (e) Example of the front profile given by Equation 10 with .
Appendix 1—figure 2
Numerical example of the three-component system Equation 13.
Different curves show (black), (green), and (blue). The two panels show the time points (top) and (bottom). Functions and parameters are , given by Equation 5 with , and for . Boundary conditions are .
Appendix 2—figure 1
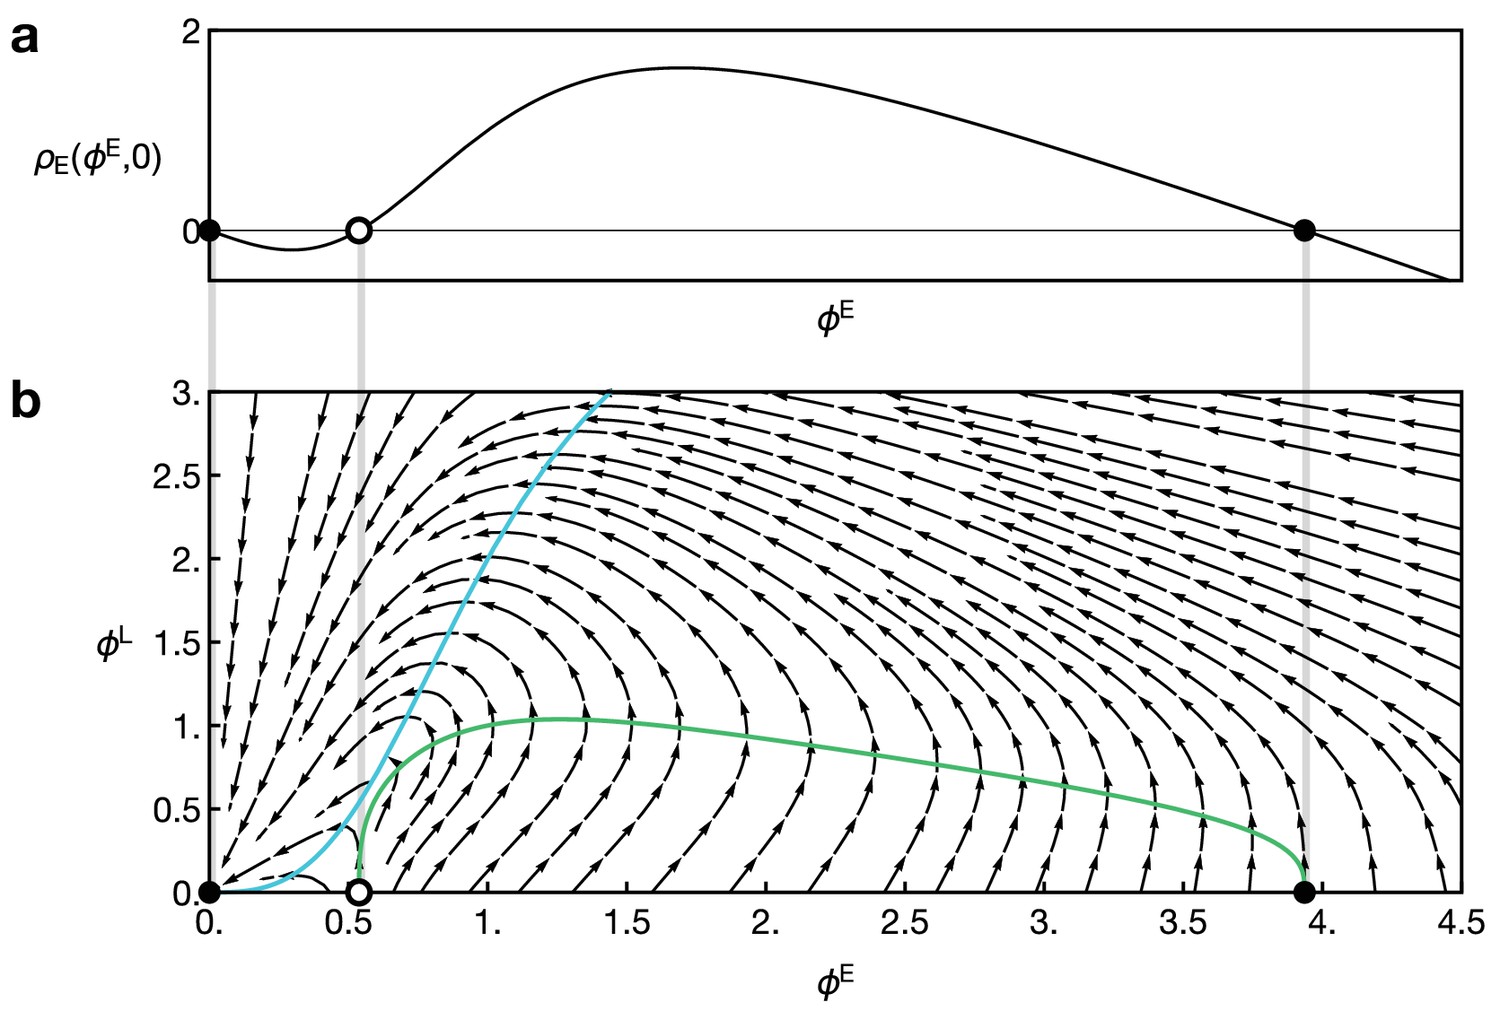
Reaction dynamics of the two-component model Equation 15 and Equation 16.
(a) Reaction term of the component E in the absence of L, given by in Equation 16. Dots indicate fixed points for which . (b) Full local reaction dynamics for the two-component model. Vector field as given by Equation 16. Dots indicate points with and . Parameters in both plots are and . Coloured curves show the nullclines for E (green) and L (blue).
Appendix 3—figure 1
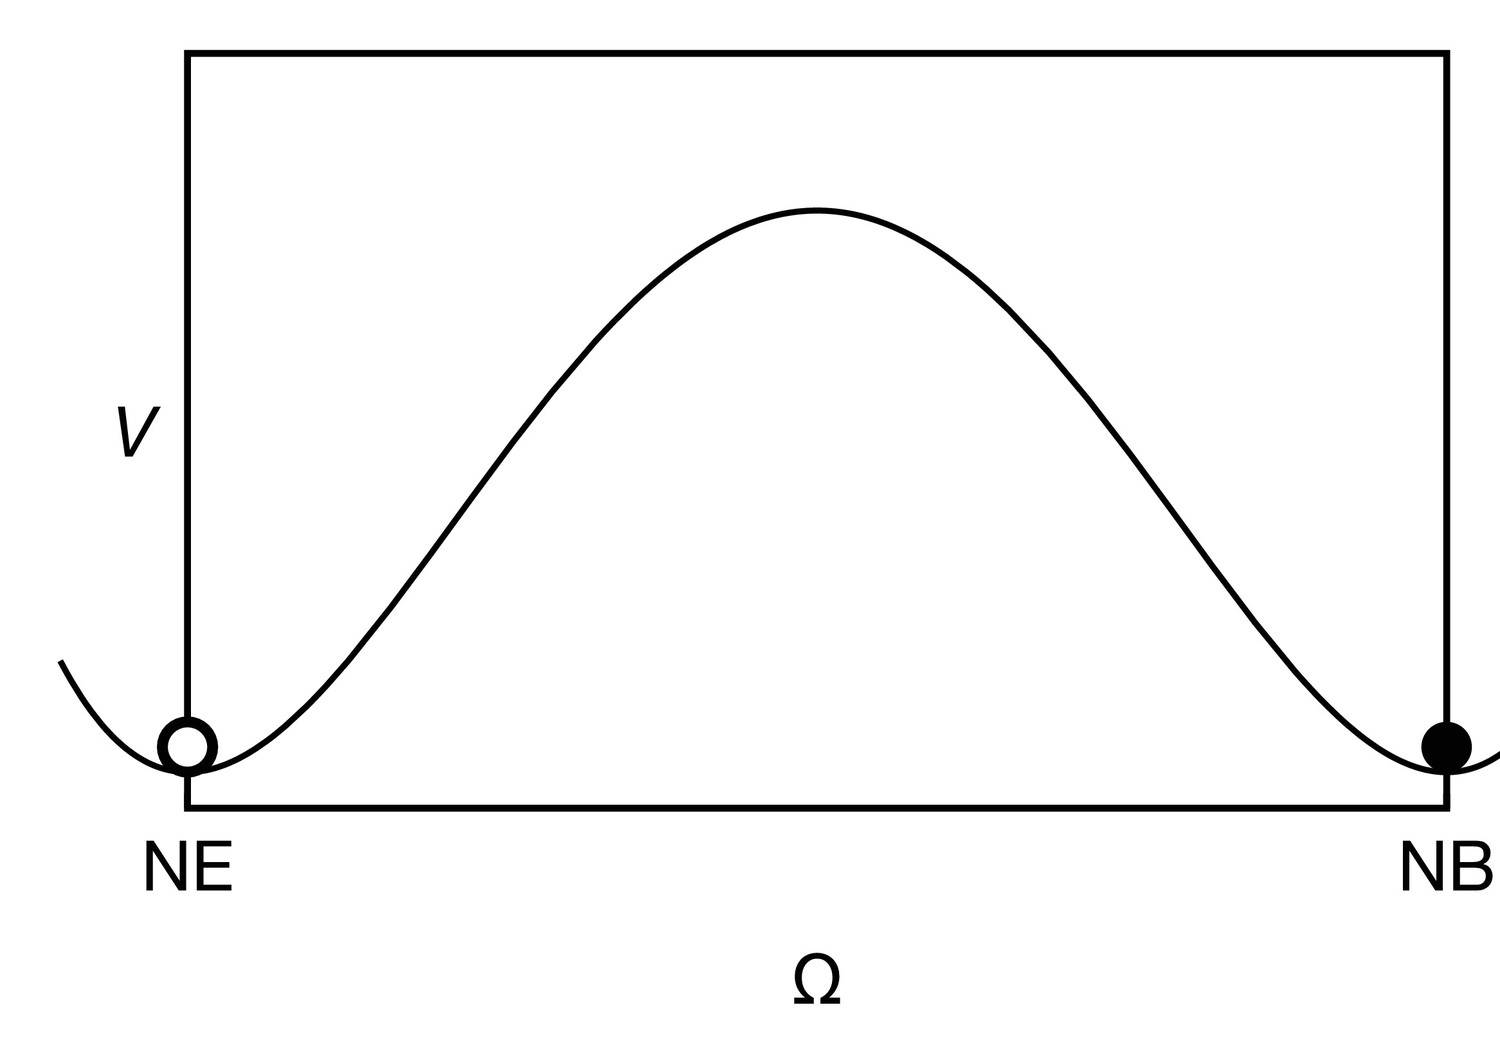
The cell state potential , given by Equation 19 has two wells, corresponding to the neuroepithelial state (NE, ) and the neuroblast state (NB, ).
https://doi.org/10.7554/eLife.40919.021
Appendix 4—figure 1
Response of the dynamics to biochemical fluctuations.
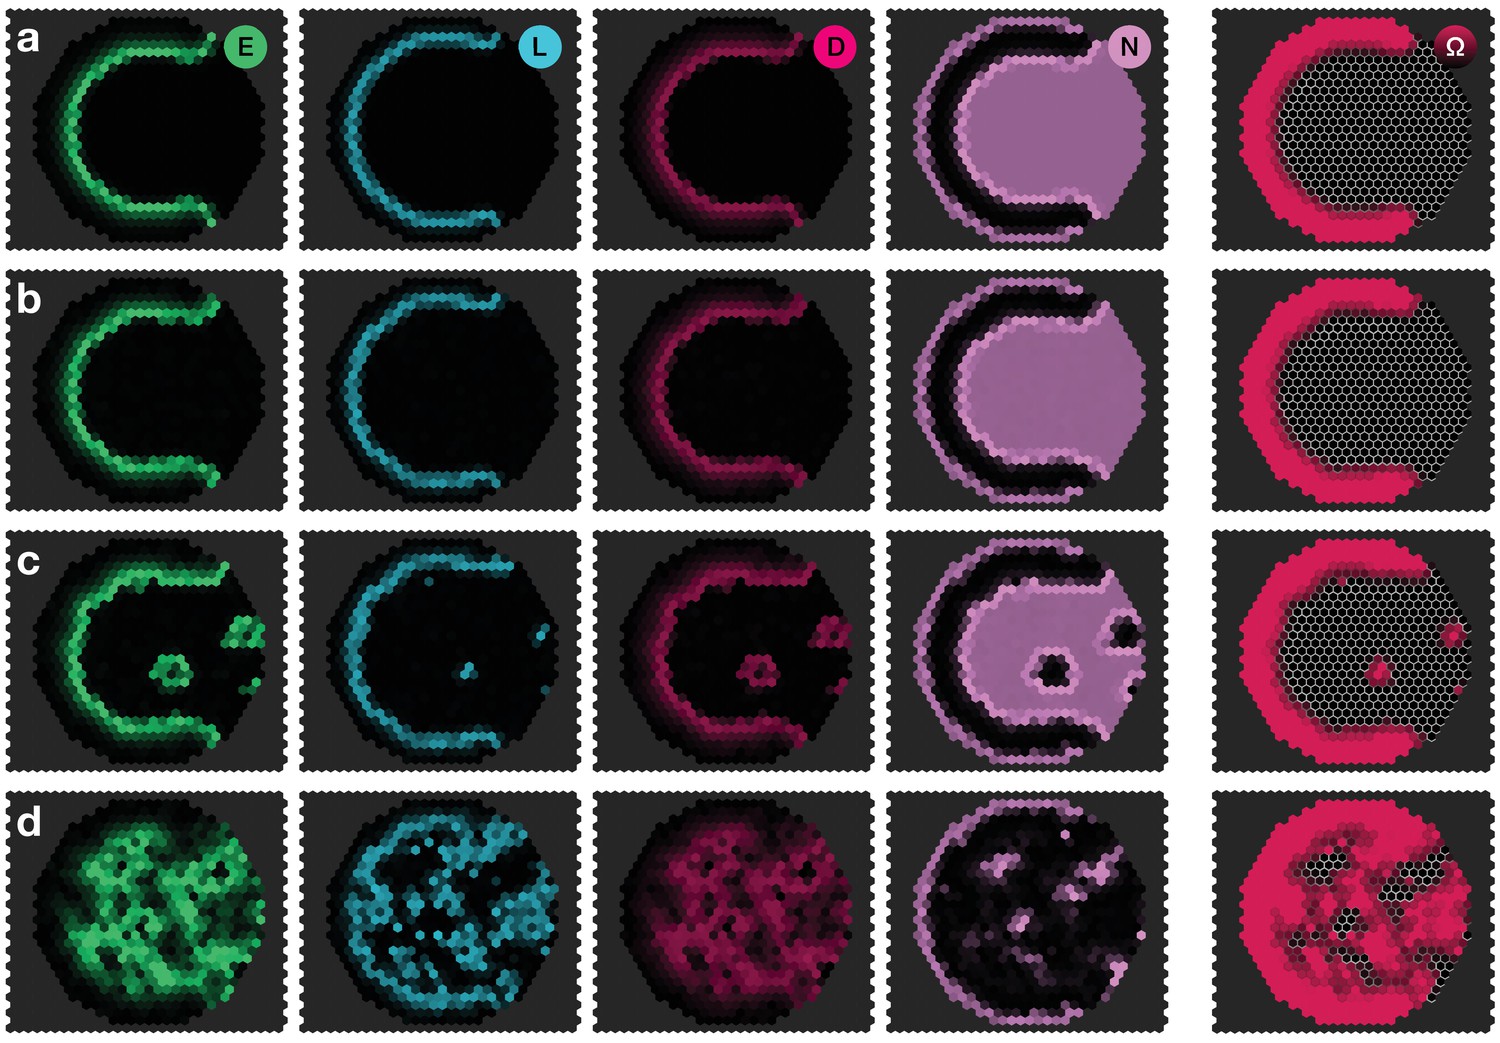
Panels show snapshots of the system for different noise strengths: (a) , (b) , (c) , (d) . All other parameters are given in Appendix 3—table 1. The system given by Equations 17–20 was simulated on a hexagonal lattice with circular geometry with a radius of 15 lattice sites. Initial conditions were localised elevated levels of E in those outer boundary cells that have angles between and as measured from the center of the circular lattice. The respective simulation panels show snapshots of the activity of EGFR signalling (green), L’sc expression (blue), Delta activity (magenta) and Notch activity (pink), as well as the cell state , for which black indicates neuroepithelium () and red indicates neuroblasts (). Colour intensity indicates the local gene expression levels or signalling activities, respectively. The snapshots show the time .
Appendix 4—figure 2
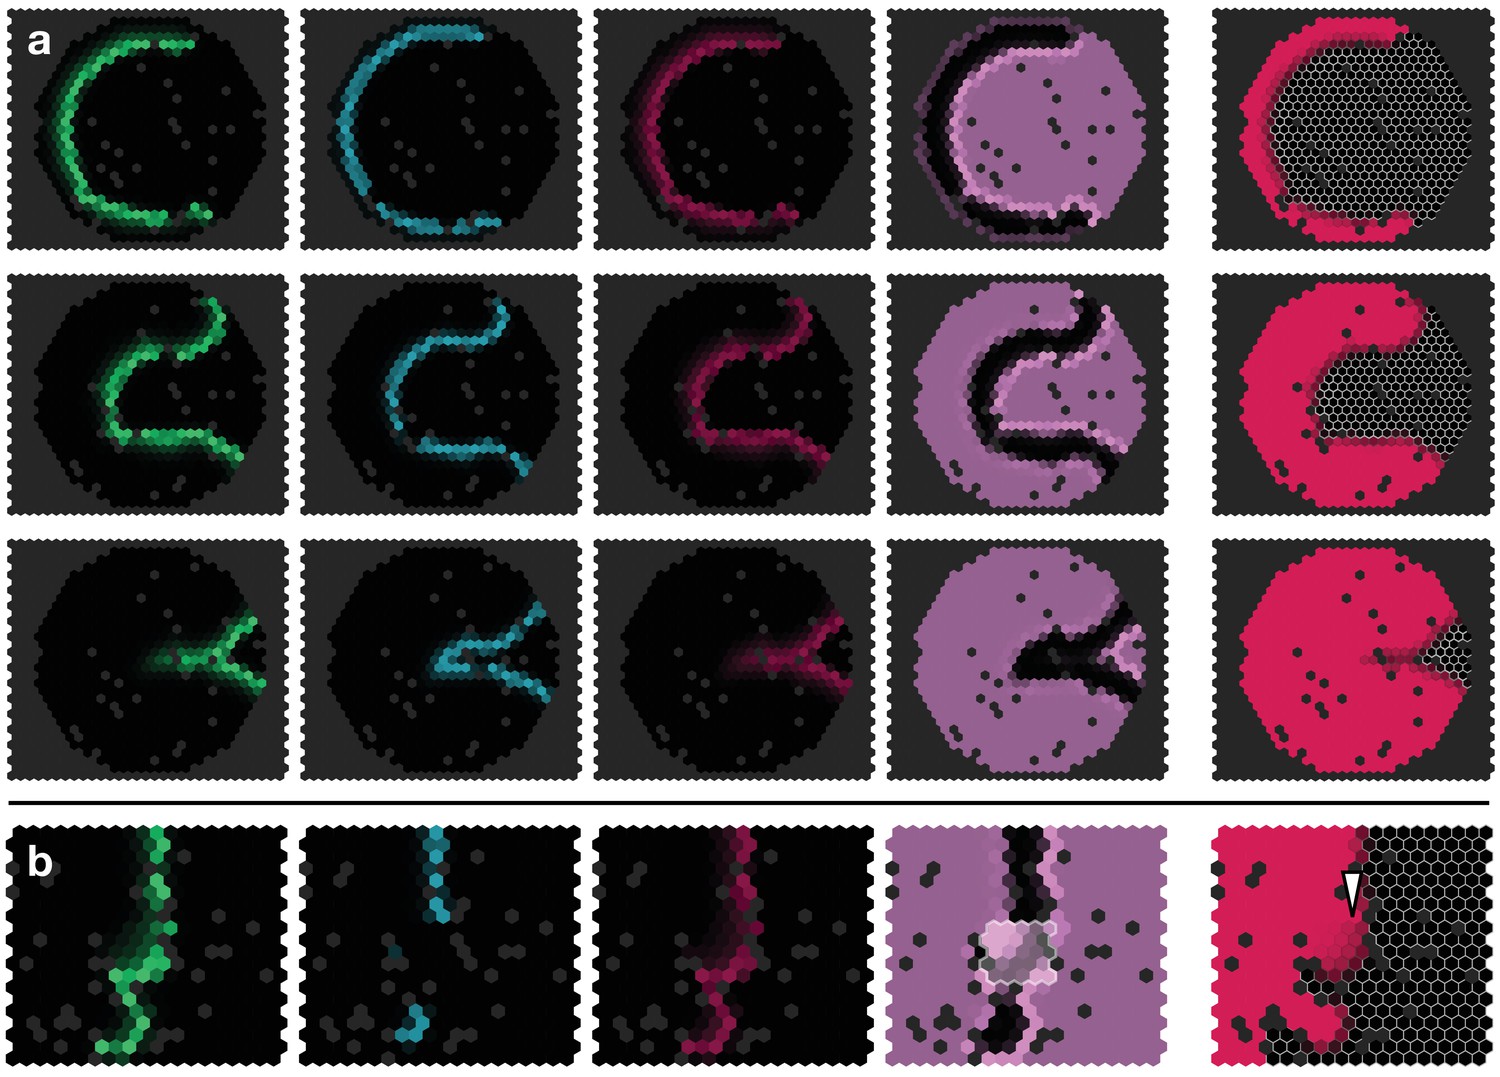
Simulated proneural wave on a lattice with random ‘defects’ (black sites).
(a) Proneural wave propagation on a hexagonal lattice with circular geometry. Parameters and initial conditions as in Appendix 4—figure 1 with . The snapshots show the time (top row), (middle row) and (bottom row). (b)Notch upregulation clone as shown in Figure 3f, but on a heavily site-diluted lattice. The white arrowhead indicates retarded differentation, cf. Figure 3f.
Videos
Video 1
Travelling EGFR signalling front.
The movie shows the simulation of a one-dimensional version of the EGFR signalling model Equation 1 corresponding to the snapshots shown in Figure 2a. All simulation parameters as in Figure 2a.
Video 2
Travelling EGFR signalling pulse and proneural gene expression.
The movie shows the simulation of a one-dimensional version of the model of EGFR signalling interacting with the proneural gene l’sc, Equation 2, corresponding to the snapshots shown in main text Figure 2b. All simulation parameters as in Figure 2b.
Video 3
Travelling proneural wave in the integrated model on a 1D array.
The movie shows a simulation of the proneural wave model Equations 17–19 simulated on a one-dimensional array of cells. All simulation parameters as in Figure 2e.
Video 4
Travelling proneural wave in the integrated model on a 2D hexagonal lattice.
The movie shows a simulation of the proneural wave model Equations 17–19 simulated on a hexagonal lattice with circular geometry with a radius of 15 lattice sites. All simulation parameters are given in Appendix 3—table 1.
Video 5
Travelling proneural wave with ectopic activation of EGFR signalling within clones.
The movie shows a simulation of the proneural wave model Equations 17–19 on the same lattice as in Video 3 but with four single-cell clones with constitutively active EGFR signalling. The movie corresponds to the snapshots shown in Figure 7a.
Tables
Appendix 3—table 1
Reference parameter set used for the model Equations 17–19.
https://doi.org/10.7554/eLife.40919.022| Parameter(s) | Value | Description | Affected components |
|---|---|---|---|
| 0.02 | diffusion constant | E | |
| , , | 10 | gain rates | E, L, N |
| , | 5 | gain rates | D, N |
| , , , | 1 | decay rates | E, L, D, N |
| 100 | Notch threshold | E | |
| 0.5 | Notch threshold | L | |
| 10 | threshold for differentiation | ||
| 3 | Hill exponent | E, L, D, N | |
| (as indicated) | biochemical noise strength | E, L, D, N | |
Additional files
-
Transparent reporting form
- https://doi.org/10.7554/eLife.40919.014
Download links
A two-part list of links to download the article, or parts of the article, in various formats.
Downloads (link to download the article as PDF)
Open citations (links to open the citations from this article in various online reference manager services)
Cite this article (links to download the citations from this article in formats compatible with various reference manager tools)
The proneural wave in the Drosophila optic lobe is driven by an excitable reaction-diffusion mechanism
eLife 8:e40919.
https://doi.org/10.7554/eLife.40919


