Chromatin mapping identifies BasR, a key regulator of bacteria-triggered production of fungal secondary metabolites
- Leibniz Institute for Natural Product Research and Infection Biology, Germany
- Friedrich Schiller University Jena, Germany
- Friedrich Schiller University, Germany
- BOKU University of Natural Resources and Life Sciences, Austria
- University of Veterinary Medicine, Austria
- Max Planck Institute for Chemical Ecology, Germany
Figures
Figure 1
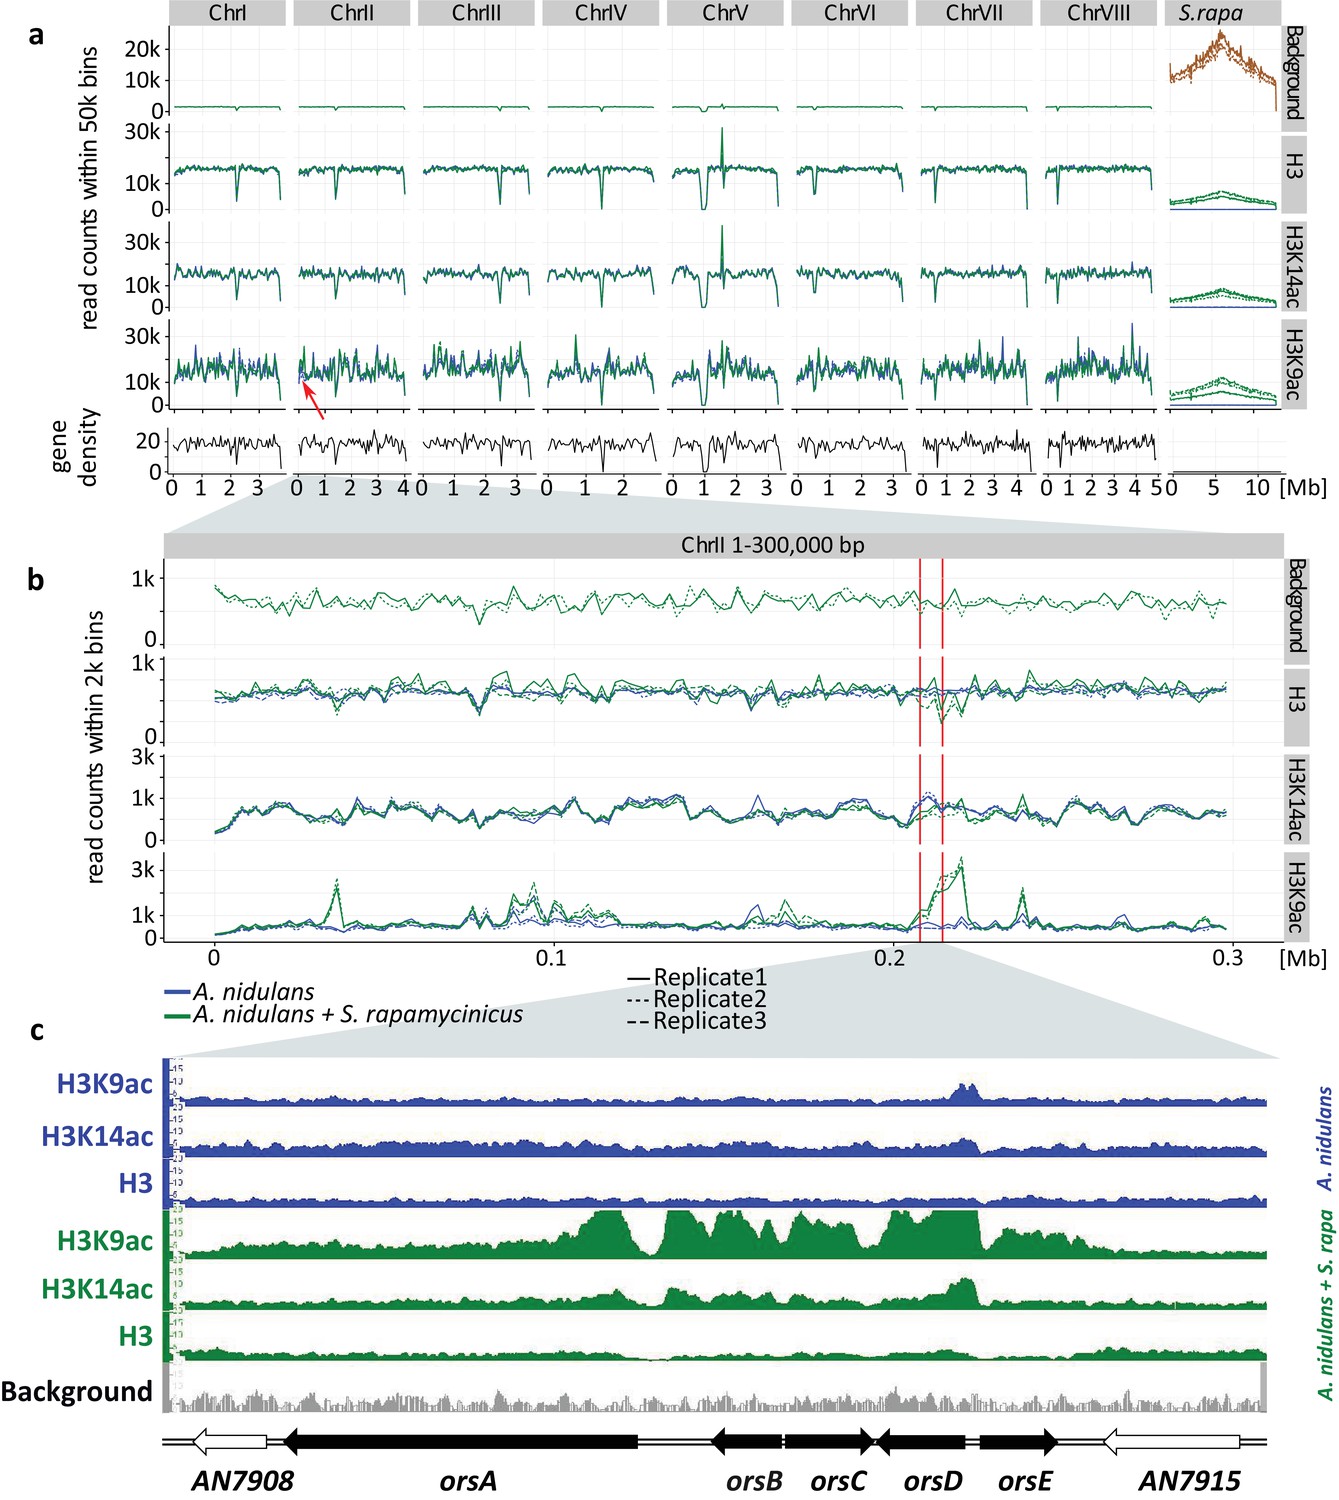
Genome-wide coverage plot of the fused fungal-bacterial genome with indication of the C-terminus of H3(Cterm) and acetylated H3 (K9 and K14).
For each condition, ChIP-seq analyses of three independent samples were performed. (a) Genome-wide analysis covering all chromosomes. Data for all the chromosomes of A. nidulans (I to VIII) as well as for the chromosome of S. rapamycinicus are shown. The x-axis corresponds to the genome coordinates of the fused genome in Mb. The y-axis corresponds to the number of reads mapping within equally sized windows (bins) that segment the fused genome at a resolution of 50 kb for each library separately (see 'Materials and methods' for details). The read count values are plotted at the midpoint of each bin, which are connected by lines. Gene density is reported likewise by counting the number of genes for each bin instead of reads. Background values derive from S. rapamycinicus (brown) and A. nidulans (green) grown in monoculture. The red arrow indicates the location of the ors gene cluster. (b) Zoom into chromosome II. The red lines mark the ors gene cluster. Data from three replicates are shown, which share the same tendency. Overall intensities for background, H3K9ac, H3K14ac and H3(Cterm) are compared between A. nidulans monoculture (blue) and co-culture (green). The average genome density (black) is also shown. (c) Example of an Integrative Genomics Viewer (IGV) screenshot showing the region of the ors gene cluster at the bottom of the figure labeled with black arrows. Other differentially acetylated gene bodies are listed in Supplementary file 1. White gene arrows indicate genes that do not belong to the ors gene cluster. Data obtained from monocultures of the fungus are depicted in blue and from co-cultivation in green, whereas background data are shown in gray.
Figure 2 with 2 supplements
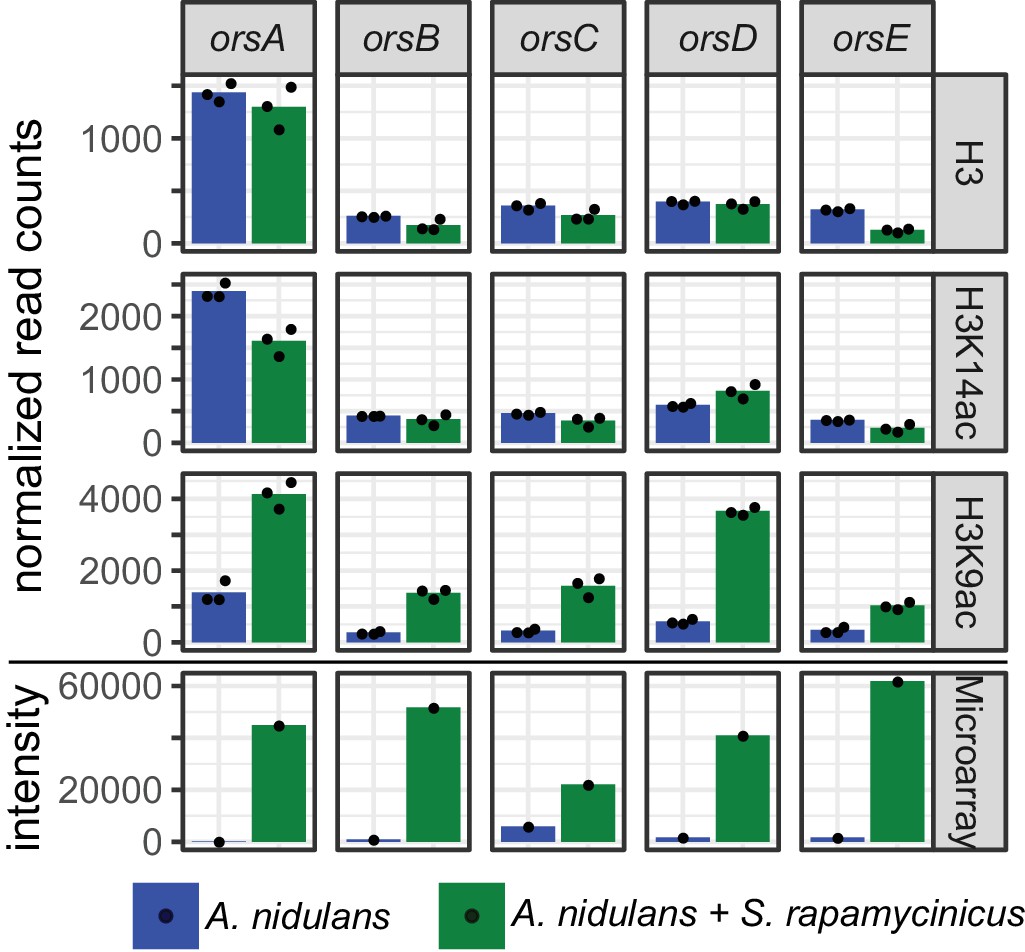
Normalized read counts derived from differential chromatin state (DCS) analysis obtained for the ors genes based on H3, H3K14ac and H3K9ac ChIP-seq.
Data were generated for the area 500 bp down- and 1000 bp upstream of the TSSs. Depicted bars are calculated from three data points.
Figure 2—figure supplement 1

Normalized ChIP-seq read counts were used to quantify the chromatin state of individual genes.
Here, genes involved in calcium signaling are shown for H3, H3K14ac and H3K9ac libraries. Counts were obtained by counting reads mapping to the promoter area for each gene, within regions stretching from 500 bp down- to 1000 bp upstream of each gene's transcription start site (TSS). Depicted bars are calculated from three data points.
Figure 2—figure supplement 2
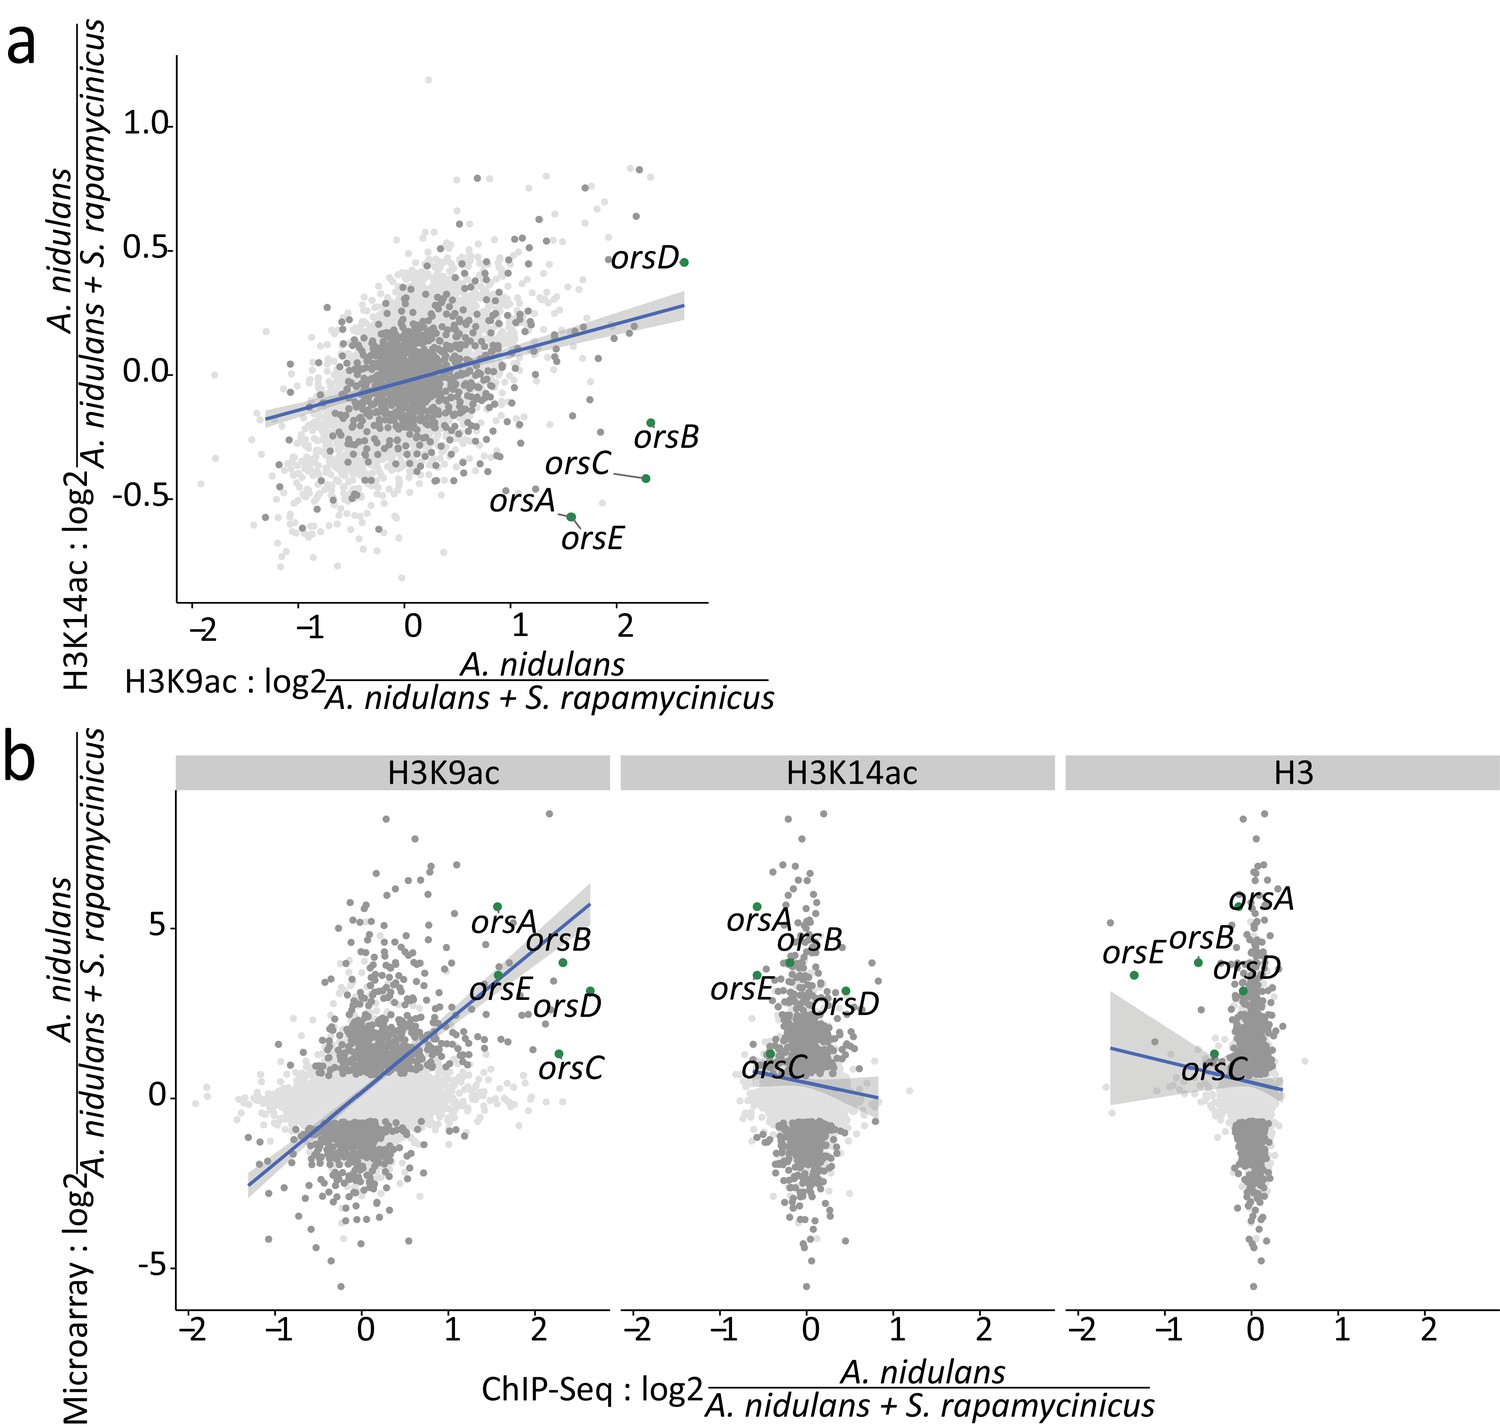
Relation between ChIP-seq and microarray data.
The blue lines resemble the linear regression line based on the differentially expressed genes with an adjusted p-value of <0.1; the confidence interval shown in gray. (a) Log-fold changes (LFCs) for H3K14ac plotted against LFCs for H3K9ac. Dots depicted in dark gray and green mark differentially expressed genes and ors cluster genes, respectively. (b) Pairwise comparison of LFCs of H3, H3K14ac and H3K9ac data with microarray data obtained during co-cultivation of A. nidulans with S. rapamycinicus.
Figure 3 with 1 supplement
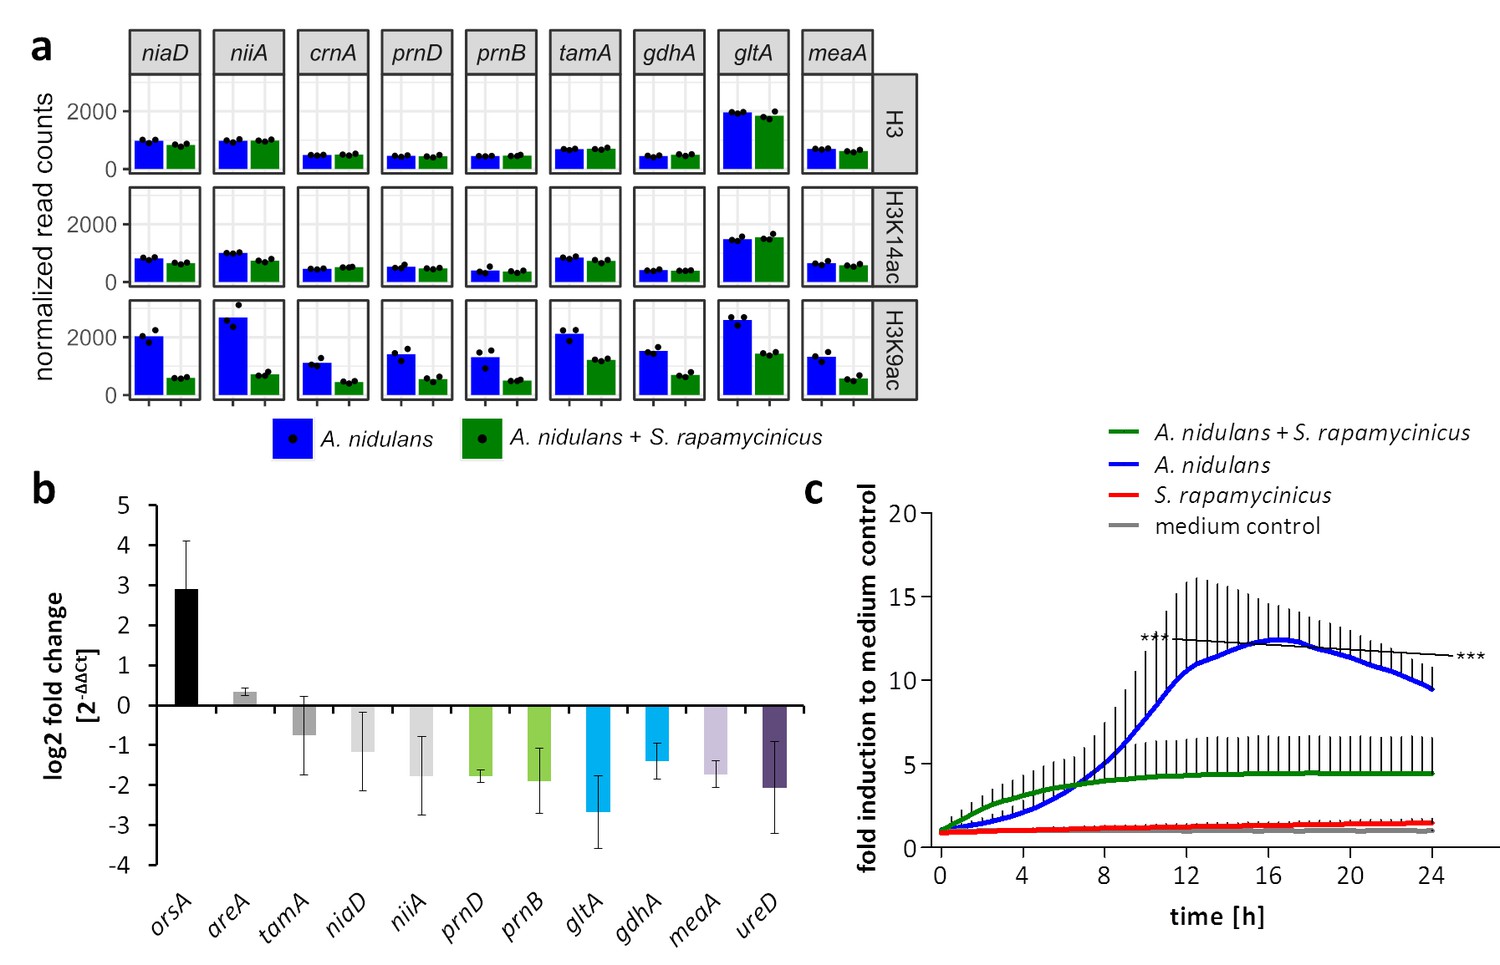
Influence of S. rapamycinicus on fungal nitrogen metabolism and mitochondrial functions.
(a) Normalized ChIP-seq read counts were used to quantify the chromatin state (H3, H3K14ac, H3K9ac) of nitrogen metabolism genes. Counts were obtained by counting reads mapping to the promoter area of each gene, which is defined as the sequence 500 bp down- and 1000 bp upstream from the TSSs. Depicted bars are calculated from three data points. (b) Transcription analysis of randomly selected genes of primary and secondary nitrogen metabolism by qRT-PCR during co-cultivation. Relative mRNA levels were measured after 3 hr and normalized to the β-actin gene expression. The transcription of orsA was used as a positive control. (c) Respiratory activity comparing A. nidulans grown in co-culture with S. rapamycinicus and A. nidulans in monoculture. Respiratory activity was determined using a resazurin assay. Data were normalized to medium. The black line shows the time points that are significantly different between A. nidulans and A. nidulans grown in co-culture with S. rapamycinicus. ***p<0.001.
Figure 3—figure supplement 1
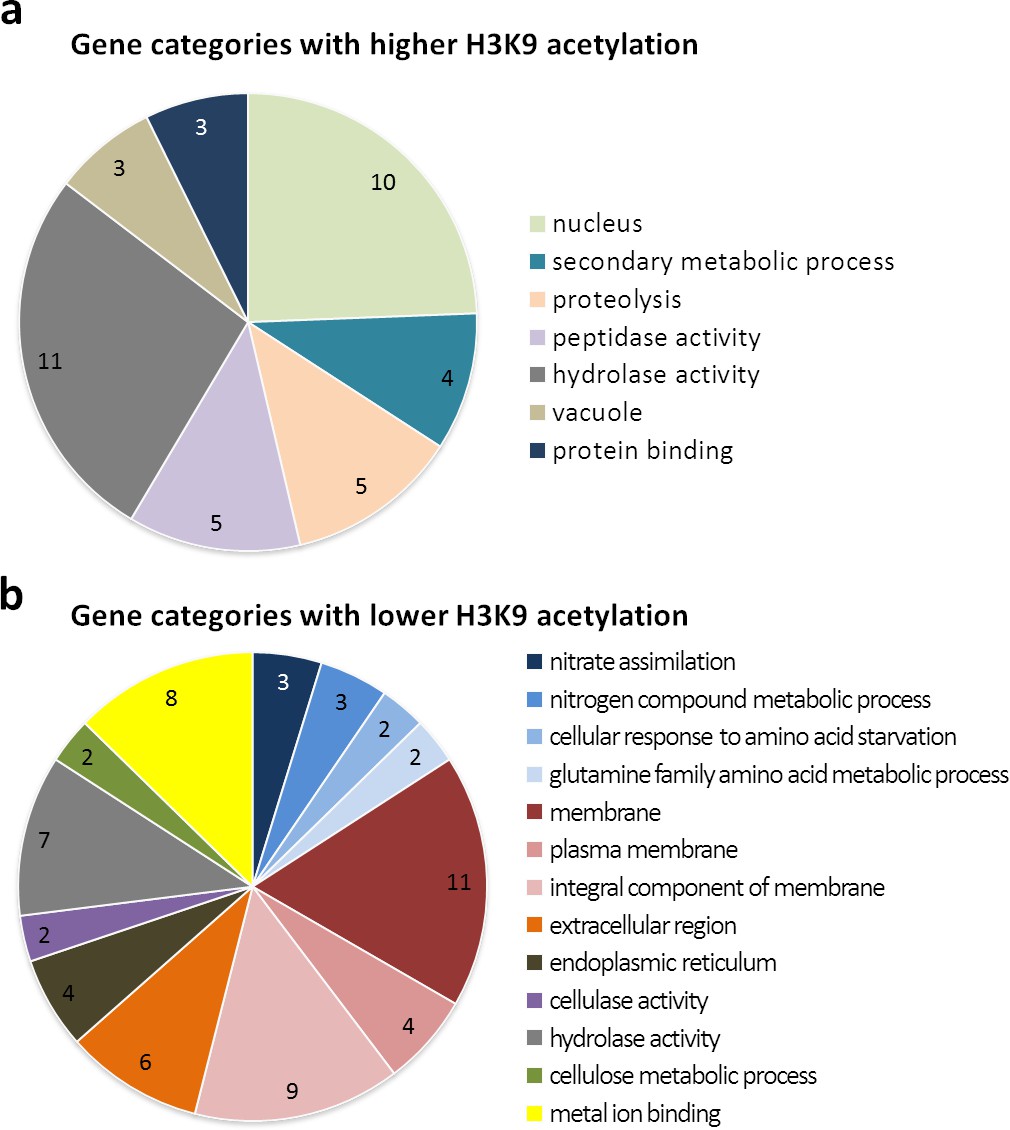
Gene ontology of the 15 most significantly enriched categories for differentially higher and lower acetylated genes at H3K9 upon co-cultivation with S. rapamycinicus.
Functional categorization of differentially higher (a) and lower (b) acetylated genes, possessing a p-value <0.05, with FungiFun2 (Priebe et al., 2015). Overrepresented categories having a p-value <0.01.
Figure 4
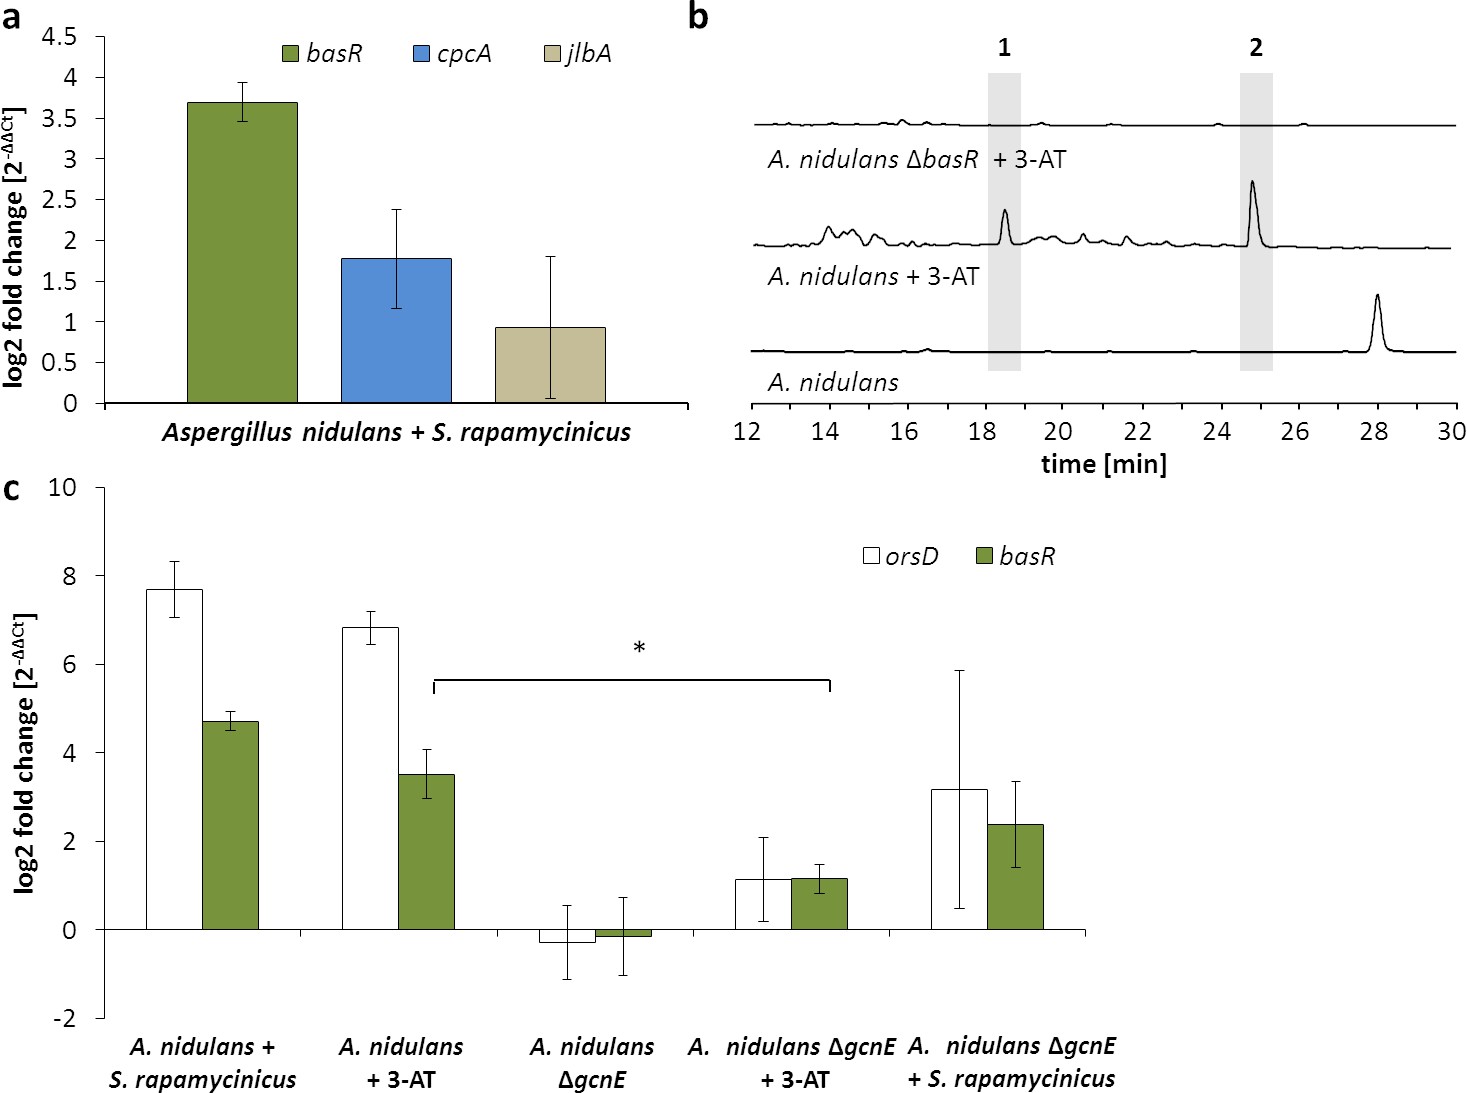
Artificial histidine starvation using 3-AT led to ors gene cluster activation.
(a) Transcription of basR, cpcA and jlbA determined by qRT-PCR after 3 hr of co-cultivation. Relative mRNA levels were compared to β-actin gene expression. (b) High-performance liquid chromatography (HPLC)-based detection of orsellinic acid (1) and lecanoric acid (2) in supernatants of A. nidulans cultures treated with 3-AT. (c) Relative transcript levels of orsA, cpcA and basR 6 hr after 3-AT addition to the A. nidulans monoculture and the gcnE deletion mutant. *p<0.05.
Figure 5 with 1 supplement
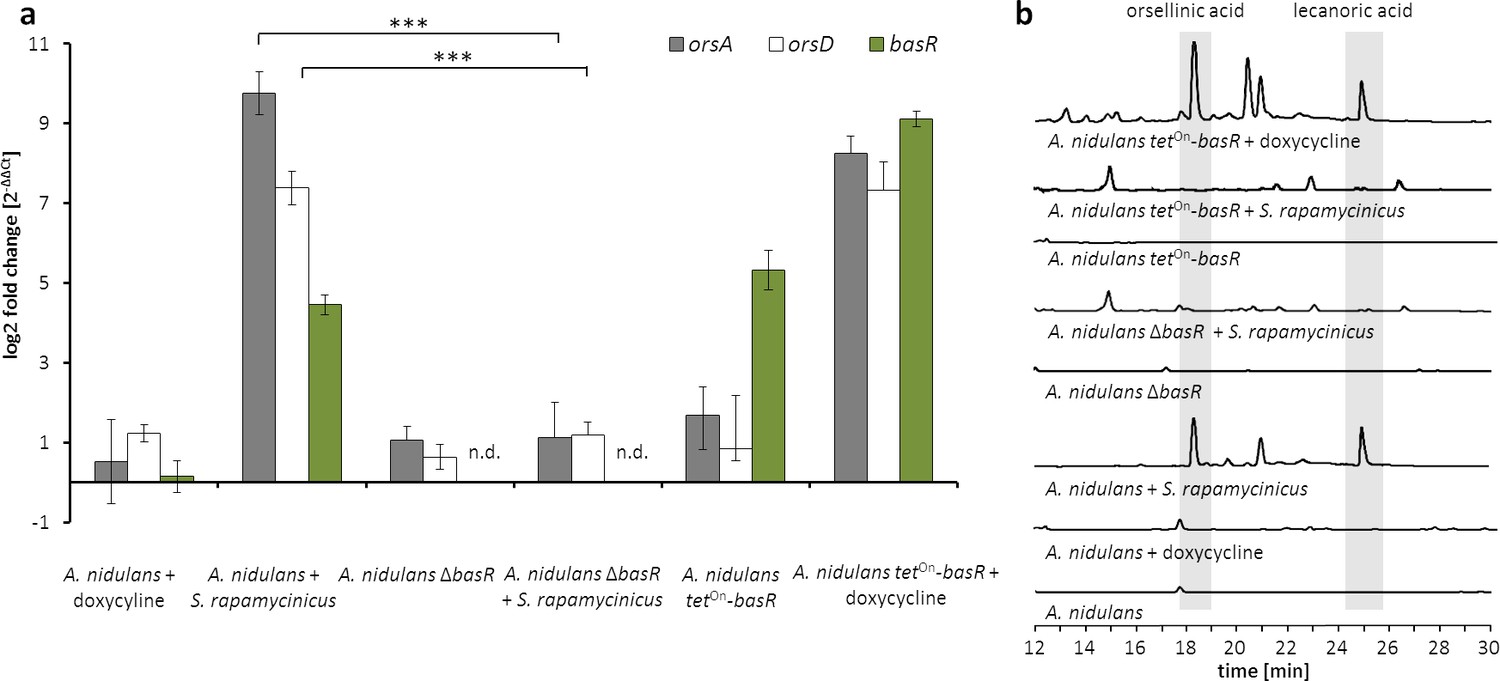
The Myb-like transcription factor BasR of A. nidulans is required for the activation of the ors gene cluster.
(a) Relative transcript levels of ors cluster genes orsA, orsD and basR after 6 hr of cultivation in ΔbasR mutant strain and tetOn-basR overexpression strain incubated with and without doxycycline. Transcript levels were measured by qRT-PCR normalized to β-actin transcript levels. (b) HPLC-based detection of orsellinic and lecanoric acid in the wild-type strain, basR deletion mutant and basR overexpression strain. n.d.: not detectable; ***p<0.001.
Figure 5—figure supplement 1
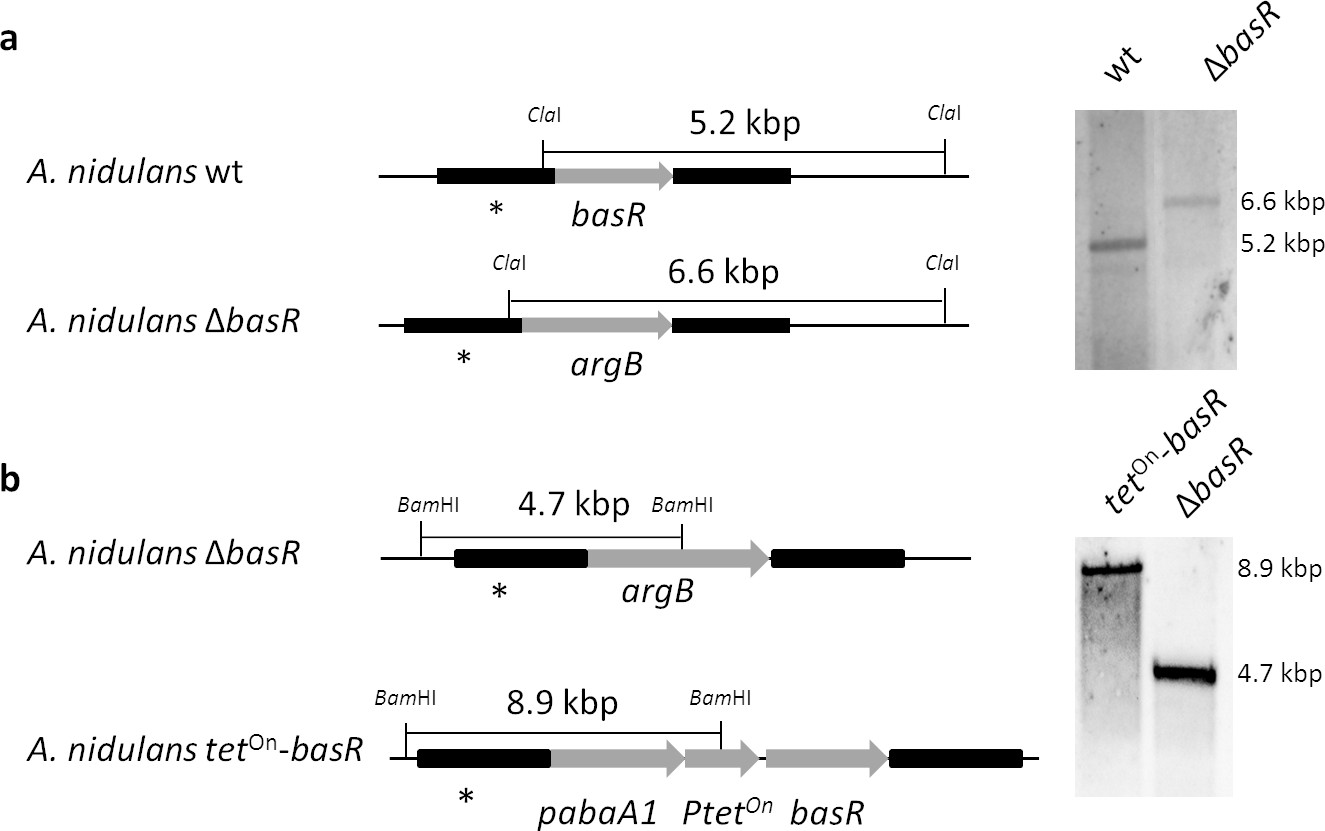
Generation of a basR deletion mutant and an inducible overexpression strain based on the A. nidulans wild-type strain A1153.
(a) Genomic organization of basR and Southern blot analysis of basR deletion. The basR gene was replaced by the argB gene. Transformant strains were checked with a probe (*) directed against the flanking region of the construct. Genomic DNA was digested with ClaI. wt, wild-type strain as a control. (b) Generation of the inducible basR overexpression strain by complementation of the basR-deletion strain. The tetOn-basR gene cassette was integrated at the ΔbasR genomic locus using the pabA1 gene as selectable marker replacing the argB marker. Genomic DNA was cut with BamHI. Transformant strains were checked with a probe (*) directed against the flanking region of the construct.
Figure 6 with 3 supplements

Co-occurrence of BasR and the orsellinic acid gene cluster in other fungi is linked to the S.rapamycinicus-triggered ors gene cluster activation.
(a) Phylogenetic analysis of BasR (AN7174; green) showing its position among other fungi. The percentage of trees in which the associated taxa clustered together is shown next to the branches. The names of the selected sequences are given according to their UniProt accession numbers. A comprehensive phylogenetic tree is depicted in Figure 6—figure supplement 1. (b) Alignment of the orsellinic acid gene clusters in the fungal species containing a basR homologue (A. nidulans, A. sydowii and A. versicolor), where orsA encodes the polyketide synthase, whereas orsB-orsE code for tailoring enzymes. (c) Liquid chromatography–mass spectrometry (LC-MS)-based detection of orsellinic and lecanoric acid in monoculture of the A. sydowii basR overexpression strain following induction with doxycycline and during co-cultivation of A. sydowii and S. rapamycinicus. LC-MS profiles of the extracted ion chromatogram (EIC) are shown for m/z 167 [M – H]–, which corresponds to orsellinate. Orsellinic (1) and lecanoric acid (2) were detected via their fragment ion orsellinate.
Figure 6—figure supplement 1
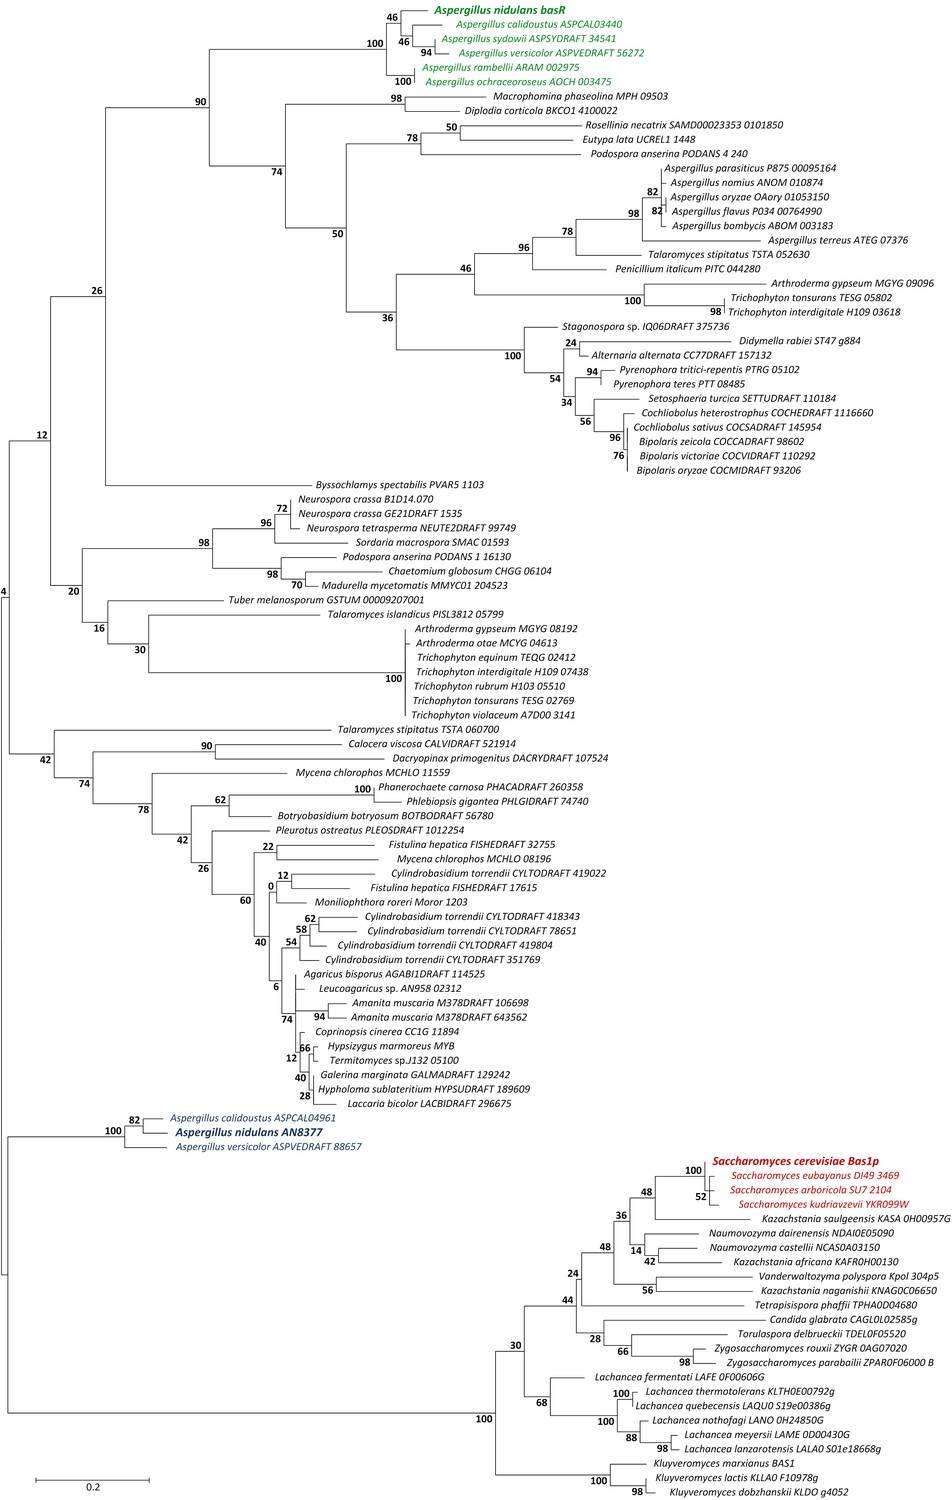
Molecular phylogenetic analysis of BasR (AN7174).
The tree reports distances between BasR-similar amino-acid sequences identified by BlastP analysis using the entire sequences. The percentage of trees in which the associated taxa clustered together is shown next to the branches. The BasR proteins from A. nidulans, A. calidoustus, A. sydowii, A. versicolor, A. rambellii and A. ochraceoroseus form a separate clade (highlighted in green text), while the yeast Bas1p-related sequences are more distantly related to BasR (in red). The second similar Myb-like transcription factor from A. nidulans (AN8377) forms a clade with orthologs from A. calidoustus and A. versicolor (in blue), which seems to be more related to Bas1p than to BasR. The names of the selected sequences are given according to their UniProt accession numbers.
Figure 6—figure supplement 2
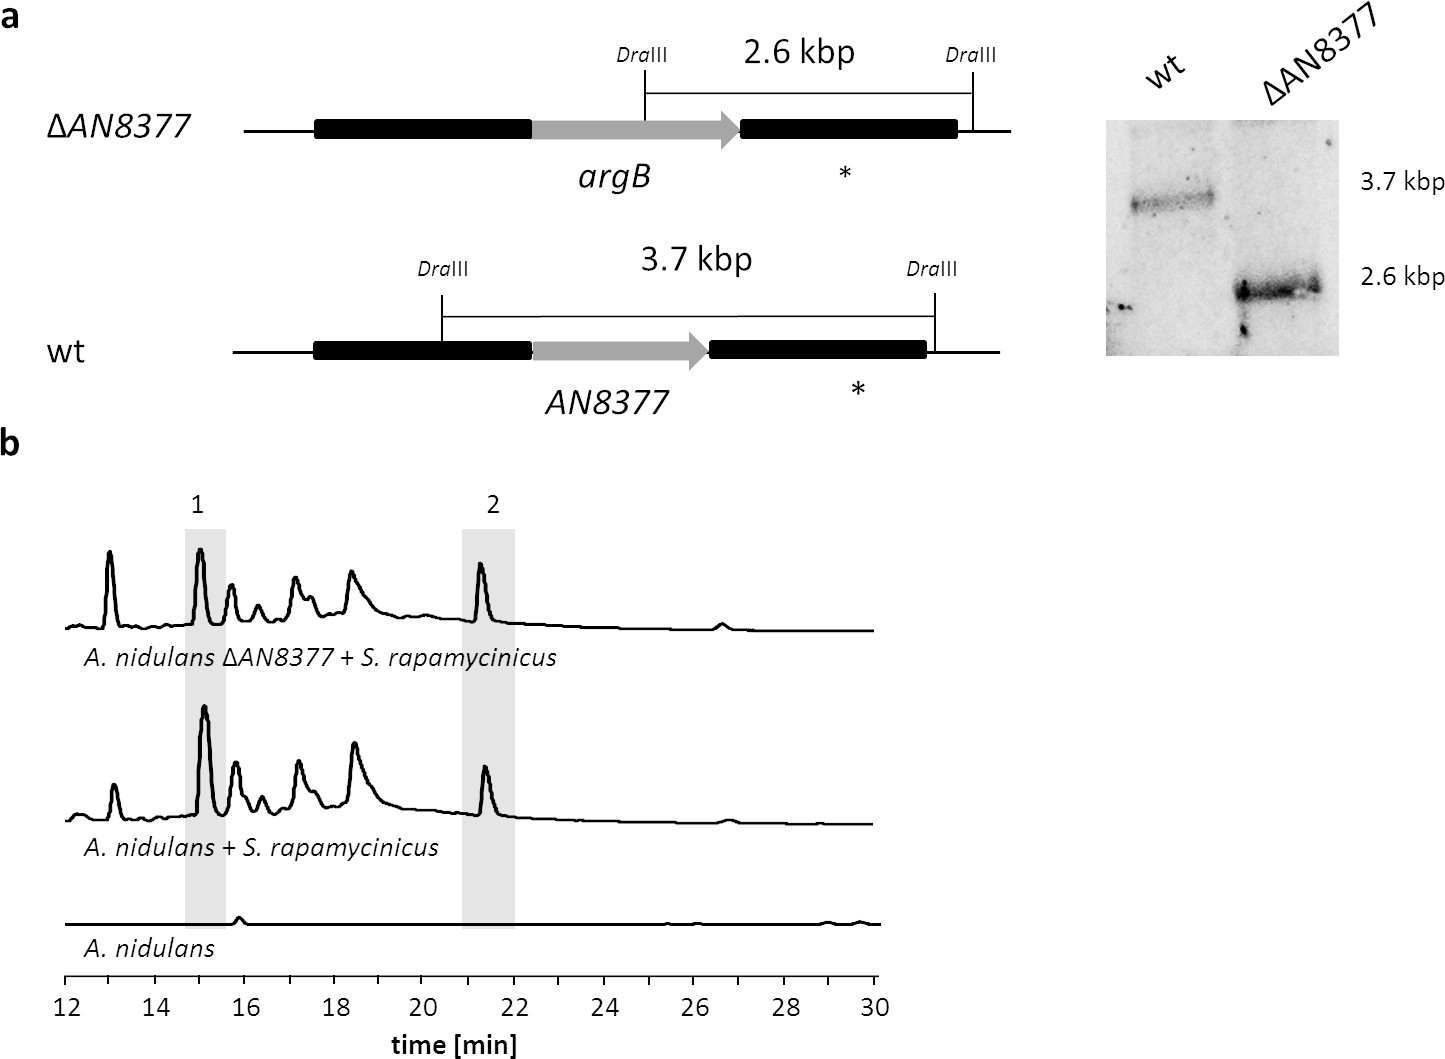
Deletion of the second putative bas1p homologous gene (AN8377) in A. nidulans and analysis of its impact on the ors gene cluster induction in response to S. rapamycinicus.
(a) Chromosomal organization of the A. nidulans AN8377 gene before and after deletion. The gene AN8377 was replaced by an argB cassette in A. nidulans wildtype strain A1153. Genomic DNA was digested with DraIII. A PCR fragment covering the downstream sequence of AN8377 was used as a probe (*). wt, wildtype strain used as a control. (b) LC-MS-based detection of orsellinic acid (1) and lecanoric acid (2) in the co-cultivation of the AN8377 deletion mutant with S. rapamycinicus.
Figure 6—figure supplement 3
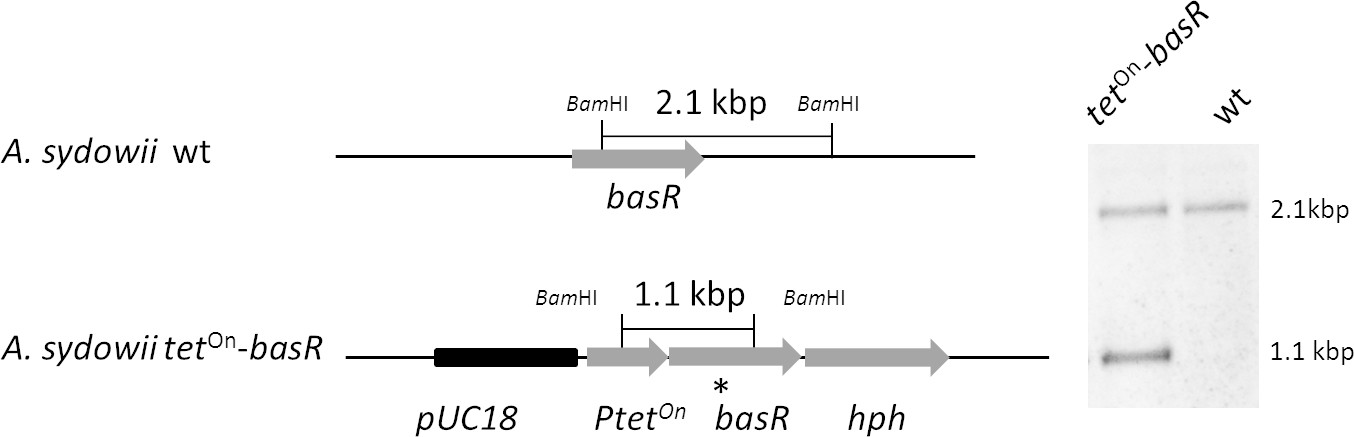
Generation of the inducible basR-overexpression strain by ectopic integration of an additional copy of the basR gene in the A. sydowii wild type strain (wt).
The tetOn–basR construct was integrated ectopically into the wildtype genome, using the hph cassette as a selectable marker. For Southern blot analysis, transformant strains were checked with a probe (*) directed against a region flanking the tetOn cassette and the basR gene. The genomic DNA was digested with BamHI.
Figure 7
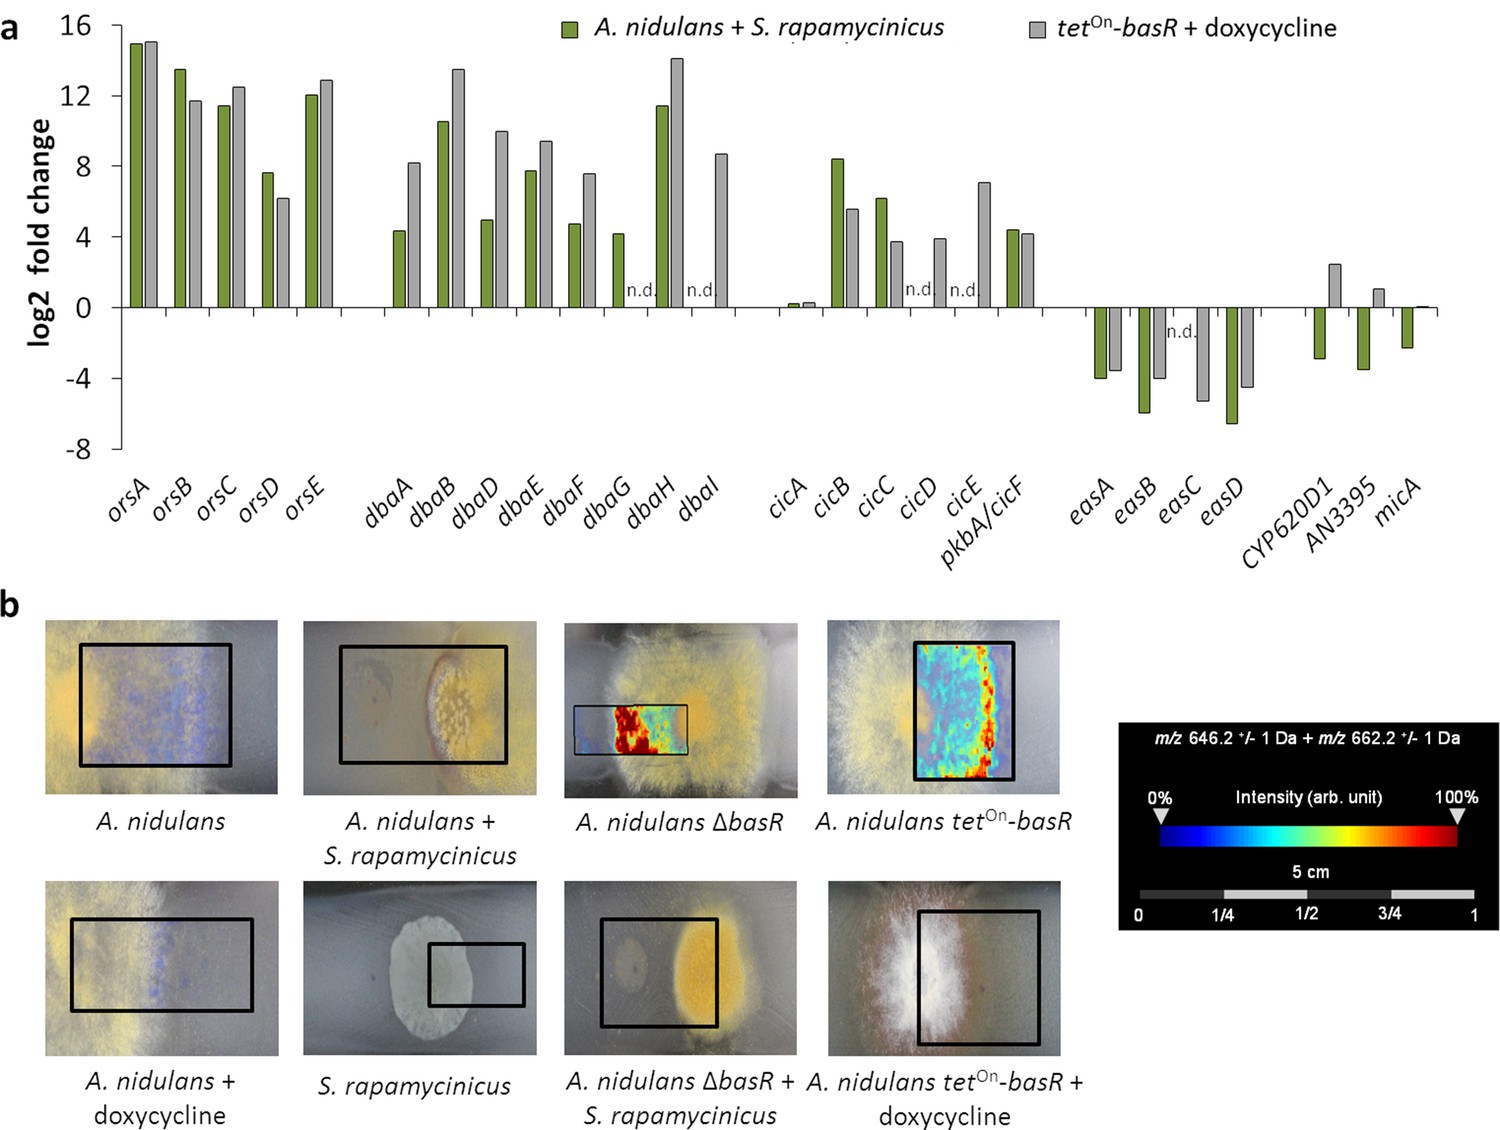
The Myb-like transcription factor BasR of A. nidulans is required for S. rapamycinicus-triggered regulation of SMs.
(a) Transcript levels of the ors, dba, cichorine, eas and microperfuranone gene clusters in A. nidulans co-cultivated with S. rapamycinicus and in the basR overexpression mutant treated with doxycycline to induce basR gene expression. Transcripts per million (TPM) values were divided by values for A. nidulans monoculture and the untreated basR-overexpression strain to obtain fold changes. (b) Visualization of ions m/z 646.3 and m/z 662.3 ± 1 Da, potentially corresponding to [M + Na]+ and [M + K]+ of emericellamide E/F (C32H57N5O7; accurate mass 623.4258), by MALDI-MS imaging. Images were corrected by median normalization and weak denoising. n.d.: not detectable.
Figure 8
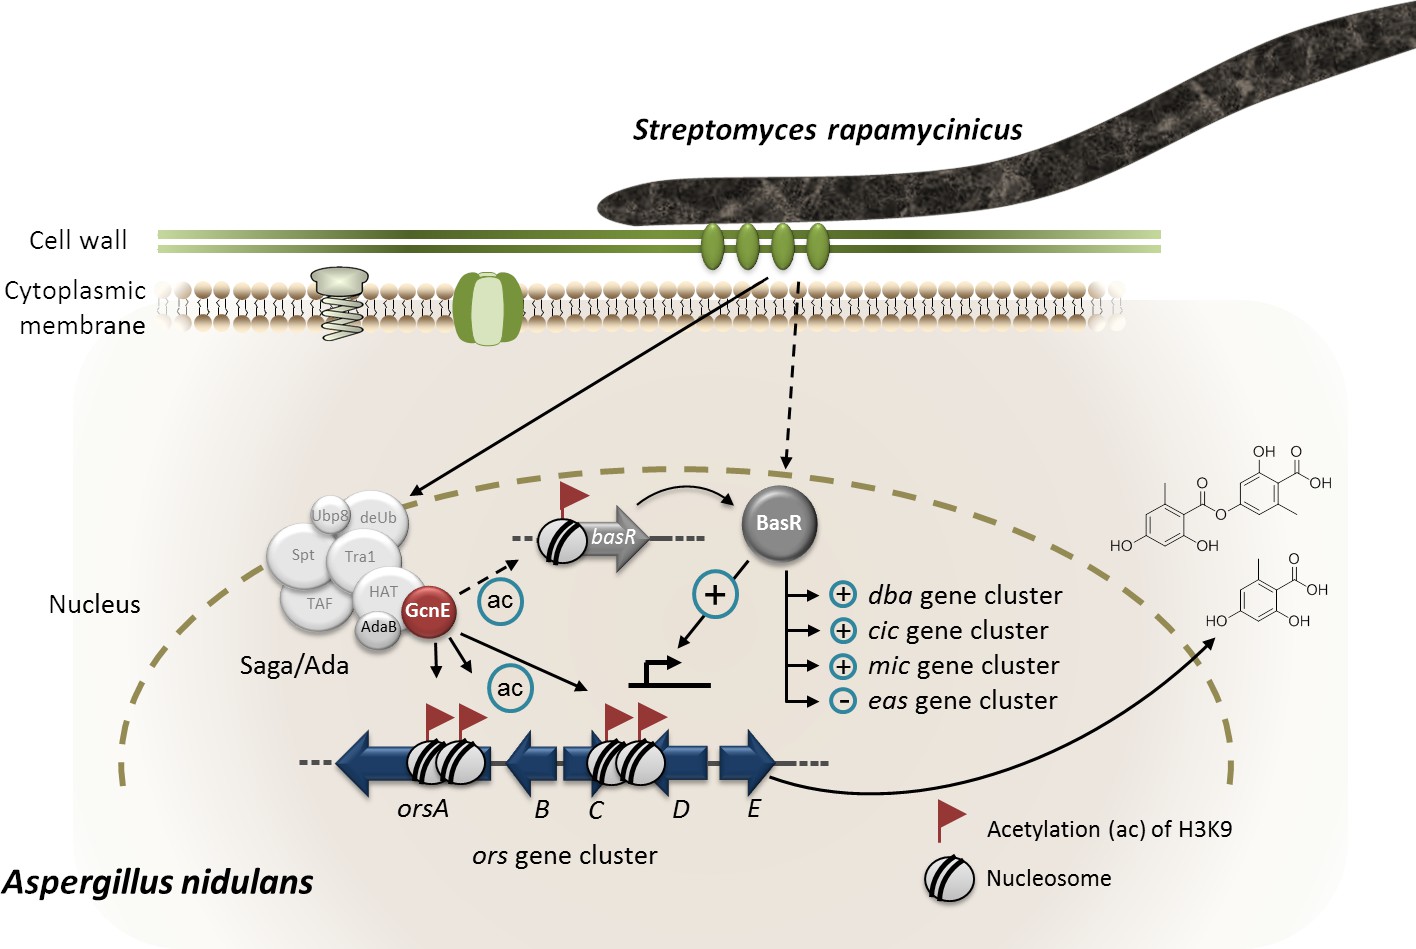
Model of S. rapamycinicus – A. nidulans interaction.
Co-cultivation leads to activation of the basR gene. The lysine acetyltransferase GcnE specifically acetylates (ac) lysine (K)9 of histone H3 at the ors gene cluster and presumably at the basR gene promoter. As a consequence, basR is expressed. The transcription factor BasR activates (+) and represses (–) the expression of the ors, cic, microperfuranone (mic) and eas gene clusters directly or indirectly. The involvement of AdaB and GcnE of the Saga/Ada complex has been experimentally proven (Nützmann et al., 2011).
Appendix 1—figure 1
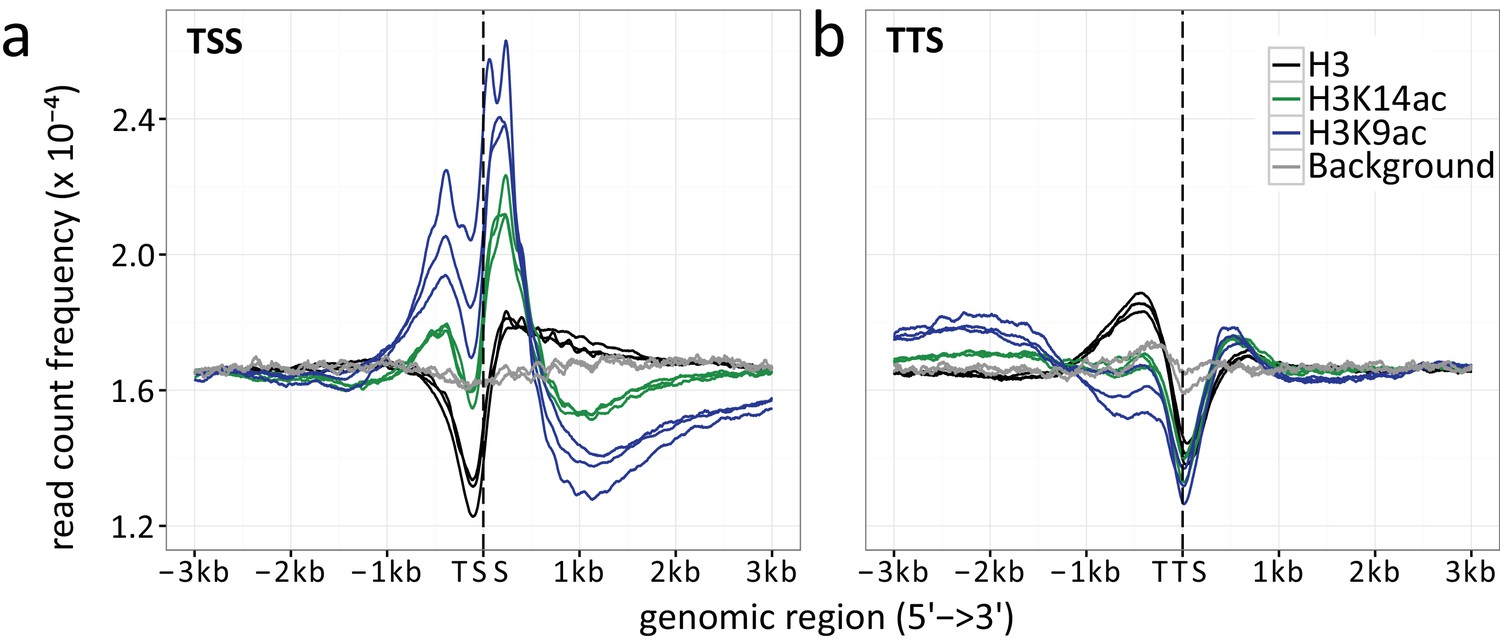
Read count frequencies for (a) TSSs and (b) TTSs.
Lines correspond to the relative enrichment of ChIP signal strength relative to the TSS/TTS averaged across all genes. ChIP-seq read count serves as a surrogate for signal strength (see methods for further details). Compared were the enrichment of histone H3 (black), H3K9ac (blue), H3K14ac (green) and the background control (gray) over an average of all TSSs and TTSs. The enrichment curves for all biological replicates are given, indicated by multiple lines per enrichment target.
Appendix 1—figure 2
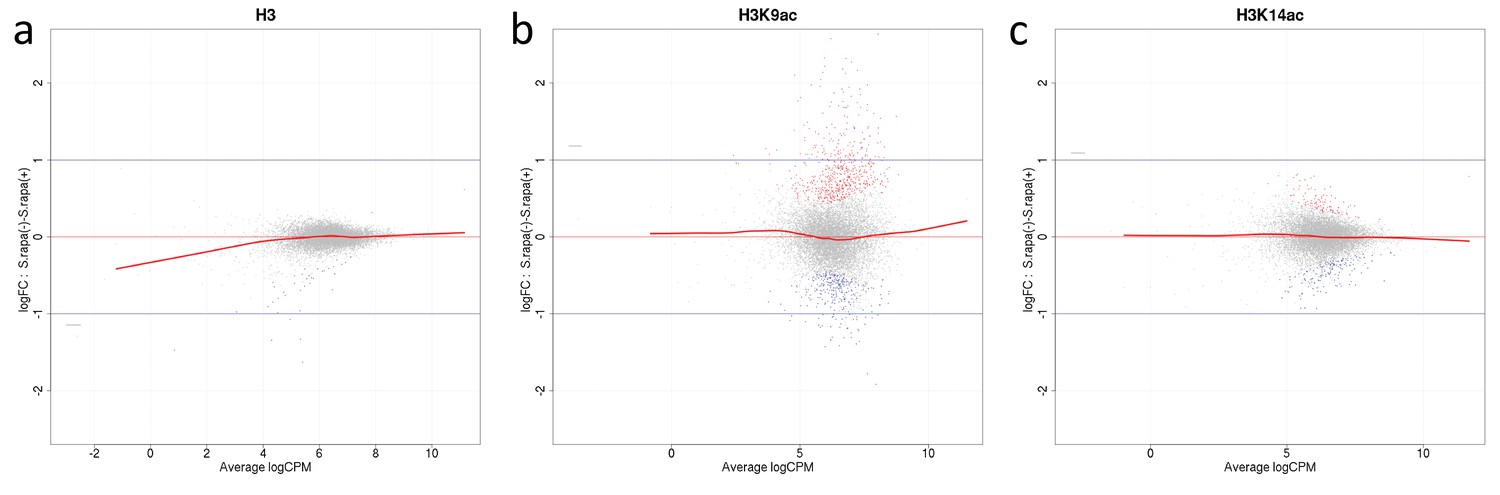
Mean average (MA) plots comparing normalized ChIP-seq LFCs H3(Cterm) (a), H3K14ac (b) and H3K9ac (c) of each gene between A. nidulans monoculture and co-culture for antibodies used in this study.
The y-axis indicates LFCs of ChIP signal between mono- and co-culture for each gene which corresponds to the dots. The x-axis indicates mean intensity of ChIP signal of both conditions. Genes were colored according to DCS outcome with gray indicating genes with no significant change of ChIP signal, red and blue indicate genes showing respective higher or lower signal in co-culture.
Appendix 1—figure 3

Correlation of data points for LFCs of ChIP-seq with LFCs of microarray data for all A. nidulans genes, depicting single data points and the correlation coefficient.
https://doi.org/10.7554/eLife.40969.026
Appendix 1—figure 4
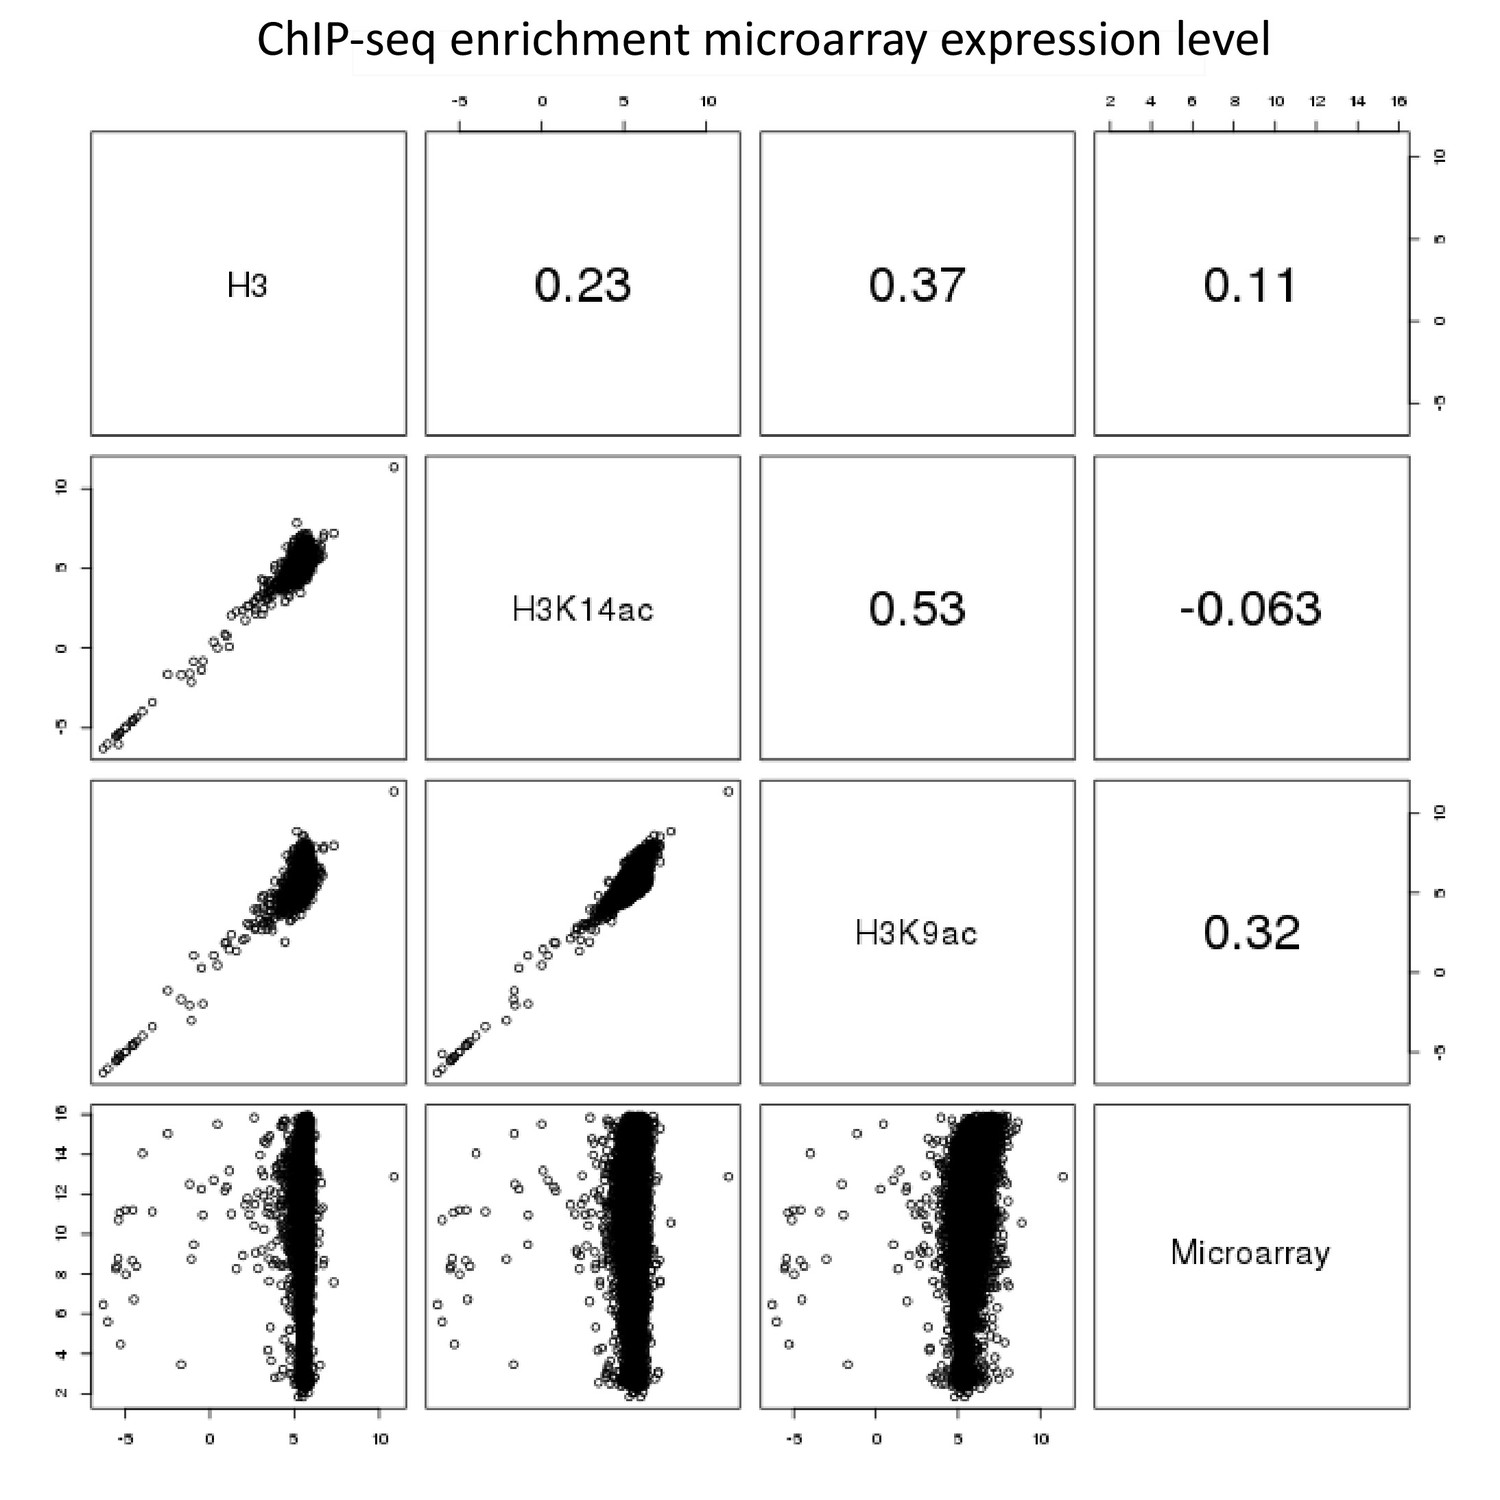
Pairwise comparison of ChIP-seq and microarray intensities of all genes in A. nidulans monoculture.
The numbers resemble the correlation coefficient for the respective comparison. Intensity defines enrichment of number of reads per gene.
Appendix 1—figure 5
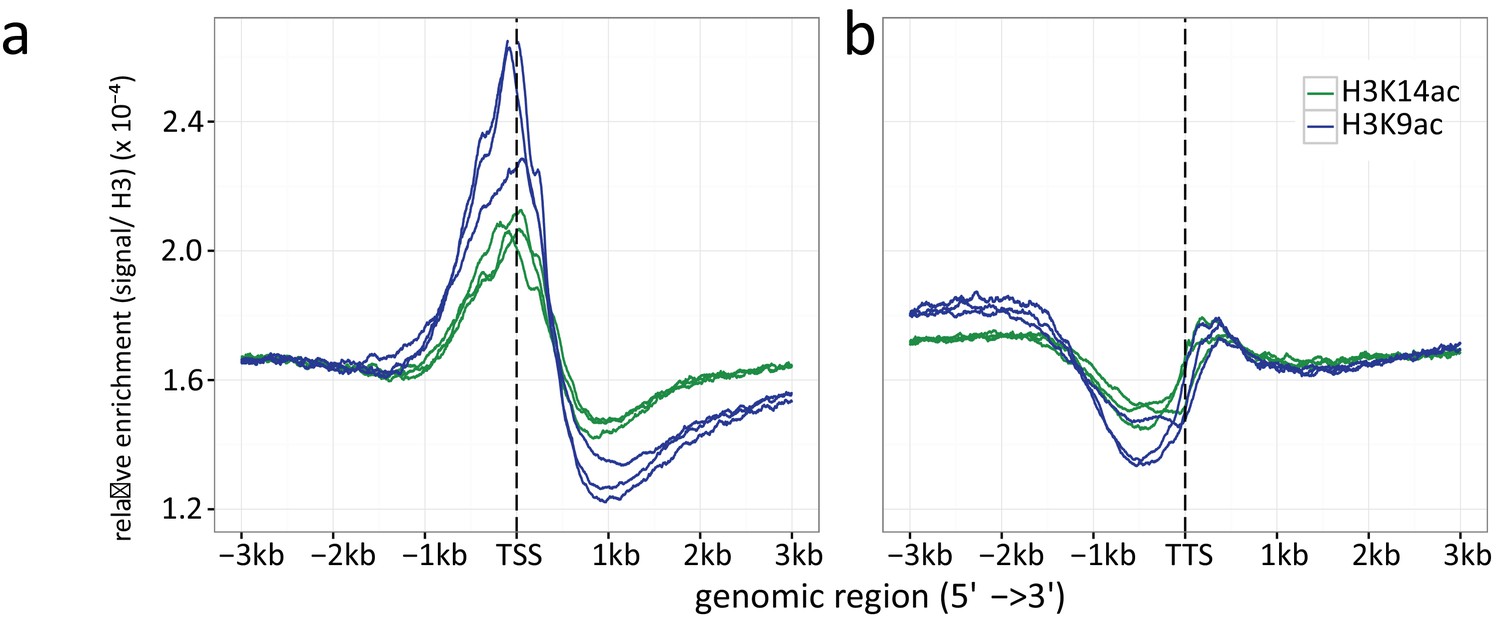
Histone H3 normalized read count frequencies for H3K9ac (green) and K14 ac (blue) at the (a) TSSs and (b) TTSs.
The enrichment is given in signal to H3 ratio. Multiple lines per ChIP target resemble the three independent biological replicates.
Appendix 1—figure 6
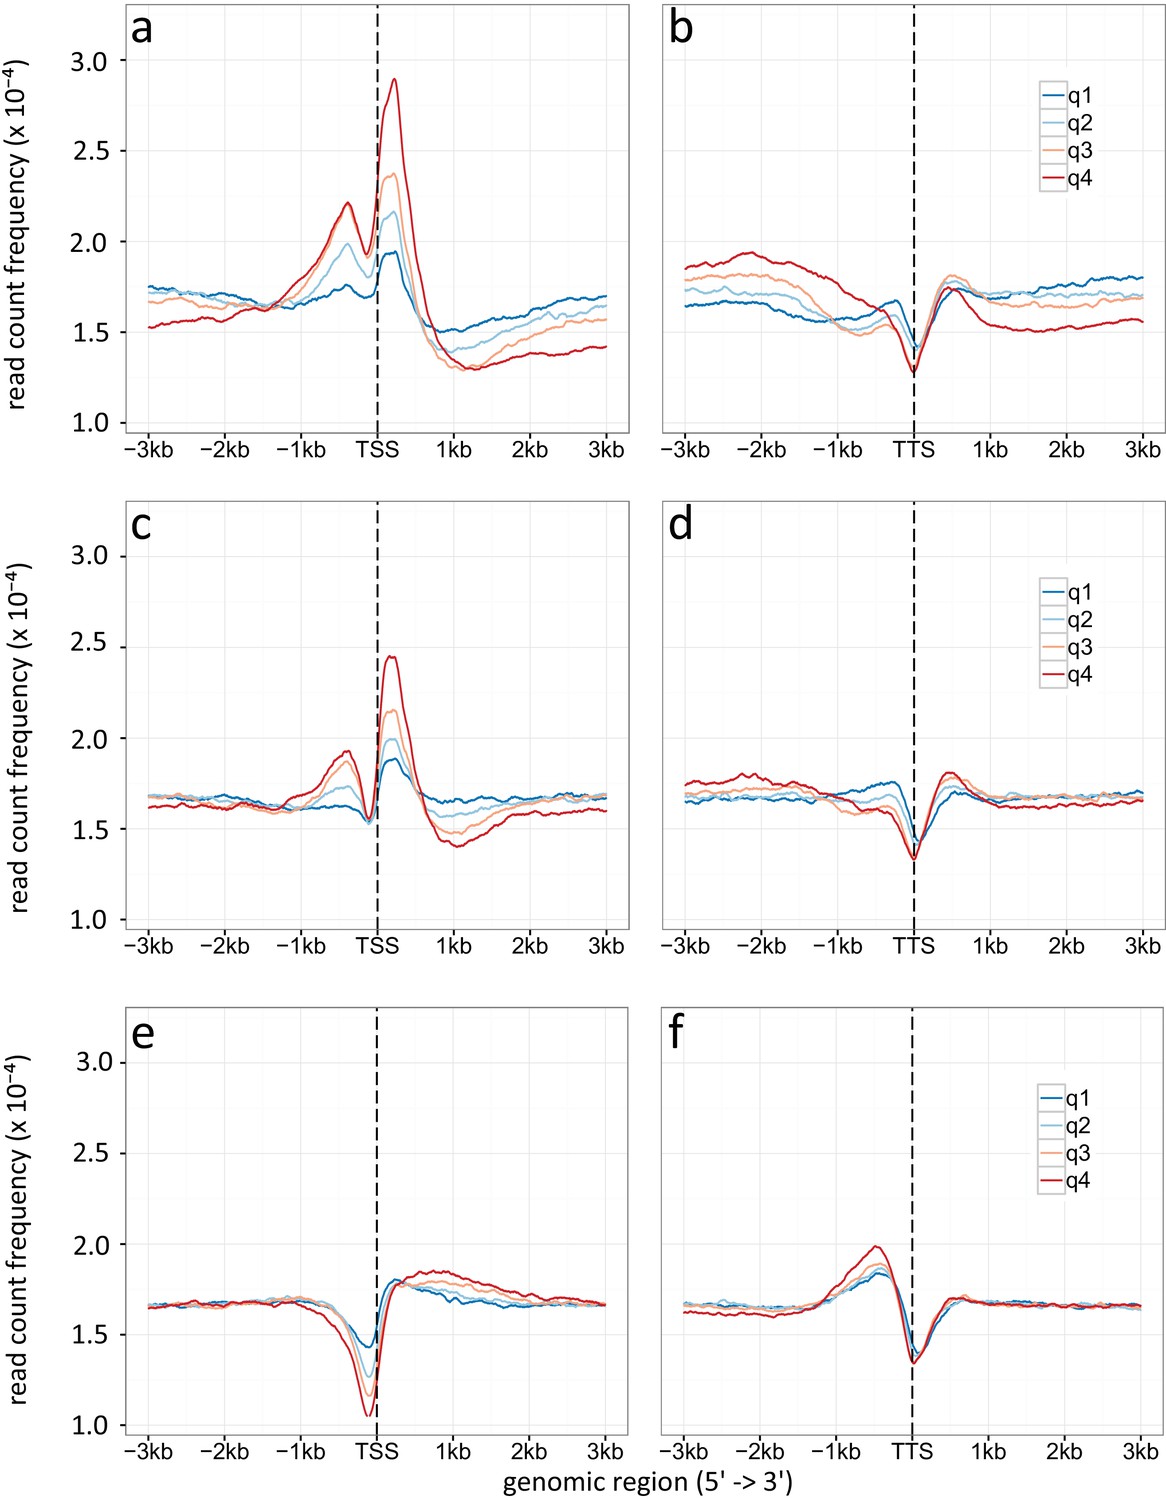
Density plot of TSSs (a, c, e) and TTSs (b, d, f) given for different gene expression levels (q1-q4).
(a, b) Specific enrichment of H3K9ac, (c, d) H3K14ac and (e, f) H3 is given in read count frequency. q1 are the lower 25 %, q2 the medium lower 25 – 50 %, q3 are the medium high 50-75 %, q4 the higher 25 %.
Appendix 1—figure 7
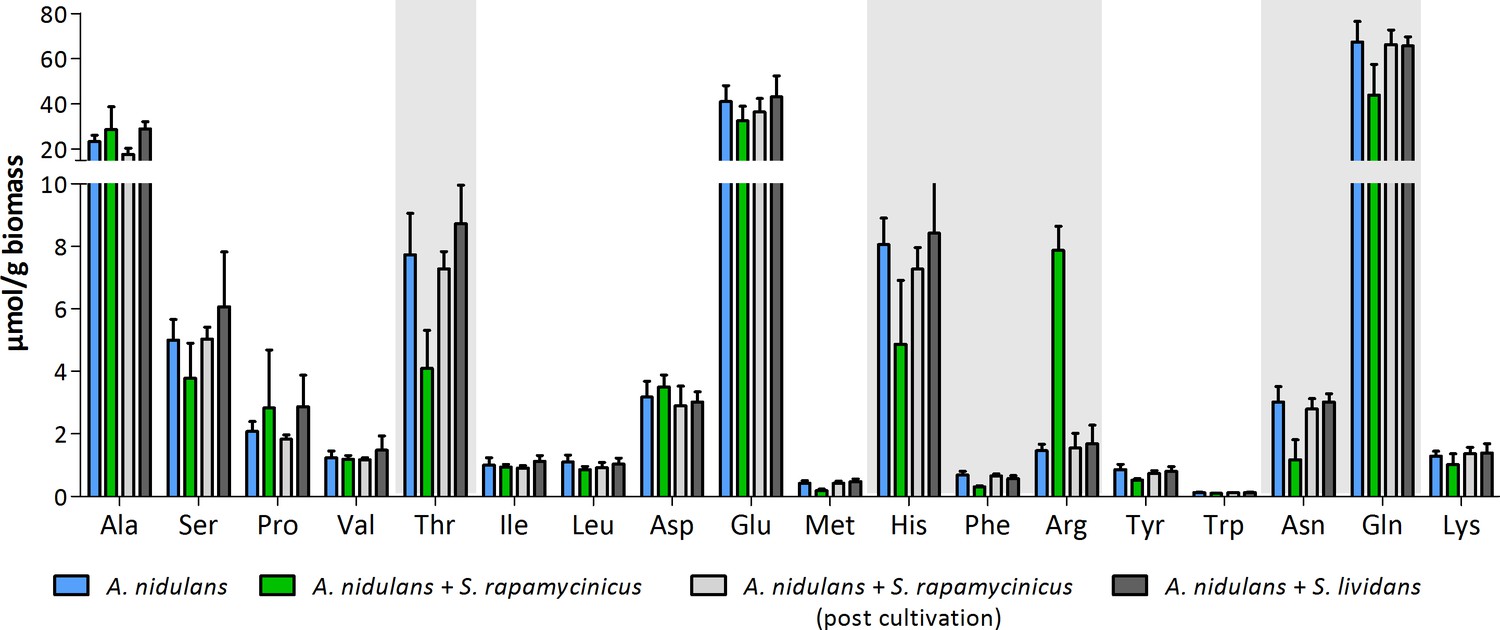
Intracellular amino acid concentration of A. nidulans in monoculture and co-culture with S. rapamycinicus.
Co-cultivation with S. lividans and addition of S. rapamycinicus after 24 hours of cultivation served as negative controls. Furthermore, before extraction of amino acids the fungus (post cultivation) was also supplemented with S. rapamycinicus to exclude a bias resulting from bacterial amino acids. Threonine, histidine, phenylalanine, arginine, asparagine and glutamine showing different concentrations in co-culture compared to monoculture are highlighted in gray.
Tables
Key resources table
| Reagent type (species) or resource | Designation | Source or reference | Identifiers | Additional information |
|---|---|---|---|---|
| Strain, strain background (Aspergillus nidulans) | FGSC A1153 | Nayak et al., 2006 | yA1, pabaA1; argB2; pyroA4, nkuA::bar | |
| Strain, strain background (Aspergillus nidulans) | A1153∆gcnE | Nützmann et al. (2011) | yA1, pabaA1; gcnE::argB2; pyroA4, nkuA::bar | |
| Strain, strain background (Aspergillus nidulans) | A1153∆basR | This study | yA1, pabaA1; basR::argB2; pyroA4, nkuA::bar | |
| Strain, strain background (Aspergillus nidulans) | A1153tetOn-basR | This study | yA1, pabaA1; argB2::pabaA1-tetOn-basR; pyroA4, nkuA::bar | |
| Strain, strain background (Aspergillus nidulans) | A1153∆AN8377 | This study | yA1, pabaA1;AN8377::argB2;pyroA4, nkuA::bar | |
| Strain, strain background (Aspergillus nidulans) | A1153gcnE-3xflag | Nützmann et al., 2011 | yA1, pabaA1; gcnE::gcnEp-gcnE-3x-flag-pabaA1; pyroA4, nku::bar | |
| Strain, strain background (Aspergillus sydowii) | CBS 593.65 | Westerdijk Fungal Bio Diversity Institute, The Netherlands | ||
| Strain, strain background (Aspergillus sydowii) | A. sydowii tetOn-basR | This study | Ectopic integration of pUC18 tetON-A. sydowii basR-hph | |
| Strain, strain background (Streptomyces rapamycinicus) | ATCC 29253 | Kumar and Goodfellow, 2008 | ||
| Strain, strain background (Streptomyces lividans) | TK24 | Cruz-Morales et al., 2013 | ||
| Antibody | ANTIFLAG M2 | Sigma-Aldrich, Taufkirchen, Germany | F3165-5MG | |
| Antibody | Rabbit polyclonal anti-histone H3 | Abcam, Cambridge, UK | ab1791 | |
| Antibody | Rabbit polyclonal histone H3K9ac | Active Motif, La Hulpe, Belgium | 39137 | |
| Antibody | Rabbit polyclonal anti-acetyl-histone H3 (Lys14) | Merck Millipore, Darmstadt, Germany | 07 – 353 | |
| Commercial assay or kit | Universal RNA Purification Kit | Roboklon, Berlin, Germany | E3598 | |
| Chemical compound, drug | Digoxigenin-11-dUTP | Jena BioScience, Jena, Germany | NU-803 | |
| Software, algorithm | GraphPad Prism 5 | GraphPad Software Inc., La Jolla, USA | ||
| Software, algorithm | Bioconductor package regioneR | Gel et al. (2016) | ||
| Software, algorithm | Bioconductor package edgeR | Robinson and Oshlack (2010) | ||
| Software, algorithm | MACS, version 2.0.1 | Zhang et al. (2008) | ||
| Software, algorithm | MUSCLE | Edgar (2004) | ||
| Software, algorithm | Integrative Genomics Viewer | Thorvaldsdóttir et al. (2013) | ||
| Software, algorithm | MEGA6 | Tamura et al. (2013) | ||
| Software, algorithm | Shimadzu Class-VP software (version 6.14 SP1) | Shimadzu, Duisburg, Germany |
Additional files
-
Supplementary file 1
Summary of DCS analysis of H3K9ac between A. nidulans monoculture and co-cultivation with S. rapamycinicus.
Genes that are aceylated at significantly higher levels are marked in red whereas those that are acetylated at lower levels are marked in blue.
- https://doi.org/10.7554/eLife.40969.017
-
Supplementary file 2
List of selected genes with differentially acetylated H3K9 and different expression.
- https://doi.org/10.7554/eLife.40969.018
-
Supplementary file 3
Summary of RNA-seq data.
List of selected differentially expressed genes in A. nidulans wild type and in the A. nidulans tetOn-basR mutant in response to S. rapamycinicus or after doxycycline addition.
- https://doi.org/10.7554/eLife.40969.019
-
Supplementary file 4
List of primers used in this study.
- https://doi.org/10.7554/eLife.40969.020
-
Supplementary file 5
Summary of ChIP-seq data.
- https://doi.org/10.7554/eLife.40969.021
-
Transparent reporting form
- https://doi.org/10.7554/eLife.40969.022
Download links
A two-part list of links to download the article, or parts of the article, in various formats.
Downloads (link to download the article as PDF)
Open citations (links to open the citations from this article in various online reference manager services)
Cite this article (links to download the citations from this article in formats compatible with various reference manager tools)
Chromatin mapping identifies BasR, a key regulator of bacteria-triggered production of fungal secondary metabolites
eLife 7:e40969.
https://doi.org/10.7554/eLife.40969


