Activation mechanism of ATP-sensitive K+ channels explored with real-time nucleotide binding
- University of Oxford, United Kingdom
Figures
Figure 1 with 5 supplements
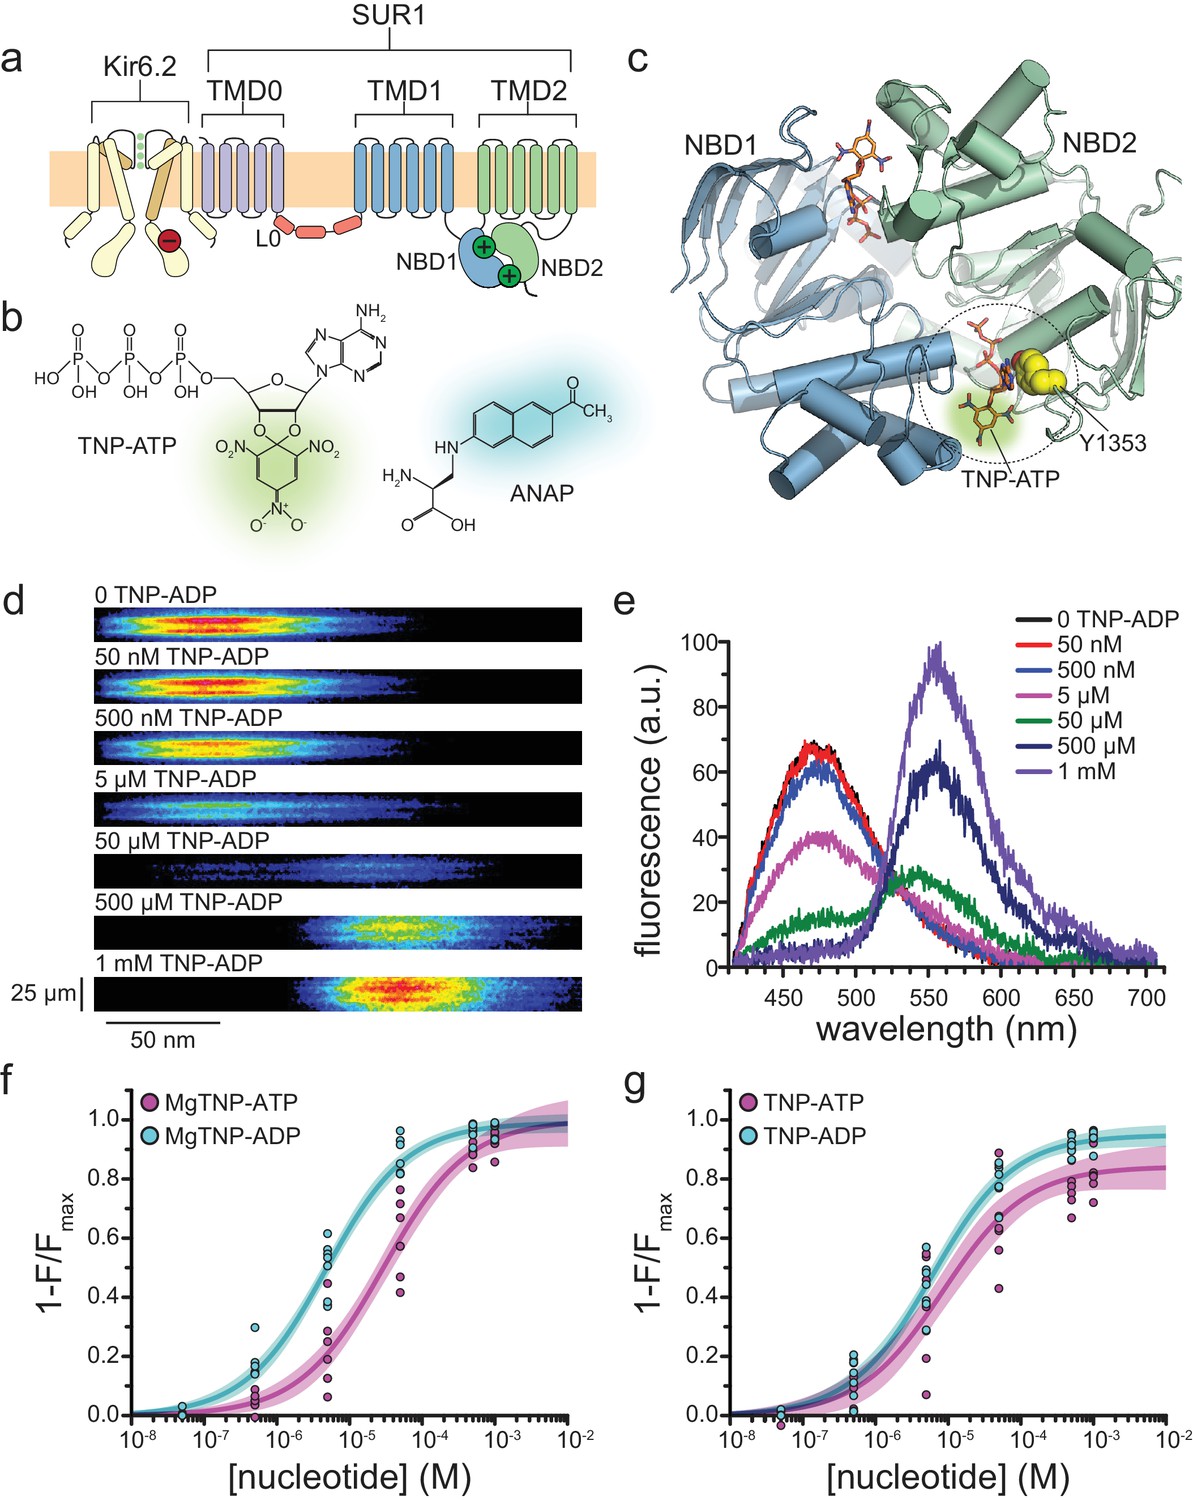
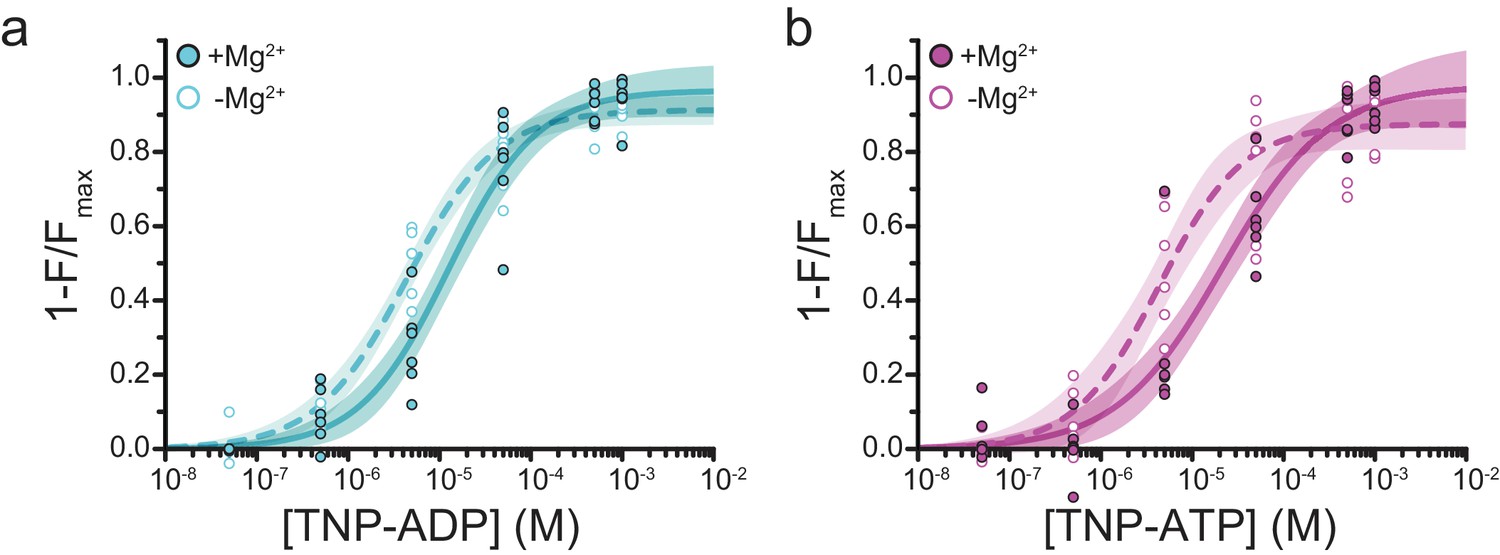
Measuring binding to NBS2 of SUR1.
(a) Cartoon illustrating the topology of the KATP channel complex. Two (of four) Kir6.2 subunits and one (of four) SUR1 subunits are shown for clarity. The locations of the inhibitory (red, on Kir6.2) and stimulatory (green, on SUR1) NBSs are indicated. (b) Chemical structures of TNP-ATP and ANAP. The fluorescent moiety is colored in each. (c) Structure of the ligand-bound NBDs of SUR1 (from PDB accession # 6C3O) (Lee et al., 2017). TNP-ATP (from PDB accession # 3AR7) was positioned in both NBSs of SUR1 by alignment with MgATP (at NBS1) and MgADP (at NBS2), which were present in the original structure (Toyoshima et al., 2011). Y1353 from the A-loop of NBS2 is highlighted in yellow to mark the location of ANAP in our experiments. Alignment of TNP-ATP with nucleotides bound to NBS1 and NBS2 in the cryo-EM structure of SUR1 does not predict any structural clashes. (d) Representative spectral images acquired from an unroofed membrane fragment expressing SUR1-Y1353*/Kir6.2 channels in the absence or presence of increasing concentrations of TNP-ADP. (e) Averaged spectra from (d). (f) Concentration-response relationships for binding of MgTNP-ATP (magenta) and MgTNP-ADP (cyan) to SUR1-Y1353*/Kir6.2. Combined data from multiple experiments in (f) and (g) were fit to Equation 1 (solid lines, shaded areas represent 95% confidence). MgTNP-ATP: Emax = 1.00 ± 0.05, EC50 = 29.3 µM±6.5 µM, h = 0.8 ± 0.1. MgTNP-ADP: Emax = 0.99 ± 0.02, EC50 = 4.8 µM±0.5 µM, h = 0.8 ± 0.1. (g) Concentration-response relationships for binding of TNP-ATP and TNP-ADP to SUR1-Y1353*/Kir6.2 channels in the absence of Mg2+. TNP-ATP: Emax = 0.84 ± 0.04, EC50 = 8.5 µM±2.4 µM, h = 0.8 ± 0.1. TNP-ADP: Emax = 0.95 ± 0.02, EC50 = 6.1 µM±0.7 µM, h = 0.8 ± 0.1. Increasing the concentration of TNP-ADP to 10 mM did not significantly change the amount of quenching (n = 3, data not shown).
Figure 1—figure supplement 1
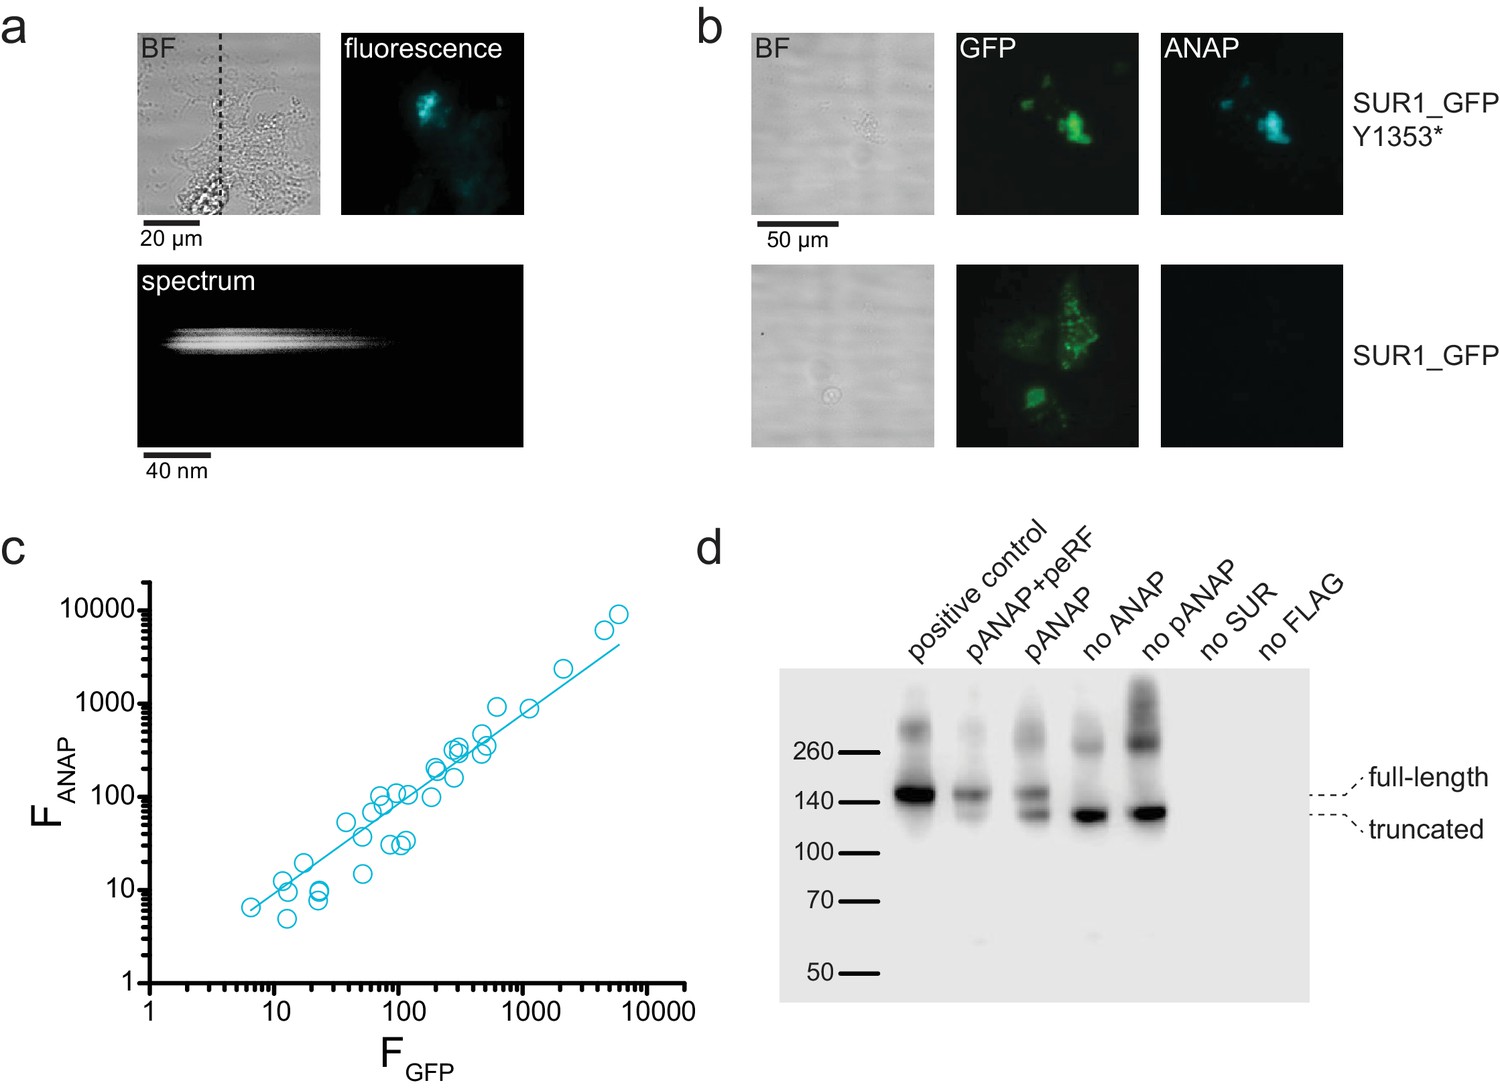
ANAP fluorescence is specific to SUR-Y1353* in unroofed membrane fragments.
(a) above. Brightfield (BF) and fluorescence images of an unroofed membrane fragment from an HEK-293T cell expressing SUR1-Y1353*/Kir6.2. The dashed line indicates the position of the spectrograph slit. below. Image of the fluorescence from the same membrane after the light was diffracted by the grating of the spectrograph. Spatial information in the y dimension is preserved. Spatial information in the x dimension is replaced by wavelength. (b) Brightfield (BF) and fluorescence images of unroofed membrane fragments from HEK-293T cells expressing SUR1_GFP-Y1353*/Kir6.2 (above) and SUR1_GFP/Kir6.2 (below). Fluorescence images were acquired and scaled identically for each fluorophore. Note the absence of ANAP fluorescence in the membrane expressing SUR1_GFP, despite presence of ANAP in the cell culture medium. (c) Intensity of ANAP fluorescence as a function of GFP fluorescence (n = 34). Data were fit with a straight line with the intercept fixed to 0 and a slope of 0.96 ± 0.02 (R = 0.99). (d) Western blot for 3xFLAG-tagged SUR1 subunits expressed in HEK-293T cells. All cells were co-transfected with Kir6.2. Unless otherwise indicated, all cells were cultured in 20 μM ANAP. The first lane (positive control) was 3xFLAG_SUR1 with no amber stop codon at position 1353, which shows only full-length protein. The next two lanes show 3xFLAG_SUR1-Y1353stop co-transfected with pANAP and peRF1-E55D (92% full-length SUR1), or with pANAP alone (66% full-length SUR1). Omission of pANAP (lane 5) or exclusion of ANAP from the cell culture medium (lane 4) resulted in only truncated protein. Background signal is shown in the last two lanes in which either no SUR1 was transfected or untagged SUR1 was used. The positions of the full-length and truncated protein (at amino acid 1352) are marked. Upper bands (~260 kDa and higher) are from aggregated SUR1 protein.
Figure 1—figure supplement 2
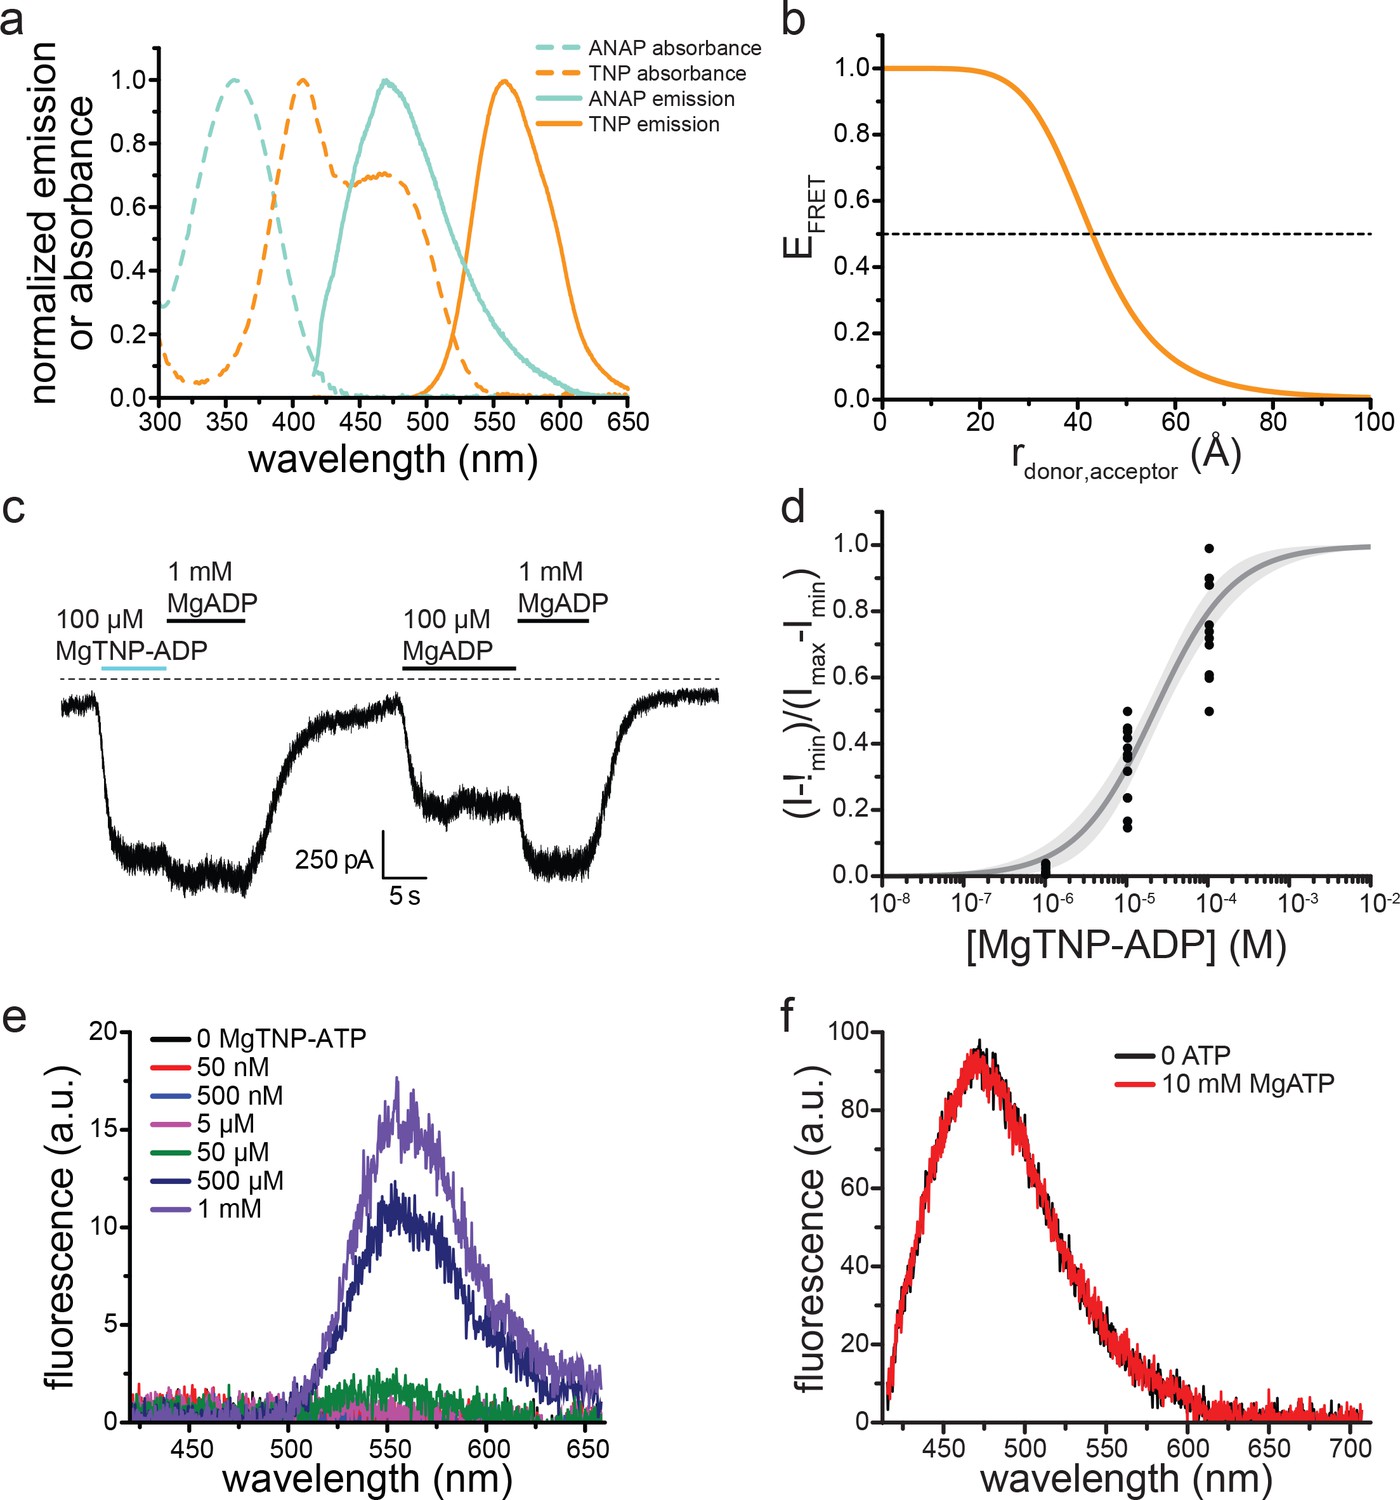
TNP-nucleotides are suitable for measuring nucleotide binding to KATP.
(a) Absorbance spectra (dashed lines) and emission spectra (solid lines) for TNP-ADP (orange) and ANAP (cyan). Note the overlap between the absorbance spectrum of TNP-ADP (orange, dashed) and the emission spectrum of ANAP (cyan, solid). The ANAP absorption spectrum and the TNP-ADP spectra were acquired in aqueous solution. ANAP emission was measured from SUR1-Y1353*/Kir6.2 in unroofed membrane fragments. (b) Theoretical FRET efficiency as a function of distance calculated from theFörster equation given the spectral overlap shown in (a). Half maximal FRET efficiency (R0) occurs at 43 Å. κ2 was assumed to be 0.67 (i.e. random orientation between the donor and acceptor was assumed) and the quantum yield of ANAP was assumed to be 0.22 (Zagotta et al., 2016).(c) Representative trace showing activation of SUR1/Kir6.2-G334D KATP channels in an inside-out patch by MgADP and MgTNP-ADP. (d) Activation of SUR1/Kir6.2-G334D currents by MgTNP-ADP in inside-out patches. Combined data from multiple experiments were fit to Equation 5. EC50 = 22.1 µM±3.0 µM, h = 0.9 ± 0.1. (e) MgTNP-ATP ‘binding’ to an unroofed membrane fragment from an HEK-293T cell transfected with pANAP (but no Kir6.2 or SUR1) and incubated in media with 20 μM ANAP. No ANAP fluorescence was observed, but non-specific MgTNP-ATP fluorescence was observed at nucleotide concentrations of 50 μM and higher. (f) Spectra of SUR1-Y1353*/Kir6.2 channels in an unroofed membrane fragment in the absence or presence of 10 mM MgATP. The intensity in 10 mM MgATP was 98 ± 2% of the original peak (n = 7) and 101 ± 2% in 10 mM MgADP (n = 8).
Figure 1—figure supplement 3
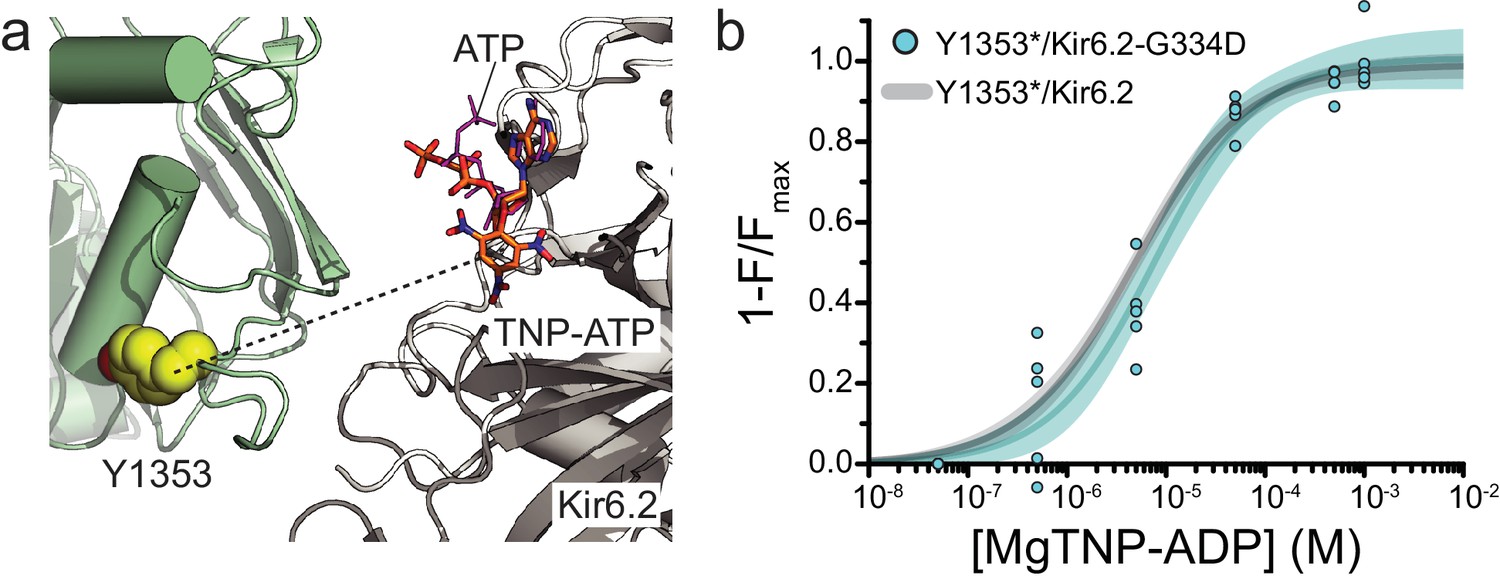
Mutation of the inhibitory nucleotide site in Kir6.2 does not affect binding measured at NBS2 of SUR1.
(a) Proximity of the inhibitory NBS of Kir6.2 to NBS2 of SUR1 in the Mg-nucleotide-bound structure of KATP (PDB accession # 6C3O) (Lee et al., 2017). TNP-ATP (from PDB accession # 3AR7) was aligned with ATP in the original structure (Toyoshima et al., 2011). The dashed line represents a distance of 33 Å. (b) Concentration-response relationship for binding of MgTNP-ADP to SUR1-Y1353*/Kir6.2-G334D channels. Combined data from multiple experiments were fit with Equation 1: Emax = 1.00 ± 0.04, EC50 = 7.7 µM±1.7 µM, h = 0.82 ± 0.13. The fits to the concentration-response relationship for MgTNP-ADP binding to SUR1-Y1353*/Kir6.2 channels from Figure 1f are shown in gray.
Figure 1—figure supplement 4
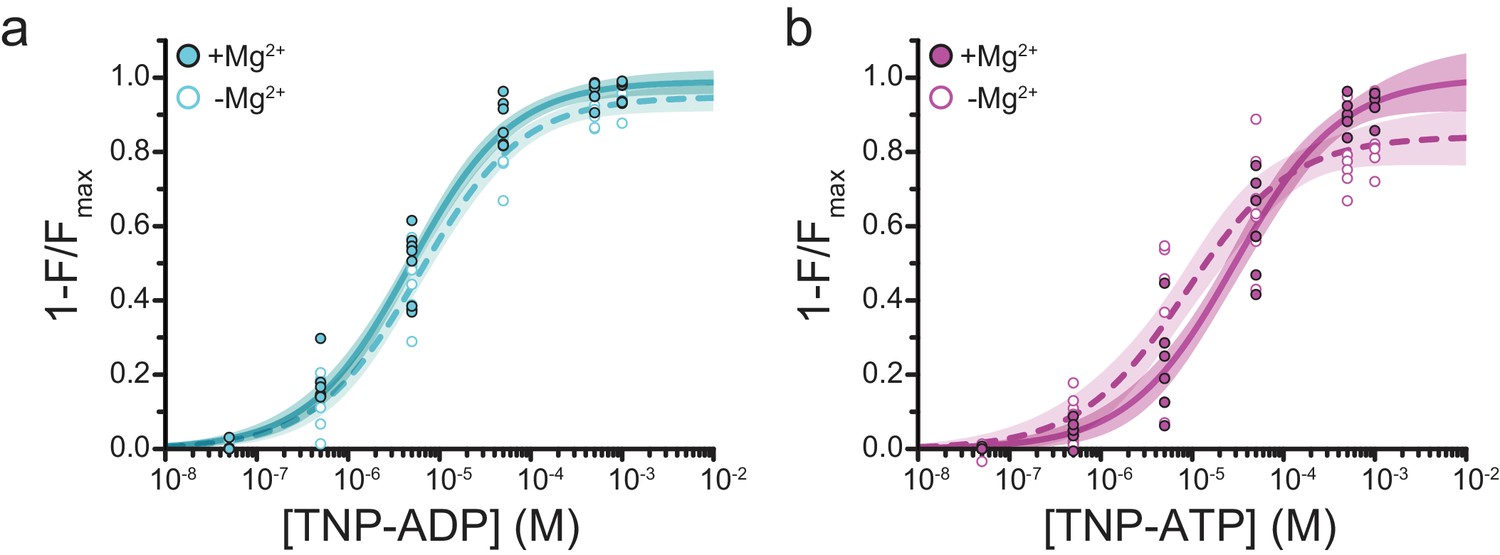
Mg2+effects on steady-state nucleotide binding to SUR1-Y1353*/Kir6.2.
(a) Concentration-response relationships for TNP-ADP binding to SUR1-Y1353*/Kir6.2 in the presence and absence of Mg2+. (b) Concentration-response relationships for TNP-ATP binding to SUR1-Y1353*/Kir6.2 in the presence and absence of Mg2+. Data and fits are repeated from Figure 1.
Figure 1—figure supplement 5
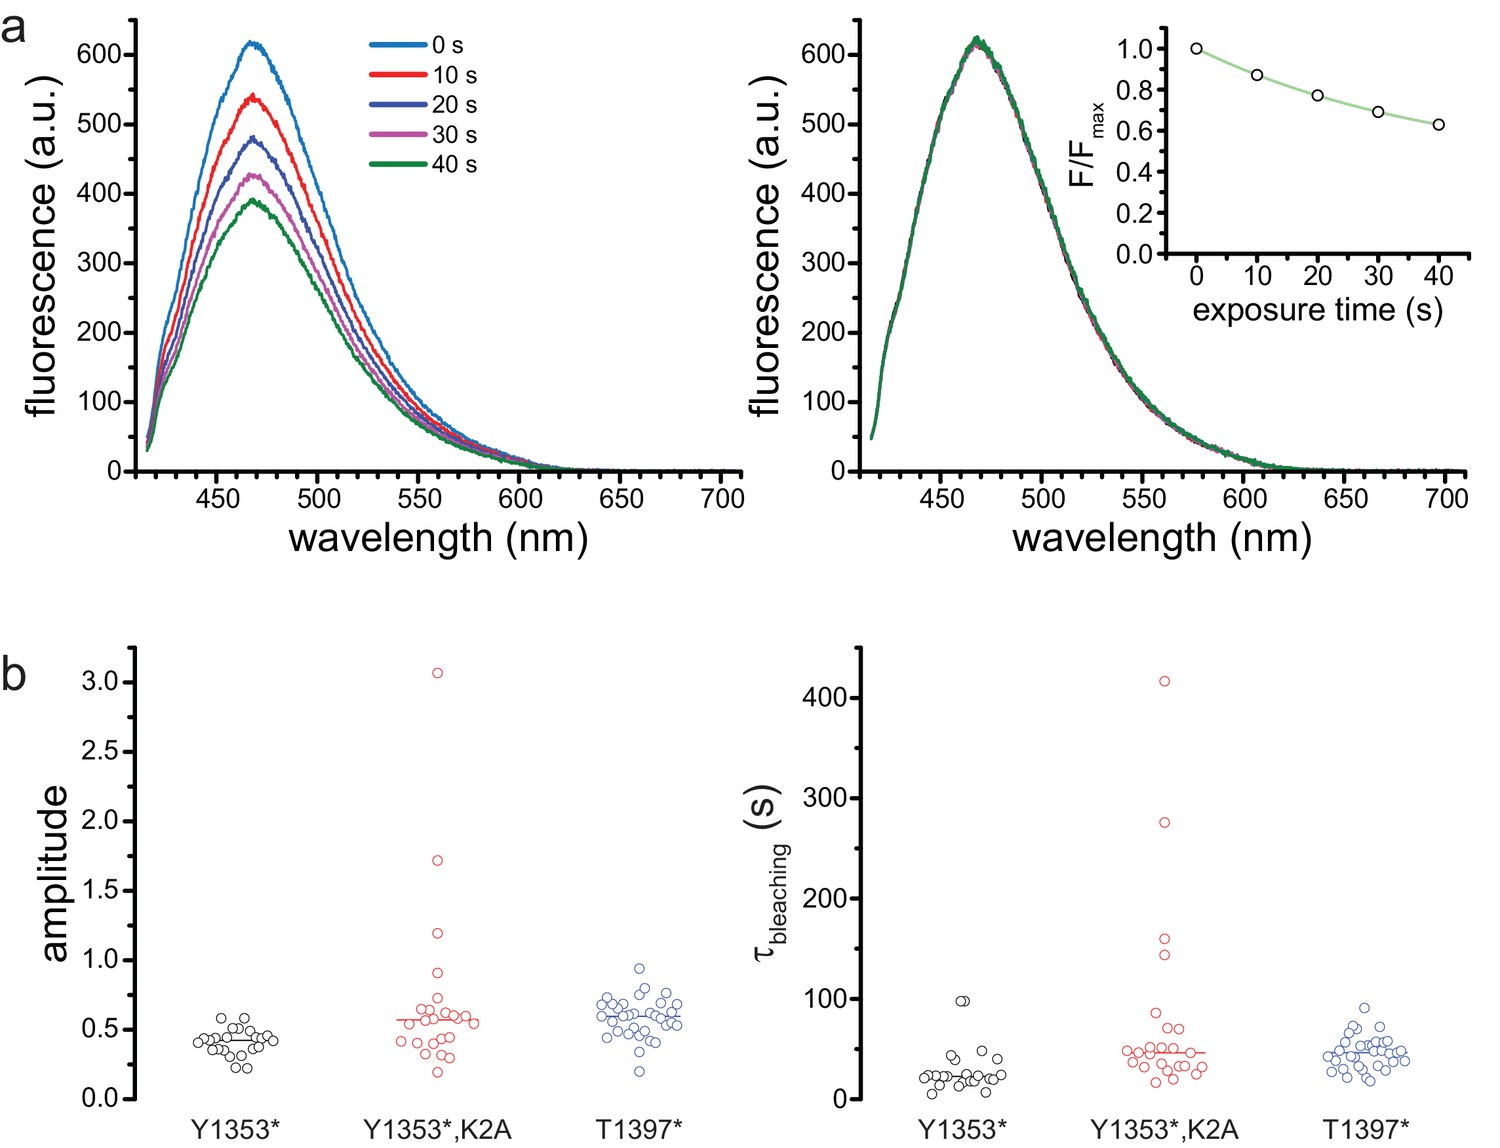
Photobleaching correction.
(a) Successive spectra of SUR1-Y1353*/Kir6.2 before (left) and after (right) correction for photobleaching. The times indicated are cumulative exposure time. The inset on the right shows the exponential fit to the normalized peak fluorescence from the image on the left. (b) Amplitudes (left) and time constants (right) from exponential fits to photobleaching data. Y1353*, A = 0.4 ± 0.1, τ = 29.6 s±23.9 s, n = 23; Y1353*,K2A, A = 0.7 ± 0.6, τ = 77.1 s±92.2 s, n = 24; T1397*, A = 0.6 ± 0.1, τ = 46.2 s±16.6 s, n = 33. Lines indicate means.
Figure 2
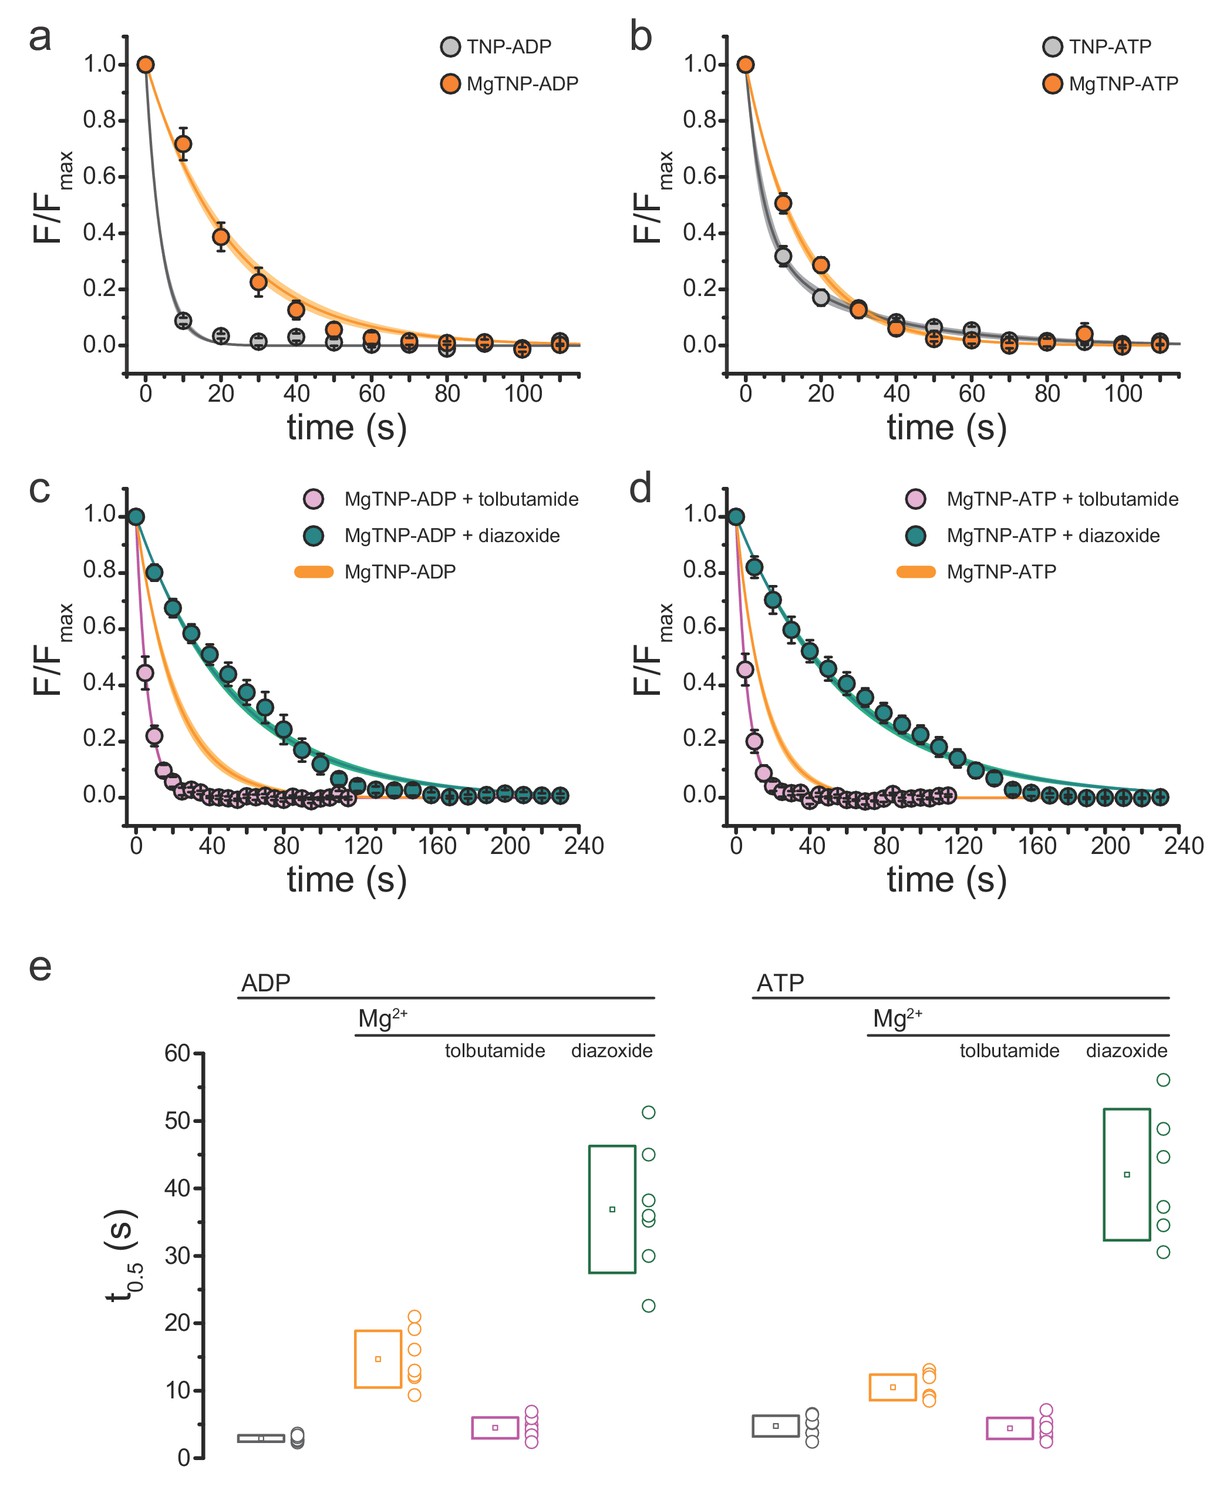
Conditions that favor channel opening slow nucleotide dissociation from NBS2.
(a) Average dissociation time course of TNP-ADP from SUR1-Y1353*/Kir6.2 KATP channels in the presence (orange) and absence (gray) of Mg2+. TNP-ADP: τ = 4.2 s±0.2 s; MgTNP-ADP: τ = 21.3 s±0.8 s. (b) Dissociation time course of TNP-ATP from SUR1-Y1353*/Kir6.2 channels in the presence and absence of Mg2+. TNP-ATP: τ1 = 4.5 s±0.9 s, A1 = 0.65 ± 0.06, τ2 = 28.2 s±3.7 s, A2 = 0.35 ± 0.06; MgTNP-ATP: τ = 15.0 s±0.5 s. (c,d) Dissociation time course of MgTNP-ADP (c) or MgTNP-ATP (d) from SUR1-Y1353*/Kir6.2 in the presence of 500 µM tolbutamide (pink) or 340 µM diazoxide (teal). (c) The orange curve is the fit to the MgTNP-ADP data from (a). Tolbutamide: τ = 6.4 s±0.2 s; diazoxide: τ = 52.6 s±1.4 s. (d) The orange curve is the fit to MgTNP-ATP data from (b). Tolbutamide: τ = 6.3 s±0.1 s; diazoxide: τ = 60.5 s±1.4 s. (e) Time to 50% dissociation (t0.5) for the individual fits to the data shown in (a)-(d) for better comparison between single-exponential and more complex time courses. Boxes represent mean ±SD. Individual data points are shown to the right of the boxes. Combined data from multiple experiments in (a)-(d) were fit to single exponential decays (Equation 2). Dissociation of TNP-ATP in the absence of Mg2+ was better fit with a bi-exponential decay (Equation 3).
Figure 3 with 1 supplement
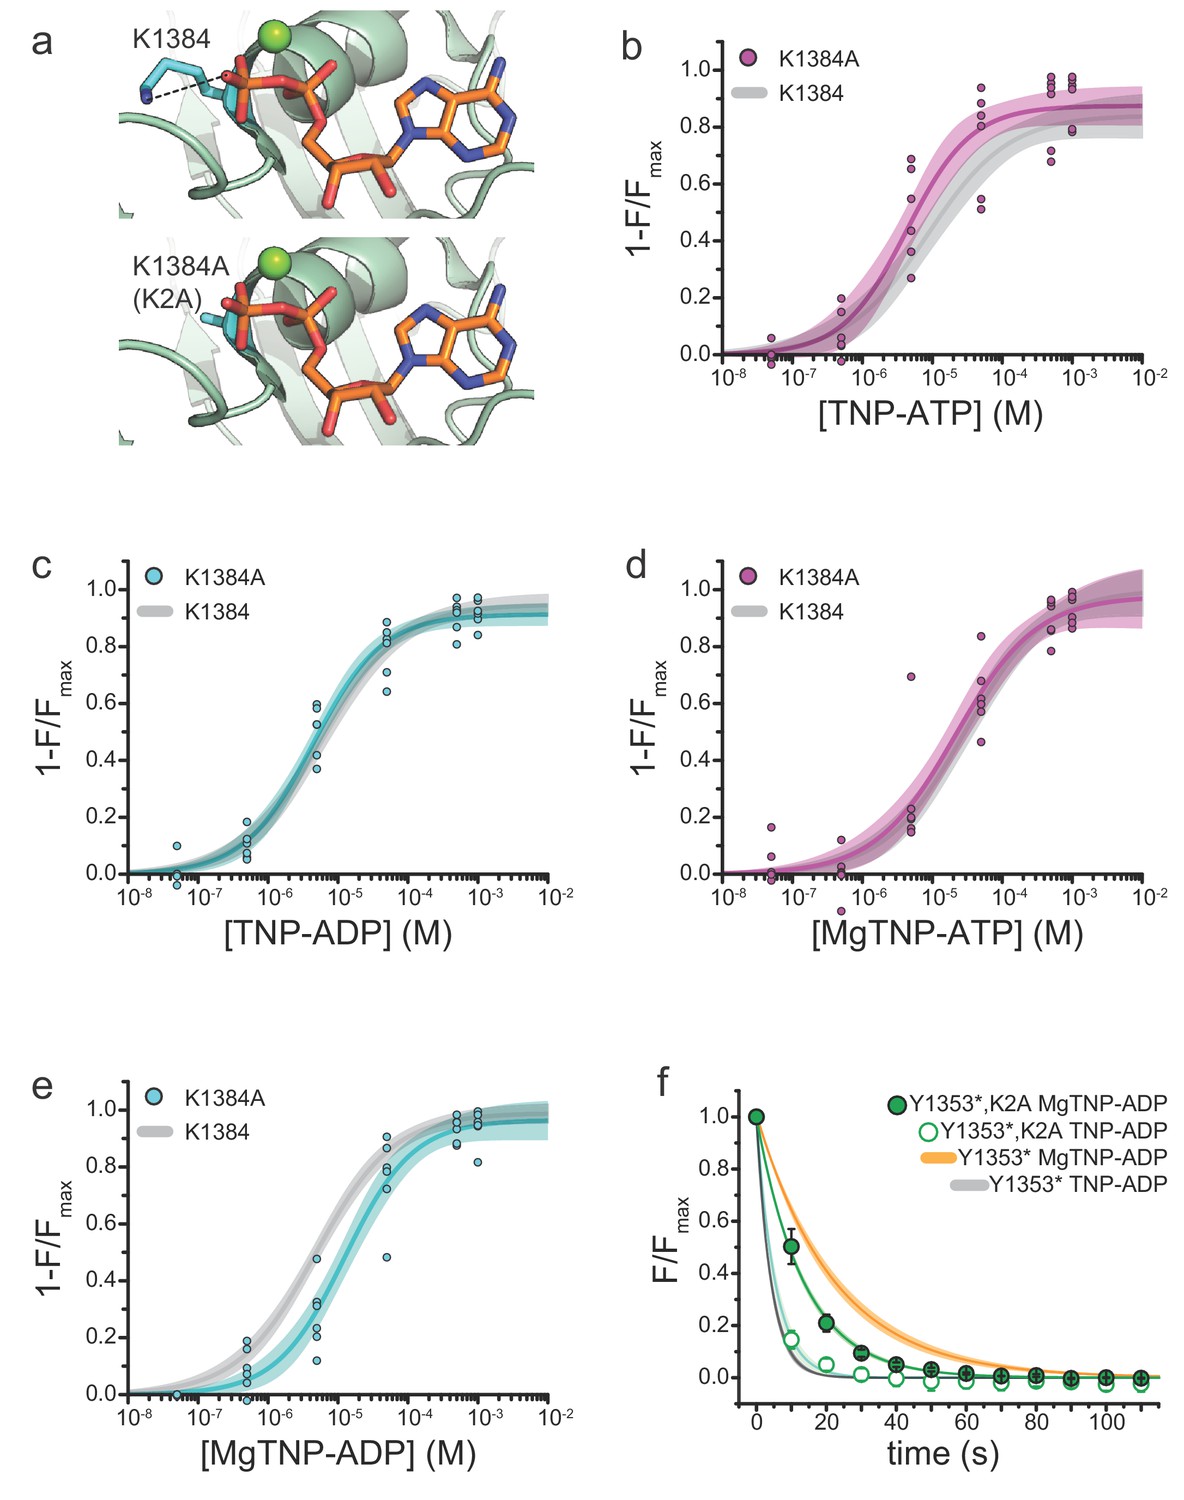
Mutation of the WalkerA motif of NBS2 affects apparent the affinity for MgTNP-ADP.
(a) Interaction of the WalkerA lysine (K1384) with MgADP bound to NBS2 of SUR1 (from PDB accession # 6C3O) (Lee et al., 2017). The K1384A (K2A) mutation (modeled below) disrupts this interaction. (b) Binding of TNP-ATP to SUR1-Y1353*,K2A/Kir6.2 KATP channels in the absence of Mg2+. Combined data from multiple experiments in (b)-(e) were fit to Equation 1. Emax = 0.87 ± 0.03, EC50 = 4.3 µM±0.1 µM, h = 0.9 ± 0.2. Gray curves are fits to SUR1-Y1353*/Kir6.2 channels from Figure 1. (c) Binding of TNP-ADP to SUR1-Y1353*,K2A/Kir6.2 in the absence of Mg2+. Emax = 0.91 ± 0.02, EC50 = 4.4 µM±0.1 µM, h = 0.9 ± 0.1. (d) Binding of MgTNP-ATP to SUR1-Y1353*,K2A/Kir6.2. Emax = 0.97 ± 0.06, EC50 = 21.5 µM±6.7 µM, h = 0.8 ± 0.1. (e) Binding of MgTNP-ADP to SUR1-Y1353*,K2A/Kir6.2. Emax = 0.96 ± 0.04, EC50 = 12.5 µM±2.5 µM, h = 0.9 ± 0.1. (f) Dissociation time course of MgTNP-ADP (green, filled symbols) and TNP-ADP (green, open symbols) from SUR1-Y1353*,K2A/Kir6.2. Combined data from multiple experiments were fit to a single exponential; τ = 13.5 s±0.3 s (for MgTNP-ADP) and τ = 5.4 s±0.8 s (for TNP-ADP). Fits to the dissociation of TNP-ADP from SUR1-Y1353*/Kir6.2 in the presence (orange) and absence (gray) of Mg2+ from Figure 2 are shown for comparison.
Figure 3—figure supplement 1
Mg2+effects on steady-state nucleotide binding to SUR1-Y1353*,K2A/Kir6.2.
(a) Concentration-response relationships for TNP-ADP binding to SUR1-Y1353*,K2A/Kir6.2 in the presence and absence of Mg2+. (b) Concentration-response relationships for TNP-ATP binding to SUR1-Y1353*,K2A/Kir6.2 in the presence and absence of Mg2+. Data and fits are repeated from Figure 3.
Figure 4 with 2 supplements
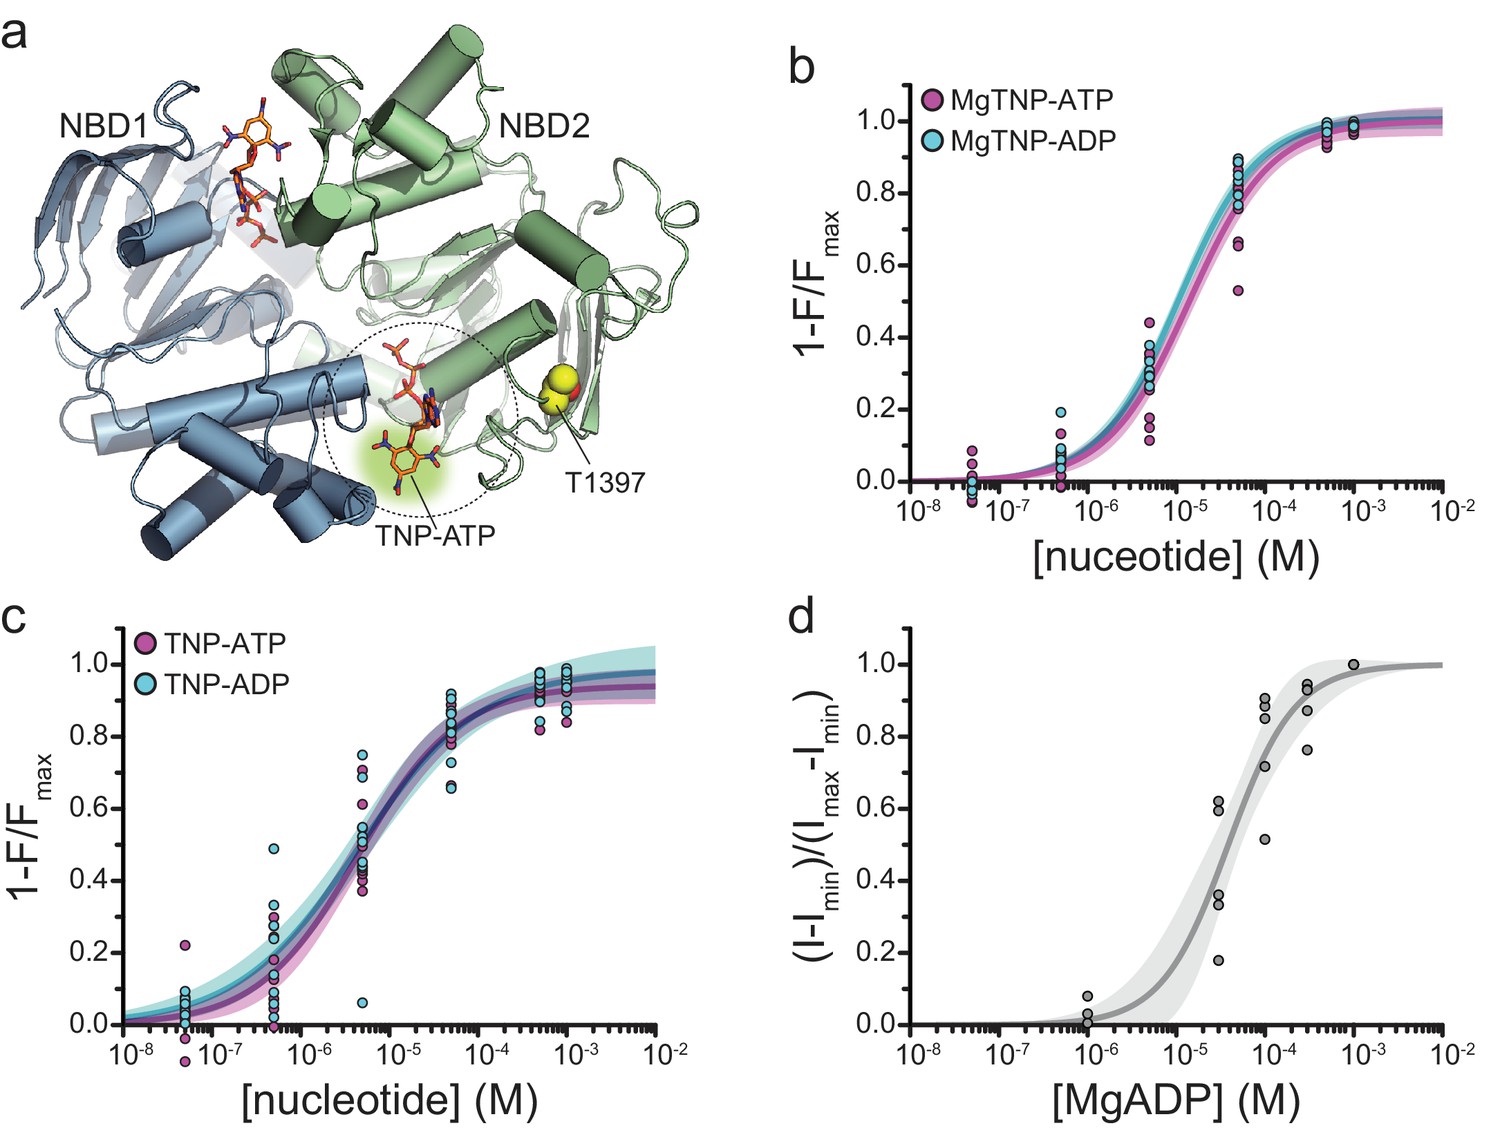
Binding of TNP-nucleotides to SUR1-T1397*/Kir6.2 KATP channels.
(a) Structure of the ligand-bound NBDs of SUR1 (from PDB accession # 6C3O) with TNP-ATP aligned as in Figure 1c (Lee et al., 2017). T1397 in NBD2 is highlighted in yellow to mark the placement of ANAP in our experiments. Combined data from multiple experiments in (c) and (d) were fit to Equation 1. (b) Concentration-response relationships for binding of MgTNP-ATP (magenta) and MgTNP-ADP (cyan) to SUR1-T1397*/Kir6.2 channels. MgTNP-ATP: Emax = 1.00 ± 0.02, EC50 = 14.7 µM±1.8 µM, h = 1.0 ± 0.1. MgTNP-ADP: Emax = 1.0 ± 0.01, EC50 = 10.6 µM±0.07 µM, h = 0.97 ± 0.06. (c) Concentration-response relationships for binding of TNP-ATP and TNP-ADP to SUR1-Y1397*/Kir6.2 channels in the absence of Mg2+. TNP-ATP: Emax = 0.94 ± 0.02, EC50 = 4.8 µM±0.7 µM, h = 0.8 ± 0.1. TNP-ADP: Emax = 0.98 ± 0.05, EC50 = 5.6 µM±1.7 µM, h = 0.7 ± 0.1. (d) Activation of SUR1-T1397*/Kir6.2-G334D channels by MgADP in inside-out patches. Combined data from multiple experiments were fit with Equation 5. EC50 = 38.6 µM±5.8 µM, h = 1.2 ± 0.2.
Figure 4—figure supplement 1
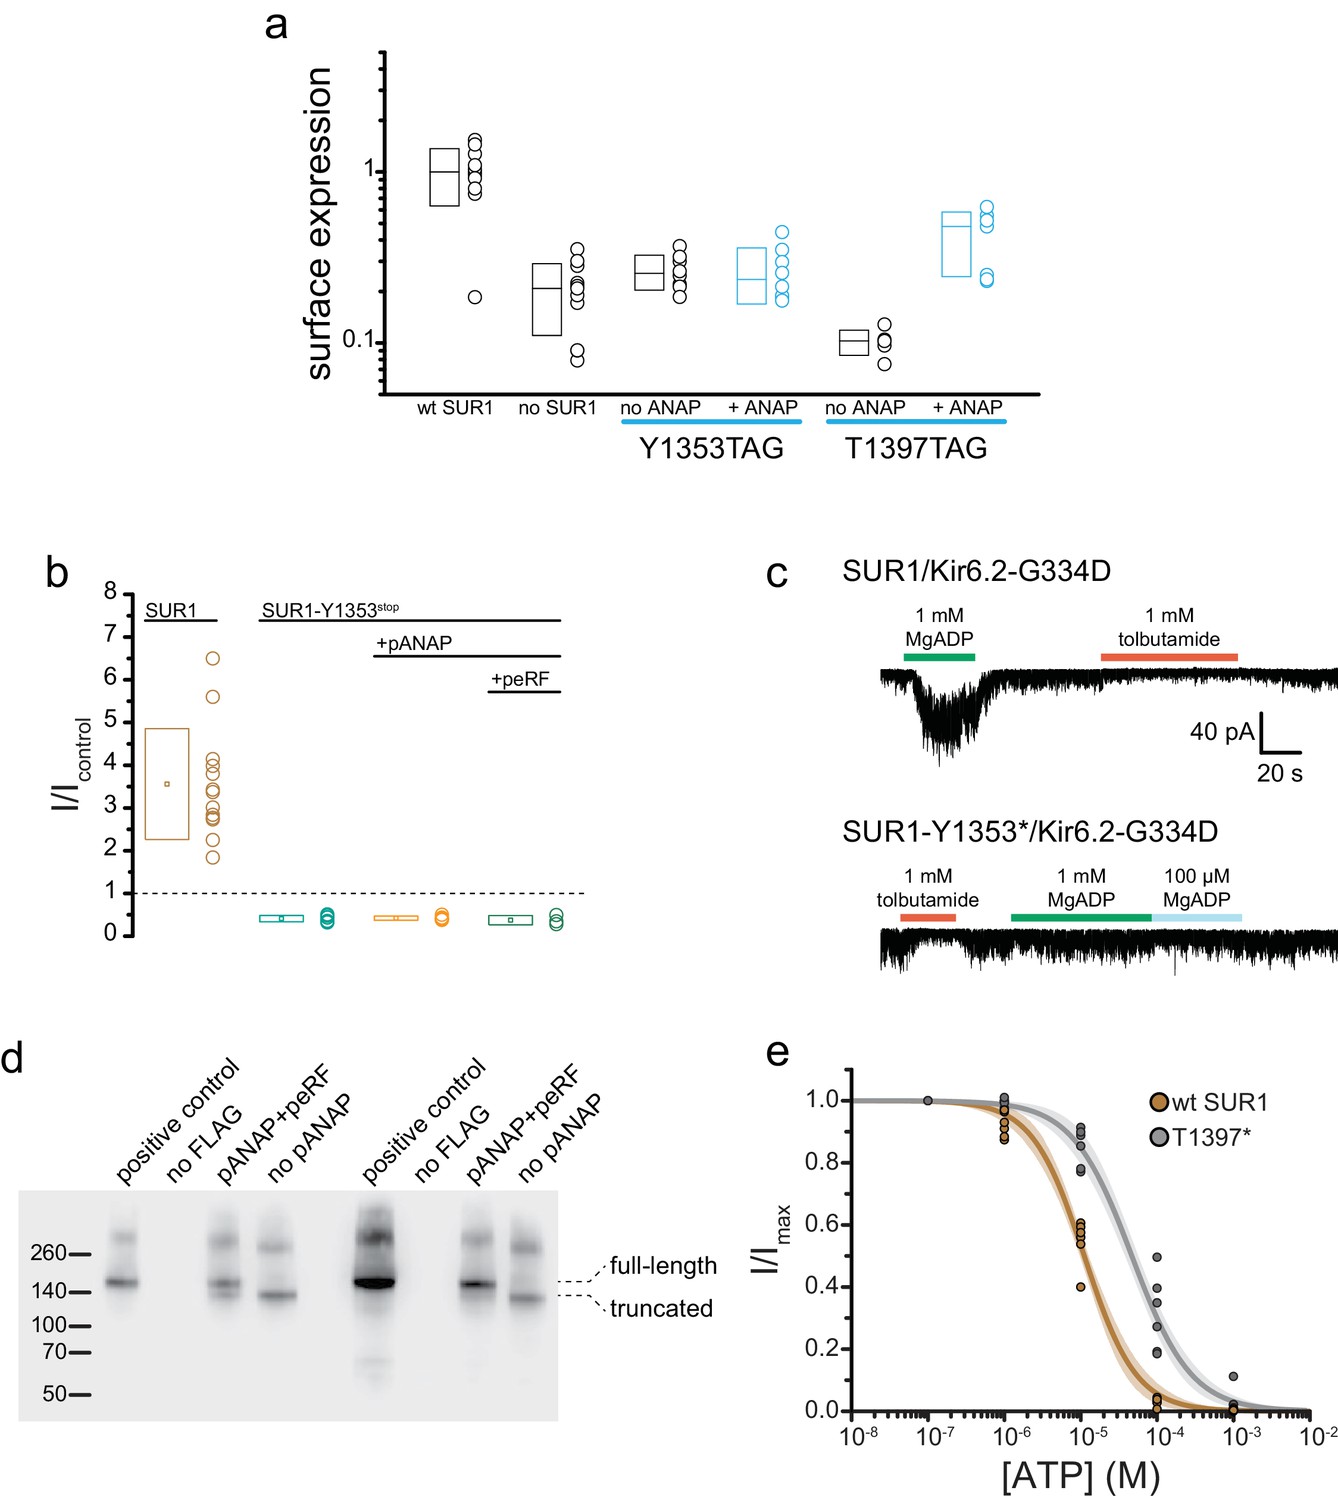
SUR1-T1397*/Kir6.2 KATP channels traffic to the plasma membrane and form functional channels.
(a) Chemiluminescence assay for surface expression of HA-tagged Kir6.2 in the presence (n = 11) and absence (n = 11) of SUR1, in SUR1-Y1353stop-transfected HEK-293T cells cultured in the presence (n = 8) or absence (n = 8) of 20 µM ANAP, and in SUR1-T1397stop transfected HEK-293T cells cultured in the presence (n = 7) or absence (n = 6) of 20 µM ANAP. SUR1-Y1353stop and SUR1-T1397stop were co-transfected with pANAP/peRF1-E55D. (b) Current (normalized to nucleotide-free solution) from inside-out patches excised from cells expressing 3xFLAG_SUR1/Kir6.2 (SUR1), SUR1-Y1353stop/Kir6.2 alone, SUR1-Y1353stop/Kir6.2 with pANAP, or SUR1-Y1353stop/Kir6.2 with pANAP/peRF1-E55D. All cells expressing SUR1-Y1353stop were cultured with ANAP in the media. A response >1 indicates activation. Responses < 1 indicate inhibition. (c) Currents from inside out patches excised from cells expressing either SUR1/Kir6.2-G334D or SUR1-Y1353*/Kir6.2-G334D. MgADP and tolbutamide applied as indicated. (d) Western blot for 3xFLAG-tagged SUR1 subunits expressed in HEK-293T cells. All cells were co-transfected with Kir6.2 and cultured in the presence of 20 μM ANAP. Two separate experiments are shown. In each, the positive control was 3xFLAG_SUR1 with no amber stop codon. The negative control was SUR1 with no FLAG tag. The next two lanes show 3xFLAG_SUR1-T1397tag co-transfected with pANAP and peRF1-E55D, or with peRF1-E55D and no pANAP. The positions of the full-length and truncated (at amino acid 1396) proteins are marked. (e) Inhibition of SUR1-T1397*/Kir6.2 (gray) and SUR1/Kir6.2 (brown) channels by ATP in the absence of Mg2+ measured in inside-out patches. Combined data from multiple experiments were fit to Equation 4. SUR1-T1397*: IC50 = 49.2 µM±4.7 µM, h = −1.1 ± 0.1. SUR1: EC50 = 11.1 µM±6.5 µM, h = −1.3 ± 0.1.
Figure 4—figure supplement 2
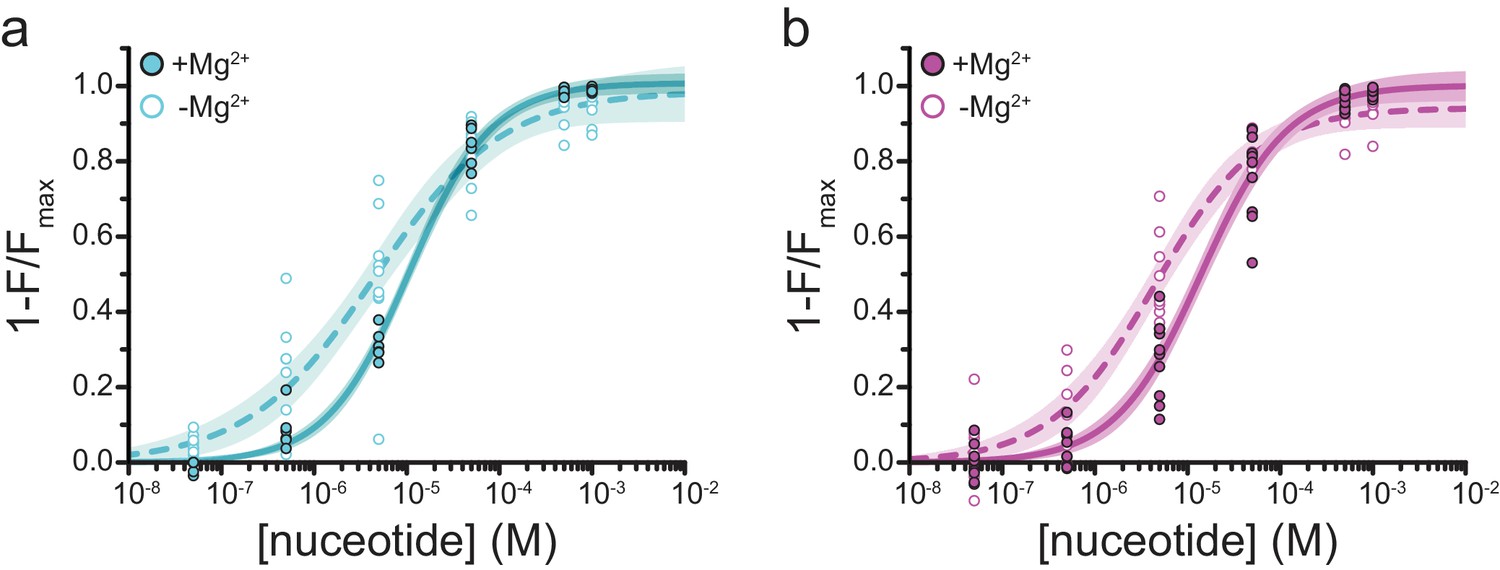
Mg2+effects on steady-state nucleotide binding to SUR1-T1397*.
(a) Concentration-response relationships for TNP-ADP binding to SUR1-T1397*/Kir6.2 in the presence and absence of Mg2+. (b) Concentration-response relationships for TNP-ATP binding to SUR1-T1397*/Kir6.2 in the presence and absence of Mg2+. Data and fits are repeated from Figure 4.
Figure 5 with 2 supplements
.Activation of KATP by Mg-nucleotide binding at SUR1 proceeds via an MWC-type reaction.
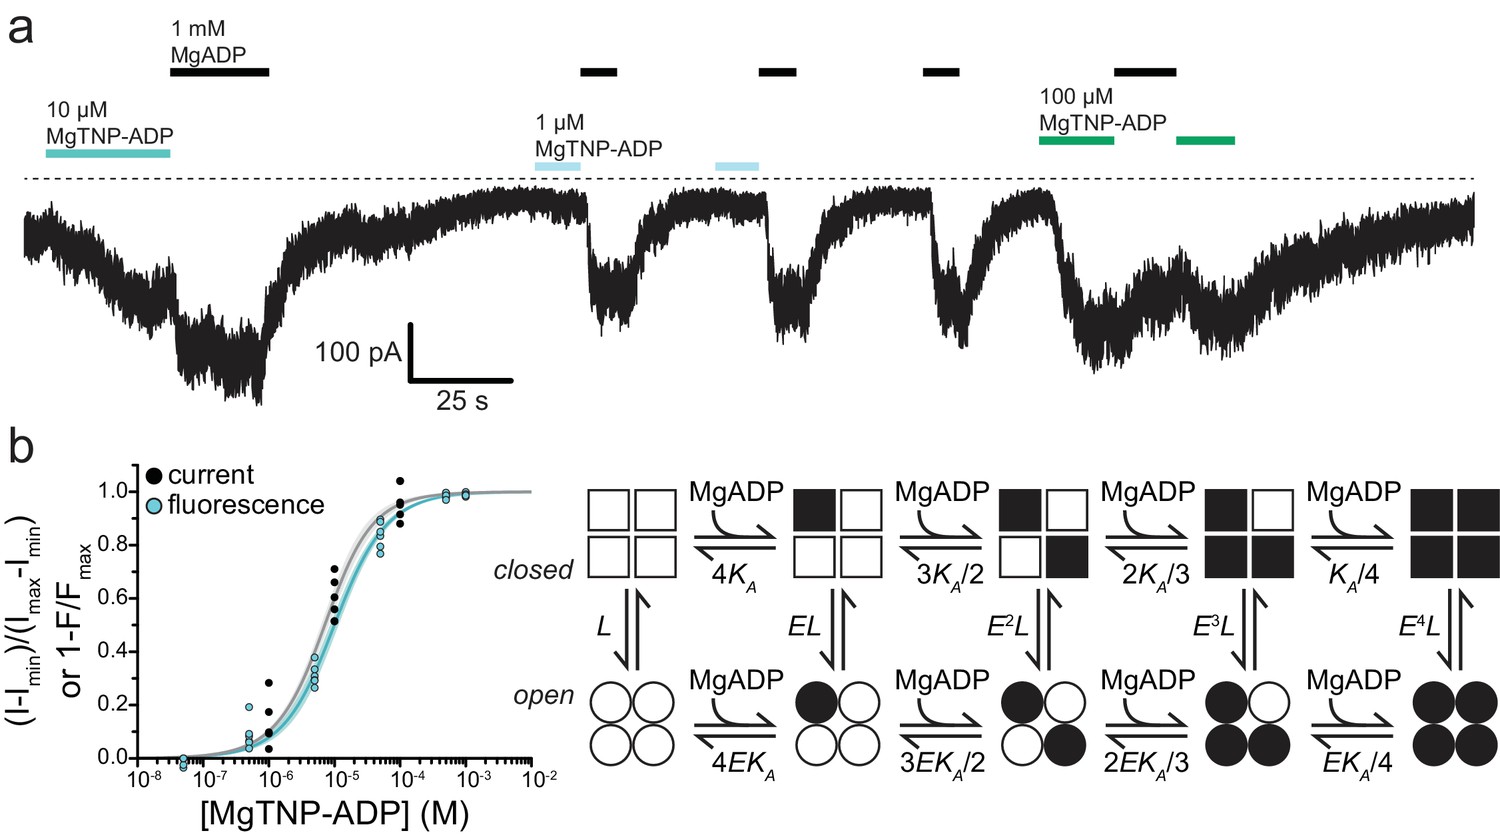
(a) Continuous current trace from an inside out patch expressing SUR1-T1397*/Kir6.2-G334D showing activation by MgADP and MgTNP-ADP. The dotted line indicates the zero-current level. Downward deflections indicate increasing current. (b) Combined data from multiple experiments for MgTNP-ADP binding (cyan from Figure 4b; SUR1-T1397*/Kir6.2) and current activation (gray from SUR1-T1397*/Kir6.2-G334D in separate experiments) were fit simultaneously with MWC expressions for binding (cyan, Equation 6) and activation (gray, Equation 7) with shared parameters for the two expressions. The schematic on the right describes the MWC model. Closed KATP channels are drawn as squares and open channels as circles. Filled symbols represent subunits bound to MgTNP-ADP (abbreviated as MgADP). Channels open by a concerted flip of all four subunits. L = 0.52, E = 2.2 ± 0.2, and KA = 5.8×10⁴ M−1±1.0×10⁴ M−1. Each MgTNP-ADP binding event is independent and each MgTNP-ADP-bound NBS2 contributes equally to increase Popen.
Figure 5—figure supplement 1
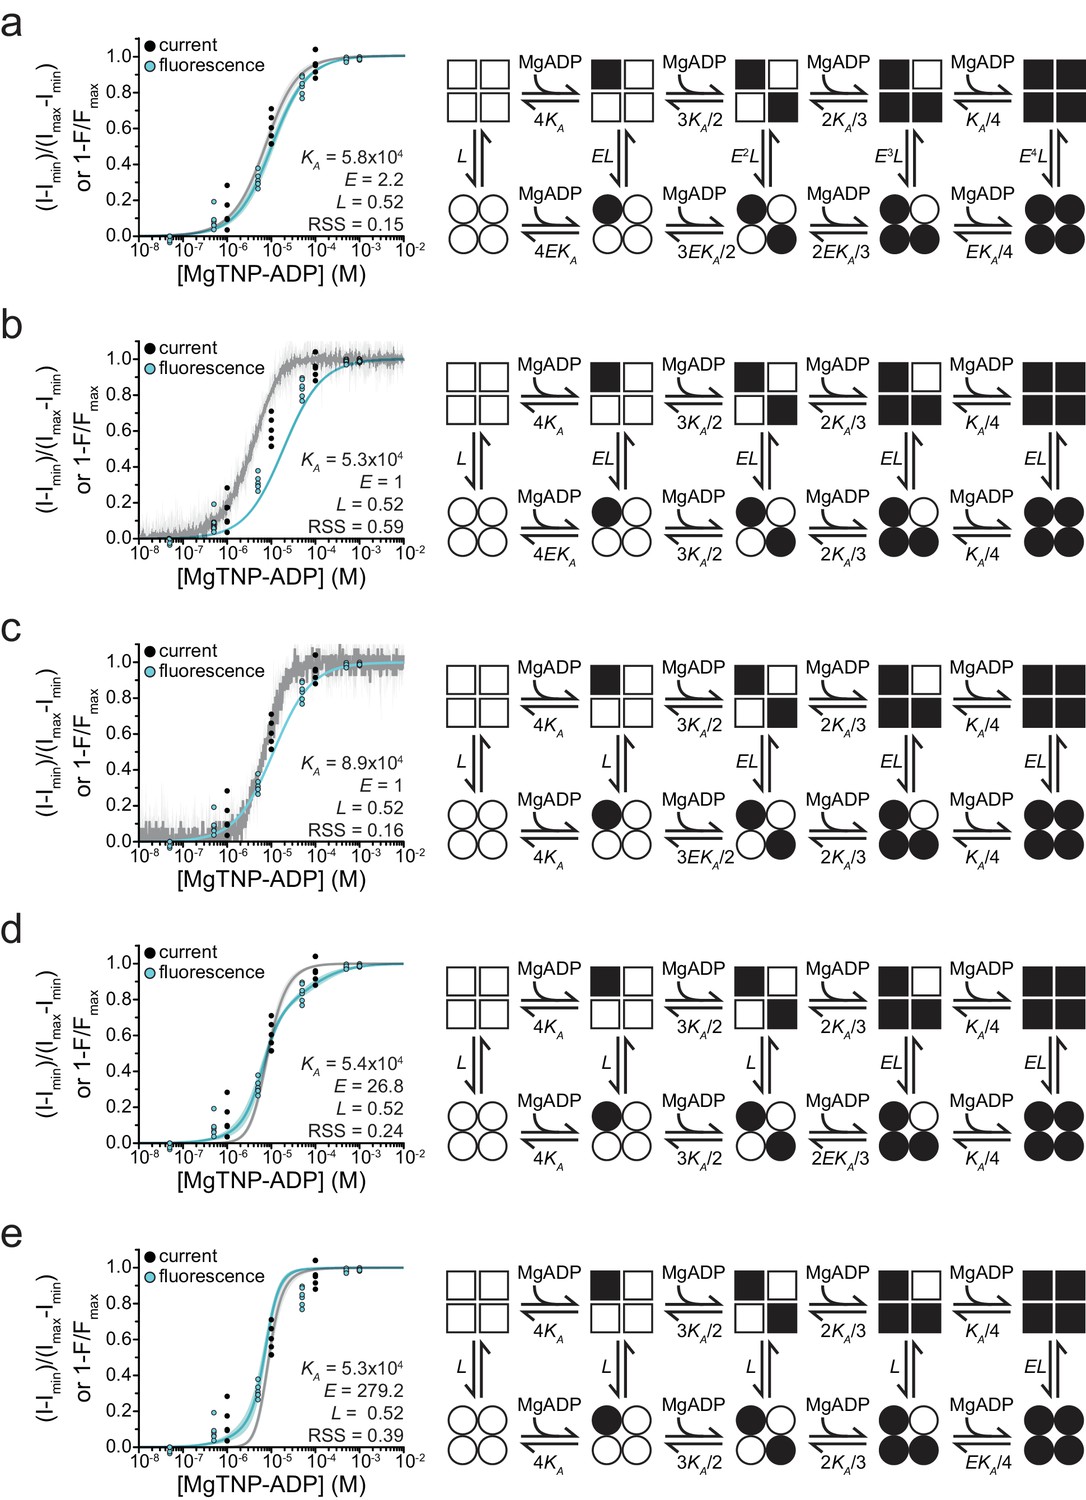
Fits to alternate gating models.
Combined binding and gating data from Figure 5 fit to alternative models. Fit parameters are shown as insets. Goodness of fit was assessed as the residual sum of squares (RSS). (a) MWC model as in Figure 5. (b) Model in which binding of MgADP to a single SUR1 is sufficient to increase channel activity.
(c) Model in which binding of MgADP to two SUR1 subunits is required to increase channel activity.
(d) Model in which binding of MgADP to three SUR1 subunits is required to increase channel activity.
(e) Model in which all four SUR1 subunits must be occupied by MgADP in order to increase channel open probability.
Figure 5—figure supplement 2
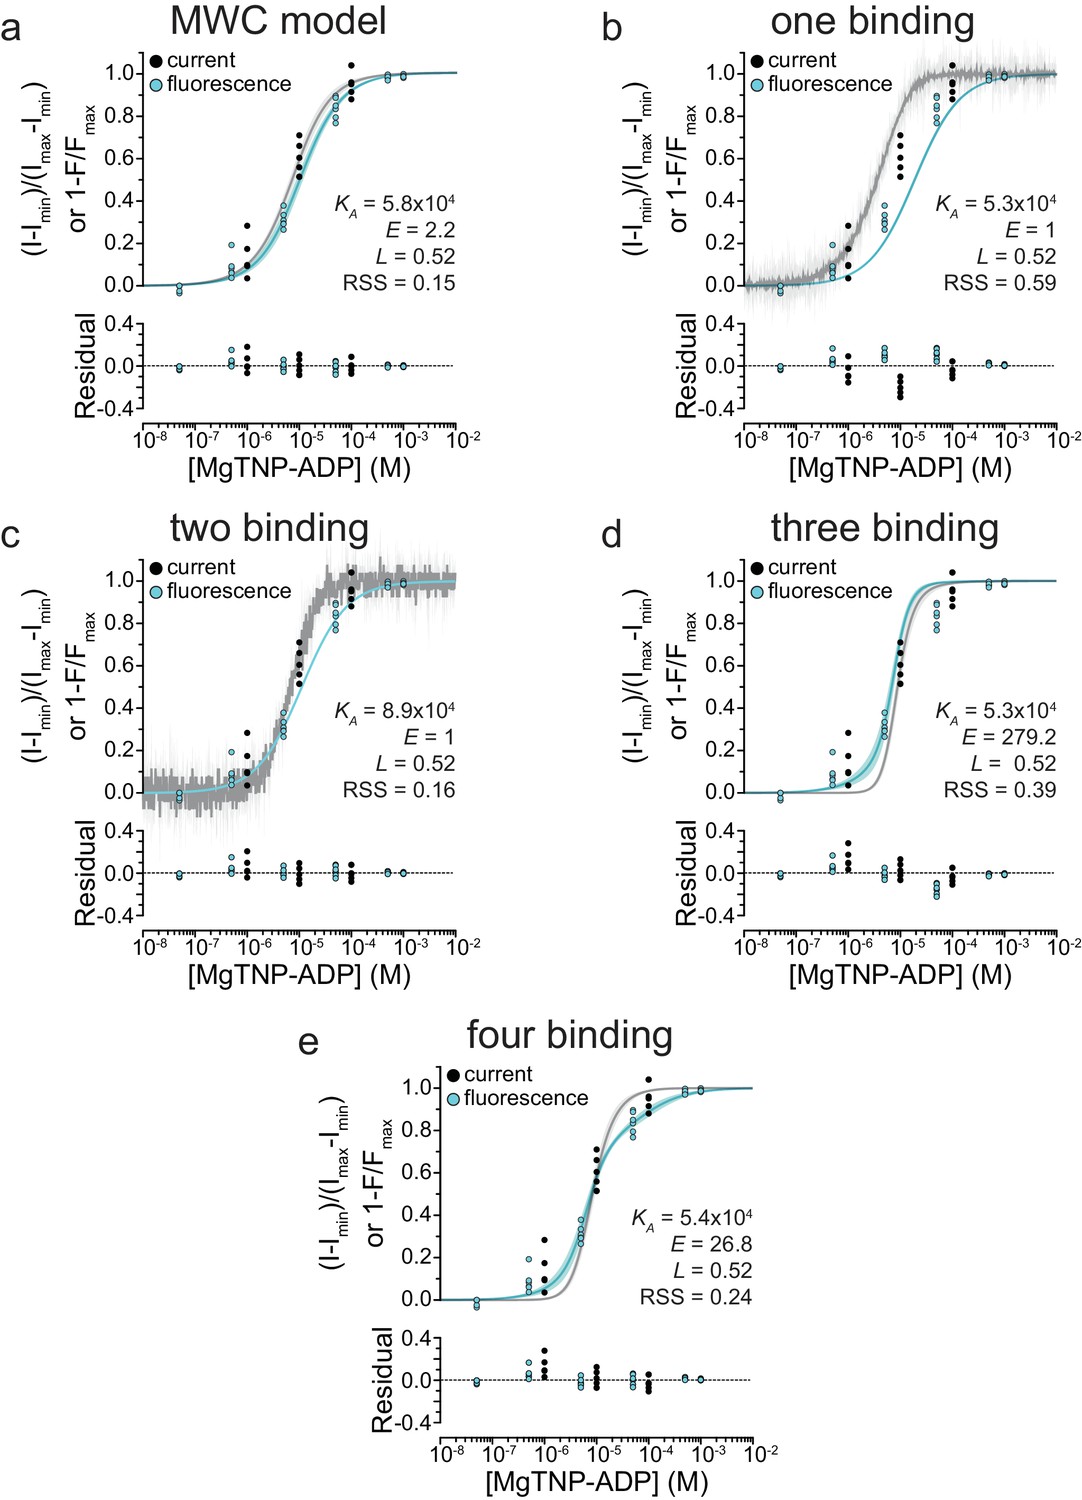
Residuals of fits to alternate gating models.
Simultaneous fits of binding and activation data as in Figure 5—figure supplement 1, with accompanying plots of the residuals of the model fits.
Figure 6

Schematic for activation of KATP by nucleotide binding to SUR1.
(top, left). In the absence of Mg2+ nucleotides bind and rapidly dissociate from the NBSs of SUR1, without affecting its conformation. Nucleotide occupancy of SUR1 is not communicated to Kir6.2. (top, right) In the presence of both Mg2+ and nucleotide, the NBD dimer interface is stabilized. This interface must open in order for nucleotides to leave, so nucleotide dissociation is greatly slowed. NBD dimerization requires a conformational change in the transmembrane domain of SUR1. This conformational change is communicated to Kir6.2 to increase the favorability of channel opening. (bottom, left) Sulfonylureas prevent the conformational change in the transmembrane domain of SUR1 and preclude NBD dimerization. Therefore, nucleotide dissociation is rapid, even in the presence of Mg2+ and no increase in open probability results from Mg-nucleotide binding to SUR1. (bottom, right) Potassium channel openers stabilize the closed-dimer conformation of the NBDs. As a result, nucleotide dissociation is very slow and channel activation is enhanced.
Author response image 1

Left.
Spectra acquired before (First) and after (Last) 4 min of washout. A residual nucleotide peak (530 nm) remains after washing. Right. Spectra taken from a background region. The nucleotide signal is smaller (there is no FRET to unbound nucleotide and the quantum efficiency for unbound TNP-nucleotides is low) but fails to completely wash out in 4 min. Note that the spectrum of the background region also contains autofluorescence from the culture dish.
Tables
Table 1
Mean ± SEM from fits of equation 5 to individual electrophysiological experiments.
https://doi.org/10.7554/eLife.41103.008| Construct | Nucleotide | EC50 (μM) | h | n |
|---|---|---|---|---|
| SUR1/Kir6.2-G334D | MgTNP-ADP | 20.6 ± 0.4 | 1.1 ± 0.2 | 12 |
| SUR1-T1397*/Kir6.2-G334D | MgTNP-ADP | 7.3 ± 1.2 | 1.0 ± 0.1 | 5 |
| MgADP | 44.4 ± 14.5 | 1.5 ± 0.3 | 5 |
Table 2
Mean ± SEM from fits of equation 1 to individual nucleotide binding experiments.
https://doi.org/10.7554/eLife.41103.009| Construct | Nucleotide | Emax | EC50 (μM) | h | n | |
|---|---|---|---|---|---|---|
| SUR1-Y1353*/Kir6.2 | MgTNP-ADP | 0.99 ± 0.01 | 5.5 ± 0.9 | 0.77 ± 0.03 | 8 | |
| MgTNP-ATP | 0.99 ± 0.02 | 37.5 ± 11.9 | 0.86 ± 0.07 | 7 | ||
| TNP-ADP | 0.95 ± 0.01 | 6.8 ± 1.3 | 0.79 ± 0.04 | 7 | ||
| TNP-ATP | 0.83 ± 0.03 | 12.8 ± 5.6 | 0.88 ± 0.06 | 7 | ||
| SUR1-Y1353*,K2A/Kir6.2 | MgTNP-ADP | 0.97 ± 0.03 | 18.6 ± 8.6 | 0.97 ± 0.07 | 6 | |
| MgTNP-ATP | 0.99 ± 0.02 | 31.4 ± 9.1 | 1.1 ± 0.3 | 6 | ||
| TNP-ADP | 0.92 ± 0.02 | 5.0 ± 1.0 | 0.88 ± 0.05 | 6 | ||
| TNP-ATP | 0.90 ± 0.03 | 8.1 ± 3.8 | 0.98 ± 0.13 | 6 | ||
| SUR1-T1397*/Kir6.2 | MgTNP-ADP | 1.01 ± 0.005 | 10.8 ± 0.7 | 0.98 ± 0.05 | 6 | |
| MgTNP-ATP | 1.00 ± 0.01 | 17.1 ± 3.9 | 1.0 ± 0.1 | 10 | ||
| TNP-ADP | 0.98 ± 0.02 | 6.3 ± 2.3 | 0.84 ± 0.13 | 9 | ||
| TNP-ATP | 0.94 ± 0.01 | 4.7 ± 0.8 | 0.83 ± 0.09 | 8 | ||
| SUR1-Y1353*/Kir6.2-G334D | MgTNP-ADP | 1.01 ± 0.04 | 8.2 ± 1.9 | 0.90 ± 0.15 | 5 | |
Table 3
Mean ± SD from exponential fits to individual experiments measuring nucleotide wash-out time courses.
https://doi.org/10.7554/eLife.41103.011| SUR1 construct | Nucleotide | Drug | t0.5 (s) | n |
|---|---|---|---|---|
| Y1353* | TNP-ADP | 2.9 ± 0.5 | 7 | |
| MgTNP-ADP | 14.7 ± 4.2 | 7 | ||
| MgTNP-ADP | tolbutamide | 4.5 ± 1.5 | 7 | |
| MgTNP-ADP | diazoxide | 36.9 ± 9.4 | 7 | |
| TNP-ATP | 4.8 ± 1.5 | 7 | ||
| MgTNP-ATP | 10.5 ± 1.9 | 7 | ||
| MgTNP-ATP | tolbutamide | 4.4 ± 1.6 | 7 | |
| MgTNP-ATP | diazoxide | 42.0 ± 9.7 | 6 | |
| Y1353*,K2A | TNP-ADP | 3.8 ± 1.0 | 3 | |
| MgTNP-ADP | 9.3 ± 2.1 | 4 |
Table 4
Mean ± SD response to 100 μM MgADP relative to the current in nucleotide-free solution.
https://doi.org/10.7554/eLife.41103.014| Construct | ANAP | pANAP | peRF1-E55D | Nucleotide | I/Icontrol | n |
|---|---|---|---|---|---|---|
| 3xFLAG_SUR1/Kir6.2 | − | − | − | 100 μM MgATP | 3.6 ± 1.3 | 13 |
| SUR1-Y1353stop/Kir6.2 | + | − | − | 100 μM MgATP | 0.41 ± 0.7 | 7 |
| SUR1-Y1353stop/Kir6.2 | + | + | − | 100 μM MgATP | 0.42 ± 0.05 | 5 |
| SUR1-Y1353stop/Kir6.2 | + | + | + | 100 μM MgATP | 0.37 ± 0.10 | 3 |
Table 5
Mean ± SEM from fits of Equation 4 to individual electrophysiological experiments.
https://doi.org/10.7554/eLife.41103.021| Construct | Nucleotide | IC50(μM) | h | n |
|---|---|---|---|---|
| SUR1/Kir6.2 | ATP | 11.2 ± 0.1 | −1.3 ± 0.1 | 6 |
| SUR1-T1397*/Kir6.2 | ATP | 53.9 ± 9.4 | −1.2 ± 0.1 | 6 |
Key resources table
| Reagent type (species) or resource | Designation | Source or reference | Identifiers | Additional information |
|---|---|---|---|---|
| Cell line | HEK-293T | LGC Standards (ATCC CRL-3216) | ||
| Transfected construct (Escherichia. coli) | pANAP | Addgene | ||
| Transfected construct | pcDNA4/TO | Addgene | ||
| Transfected construct (Aequorea victoria) | pCGFP_EU | Gouaux Laboratory (Vollum Institute, Portland OR USA); | ||
| Transfected construct (Homo sapiens) | peRF1-E55D | Chin Laboratory (MRC Laboratory of Molecular Biology, Cambridge UK); | ||
| Antibody | Monoclonal ANTI-FLAG M2 antibody | Sigma-Aldrich | (Sigma-Aldrich Cat# F3165, RRID:AB_259529) | |
| Antibody | Anti-HA High Affinity; Rat monoclonal antibody (clone 3F10) | Roche | (Roche Cat# 11867423001, RRID:AB_10094468) | |
| Antibody | Sheep Anti-Mouse IgG ECL Antibody, HRP Conjugated | GE Healthcare | (GE Healthcare Cat# NA9310-1ml, RRID:AB_772193) | |
| Antibody | Peroxidase-AffiniPure Goat Anti-Rat IgG (H + L) antibody | Jackson ImmunoResearch Labs | (Jackson ImmunoResearch Labs Cat# 112-035-003, RRID:AB_2338128) | |
| Chemical compound, drug | trinitrophenyl-ATP (TNP-ATP) | Jena Bioscience (Jena, Germany) | ||
| Chemical compound, drug | trinitrophenyl-ADP (TNP-ADP) | Jena Bioscience (Jena, Germany) | ||
| Chemical compound, drug | L-3-(6-acetylnaphthalen-2-ylamino)−2-aminopropionic acid | Asis Chemicals (Waltham, MA) |
Additional files
-
Transparent reporting form
- https://doi.org/10.7554/eLife.41103.023
Download links
A two-part list of links to download the article, or parts of the article, in various formats.
Downloads (link to download the article as PDF)
Open citations (links to open the citations from this article in various online reference manager services)
Cite this article (links to download the citations from this article in formats compatible with various reference manager tools)
Activation mechanism of ATP-sensitive K+ channels explored with real-time nucleotide binding
eLife 8:e41103.
https://doi.org/10.7554/eLife.41103


