Flexible nitrogen utilisation by the metabolic generalist pathogen Mycobacterium tuberculosis
- The Francis Crick Institute, United Kingdom
- Department of Veterans Affairs Medical Center, United States
Figures
Figure 1 with 2 supplements

Scheme of the core nitrogen metabolic network of M. tuberculosis.
1 – Glutamine synthetase (glnA1); 2 – glutamate synthase (gltBD); 3 – glutamate dehydrogenase (gdh); 4 – glutamate/oxaloacetate transaminase (aspB); 5 – glutamate/pyruvate transaminase (aspC); 6 – alanine dehydrogenase (ald); 7 – glutamate decarboxylase (gadB); 8 – aspartate/pyruvate transaminase (aspC); 9 – asparaginase (ansA). Scheme was constructed with data from the Kyoto Encyclopedia for Genes and Genomes (https://www.genome.jp/kegg/kegg2.html) and Mycobrowser (https://mycobrowser.epfl.ch/), and manually curated.
Figure 1—figure supplement 1
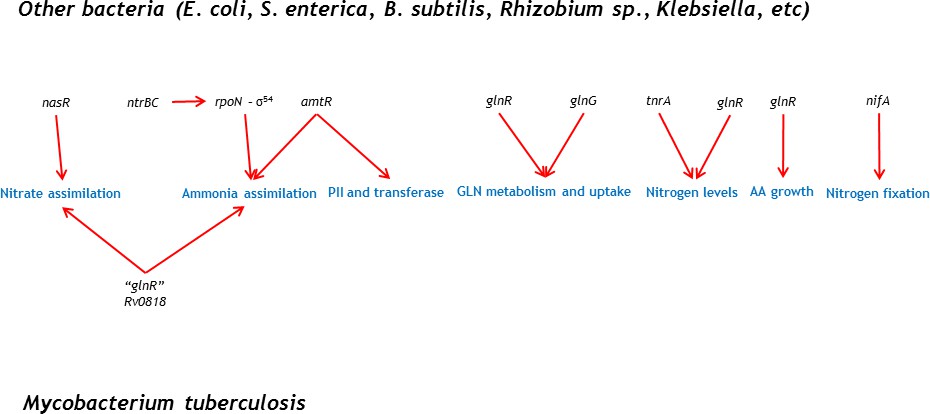
Common bacterial transcriptional regulators involved in nitrogen metabolism are not present in M. tuberculosis.
A glnR homologue (Rv0818) is found in mycobacteria, nonetheless, its function is different from what has been shown in other species.
Figure 1—figure supplement 2
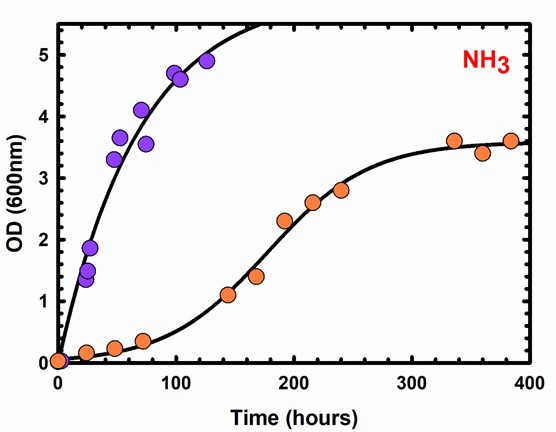
Different growth kinetics displayed by M. tuberculosis (orange circles) and M. smegmatis (purple circles) where NH4+is the sole nitrogen source.
Each symbol represents a measurement from one independent experiment. Data is representative of two independent experiments.
Figure 2
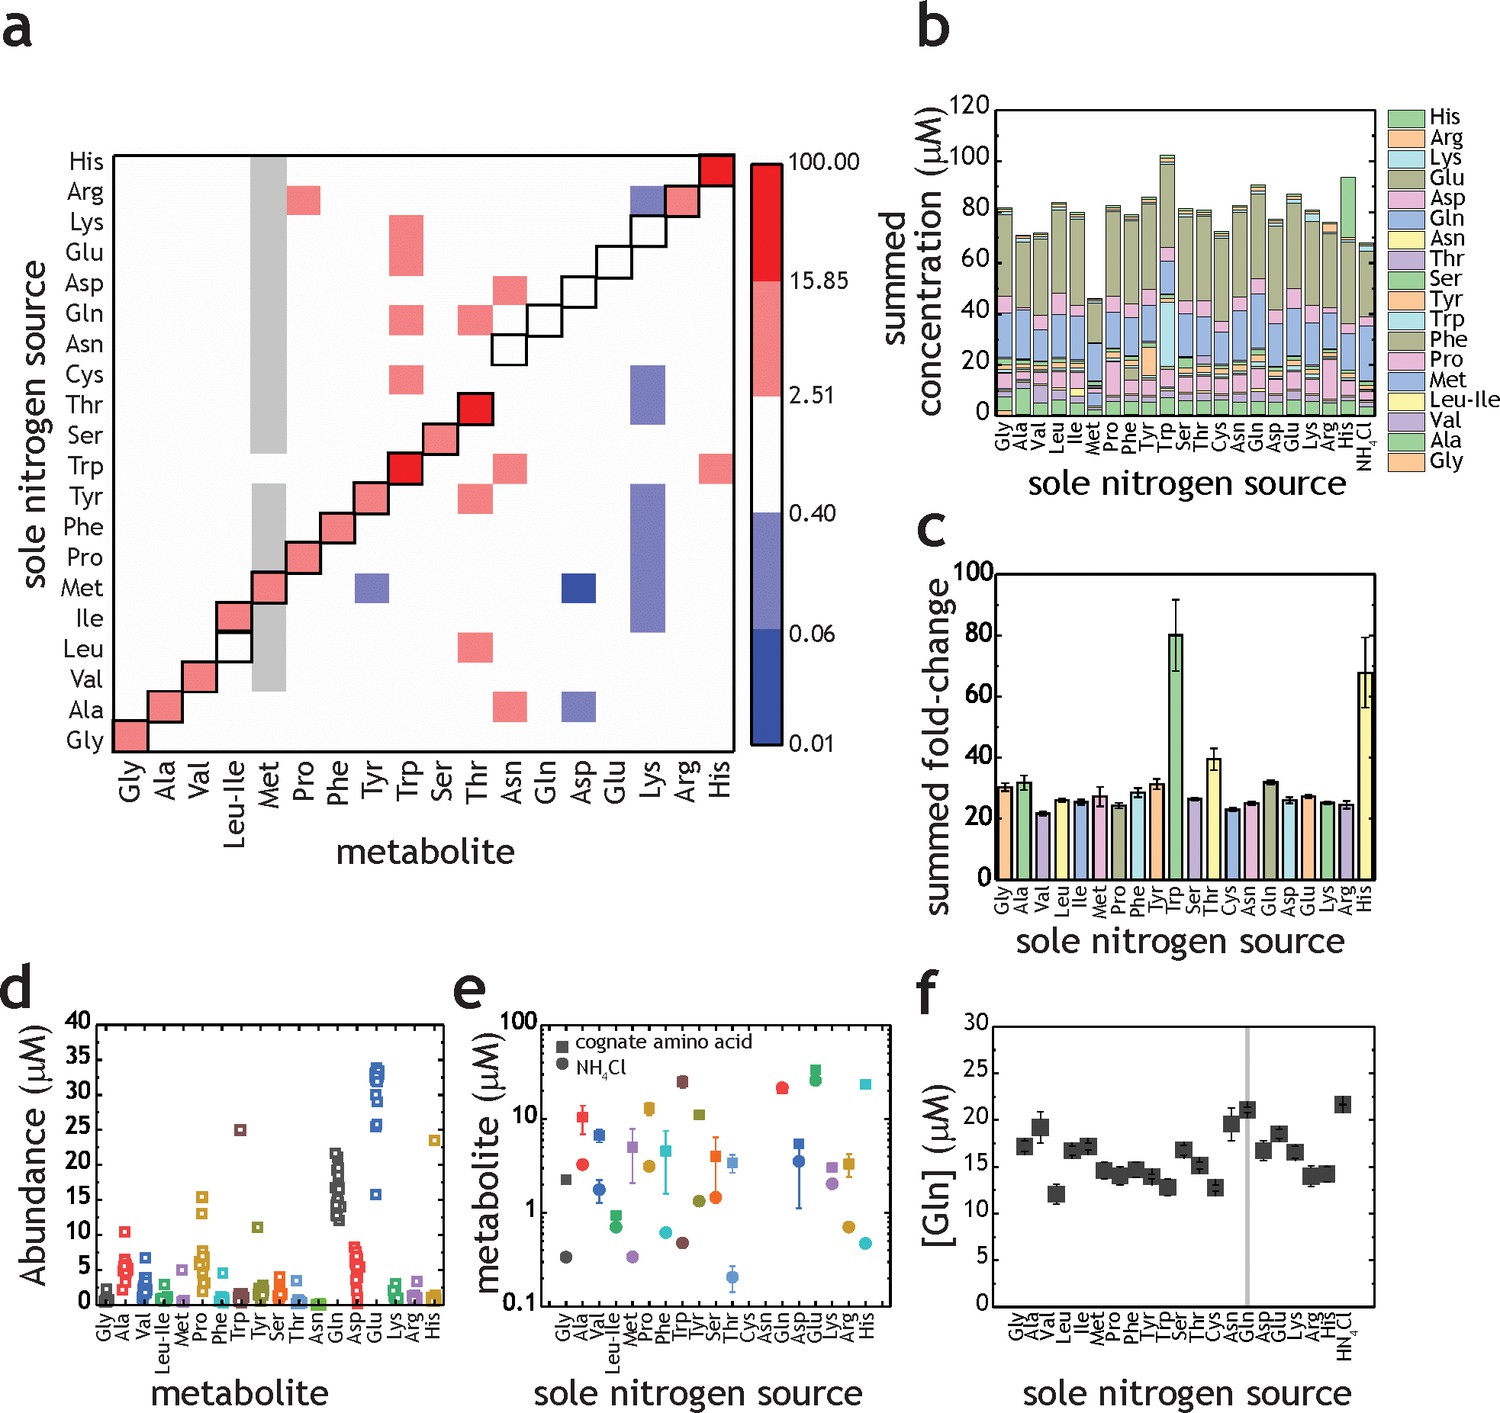
Proteinogenic amino acids as sole nitrogen source for M. tuberculosis.
(a) Heatmap illustrating the changes in amino acids (X-axis) when M. tuberculosis is grown on each individual amino acid as sole nitrogen source (Y-axis). Data shown as fold-change (amino acid/NH4+). Grey squares indicate that abundance of a particular metabolite was too low to be quantified. Cysteine was undetectable in all conditions and was omitted from this plot. Panels (b–f) are re-plots of the data shown in panel (a). (b) Summed abundance of amino acids in each amino acid as sole nitrogen source. (c) Data from panel (b) presented as fold-change over NH4+. (d) Amino acid abundances irrespective of the sole nitrogen source used, highlighting the variation on each amino acid in different nitrogen sources (e.g. higher variation in Pro and lower in Asn). Each symbol represents the average concentration obtained with a single individual nitrogen source. (e) Amino acid concentrations in NH4+ and in medium containing the cognate amino acid as sole nitrogen source. (f) Concentration of Gln in extracts from M. tuberculosis grown on different amino acids as sole nitrogen source. All concentrations are final concentrations in lysates obtained from approximately 109 cells, and not concentrations per cell. Data is the average of three biological replicates and representative of two independent experiments.
Figure 3 with 1 supplement

Analysis of M. tuberculosis growth in pre-adapted nitrogen cultures.
(a) Growth curves in 7H9Nx broth (sole nitrogen source). (b) Table with g/L to mM conversions for each nitrogen source used. (c) Replot of final biomass achieved (OD600 nm) for each nitrogen source, after 15 days (a). Solid lines are the fit to a hyperbolic equation, describing saturation. (d) Re-plot of data at no-nitrogen from (a), illustrating different residual growth. (e) Growth curves in 7H9Nx broth without added nitrogen, after cultures were grown for 15 days on nitrogen media (a). 7H9Nx broth still contains low level of nitrogen, in the form of ferric ammonium citrate. (f) Growth curves in synthetic 7H9Nx# broth, lacking nitrogen (ferric ammonium citrate was substituted by ferric citrate), after cultures were grown for 15 days on nitrogen media (a). Symbols are data and solid lines in growth curves are the fit to a sigmoidal equation describing bacterial growth. Data are representative of two independent experiments. Error bars are standard error of the mean.
Figure 3—figure supplement 1
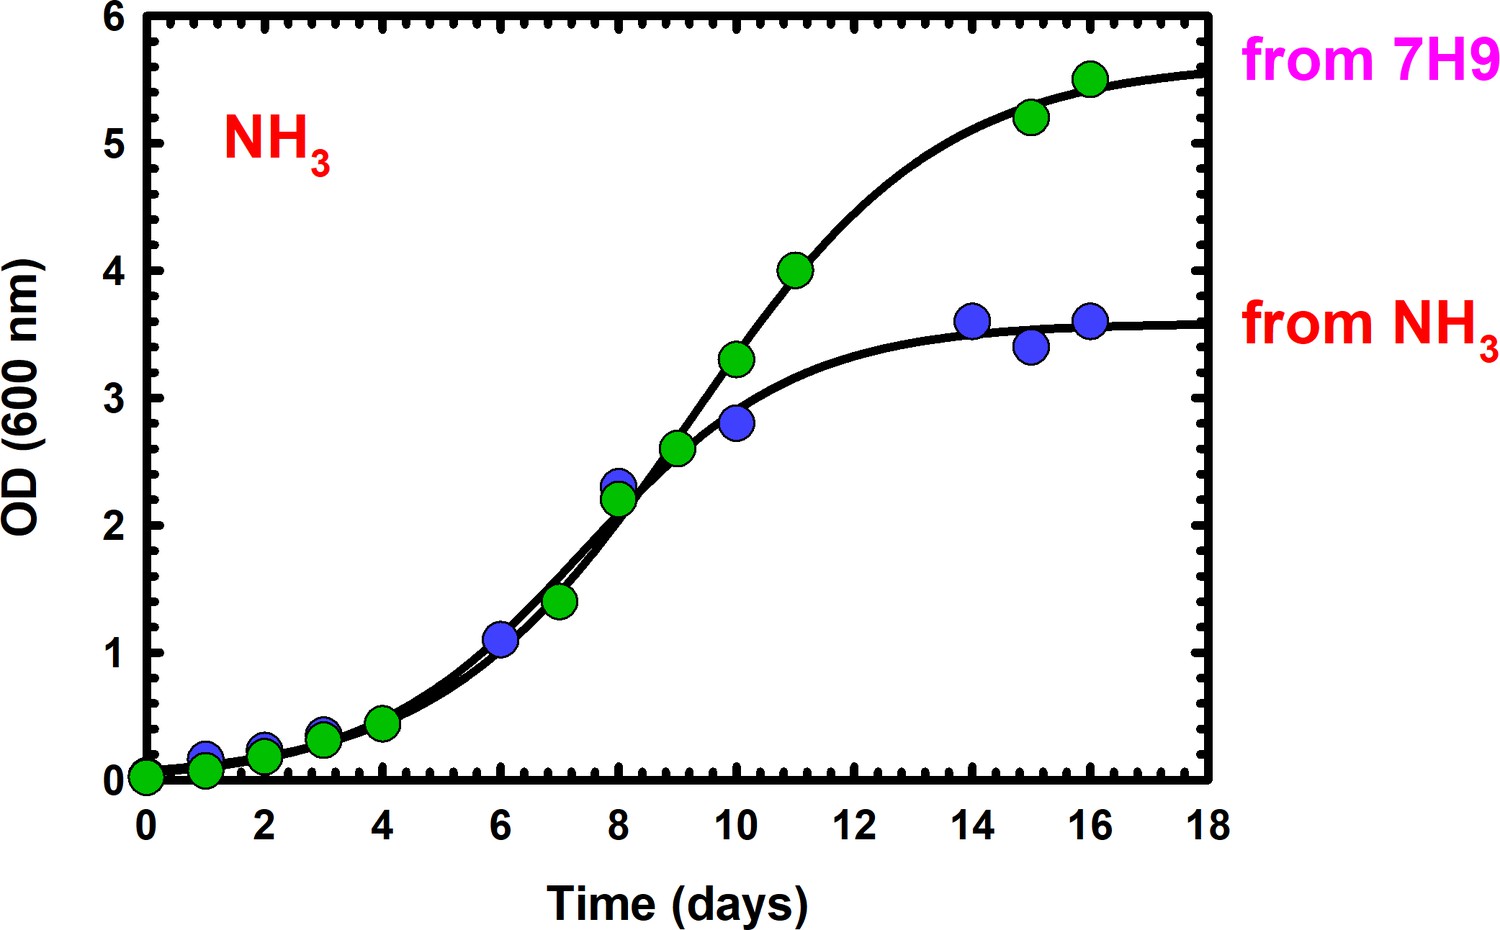
Effect of pre-adaptation on sole nitrogen source, prior to growth analysis.
Bacteria that have been used directly from 7H9 media (green circles), which contains (Glu and NH4+) grow to a higher biomass, compared to bacteria that have been pre-adapted (blue circles) in the exact sole carbon source tested (NH4+ at 4 mM). Each symbol represents a measurement from one independent experiment. Data is representative of two independent experiments.
Figure 4 with 2 supplements
Network structure and kinetic analysis of nitrogen utilisation by M. tuberculosis.
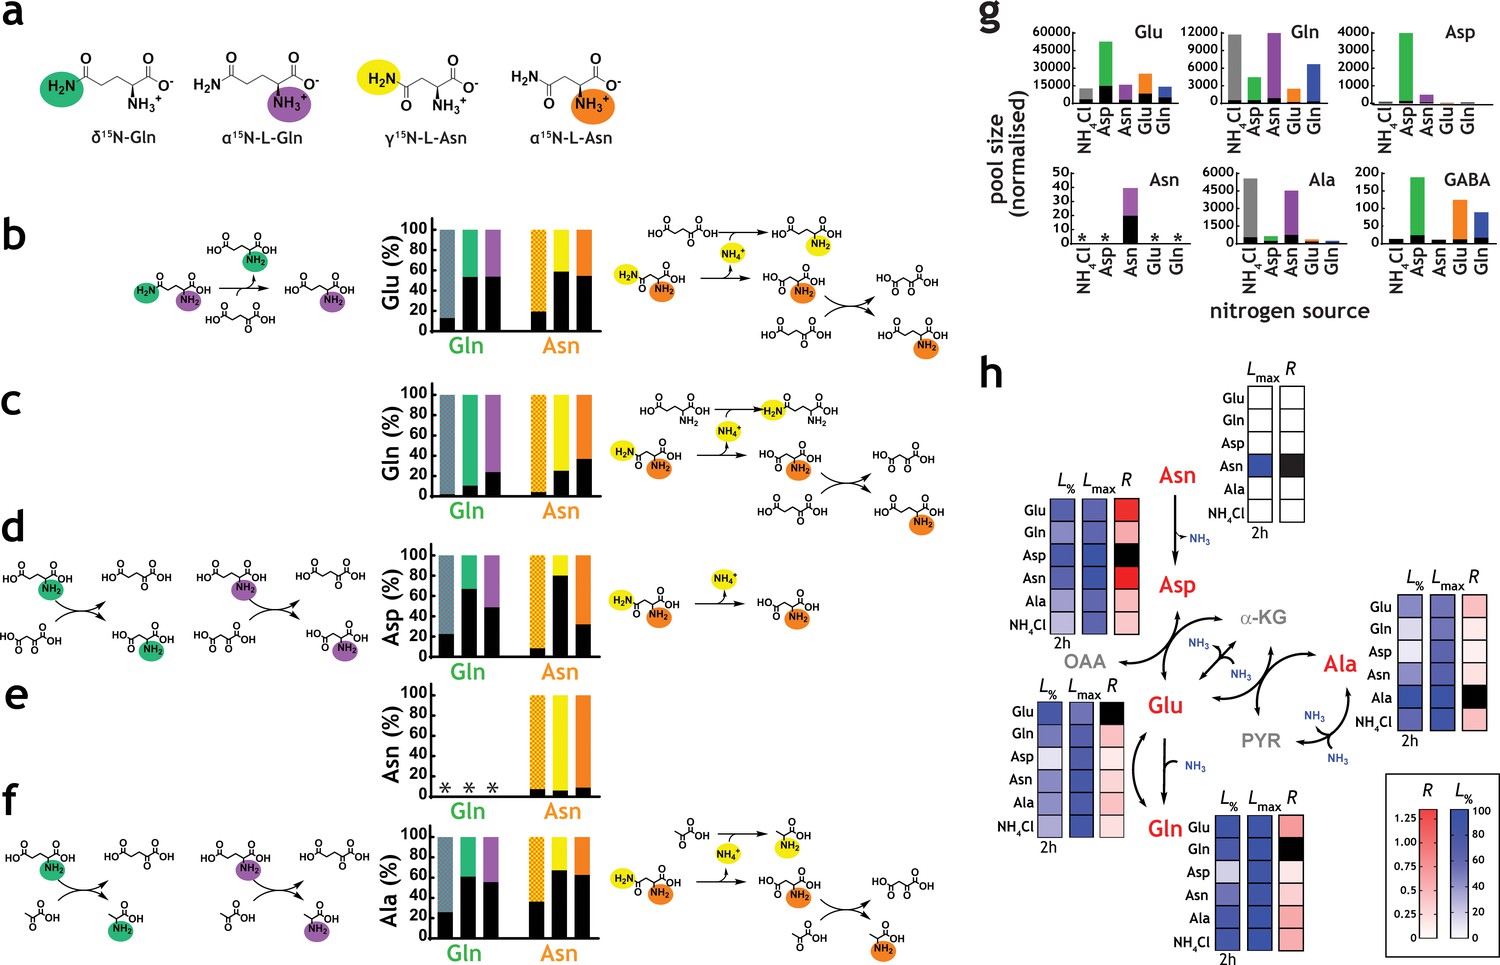
(a) Scheme illustrating the structure and position-specific labelling of nitrogen atoms on Gln and Asn. The following m/z values were used in positive mode (M+H)+: Glu – 148.0604, 15N-Glu – 149.0575, Gln – 147.0764, 15N-Gln – 148.0735, 15N2-Gln – 149.0705, Asp – 134.0448, 15N-Asp – 135.0418, Asn – 133.0608, 15N-Asn – 135.0578, 15N2Asn – 135.0548, Ala – 90.0550, and 15N-Ala – 91.0520. (b–f) Data on universally or position-specific labelled Gln or Asn and simplest metabolic routes that would lead to the expected labelling patterns obtained. (b) Labelling of Glu. Glutamate synthase (with Gln) and asparaginase, glutamate dehydrogenase and glutamate/oxaloacetate transaminase (with Asn). (c) Labelling of Gln. Asparaginase, glutamate dehydrogenase, glutamine synthetase (not shown) and glutamate/oxaloacetate transaminase, followed by glutamine synthetase (not shown). (d) Labelling of Asp. Glutamate synthase (not shown) and glutamate/oxaloacetate transaminase, with Gln. Asparginase is responsible for most of the labelling in Asp, when Asn is the sole nitrogen source. (e) Labelling of Asn. No Asn can be measured in Gln as sole nitrogen source. And most Asn is labelled when Asn is the sole nitrogen source. (f) Labelling of Ala. Glutamate synthase (not shown), glutamate/pyruvate transaminase, with Gln as sole nitrogen source. Asparaginase, alanine dehydrogenase and aspartate/pyruvate transaminase, with Asn as sole nitrogen source. (g) Representative labelling (coloured segment of the bars) and pool sizes for different amino acids obtained after 17 h culture in 15N-labelled nitrogen sources. Labelling data is coloured by nitrogen source and represents the sum of all labelled species for each ion. (h) Data illustrating quantitative analysis of nitrogen labelling in M. tuberculosis in sole nitrogen sources obtained during the course of 17 h. Labelling data (shown in Figure 4—figure supplement 1) was fitted to a single exponential rise to a maximum (). Black squares indicate uptake (cognate amino acid) and not metabolic labelling. Data shown is representative of two independent experiments.
Figure 4—figure supplement 1
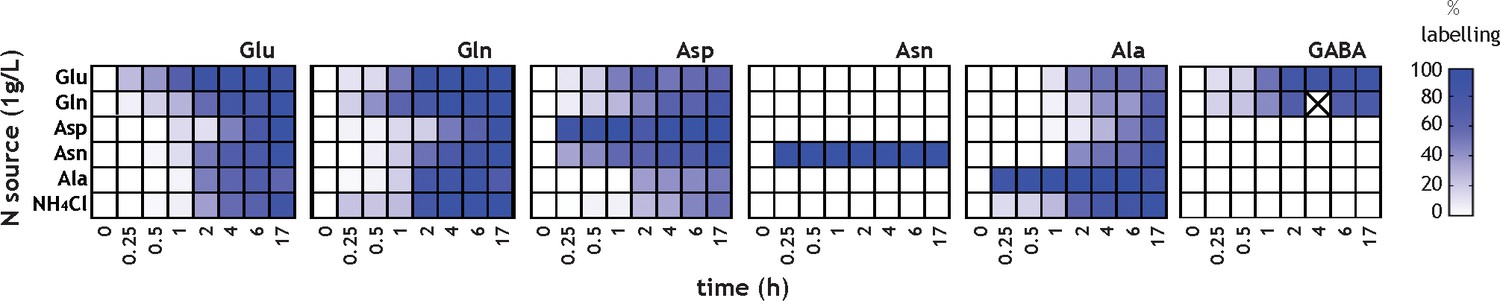
Kinetics of 15N label incorporation into core nitrogen metabolites was analysed by high-resolution mass spectrometry.
Labelled Asn was only observed when labelled Asn was provided as sole nitrogen source, and therefore this represents only uptake.
Figure 4—figure supplement 2
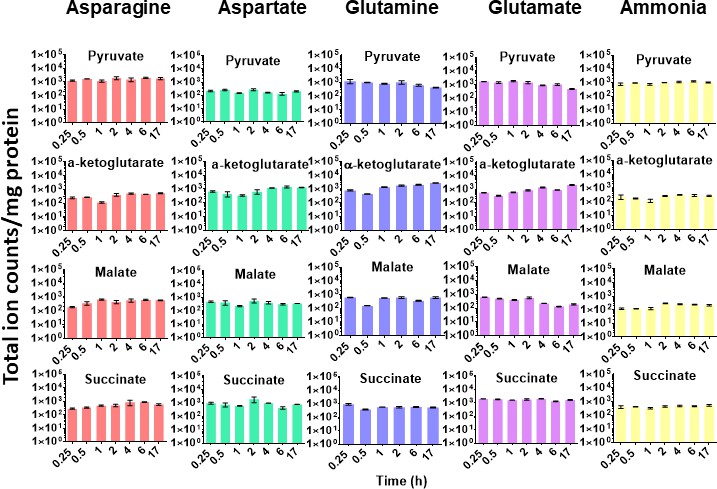
Minimal perturbations of carbon metabolism accompany utilisation of diverse nitrogen sources by M. tuberculosis.
Normalised pool sizes (ion counts/mg protein) of pyruvate (pyr), succinate (suc), α-ketoglutarate (α-KG) and L-malate (mal) from extracts of M. tuberculosis cultured in the presence of different sole nitrogen sources.
Figure 5 with 1 supplement
M. tuberculosis co-metabolises nitrogen sources.
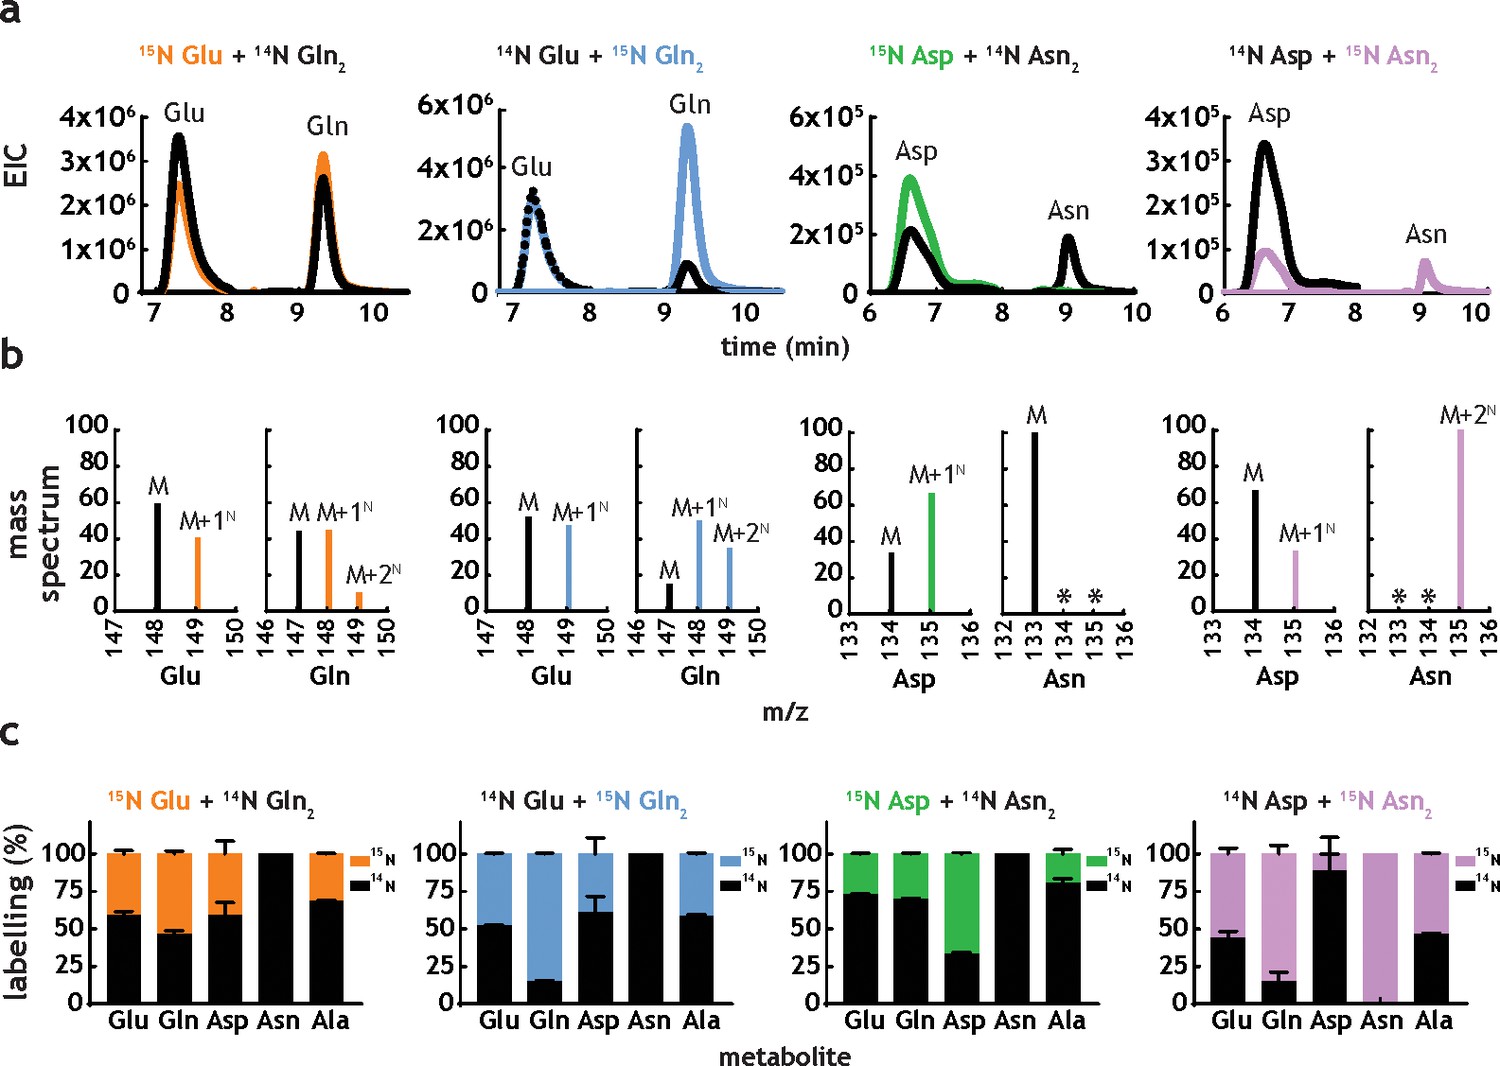
(a) Representative extracted ion chromatograms (EICs) for intracellular metabolites from cultures obtained in the presence of dual nitrogen sources (Glu + Gln or Asp +Asn), with one of the nitrogen sources 15N-labelled. (b) Representative mass spectra corresponding to the metabolites in Figure 5a. The following m/z values were used in positive mode (M + H)+: Glu – 148.0604, 15N-Glu – 149.0575, Gln – 147.0764, 15N-Gln – 148.0735, 15N2-Gln – 149.0705, Asp – 134.0448, 15N-Asp – 135.0418, Asn – 133.0608, 15N-Asn – 135.0578, and 15N2Asn – 135.0548. (c) Combined labelling data obtained for the same metabolites, in different combinations of two carbon sources. Bars are averages of three biological replicates, colour indicates labelled metabolites/nitrogen sources and error bars are the standard error of the mean.
Figure 5—figure supplement 1
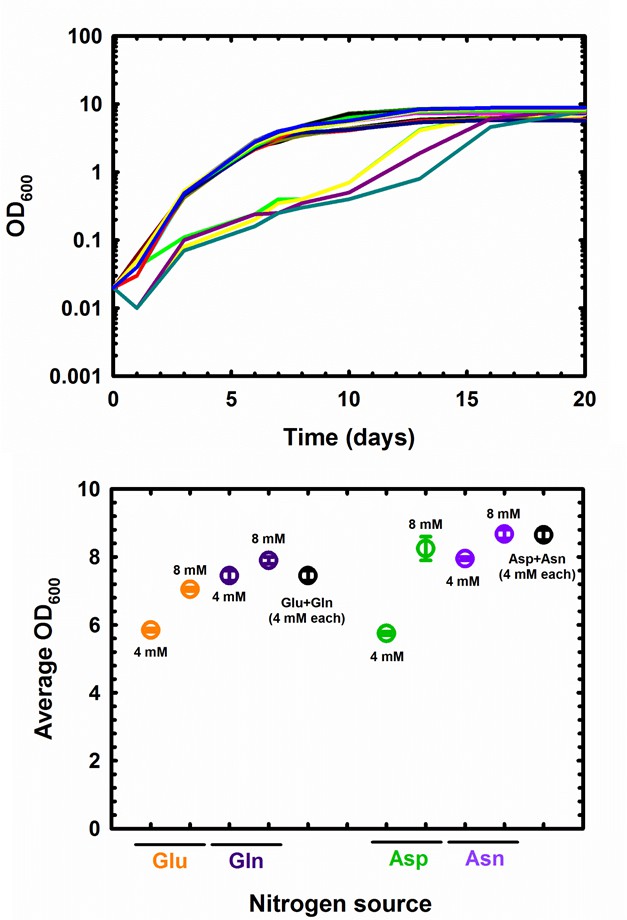
Growth of M. tuberculosis in single or dual nitrogen sources.
On the top panel, growth curves are shown to illustrate the delay in growth observed at 8 mM (green, yellow, dark purple and teal traces), in comparison to the rest of the conditions. On the bottom panel, average OD values obtained at 20 days are re-plotted.
Figure 6

Alanine and alanine dehydrogenase roles in M. tuberculosis nitrogen metabolism.
(a) Growth of M. tuberculosis on alanine as sole nitrogen source or in combination with a second nitrogen source. (b) Gene expression ratios (qPCR) in different nitrogen sources confirms induction of ald gene in the presence of NH4+-containing medium (lower values in the –N/+N plots). "0" indicates the original condition, "-N" indicates medium without a nitrogen source and "+N" indicates medium with a sole nitrogen source.gdh, glnA1, and ansA genes, encoding glutamate dehydrogenase, glutamine synthetase and asparaginase were used as controls, respectively. SigE (Rv1221) was used as internal standard. Symbol colour represents nitrogen source used. Dashed gray lines are used to indicate fold change. Error bars represent standard deviations from three biological replicates. (c) Growth of M. tuberculosis (WT), ald KO, and complemented strains in selected sole nitrogen sources. (d) Labelling of selected amino acids obtained with parent, ald KO, and complemented strains cultured in NH4+ or Gln as sole nitrogen sources. (e) Growth of M. tuberculosis in single nitrogen sources in the presence of various concentrations of bromo-pyruvate (top panels) or methionine sulfoximine (bottom panels), inhibitors of alanine dehydrogenase and glutamine synthetase, respectively. (f) Reaction catalysed by alanine dehydrogenase and glutamine synthetase and their inhibitors. Data shown are representative of two independent experiments. Error bars are standard error of the mean.
Tables
Key resources table
| Reagent type (species) or resource | Designation | Source or reference | Identifiers | Additional information |
|---|---|---|---|---|
| Strain, strain background (M. tuberculosis) | H37Rv | MRC-National Insititute for Medical Research | ||
| Strain, strain background (M. tuberculosis) | H37Rv (parent of KO) | doi: 10.1128/JB.05914–11. | Giffin et al., 2012 | |
| Strain, strain background (M. tuberculosis) | Alanine dehydrogenase KO | doi: 10.1128/JB.05914–11. | Giffin et al., 2012 | |
| Strain, strain background (M. tuberculosis) | Alanine dehydrogenase complement | doi: 10.1128/JB.05914–11. | Giffin et al., 2012 | |
| Software, algorithm | Prism 7 | GraphPad Software | ||
| Software, algorithm | Qualitative Navigator B.07.00 | Agilent software | ||
| Software, algorithm | Profinder B.08.00 | Agilent software | ||
| Chemical compound, drug | Middlebrook 7 H9 | Sigma-Aldrich | M0178 | |
| Chemical compound, drug | ADC supplement | Sigma-Aldrich | M0553 | |
| Chemical compound, drug | OADC supplement | Sigma-Aldrich | M0678 | |
| Chemical compound, drug | Middlebrook 7 H10 | Sigma-Aldrich | M0303 | |
| Chemical compound, drug | Tyloxopol | Sigma-Aldrich | T8761 | |
| Chemical compound, drug | Glycerol | Sigma-Aldrich | G5516 | |
| Chemical compound, drug | Sodium sulphate | Sigma-Aldrich | 239313 | |
| Chemical compound, drug | Sodium citrate | Sigma-Aldrich | 51804 | |
| Chemical compound, drug | Pyridoxine | Sigma-Aldrich | P9755 | |
| Chemical compound, drug | Biotin | Sigma-Aldrich | B4501 | |
| Chemical compound, drug | Sodium phosphate dibasic | Sigma-Aldrich | 71642 | |
| Chemical compound, drug | Potassium phosphate monobasic | Sigma-Aldrich | 60220 | |
| Chemical compound, drug | Ferric ammonium citrate | Sigma-Aldrich | F5879 | |
| Chemical compound, drug | Ferric citrate | Sigma-Aldrich | F3388 | |
| Chemical compound, drug | Magnesium sulphate | Sigma-Aldrich | M5921 | |
| Chemical compound, drug | Calcium chloride | Sigma-Aldrich | C8106 | |
| Chemical compound, drug | Zinc sulphate | Sigma-Aldrich | 1724769 | |
| Chemical compound, drug | Copper sulphate | Sigma-Aldrich | C6283 | |
| Chemical compound, drug | Malachite green | Sigma-Aldrich | M9015 | |
| Chemical compound, drug | L-glutamatic acid | Sigma-Aldrich | G1251 | |
| Chemical compound, drug | L-glutamine | Sigma-Aldrich | G3126 | |
| Chemical compound, drug | L-asparagine | Sigma-Aldrich | A4159 | |
| Chemical compound, drug | L-aspartatic acid | Sigma-Aldrich | A9256 | |
| Chemical compound, drug | Ammonium chloride | Sigma-Aldrich | A9434 | |
| emical compound, drug | Bromo-pyruvate | Sigma-Aldrich | 16490 | |
| Chemical compound, drug | Methionine sulfoximine | Sigma-Aldrich | M5379 | |
| Chemical compound, drug | L-Alanine-(15N2) | Cambridge Isotope Laboratory | NLM-454–1 | |
| Chemical compound, drug | L-Asparagine-(15N2) | Cambridge Isotope Laboratory | NLM-3286 | |
| Chemical compound, drug | L-Asparagine-(amine-15N) | Sigma-Aldrich | 489964 | |
| Chemical compound, drug | L-Asparagine-(amide-15N) | Cambridge Isotope Laboratory | NLM-120 | |
| Chemical compound, drug | L-Aspartate-(15N) | Sigma/Cambridge Isotope Laboratory | 332135/NLM-718 | |
| Chemical compound, drug | L-Glutamine-(15N2) | Cambridge Isotope Laboratory | NLM-31328 | |
| Chemical compound, drug | L-Glutamine-(amine-15N) | Sigma-Aldrich | 486809 | |
| Chemical compound, drug | L-Glutamine-(amide-15N) | Cambridge Isotope Laboratory | NLM-557 | |
| Chemical compound, drug | L-Glutamate-(15N) | Sigma/Cambridge Isotope Laboratory | 332143/NLM-135 | |
| Chemical compound, drug | Ammonium chloride -(15N) | Sigma-Aldrich | 299251 | |
| Chemical compound, drug | Acetonitrile | Fisher | A955-212 | |
| Chemical compound, drug | Methanol | Fisher | A456-212 | |
| Chemical compound, drug | Acetic acid | Fluka | 45740–1 L-F | |
| Sequence-based reagent | Rv0337c-fw | Integrated DNA Technologies | 5'-CACTCCGGTCCACTACCTGT-3' | qPCR primer |
| Sequence-based reagent | Rv0337c-rev | Integrated DNA Technologies | 5'- AGATCGACCATCTGGGTGAG-3' | qPCR primer |
| Sequence-based reagent | Rv0858c-fw | Integrated DNA Technologies | 5'- ACGGCACGTACTTCCTATGC-3' | qPCR primer |
| Sequence-based reagent | Rv0858c-rev | Integrated DNA Technologies | 5'- GTTCCACACATCGGCTTGTT-3' | qPCR primer |
| Sequence-based reagent | Rv1178-fw | Integrated DNA Technologies | 5'- ACGAGTGCTACCTGGGATTG-3' | qPCR primer |
| Sequence-based reagent | Rv1178-rev | Integrated DNA Technologies | 5'- AGTAGCTCGGCAACGATCTC-3' | qPCR primer |
| Sequence-based reagent | Rv1538c-fw | Integrated DNA Technologies | 5'- ACTGGAGGGACAATCTCGAC-3' | qPCR primer |
| Sequence-based reagent | Rv1538c-rev | Integrated DNA Technologies | 5'- GAGTGATGACCACCCCATCT-3' | qPCR primer |
| Sequence-based reagent | Rv2220-fw | Integrated DNA Technologies | 5'- GACAAGAGCGTGTTTGACGA-3' | qPCR primer |
| Sequence-based reagent | Rv2220-rev | Integrated DNA Technologies | 5'- GGGTCGTGCACAAAGAAGTT-3' | qPCR primer |
| Sequence-based reagent | Rv2476c-fw | Integrated DNA Technologies | 5'- GTACAGCCTGCTCGACATCA-3' | qPCR primer |
| Sequence-based reagent | Rv2476c-rev | Integrated DNA Technologies | 5'- AGCGCACCGTAAATATCGTC-3' | qPCR primer |
| Sequence-based reagent | Rv2780-fw | Integrated DNA Technologies | 5'- CTTACCACCTGATGCGAACC-3' | qPCR primer |
| Sequence-based reagent | Rv2780-rev | Integrated DNA Technologies | 5'- TAGGCCGATGAGTAGCGAGT-3' | qPCR primer |
| Sequence-based reagent | Rv3565-fw | Integrated DNA Technologies | 5'- TCTACGTGATGGACGTCTGG-3' | qPCR primer |
| Sequence-based reagent | Rv3565-rev | Integrated DNA Technologies | 5'- CACCGAGTATCCCAACTGGT-3' | qPCR primer |
| Sequence-based reagent | Rv1221-fw | Integrated DNA Technologies | 5'- ACCATCACGACCTTGAGTCC-3' | qPCR primer |
| Sequence-based reagent | Rv1221-rev | Integrated DNA Technologies | 5'- AAAGGTCTCCTGGGTCAGGT-3' | qPCR primer |
| Sequence-based reagent | Rv2703-fw | Integrated DNA Technologies | 5'- CCTACGCTACGTGGTGGATT-3' | qPCR primer |
| Sequence-based reagent | Rv2703-rev | Integrated DNA Technologies | 5'- TGGATTTCCAGCACCTTCTC-3' | qPCR primer |
| Other | Spin-X centrifuge tube filter cellulose acetate 0.22 mM | Costar | 8160 | |
| Other | Mixed cellulose esters membrane, 0.22 mM | Millipore | GSWP02500 | |
| Other | Acid washed glass beads | Sigma-Aldrich | G1145 |
Additional files
-
Transparent reporting form
- https://doi.org/10.7554/eLife.41129.015
Download links
A two-part list of links to download the article, or parts of the article, in various formats.
Downloads (link to download the article as PDF)
Open citations (links to open the citations from this article in various online reference manager services)
Cite this article (links to download the citations from this article in formats compatible with various reference manager tools)
Flexible nitrogen utilisation by the metabolic generalist pathogen Mycobacterium tuberculosis
eLife 8:e41129.
https://doi.org/10.7554/eLife.41129


