Dissecting the sharp response of a canonical developmental enhancer reveals multiple sources of cooperativity
- Harvard Medical School, United States
Figures
Figure 1
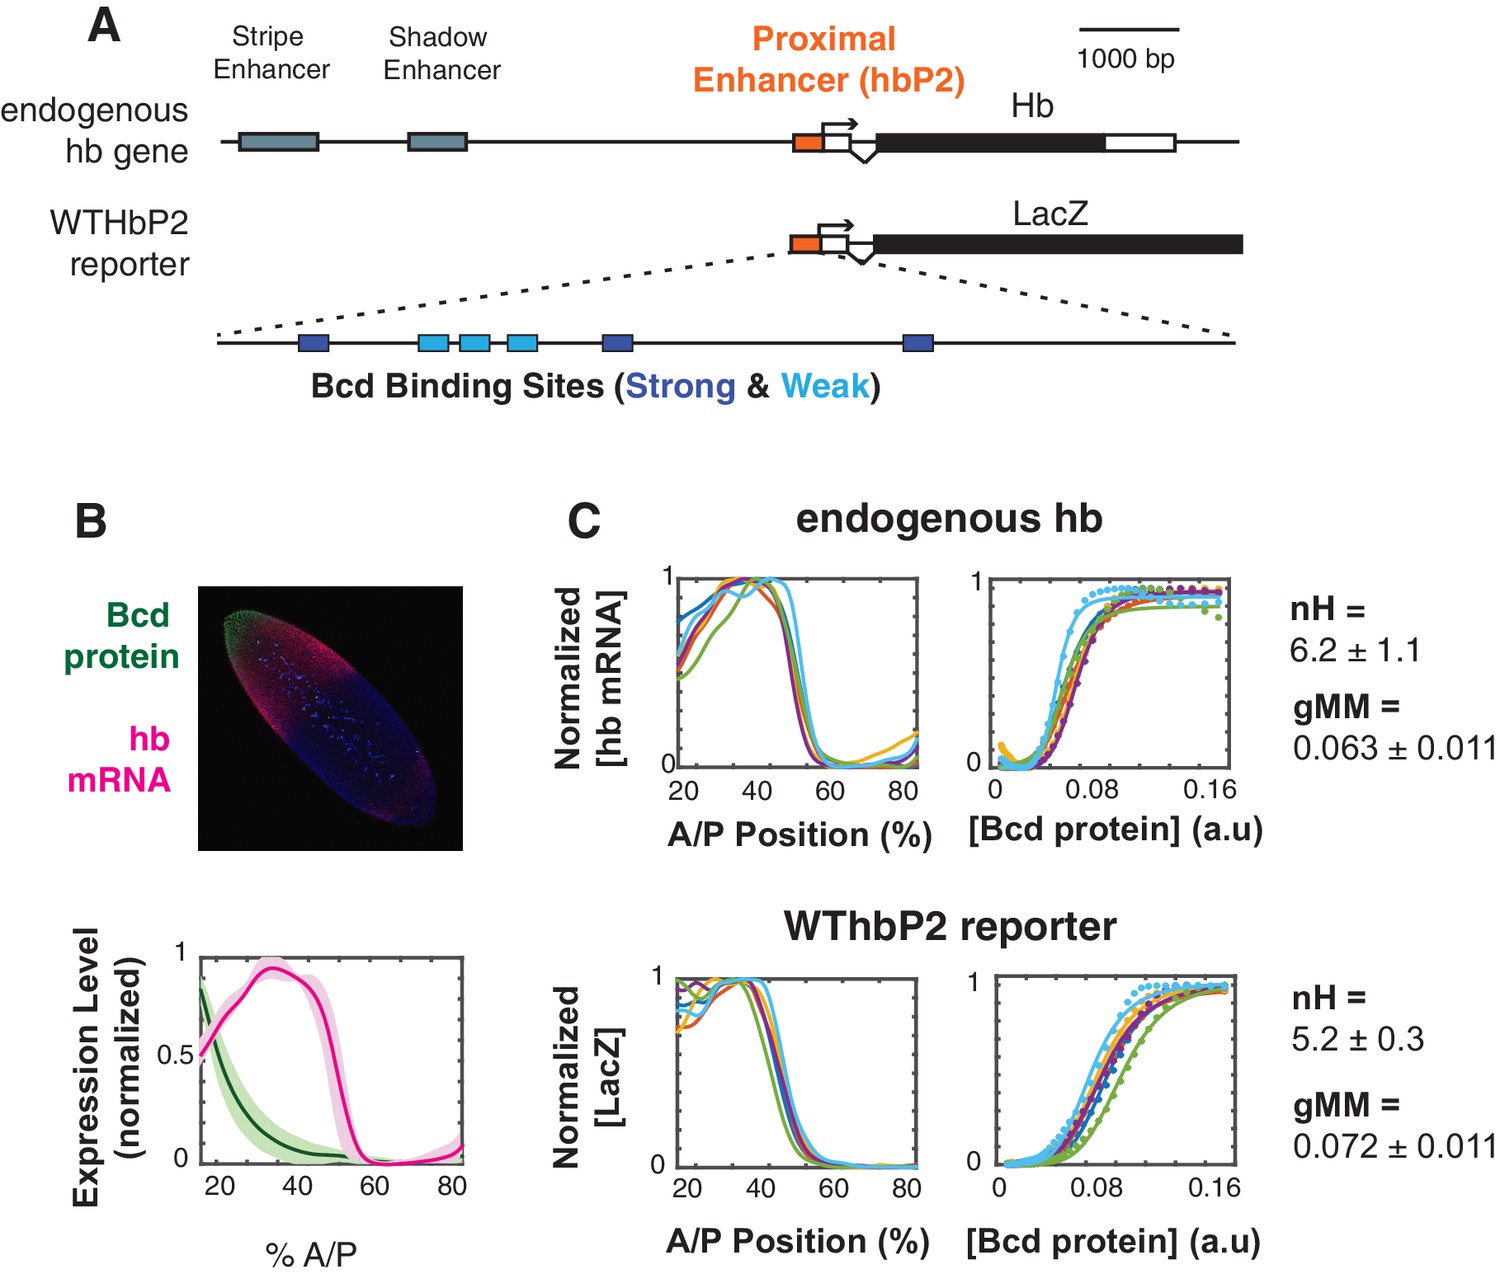
The WTHbP2 enhancer directs a sharp expression pattern in the Drosophila blastoderm embryo.
(A) Schematics of the hunchback (hb) gene locus showing the three enhancers active in the blastoderm (top) and our reporter construct designed to express lacZ mRNA from the proximal enhancer (HbP2) and hb native promoter. HbP2 has six foot-printed Bicoid binding sites (bottom). (B) (top) A Drosophila melanogaster blastoderm embryo at nuclear cycle 14 stained for Bicoid (Bcd) protein and hb mRNA; image is a maximum projection of z-stack. (bottom) The average Bcd protein and hb expression profiles along anterior-posterior (AP) axis measured at midsagittal plane; data from six embryos. Average is represented by the thick line, standard deviation is shown by the shaded area. (C) GRFs for hb mRNA and WTHbP2-reporter expression profiles. Expression of hb or LacZ along the anterior posterior axis is plotted on the left; hb or LacZ expression relative to Bcd concentration is shown on the right. Colors represent individual embryos. Lines on the left are extracted expression traces. On the right, each dot is a measured mRNA level and lines represent fits to the Hill function. From these data, we computed the Hill coefficient (nH), which reflects the shape of the curve, and generalised Michaelis-Menten constant (gMM) which reflects the location of the expression boundary along the anterior/posterior axis.
Figure 2 with 1 supplement
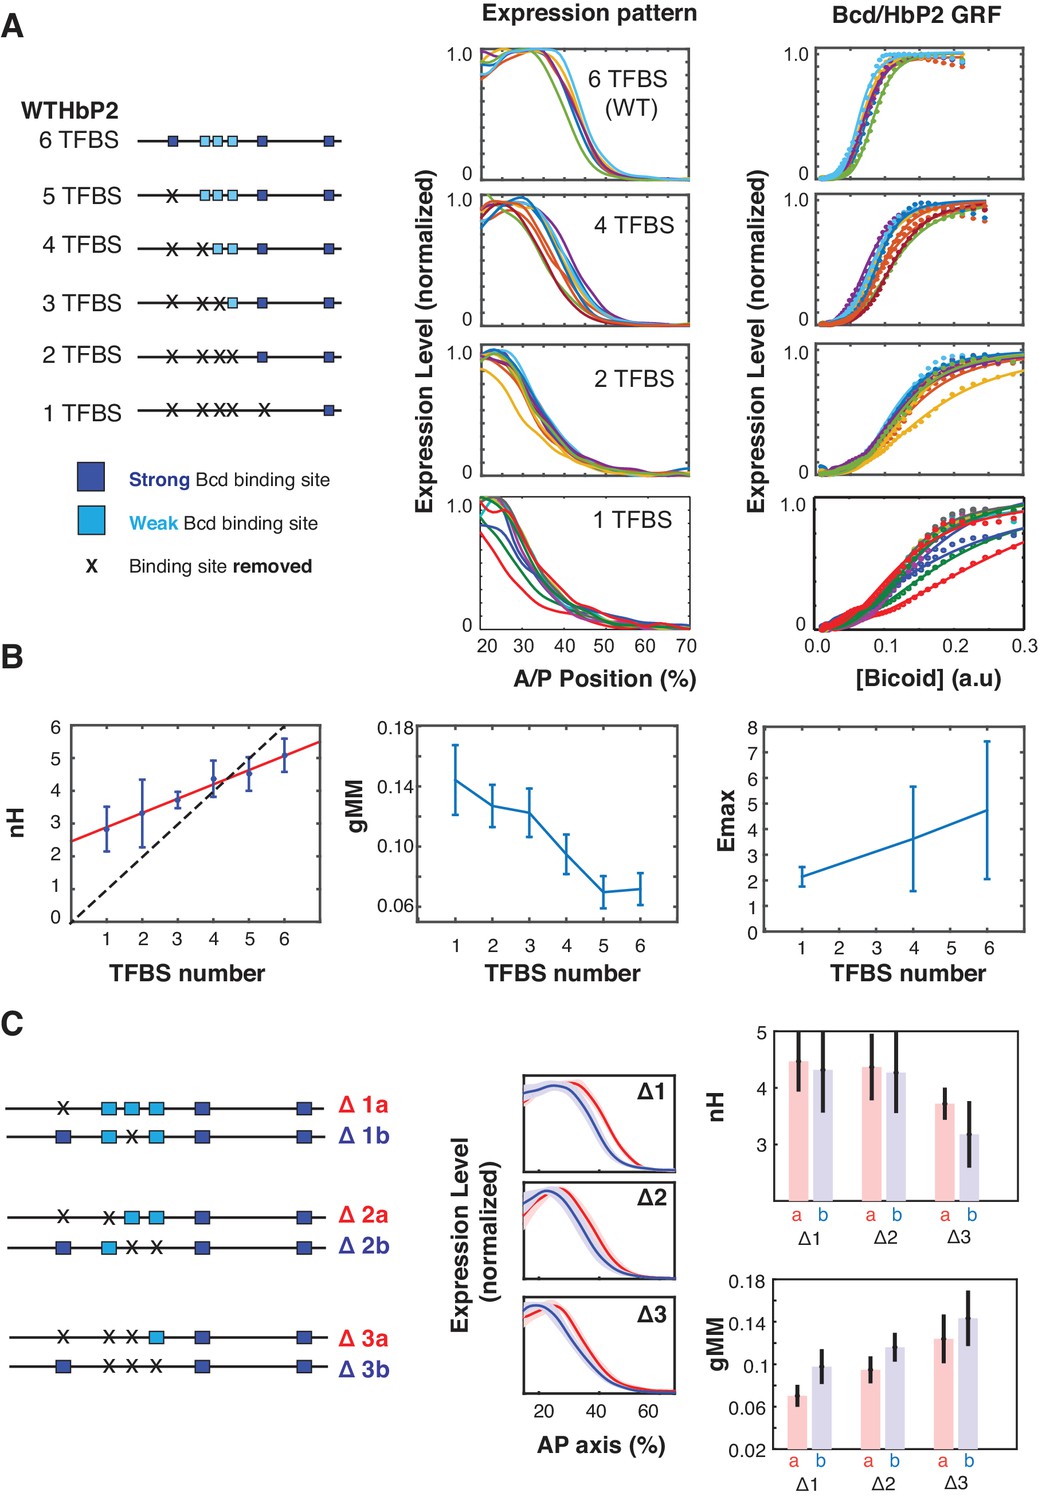
Sequence variants of HbP2 contradict the classical Hill function model.
(A) (left) Schematics of hbP2-reporter constructs with Bcd binding sites sequentially removed by mutation to preserve the length of the construct. (center) mRNA expression profiles obtained from embryos that carry transgenic reporter constructs shown on the left. (right) GRF of Bcd to LacZ level from each constructs. Dots represent measured mRNA value and lines show a fit to Hill function. (B) From these data, we computed the Hill coefficient (nH), which reflects the shape of the curve, and generalised Michaelis-Menten constant (gMM) which reflects the location of the expression boundary along the anterior/posterior axis. The mRNA expression level at maximum (Emax) was measured for subsets of constructs using a co-stain method (Wunderlich et al., 2014). These quantities are plotted against the number of Bcd binding sites in each construct. (C) (left) Schematics of mutant hbP2 constructs where 1, 2, or 3 Bcd binding sites were removed at different positions. (center) Average expression profiles for each construct on the left. Colors are as indicated. Average is represented by the thick line, standard deviation is shown by the shaded area. We extracted both gMM and nH from these data by comparing Bcd input to the LacZ expression profile for each reporter construct. These analyses reveal that different Bcd binding sites have roughly equal contributions to the HbP2 GRF.
Figure 2—figure supplement 1
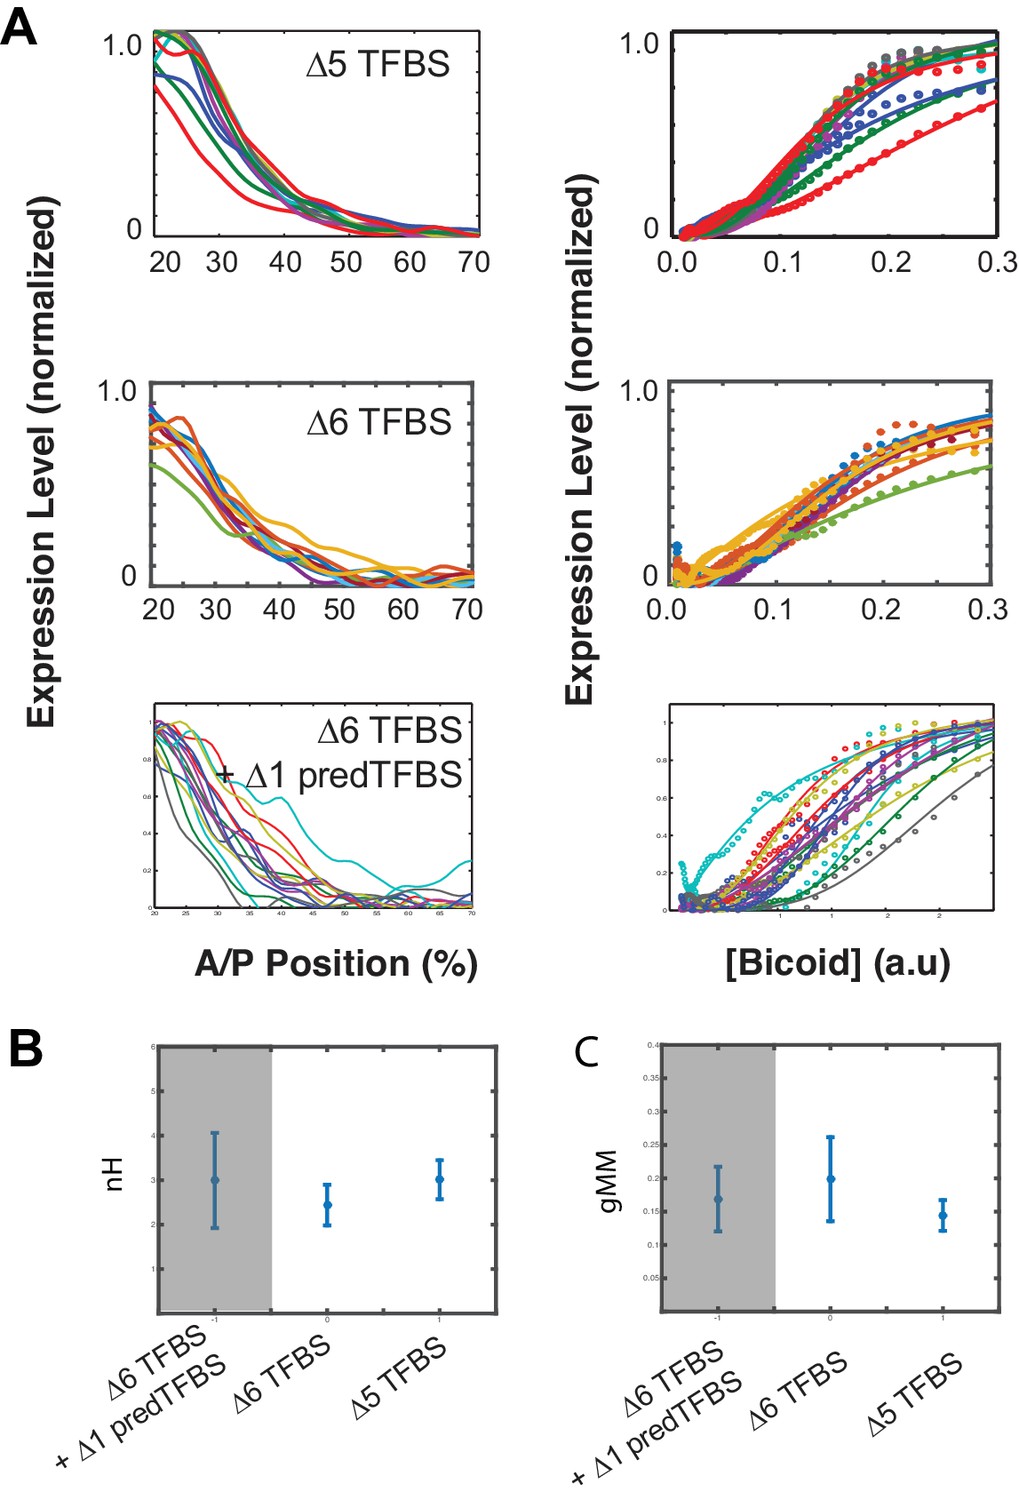
Residual expression remains even after removing all six canonical Bcd TFBS, and also two additional predicted TFBSs.
The WTHbP2 sequence contains six canonical predicted Bcd binding sites and one additional predicted site that overlaps with X3. The native hb promoter also contains an additional predicted Bcd binding site. We removed both of these sites (delta6 TFBS +delta1 predTFBS) and measured expression in reporter constructs in embryos. We also show data from delta6, where all six canonical WTHbP2 Bcd binding sites have been removed, and data from delta5 for comparison (also shown in Figure 2). (A) (left) mRNA expression profile obtained from embryos that carry transgenic reporter constructs with Bcd TFBS removed. (right) Bcd/LacZ GRF for each reporter construct. Dots represent measured value and lines show a fit to Hill function. (B) Hill Coefficient (nH) obtained from each reporter construct, reflecting the shape of the GRF. (C) The generalised Michaelis-Menten constant obtained from each construct, reflecting the location of the expression boundary.
Figure 3 with 1 supplement
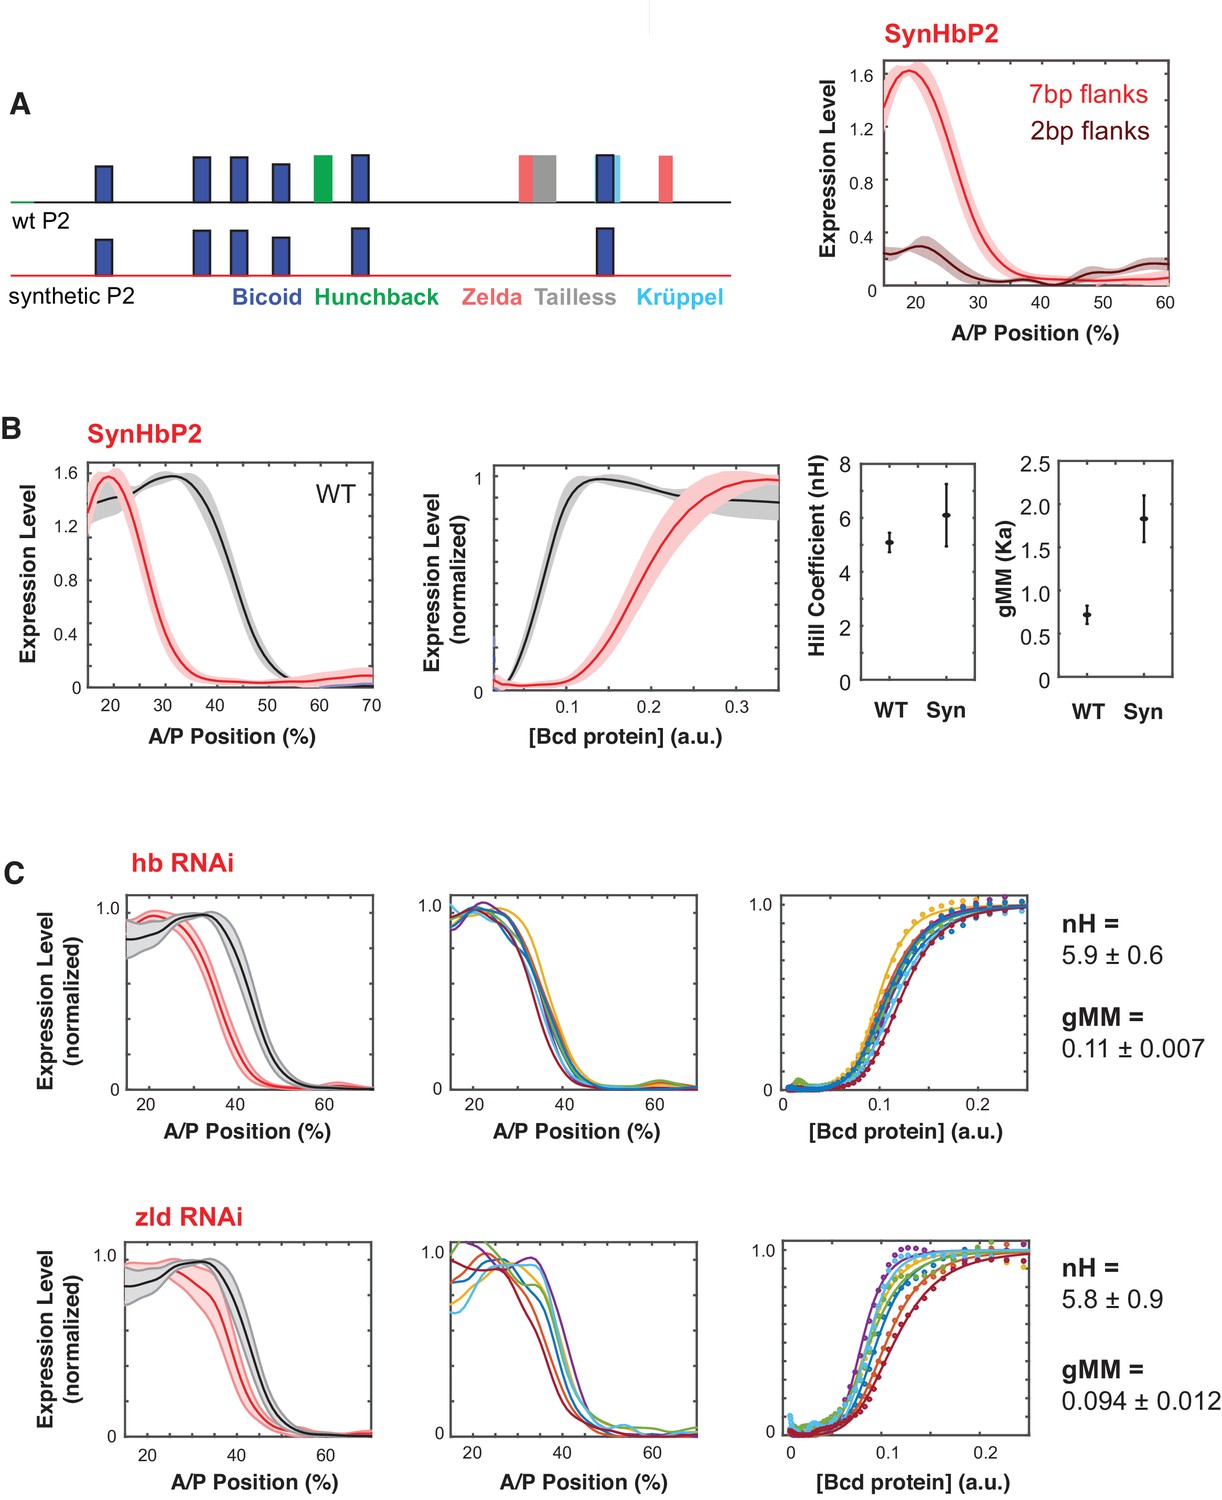
Synthetic HbP2 enhancer reveals the contribution of Bicoid and other transcription factors to the shape and location of expression.
(A) Schematics of WTHbP2 illustrating the location and affinity of predicted binding sites for Bicoid (Bcd, dark blue), Hunchback (Hb, green), Zelda (Zld, red), Tailless (tll, grey) and Krüppel (Kr, light blue), and SynHbP2 where these other sites have been replaced by a computationally designed synthetic DNA backbone. In SynHbP2, Bcd binding sites are preserved in their native position and flanked by differing amounts of endogenous DNA. SynHbP2 constructs containing Bcd binding sites without endogenous flanking sequences did not express (data not shown); adding back native sequence (+2 bp or +7 bp) flanking Bicoid TFBS restored expression (right). (B) SynHbP2 expresses in an anteriorly shifted position, but with a comparable shape. On the left, we compare the expression driven by WTHbP2 to expression driven by SynHbP2 with 7 bp flanks (hereafter SynHbP2) along the anterior posterior axis. On the right, we convert the data into the Bcd/LacZ GRF and extract nH and gMM as previously described. (C) We depleted Hunchback and Zelda from blastoderm embryos using RNAi to test their role in regulating WTHbP2. We show the average LacZ expression profiles from RNAi treated embryos (left column, thick line is the average over eight embryos, shaded area indicates standard deviation), the Bcd/LacZ GRF (center column), and the fit of the GRF to a Hill function to extract nH and gMM (right column). For reference, nH and gMM for WTHbP2 are 5.2 ± 0.3 and 0.072 ± 0.011, respectively.
Figure 3—figure supplement 1
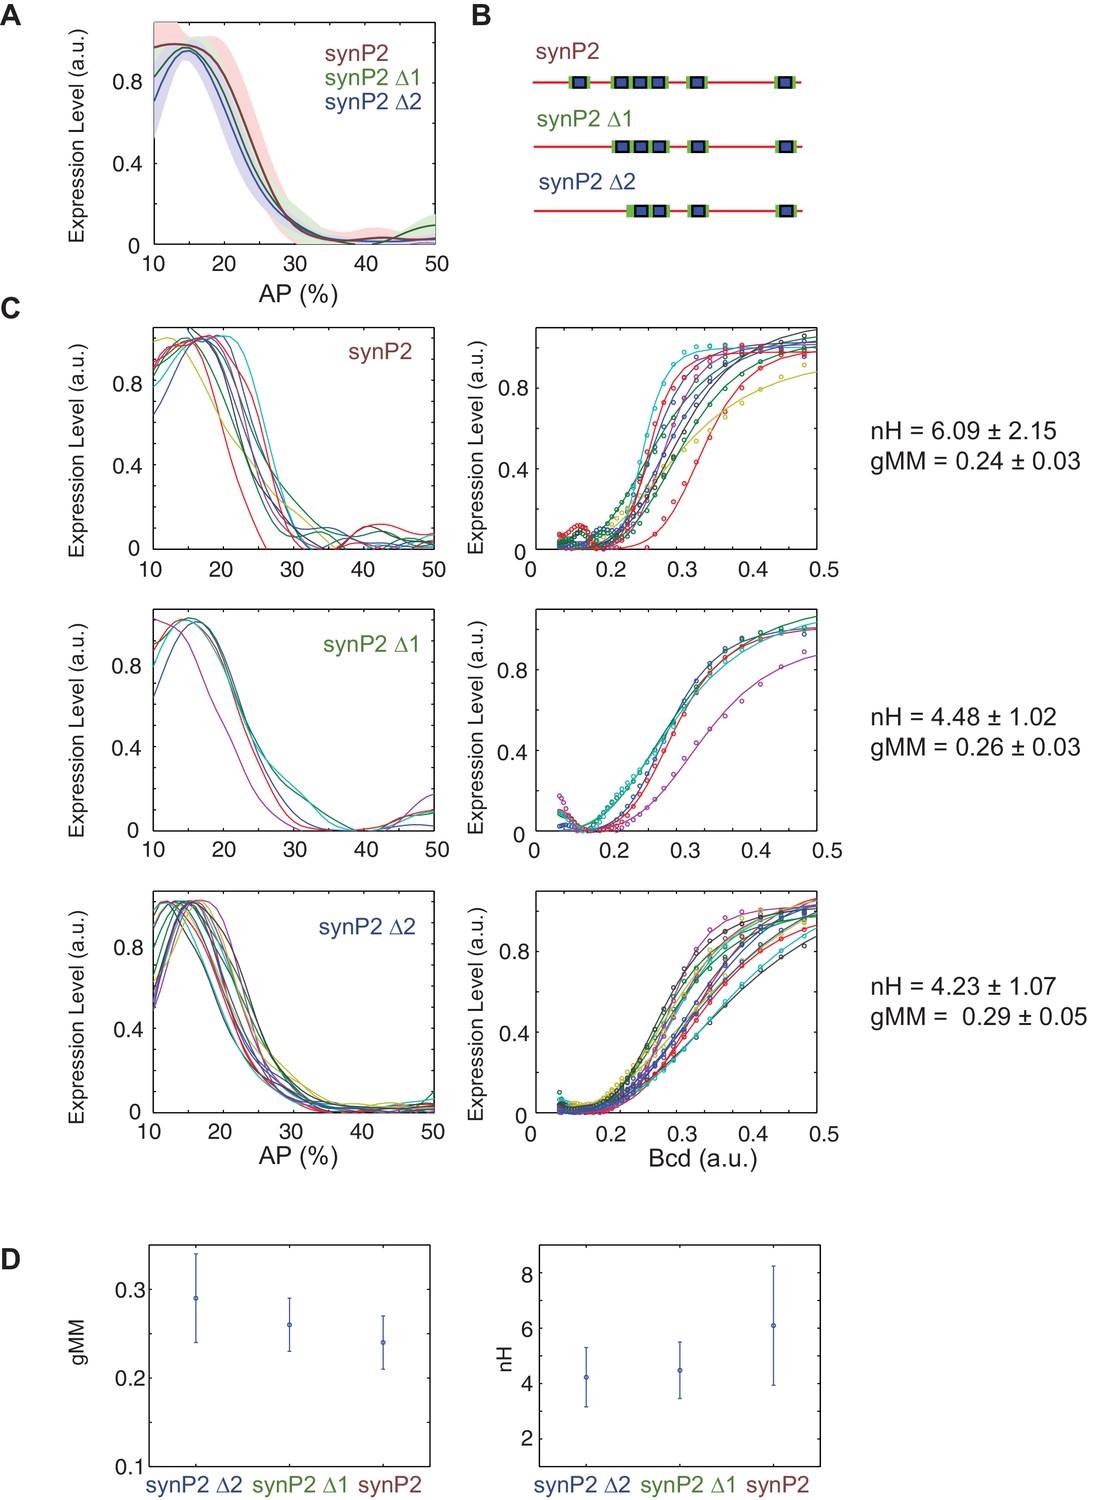
Removing Bcd TFBS from SynHbP2 reporter construct.
We deleted binding sites from a version of SynHbP2 that contained 12 bp of endogenous sequence flanking each Bcd binding site. (A) Average expression profile from SynP2 deletion constructs color coded as in B. Shaded area indicates standard deviation. (B) Schematics of SynhbP2-reporter constructs with binding site sequentially removed. (C) (left) mRNA expression profiles obtained from embryos that carry transgenic reporter constructs. (right) Bcd/LacZ GRFs for each construct in (B). Dots represent measured value and lines show a fit to Hill function. (D) Hill Coefficient (nH) obtained from each reporter construct, reflecting the shape of the GRF. The generalised Michaelis-Menten constant obtained from each construct, reflecting the location of the expression boundary.
Figure 4
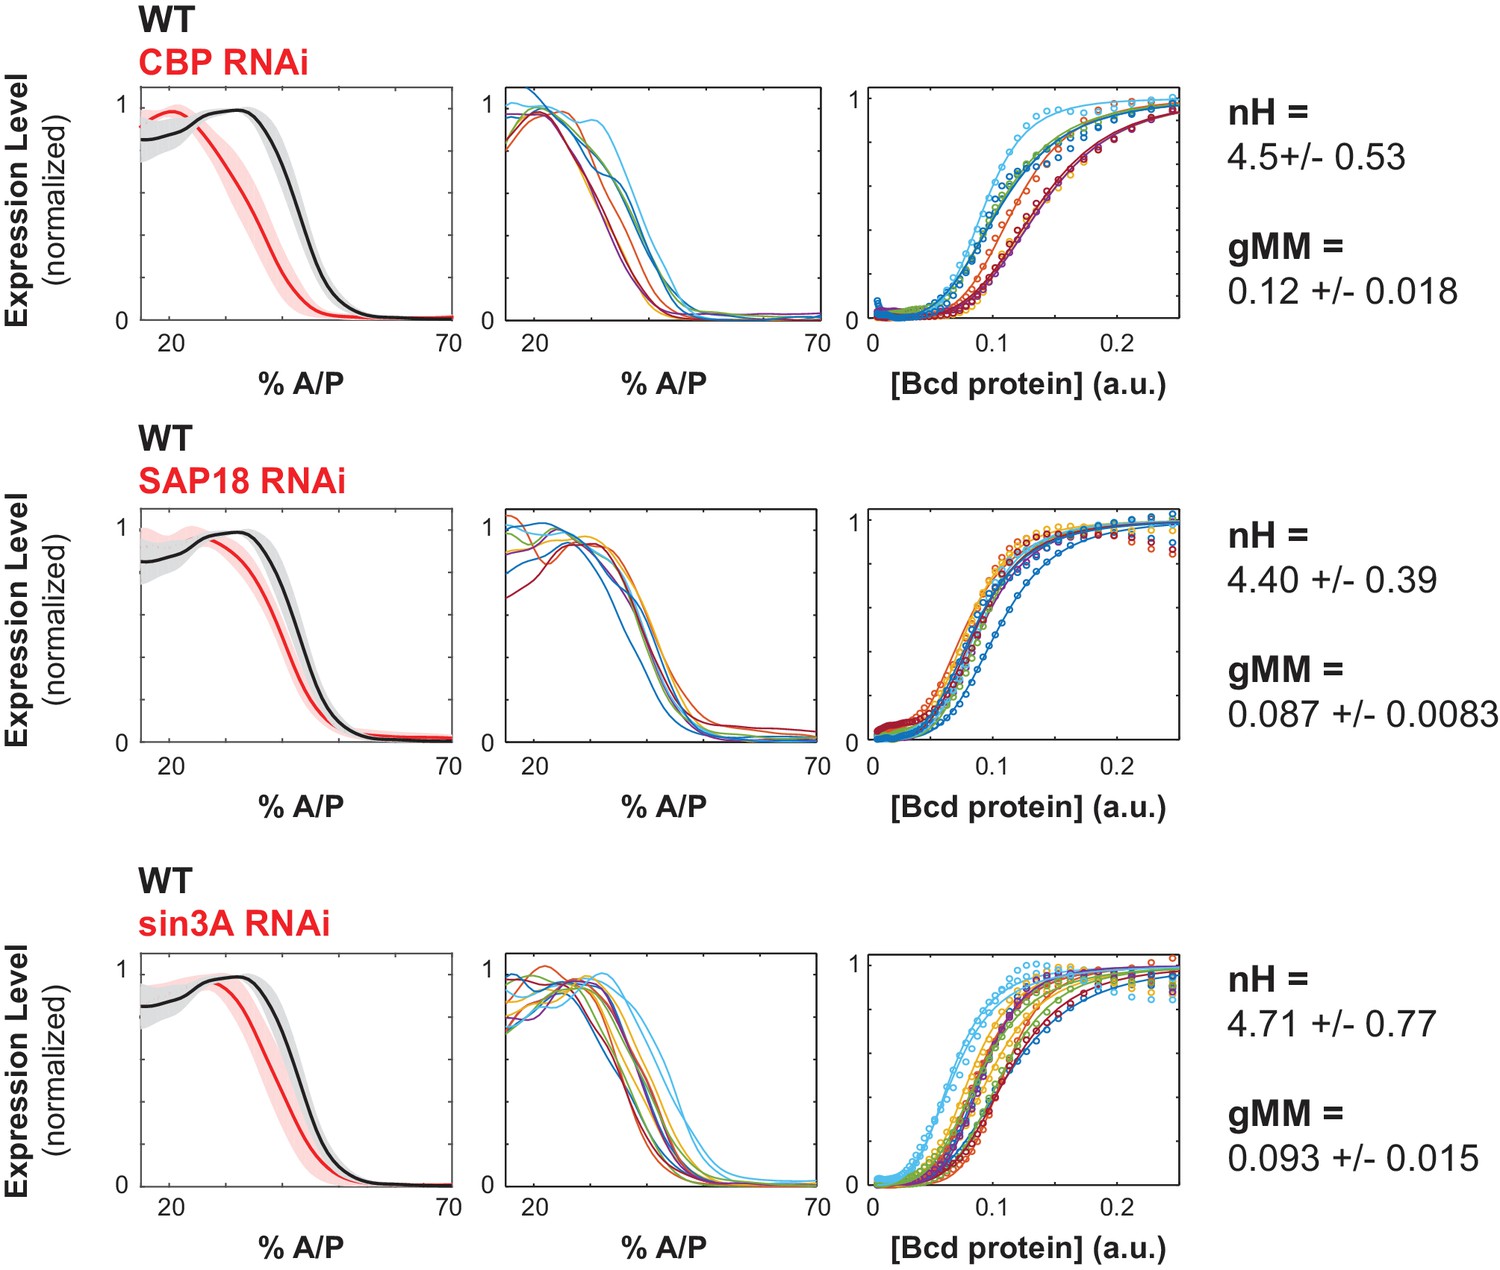
Chromatin remodelers and histone modifiers influence the WTHbP2 GRF.
We knocked down the maternal contribution of multiple trans factors using RNAi in embryos harboring the WTHbP2 reporter. We stained for LacZ expression and present the average expression profile (left), the expression traces from individual embryos (center), and the Hill function fits of Bcd/LacZ GRFs from individual embryos (right). The number of embryos imaged is listed in Table 2. We present three proteins whose knockdown had a significant effect on the location of WTHbP2 expression. CBP is a histone acetylase that coactivates Bcd (Fu et al., 2004). SAP18 and Sin3A are cofactors of Bicoid that have histone deacetylase activity (Singh et al., 2005). For reference, nH and gMM for WTHbP2 are 5.2 ± 0.3 and 0.072 ± 0.011, respectively.
Figure 5

Mediator subunits affect the shape of the WTHbP2 GRF.
Mediator subunits were knocked down using RNAi (see Materials and Methods). The number of embryos imaged is listed in Table 2. (Left column) Average gene expression profiles from hbP2-reporter construct in embryos with respective trans-factors depleted using RNAi; bold line is the average, shadow is the standard deviation. (Middle column) Individual gene expression profiles from each embryo; each color represents a separate embryo. (Right column) Bcd/LacZ mRNA GRF fit to the Hill function. Hill coefficient (nH) reflects the shape of the curve, generalized Michaelis Menten coefficient (gMM) reflects the location along the anterior posterior axis. For reference, nH and gMM for WTHbP2 are 5.2 ± 0.3 and 0.072 ± 0.011, respectively.
Figure 6 with 4 supplements
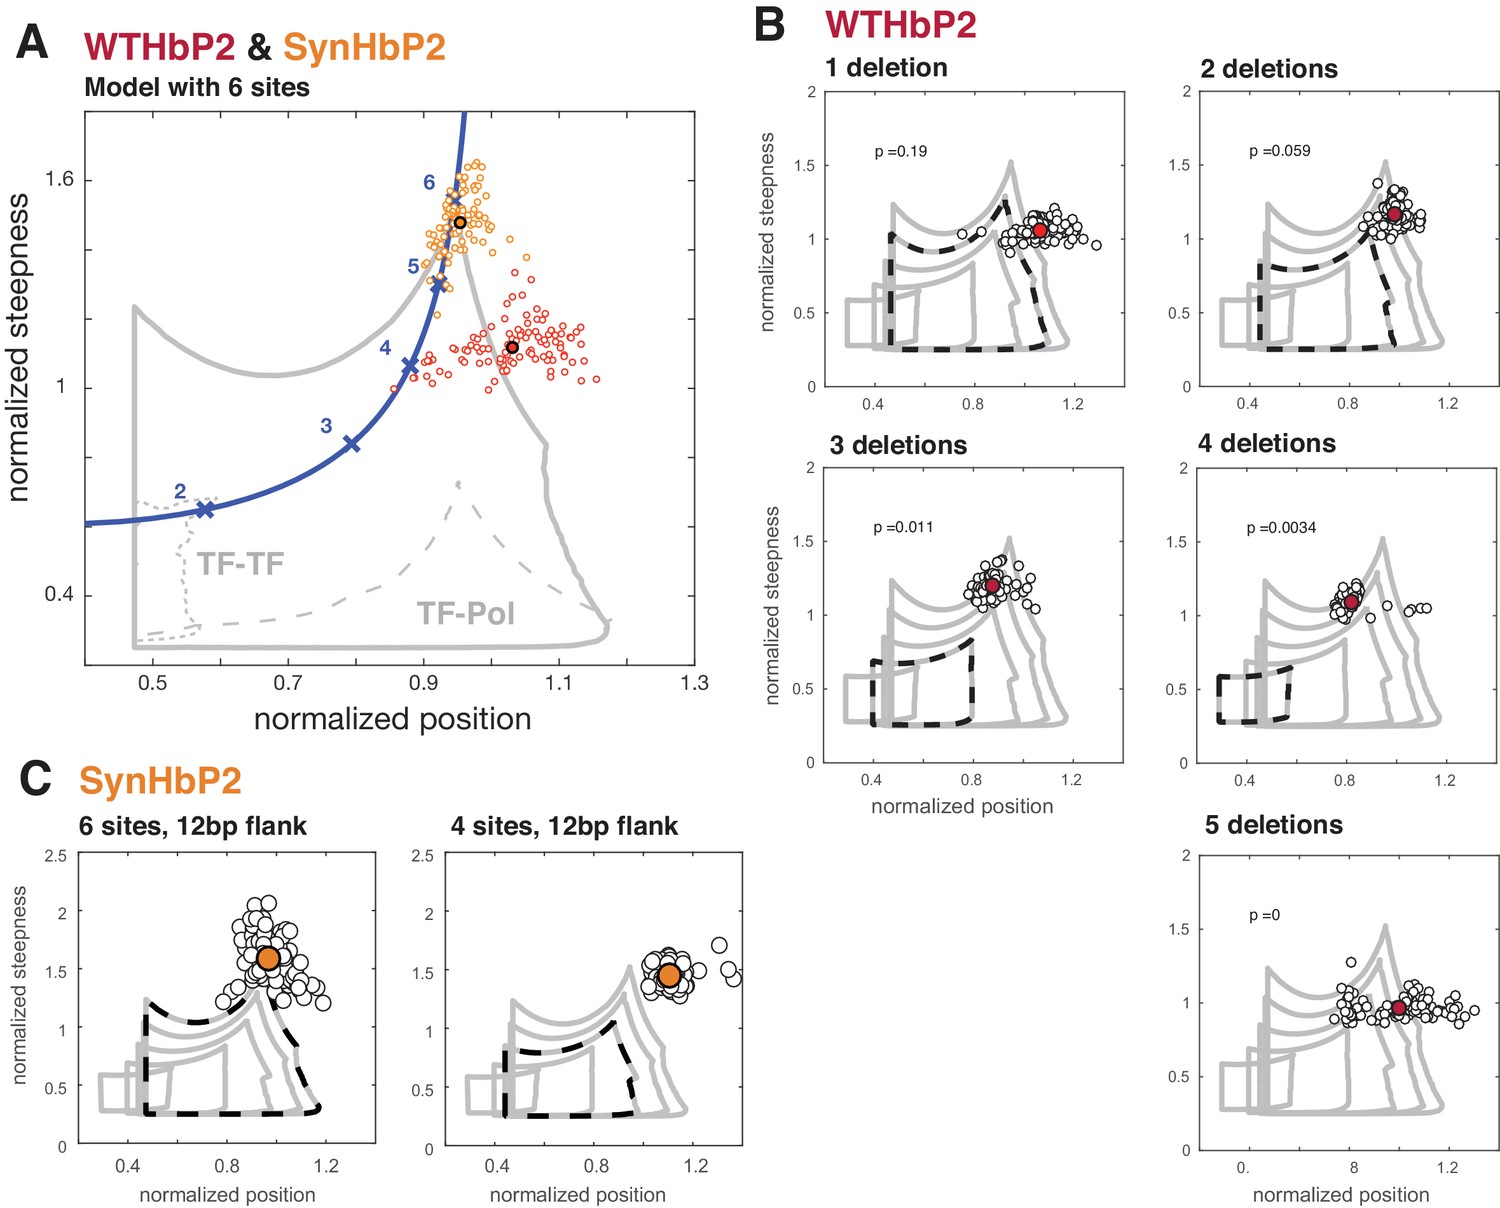
Deleting binding sites from WTHbP2 and SynHbP2 reveals discrepancies between experimentally measured GRFs and a model at thermodynamic equilibrium.
(A) Using an updated version of the mathematical model in Estrada et al., we calculated the boundaries of the steepness and position for GRFs that can be generated by six transcription factor binding sites, either including higher-order cooperativities (solid grey line), pairwise TF-TF cooperativities (dashed grey line, lower left) or pairwise TF-Pol cooperativities (dashed grey line, lower right). For comparison, the Hill line, consisting of the position and steepness points for varying values of the Hill coefficient, nH, is plotted in magenta with the points corresponding to integer values of nH marked by crosses. Experimental data from WTHbP2 (individual embryos are shown as small red circles; the average is shown as a largered disc with a black surround) and SynHbP2 (individual embryos are shown as small orange circles; the average is shown as a large orange disc with a black surround). (B) We plotted the data from WTHbP2 variants where Bcd sites have been removed, described in Figure 2, in terms of steepness and position and compared it to the model with corresponding numbers of TF binding sites. The boundaries of the model for 2, 3, 4, 5 and 6 sites are shown in nested solid grey lines. The model corresponding to the number of remaining Bcd binding sites is shown in dashed black. Individual embryos are shown as small black circles; the average is shown as a red disc. P-values correspond to the probability of finding the GRFs inside the thermodynamic equilibrium region (see Materials and methods). (C) Data from two variants of SynHbP2 are plotted as in B, except the average is shown as an orange disc. In these constructs, the Bcd binding sites are flanked by 12 bp of endogenous sequence rather than 7 bp, as is shown in panel A. See supplementary data for the construct schematics and sequence details.
Figure 6—figure supplement 1
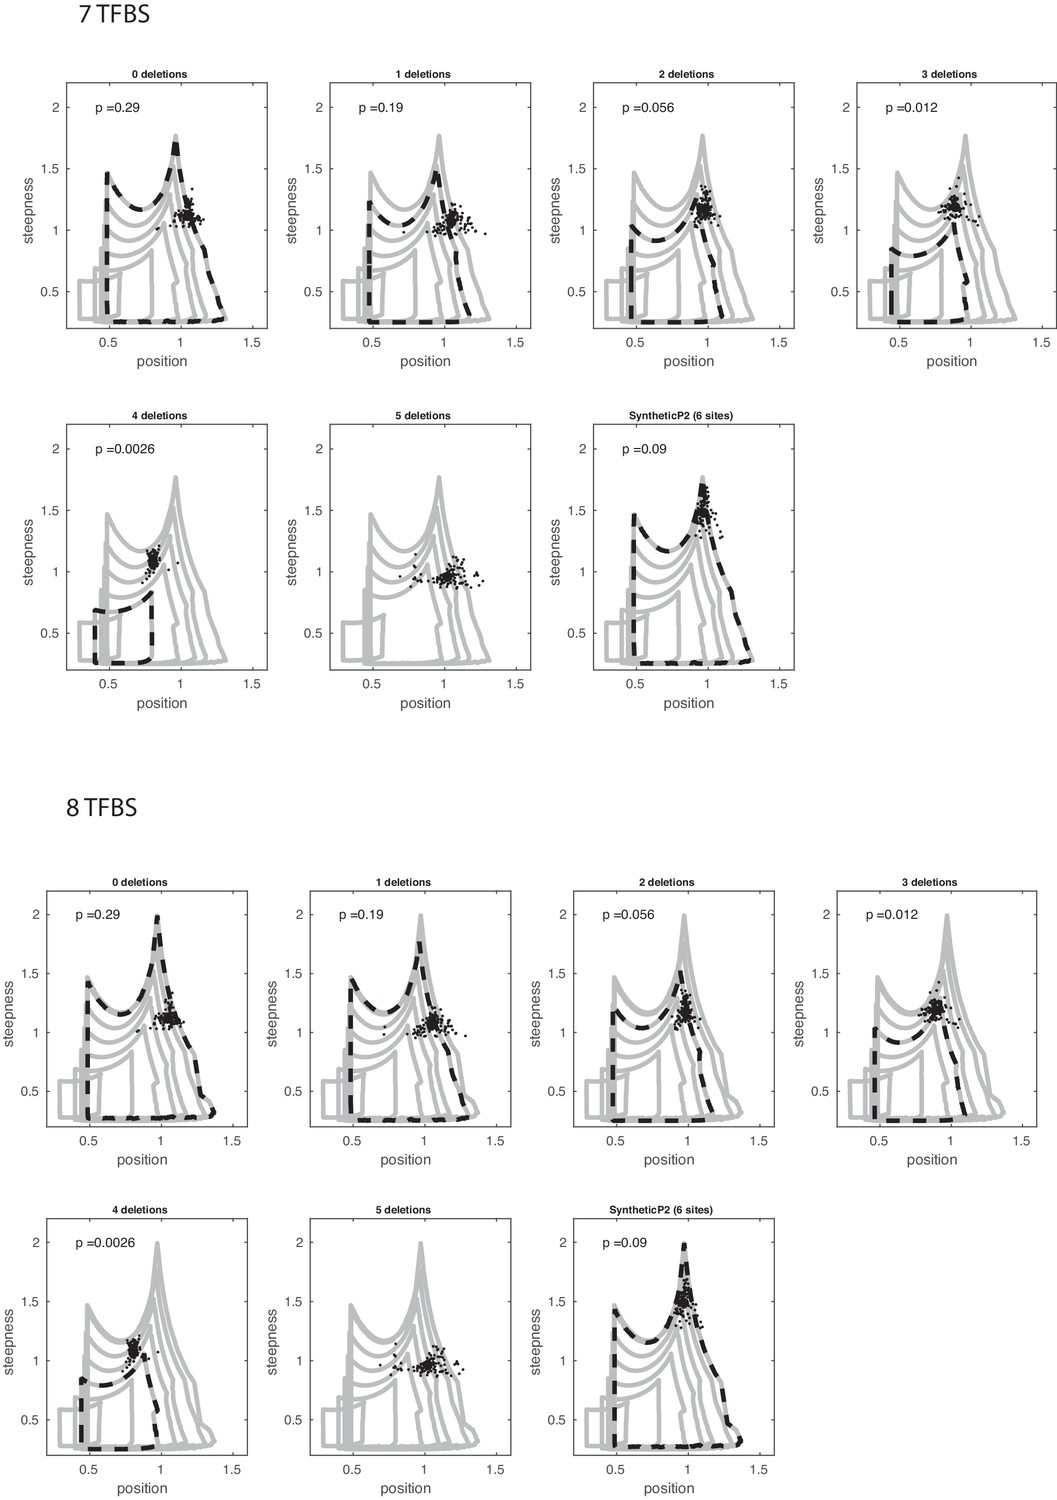
Deleting binding sites and comparing against model with extra sites.
(Top) Estimated position and steepness for wild-type and synthetic Hb enhancer with subsequent TF binding site deletions (indicated in the title of each panel), plotted against the boundaries of the mathematical model of N = 7 binding sites and the same number of deletions. (Bottom) Similar to the top plot, but mathematical model starting at N = 8 binding sites.
Figure 6—figure supplement 2
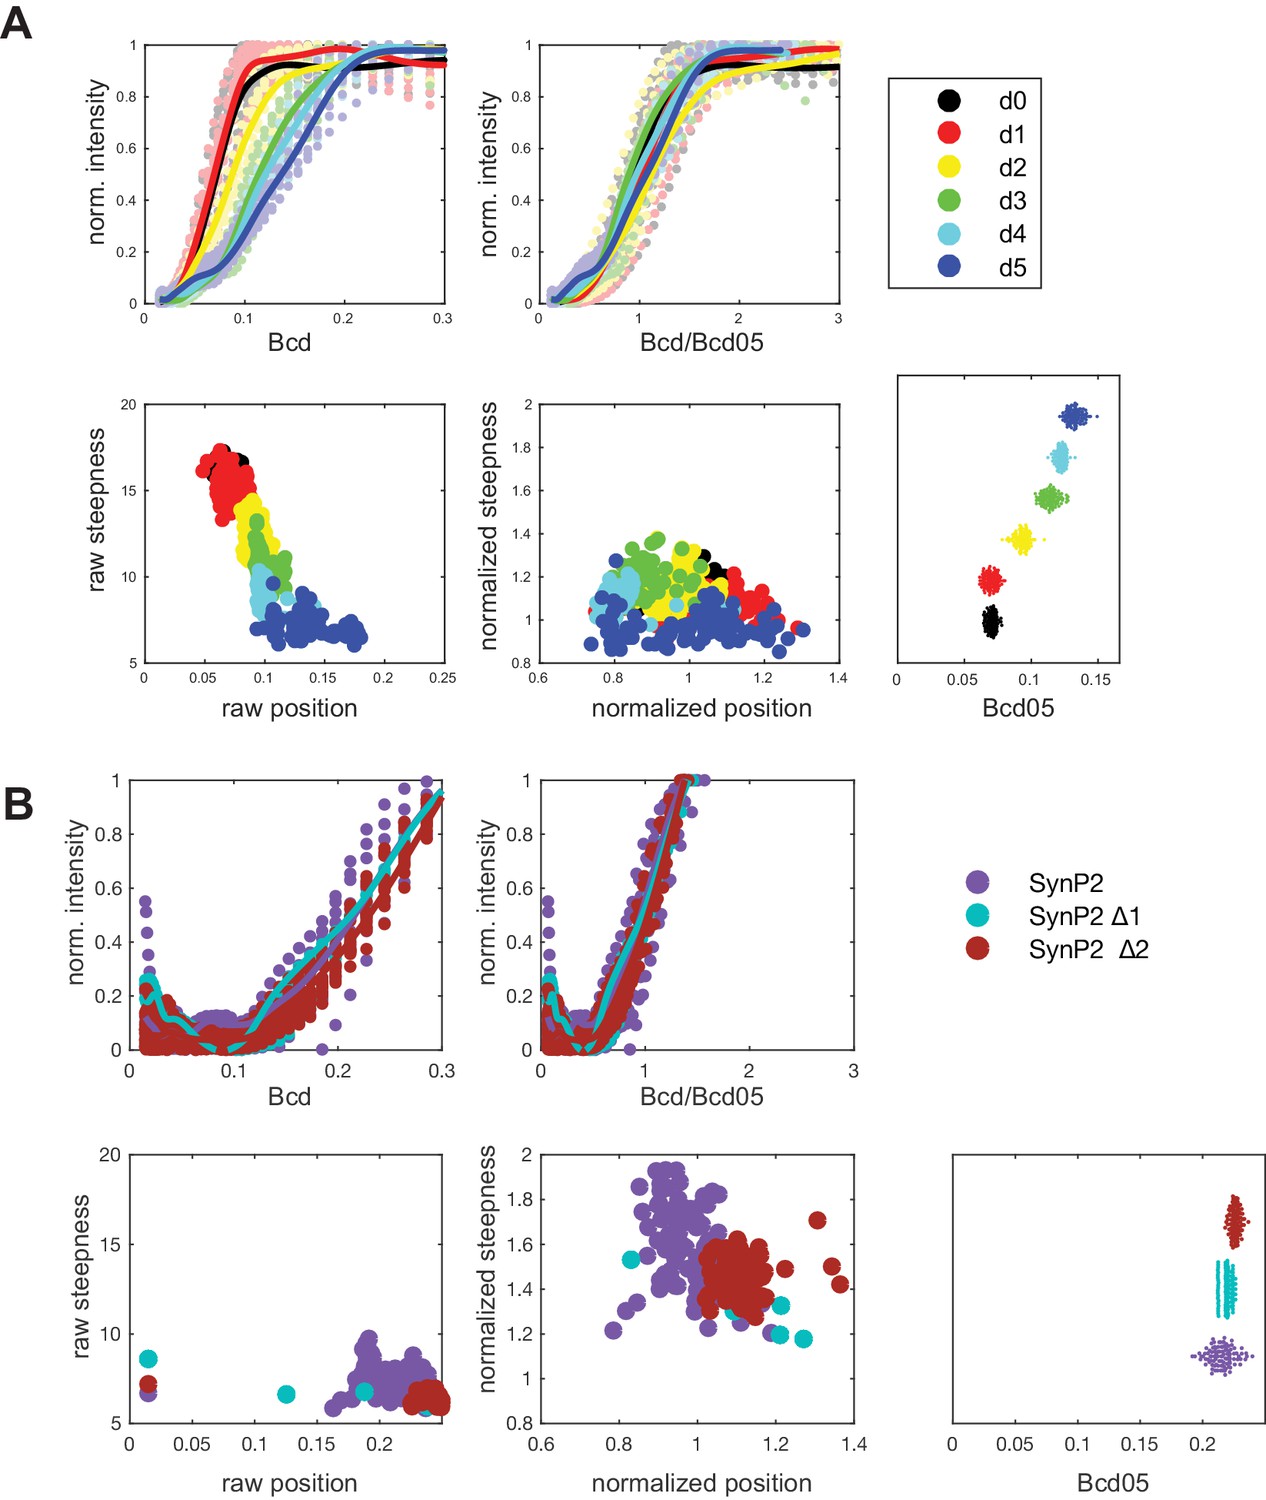
Procedure for obtaining normalized position (P) and normalized steepness (S) to compare the experimental data to the boundaries of mathematical GRFs calculated using equilibrium modeling.
(A) (top left) Estimated non-normalized GRFs for WTHbP2 deletion series as shown in Figure 2. Average expression profile from each deletion construct. (bottom left) Non-normalized ‘raw’ position and steepness for each deletion construct. (top right) Estimated GRFs for WTHbP2 deletion series, normalizing Bcd concentration by Bcd05. (bottom center) Position vs steepness for each deletion constructs after normalization using Bcd05. (bottom right) Estimated Bcd05 for each construct. (B) Analysis equivalent to panel A for SynHbP2 deletion series, as shown in Figure 3—figure supplement 1.
Figure 6—figure supplement 3
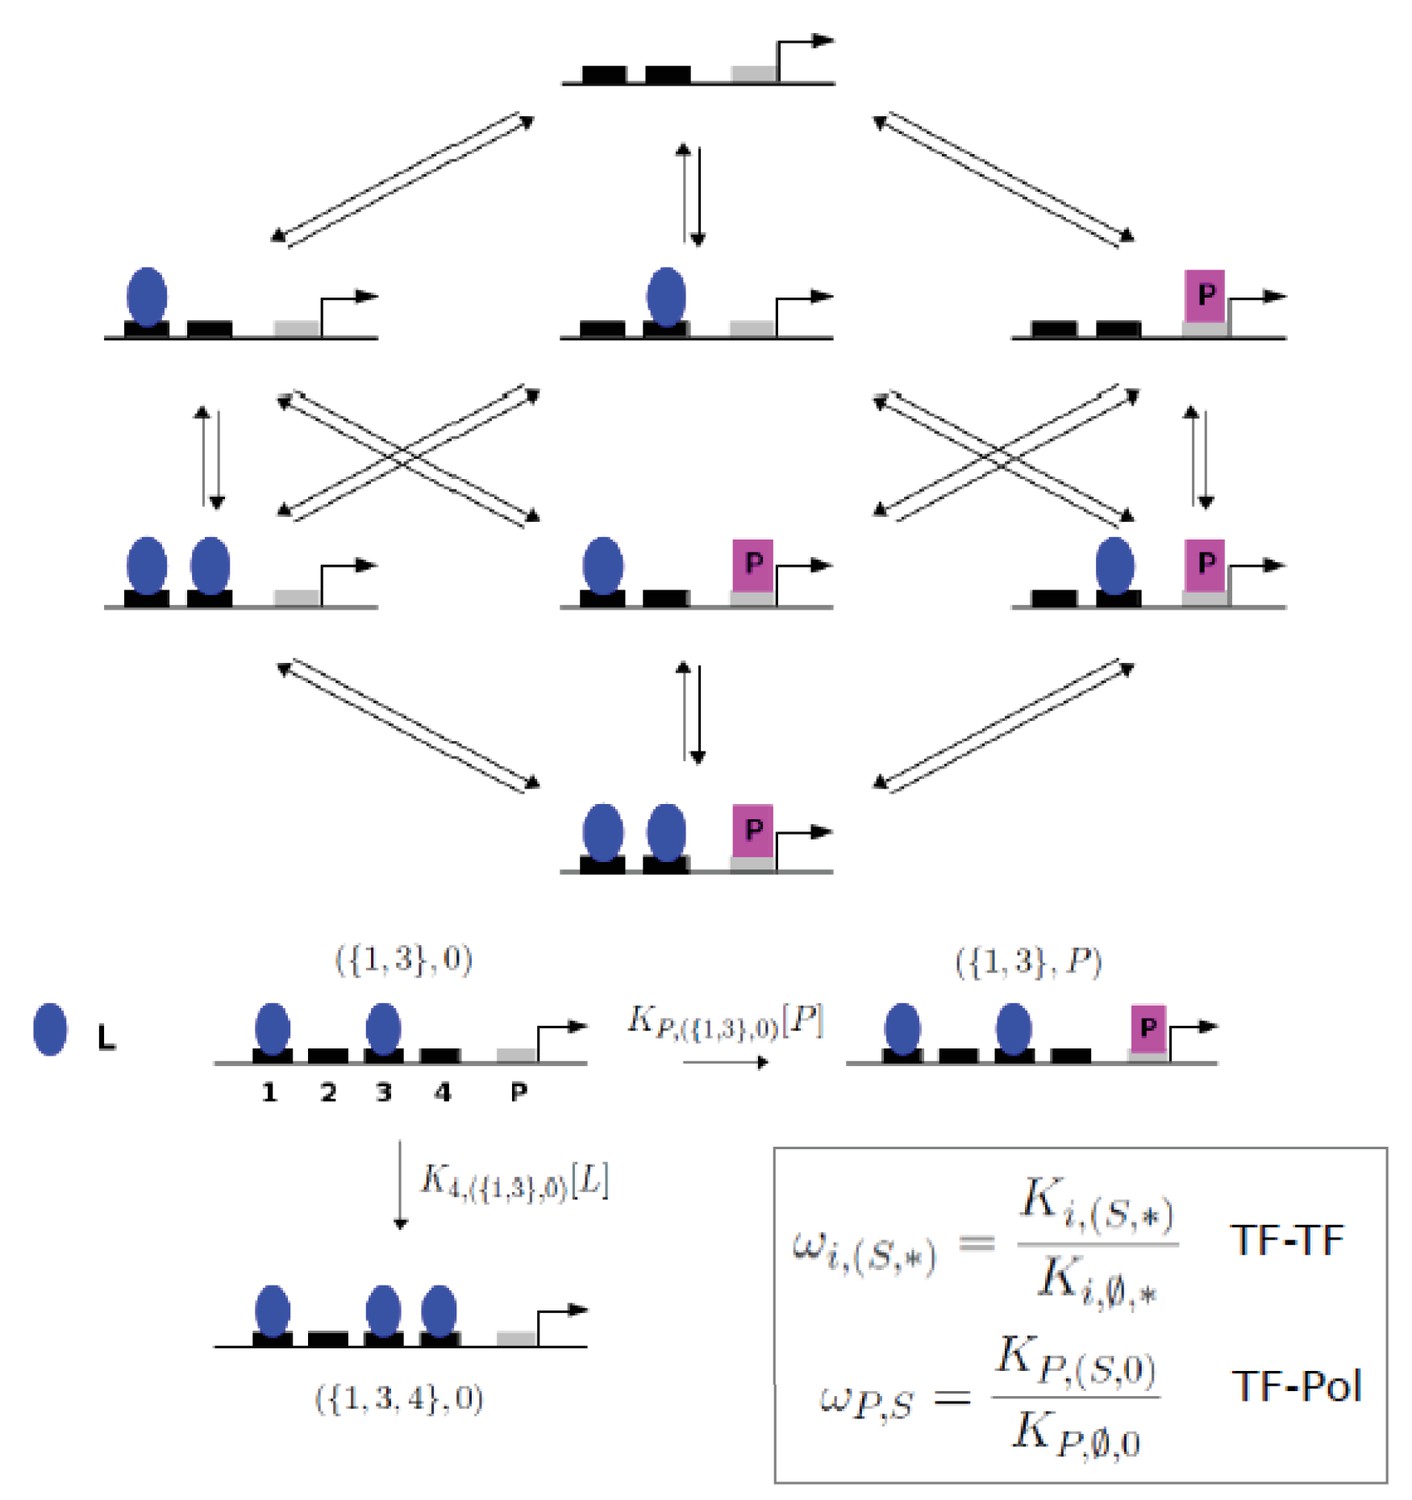
Graph for gene regulation model.
(Top) Graph for the gene regulation model with two sites for a transcription factor, L, and a single site for RNA polymerase, P, giving a 2 + 1 model. (Bottom) The set-theoretic notation used for microstates and transition rates at thermodynamic equilibrium is illustrated for 4 + 1 sites, with K denoting association constants and [-] denoting concentration. To fix the level of RNA polymerase, it is assumed that K P,(Ø, 0) [P]=1. (Bottom, inset) Non-dimensional higher-order cooperativities are defined as ratios of association constants.
Figure 6—figure supplement 4
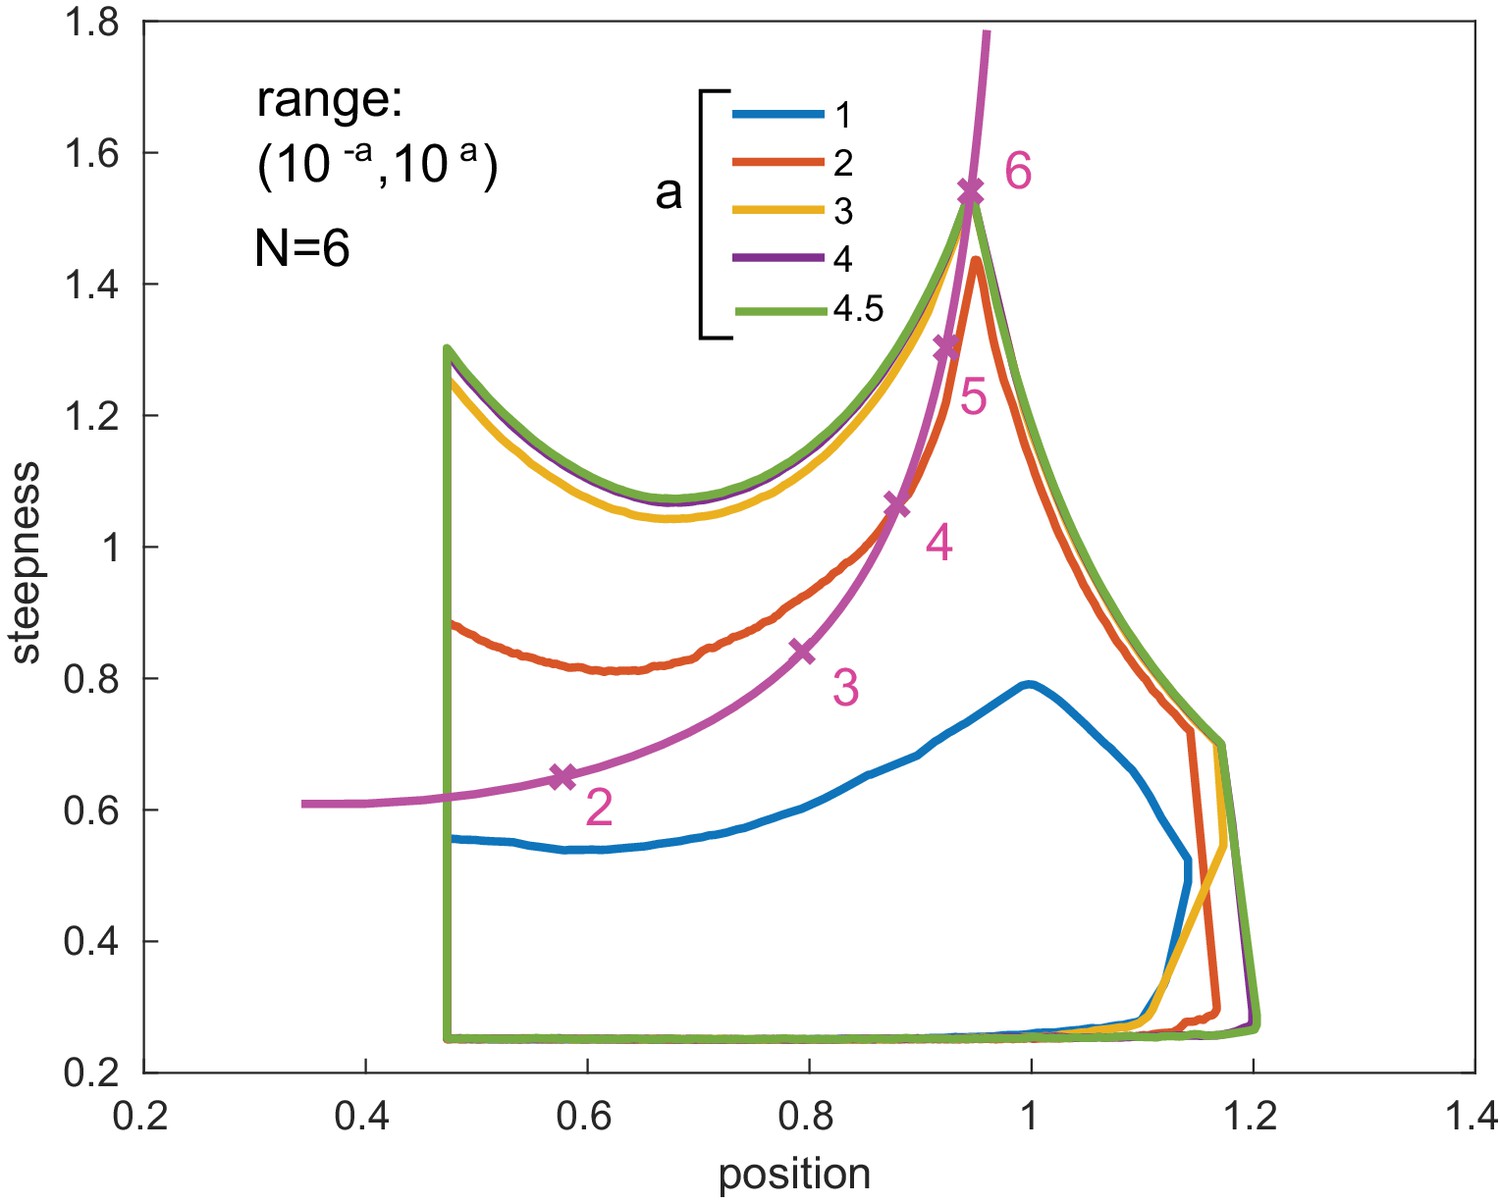
Boundary stabilization.
Position-steepness boundaries are shown for GRFs generated by six transcription factor binding sites, as in Figure 6, for varying parametric ranges. The boundaries stabilise rapidly as the parametric range is increased from a = 3, which is the value used in Figure 6, to a = 4 and a = 4.5. The purple boundary for a = 4 is obscured by the green boundary for a = 4.5. The magenta curve marks the Hill line, as in Figure 6.
Tables
Table 1
List of shRNA lines
https://doi.org/10.7554/eLife.41266.008| Target gene name | TRiP ID | # of embryos |
|---|---|---|
| Nejire (CBP) | HMS01570 | 8 |
| Bin1/SAP18 | GL00127 | 8 |
| Sin3A | HMS00359 | 13 |
| HDAC6 | HMS00077 | 2 |
| Mediator complex subunit 1 | HMS01139 | 9 |
| Mediator complex subunit 11 | HMS01094 | 7 |
| Mediator complex subunit 14 | HMS01049 | 5 |
| Mediator complex subunit 20 | HMS01051 | 12 |
| Mediator complex subunit 22 | HMS01047 | 8 |
| Mediator complex subunit 27 | HMS01050 | 4 |
| Mediator complex subunit 28 | HMS00458 | 5 |
| Mediator complex subunit 7 | HMS01140 | 5 |
| Vielfaltig (Zld) | HMS02441 | 7 |
| hunchback | GL01321 | 11 |
Table 2
Number of Embryos Imaged
https://doi.org/10.7554/eLife.41266.016| Reporter contructs | # of embryos |
|---|---|
| Endogeous hb | 6 |
| WThbP2 | 6 |
| WThbP2 (5TFBS) | 10 |
| WThbP2 (4TFBS) | 10 |
| WThbP2 (3TFBS) | 7 |
| WThbP2 (2TFBS) | 12 |
| WThbP2 (1TFBS) | 10 |
| WThbP2 (Δ1b) | 11 |
| WThbP2 (Δ2b) | 13 |
| WThbP2 (Δ3b) | 13 |
| SynHbP2 (2 bp) | 4 |
| SynHbP2 (7 bp) | 15 |
| SynHbP2 (12 bp) | 10 |
| SynHbP2 (12 bp, 4TFBS) | 15 |
Key resources table
| Reagent type (species) or resource | Designation | Source or reference | Identifiers | Additional information |
|---|---|---|---|---|
| Strain, strain background (Drosophila melanogaster) | Nejire (CBP) RNAi | Bloomington Drosophila Stock Center | BDSC Cat# 36682, RRID:BDSC_36682 | |
| Strain, strain background (D. melanogaster) | Bin1/SAP18 RNAi | Bloomington Drosophila Stock Center | BDSC Cat# 36781, RRID:BDSC_36781 | |
| Strain, strain background (D. melanogaster) | Sin3A RNAi | Bloomington Drosophila Stock Center | BDSC Cat# 32368, RRID:BDSC_32368 | |
| Strain, strain background (D. melanogaster) | HDAC6 RNAi | Bloomington Drosophila Stock Center | BDSC Cat# 34072, RRID:BDSC_34072 | |
| Strain, strain background (D. melanogaster) | MED1 RNAi | Bloomington Drosophila Stock Center | BDSC Cat# 34662, RRID:BDSC_34662 | |
| Strain, strain background (D. melanogaster) | MED11 RNAi | Bloomington Drosophila Stock Center | BDSC Cat# 34083, RRID:BDSC_34083 | |
| Strain, strain background (D. melanogaster) | MED14 RNAi | Bloomington Drosophila Stock Center | BDSC Cat# 34575, RRID:BDSC_34575 | |
| Strain, strain background (D. melanogaster) | MED20 RNAi | Bloomington Drosophila Stock Center | BDSC Cat# 34577, RRID:BDSC_34577 | |
| Strain, strain background (D. melanogaster) | MED22 RNAi | Bloomington Drosophila Stock Center | BDSC Cat# 34573, RRID:BDSC_34573 | |
| Strain, strain background (D. melanogaster) | MED27 RNAi | Bloomington Drosophila Stock Center | BDSC Cat# 34576, RRID:BDSC_34576 | |
| Strain, strain background (D. melanogaster) | MED28 RNAi | Bloomington Drosophila Stock Center | BDSC Cat# 32459, RRID:BDSC_32459 | |
| Strain, strain background (D. melanogaster) | MED7 RNAi | Bloomington Drosophila Stock Center | BDSC Cat# 34663, RRID:BDSC_34663 | |
| Strain, strain background (D. melanogaster) | Vielfaltig (Zld) RNAi | Bloomington Drosophila Stock Center | BDSC Cat# 42016, RRID:BDSC_42016 | |
| Strain, strain background (D. melanogaster) | hunchback (hb) RNAi | Bloomington Drosophila Stock Center | BDSC Cat# 54478, RRID:BDSC_54478 |
Additional files
-
Transparent reporting form
- https://doi.org/10.7554/eLife.41266.017
Download links
A two-part list of links to download the article, or parts of the article, in various formats.
Downloads (link to download the article as PDF)
Open citations (links to open the citations from this article in various online reference manager services)
Cite this article (links to download the citations from this article in formats compatible with various reference manager tools)
Dissecting the sharp response of a canonical developmental enhancer reveals multiple sources of cooperativity
eLife 8:e41266.
https://doi.org/10.7554/eLife.41266


