A novel mode of capping protein-regulation by twinfilin
- Brandeis University, United States
- Washington University, United states
- Washington University, United States
Figures
Figure 1 with 1 supplement
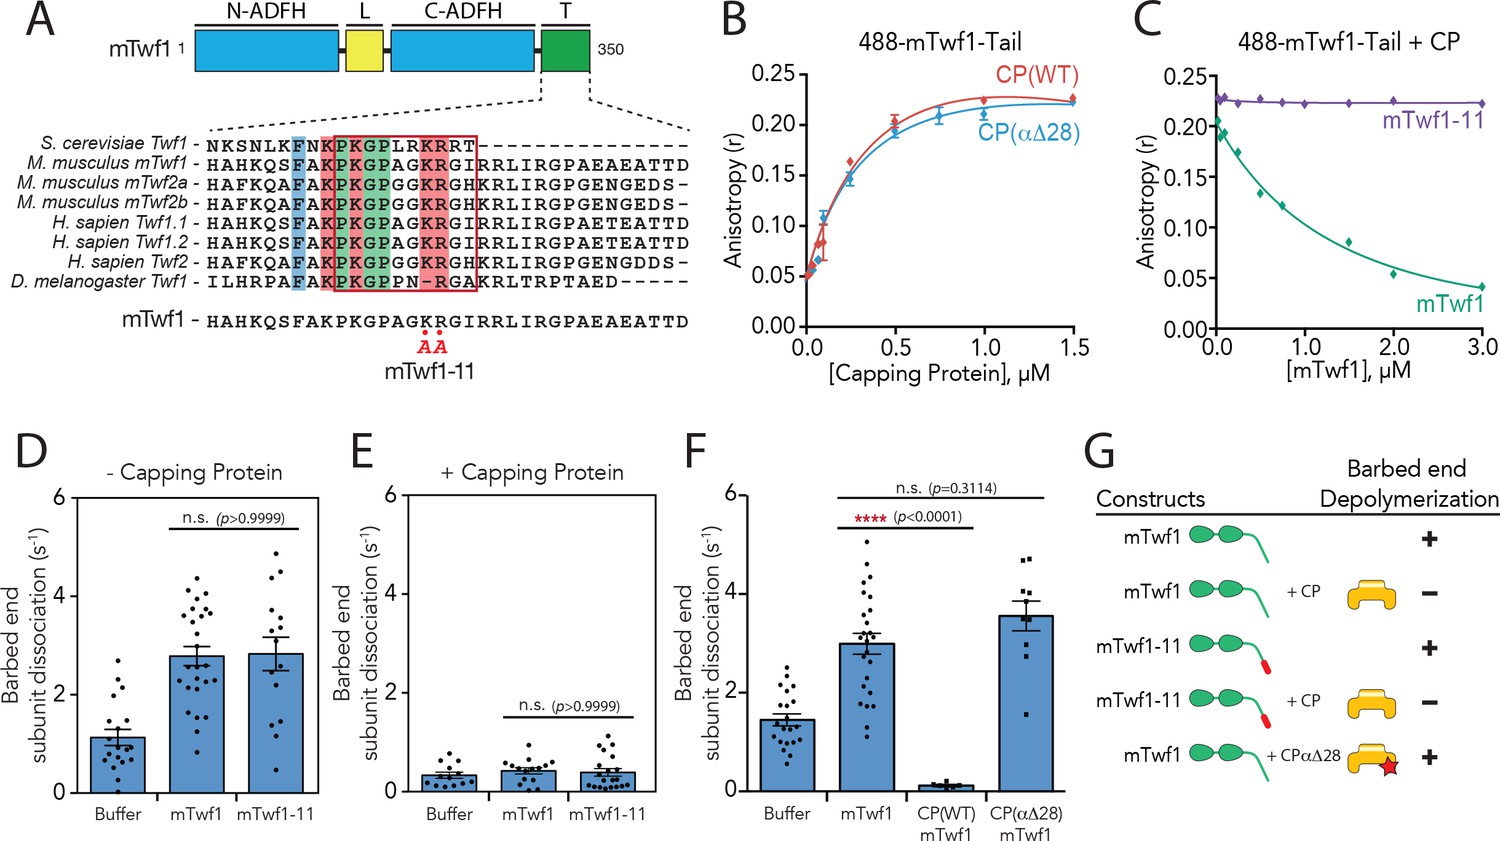
Barbed end capping by Capping Protein inhibits Twinfilin1-mediated depolymerization.
(A) Mouse Twinfilin-1 (mTwf1) domain organization: ADF-H, actin depolymerization factor homology domain; L, linker; T, tail. Sequence alignment of tail regions of Twinfilin isoforms from different species with boxed region highlighting conservation of residues critical for binding to Capping Protein (CP). mTwf1-11 carries a mutation in the tail region (KR332,333AA) that disrupts binding to CP. (B) Fluorescence anisotropy measurement of 100 nM HiLyte488-labeled mTwf1 tail peptide mixed with increasing concentrations of the indicated CP construct. (C) Fluorescence anisotropy measurement of 100 nM HiLyte488-labeled mTwf1 tail peptide incubated in the presence 1 μM CP and increasing concentrations of either mTwf1 or mTwf1-11. Anisotropy values for each condition averaged from three independent experiments. (D,E) Rates of barbed end depolymerization (subunits s−1) induced by 1 μM of the indicated mouse Twinfilin, in the (D) absence or (E) presence of 10 nM CP, determined from TIRF assays. Rates for each condition averaged from at least five filaments in each of two independent experiments. From left to right: (D) n = 19, 26, and 15 and mean depolymerization rates 1.13, 2.784 and 2.81 subunits s−1; (E) n = 13, 15, and 20 and mean depolymerization rates 1.13, 2.784 and 2.81 subunits s−1. (F) Rates of barbed end depolymerization (subunits s−1) induced by 1 μM mTwf1, in the absence or presence of 1 μM of the indicated CP construct, determined from TIRF assays. Rates for each condition averaged from at least five filaments from at least one experiment. From left to right n = 21, 25, 6, and 10; mean depolymerization rates 1.45, 2.991, 0.11, and 3.58 subunits s−1. (G) Summary of barbed end depolymerization activity of mTwf1 constructs in combination with different CP constructs determined from TIRF assays (as in D,E,F). Error bars, s.e.m. ****p≤0.0001, n.s. p>0.05 by one-way ANOVA with Tukey post hoc test.
Figure 1—video 1
Supporting data for Figure 1F.
Examples from TIRF microscopy experiments showing actin filament barbed ends depolymerizing in the presence of control buffer, 1 µM mTwf1, 1 µM mTwf1 +1 µM CP, and 1 µM mTwf1 +1 µM CPα∆28.
Figure 2
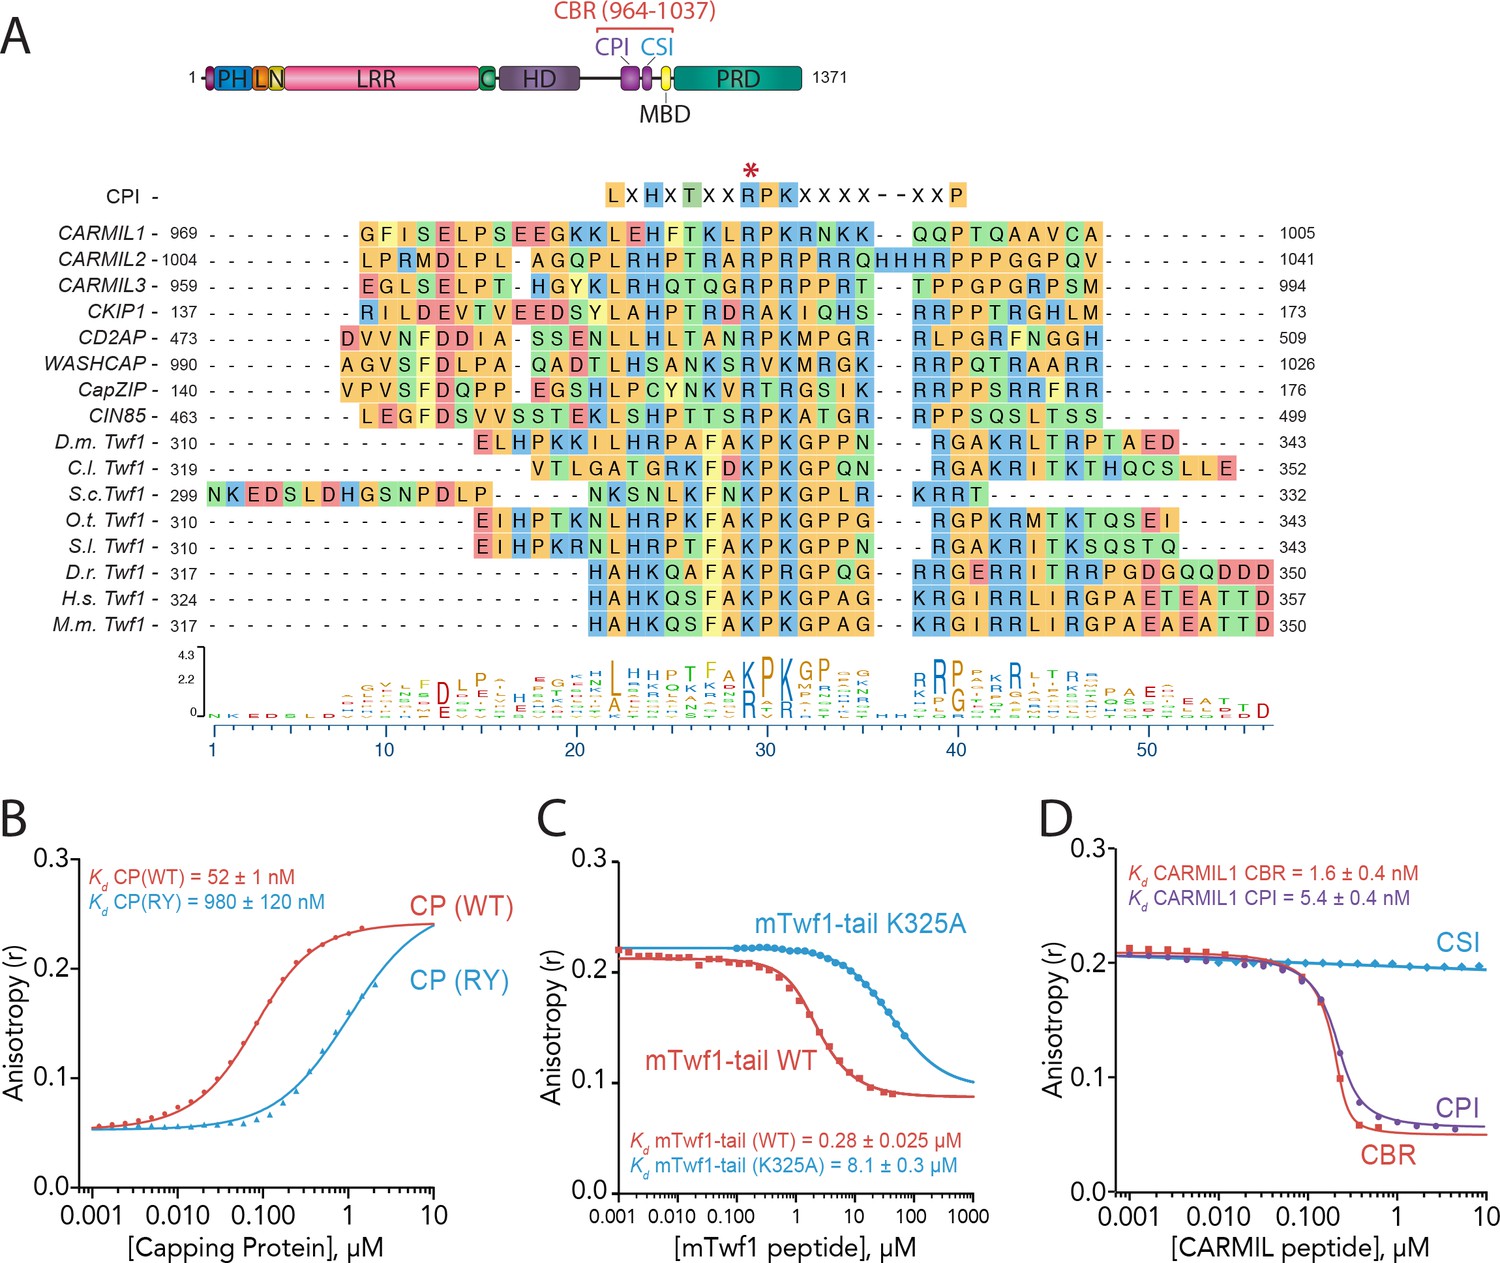
Twinfilin is a Capping Protein Interaction (CPI)-motif protein that competes with CARMIL for binding Capping Protein.
(A) CARMIL domain organization: PH, pleckstrin-homology domain; L, linker; N-cap (N), LRR, leucine-rich repeat domain; C, C-cap; HD, helical dimerization domain; CBR, Capping Protein binding domain, consisting of CPI, Capping Protein interaction domain, and CSI, CARMIL-specific interaction sequence; MBD, membrane binding domain; PRD, proline-rich domain. Alignment between the Capping Protein Interaction (CPI) motif consensus sequence, and the CPI regions of H. sapiens (H.s.) CARMIL1 (UniProtKB Q5VZK9.1), CARMIL2 (UniProtKB Q6F5E8.2), CARMIL3 (UniProtKB Q8ND23.2), CKIP1 UniProtKB Q53GL0.2), CD2AP (CBI NP_036252.1), WASHCAP (Fam21) (UniProtKB Q9Y4E1.3), CapZIP (CBI NP_443094.3), CIN85 (UniProtKB Q96B97.2), and the tail sequences of Twinfilin homologs from D. melanogaster (D.m), C. lectularius (C.l.), S. cerevisiae (S.c.), O. Taurus (O.t.), S. litura (S.l.), D. rerio (D.r.), H. sapiens (H.s.), and M. musculus (M.m.). Twinfilin isoforms (D.m. Twf1 UniProtKB NP_650338, C.l. Twf1 UniProtKB XP_014258437.1, S.c. Twf1 GenBank GAX68393.1, O.t. Twf1 XP_022917989.1, S.l. Twf1 XP_022816377.1, D.r. Twf1 AAH67638.1, H.s. Twf1 UniProtKB NO_001229326.1, and M.m. Twf1 GenBank AAH15081.1). Amino acid color coding illustrates side chain chemistry similarities. The asterisk marks the residue we mutated in mTwf1 in panel. (C) The alignments were generated using the MAFFT algorithm in the DNASTAR Lasergene Suite/MegAlign Pro application (MegAlign Pro. Version 15.0. DNASTAR. Madison, WI.).(B) Fluorescence anisotropy measurement of 60 nM HiLyte488-labeled mTwf1 tail peptide mixed with increasing concentrations of the indicated CP construct. (C) Fluorescence anisotropy measurement of 40 nM TAMRA-labeled mTwf1 tail peptide incubated with 1 µM CP and different concentrations of wild type and mutant mTwf1 tail peptides. (D) Fluorescence anisotropy measurement of 60 nM HiLyte488-labeled mTwf1 tail peptide incubated in the presence of 240 nM CP and increasing concentrations of the indicated CARMIL fragment (CBR, CSI, or CPI). CSI failed to compete with HiLyte 488-mTwf1 tail peptide at the concentrations tested. Anisotropy values for each condition were averaged from three independent experiments.
Figure 3 with 1 supplement

Direct interactions of Twinfilin with Capping Protein attenuate CARMIL-mediated uncapping.
(A) Bulk fluorescence assays comparing the rates of actin assembly in the presence of 25 nM muscle Capping Protein (CPα1β1) and increasing concentrations of mTwf1. To initiate uncapping, 250 nM CBR fragment of CARMIL (see schematic, Figure 2A) was spiked into the reaction at 400 s. Data shown are representative curves from experiments repeated three independent times. (B) Representative time-lapse images from TIRF microscopy assays monitoring the displacement of labeled CP from barbed ends. Filaments were first polymerized and tethered using 1 µM actin (10% OG-labeled, 0.5% biotin–actin), then capped at their barbed ends by flowing in SNAP-649-CP (100% labeled). Next, 50 nM CBR fragment of CARMIL and different concentrations of mTwf1 were flowed in, and CP dissociation was monitored over time. Scale bar, 5 μm. (C) Quantification of the percentage of filaments retaining CP at the barbed ends in the presence of 50 nM CBR fragment of CARMIL and variable concentrations of mTwf1, determined from TIRF reactions as in (B). Control curve, buffer alone (no CBR or mTwf1). n > 45 events measured from at least two independent experiments. (D) Representative time-lapse images from TIRF microscopy assays monitoring CP displacement from barbed ends, analyzed as in (B), except using 1 μM mTwf1-11 instead of mTwf1. n > 45 events measured from at least two independent experiments. (E) Quantification of the percentage of filaments retaining CP at the barbed end in the presence of 50 nM CBR fragment of CARMIL and different concentrations of mTwf1-11, determined from TIRF assays as in (D). n > 45 events measured from at least two independent experiments.
Figure 3—figure supplement 1
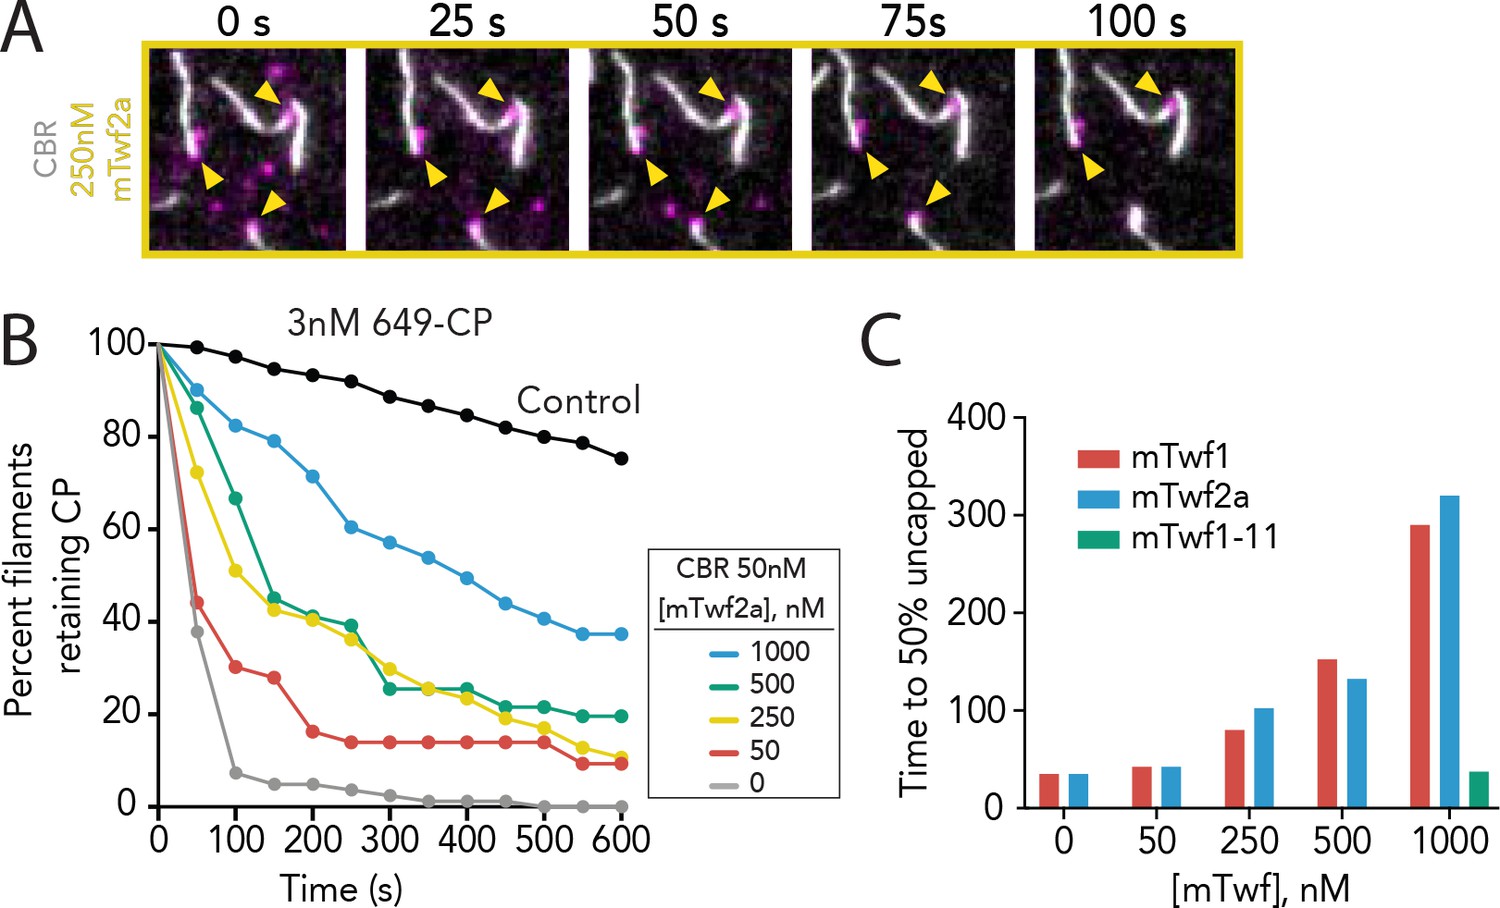
Supporting data for Figure 3 showing that multiple Twinfilin isoforms antagonize CARMIL uncapping of barbed ends.
(A) Representative time-lapse images from TIRF microscopy assays showing that mTwf2a protects Capping Protein (CP) from CARMIL-mediated displacement from barbed ends. Filaments were first polymerized and tethered using 1 µM actin (10% OG-labeled, 0.5% biotin–labeled), then SNAP-649-CP was flowed in to cap barbed ends. Subsequently, 50 nM CBR fragment of CARMIL and 250 nM mTwf2a was flowed in, and uncapping was monitored over time. (B) Quantification of the percentage of filaments retaining SNAP-649-CP at their barbed ends after flow in of 50 nM CBR fragment of CARMIL and variable concentrations of mTwf2a, measured from TIRF reactions as in (A). Control curve, buffer alone (no CBR or mTwf2a). n > 45 events measured from one experiment. (C) Concentration-dependent effects of Twinfilin isoforms (and mutant mTwf1-11) on time to 50% disappearance of CP from barbed ends, measured from data shown in Figure 3C (mTwf1), Figure 3E (mTwf1-11), and Supplemental Figure 3—figure supplement 1 (mTwf2a).
Figure 4
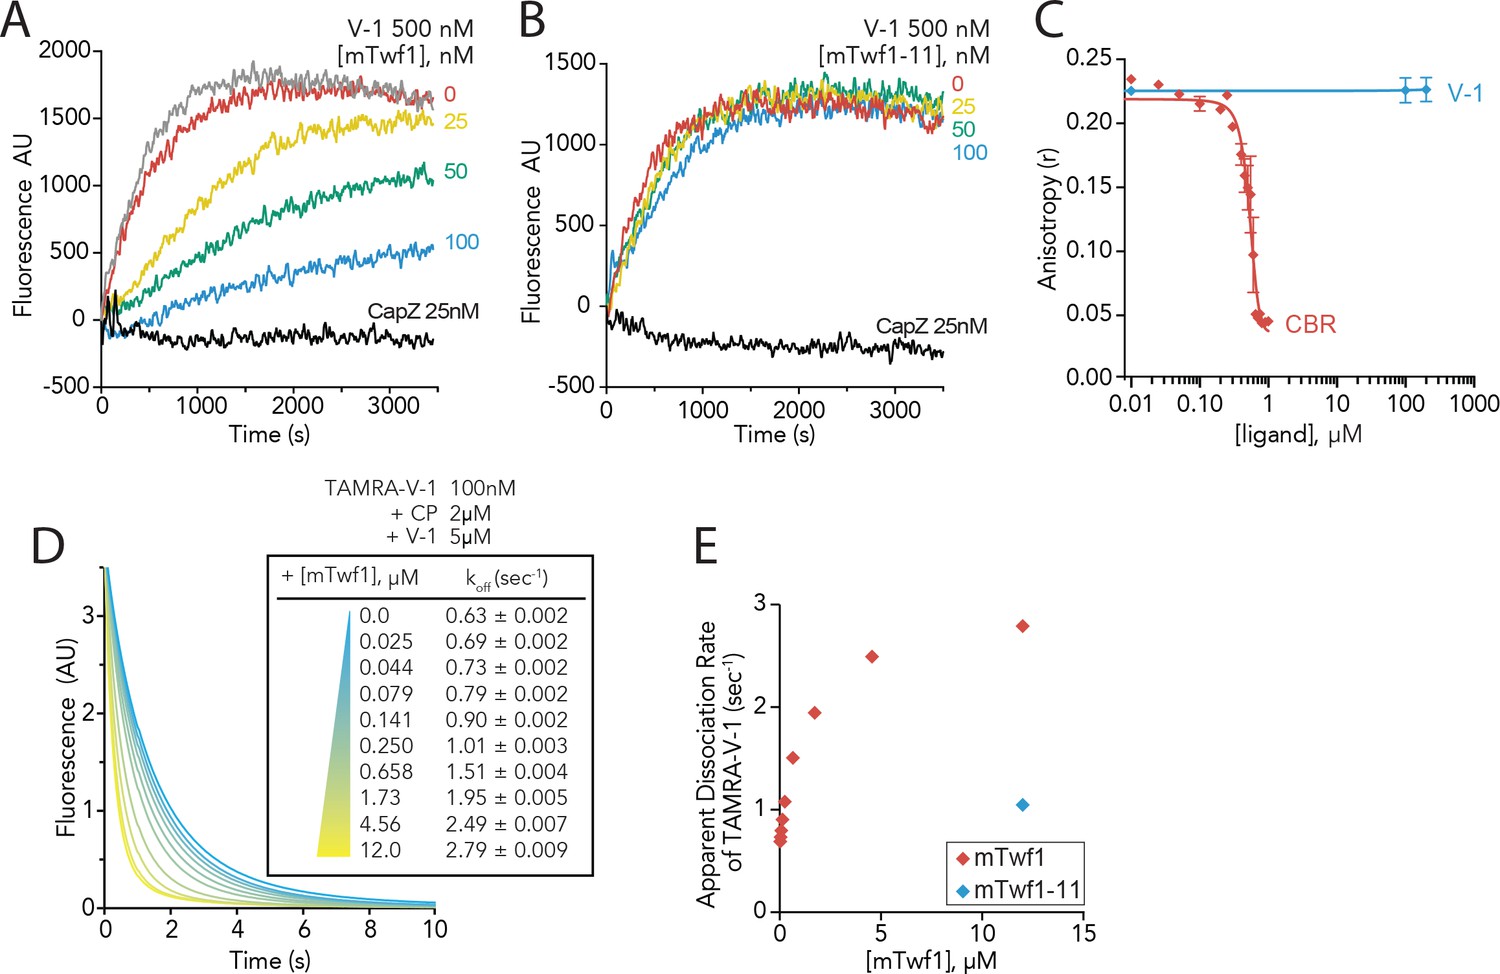
Twinfilin’s direct binding to Capping Protein accelerates the disassociation of V-1 to promote capping of filaments.
(A, B) Seeded elongation assays comparing the rates of actin assembly from spectrin-F-actin seeds (grey) in the presence of 0.5 µM actin (10% pyrene-labeled), 25 nM muscle Capping Protein (CapZ), 500 nM V-1, and variable concentrations of mTwf1 (A) or mTwf1-11 (B) as indicated. Data shown are representative curves from experiments performed three independent times. (C) Fluorescence anisotropy measurement of 100 nM HiLyte488-labeled mTwf1 tail peptide mixed with 1 μM mouse Capping Protein (CP) and variable concentrations of CBR fragment of CARMIL or V-1. Rates for each condition averaged from three independent experiments. (D) Stopped-flow fluorescence assays measuring the kinetics of dissociation of 50 nM TAMRA-V-1 from 1 μM CP upon addition at time zero of 2.5 μM unlabeled V-1 and variable concentrations of mTwf1 as indicated. Apparent dissociation rates are listed for each condition. (E) Apparent dissociation rates of TAMRA-V-1 for different concentrations of mTwf1 are from (D); and for 12 µM mTwf1−11 = 1.0 ± 0.003 s−1. Anisotropy values for each condition were averaged from five independent experiments.
Figure 5 with 2 supplements
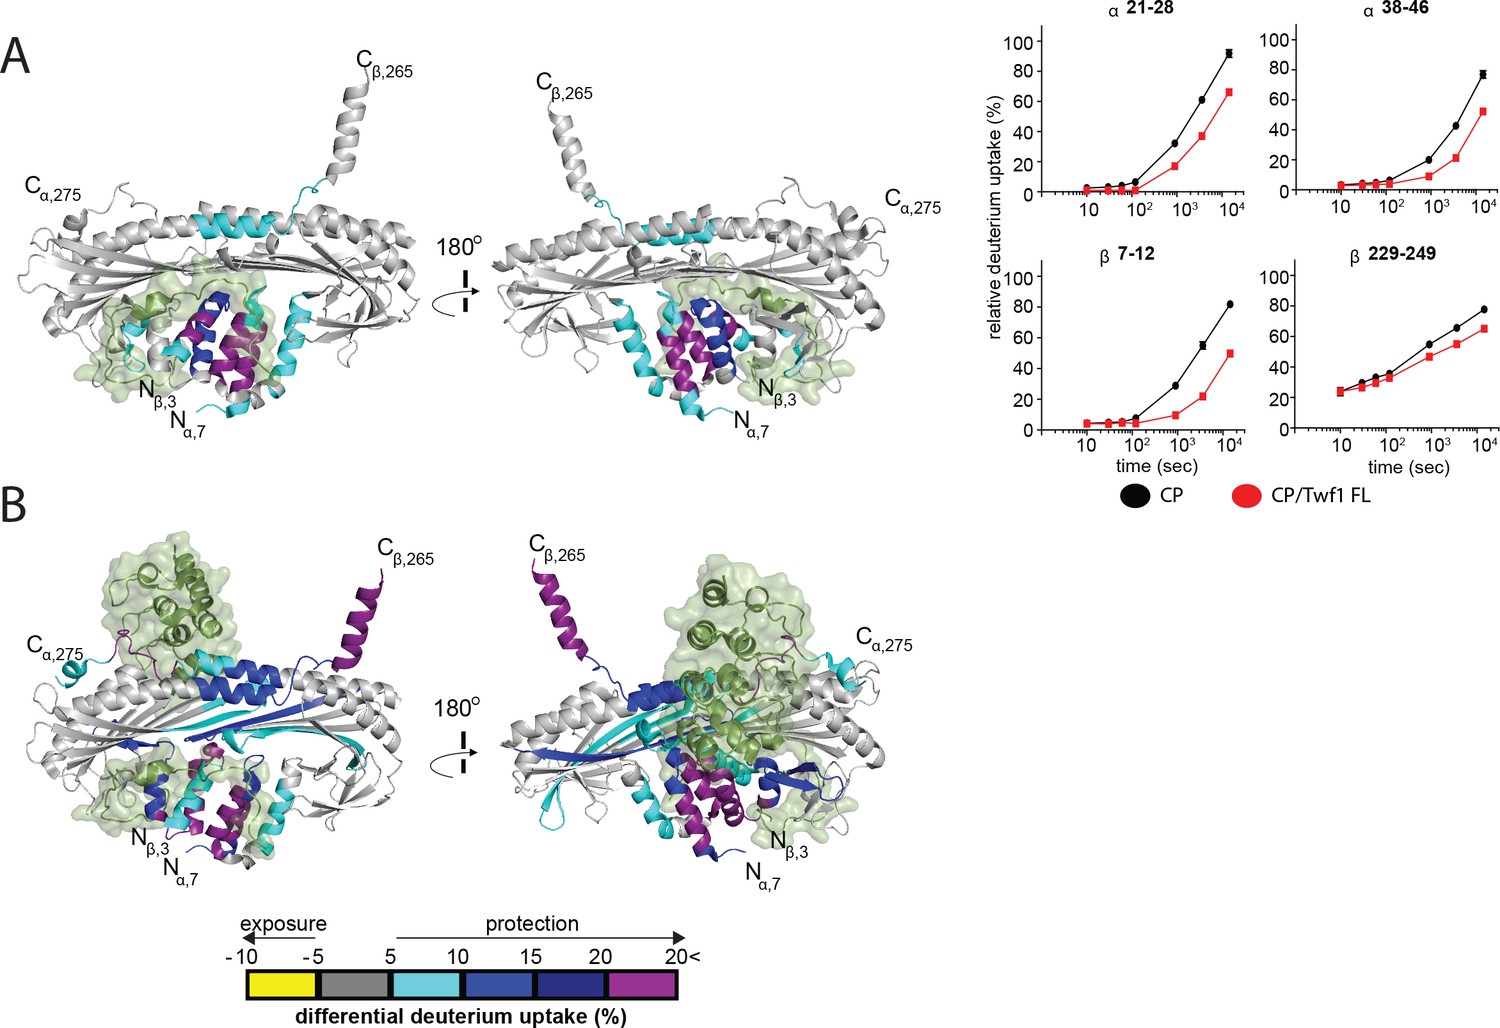
HDX-MS analysis of Twinfilin reveals effects on Capping Protein structure near the CPI motif-binding site.
(A) A cartoon representation of a crystal structure of CP, based on PDB 3AAA (Takeda et al., 2010). Differences in deuterium uptake induced by mTwf1 binding to CP are displayed as a color gradient (see scale at bottom of panel (B) CPI domain of CARMIL overlaid on to its binding site on CP (around the stalk). Representative comparisons of deuterium uptake curves for free CP (black) with mTwf1 bound CP (red) for CP alpha subunit (upper panels) and CP beta subunit (lower panels). Error bars representing the results of t-tests between samples are shown above each time point to illustrate statistical significance. When error bars are not shown explicitly, the error is within the radius of the symbol. Data shown are representative curves from experiments repeated two independent times. (B) A cartoon representation of a crystal structure of CP, showing the differences in deuterium uptake induced by CBR domain of CARMIL binding to CP are displayed as a color gradient (see scale at the bottom). CPI domain of CARMIL overlaid on to its binding site on CP (around the stalk), V-1 is overlaid on its binding site on CP (barbed end binding surface) for comparison.
Figure 5—figure supplement 1
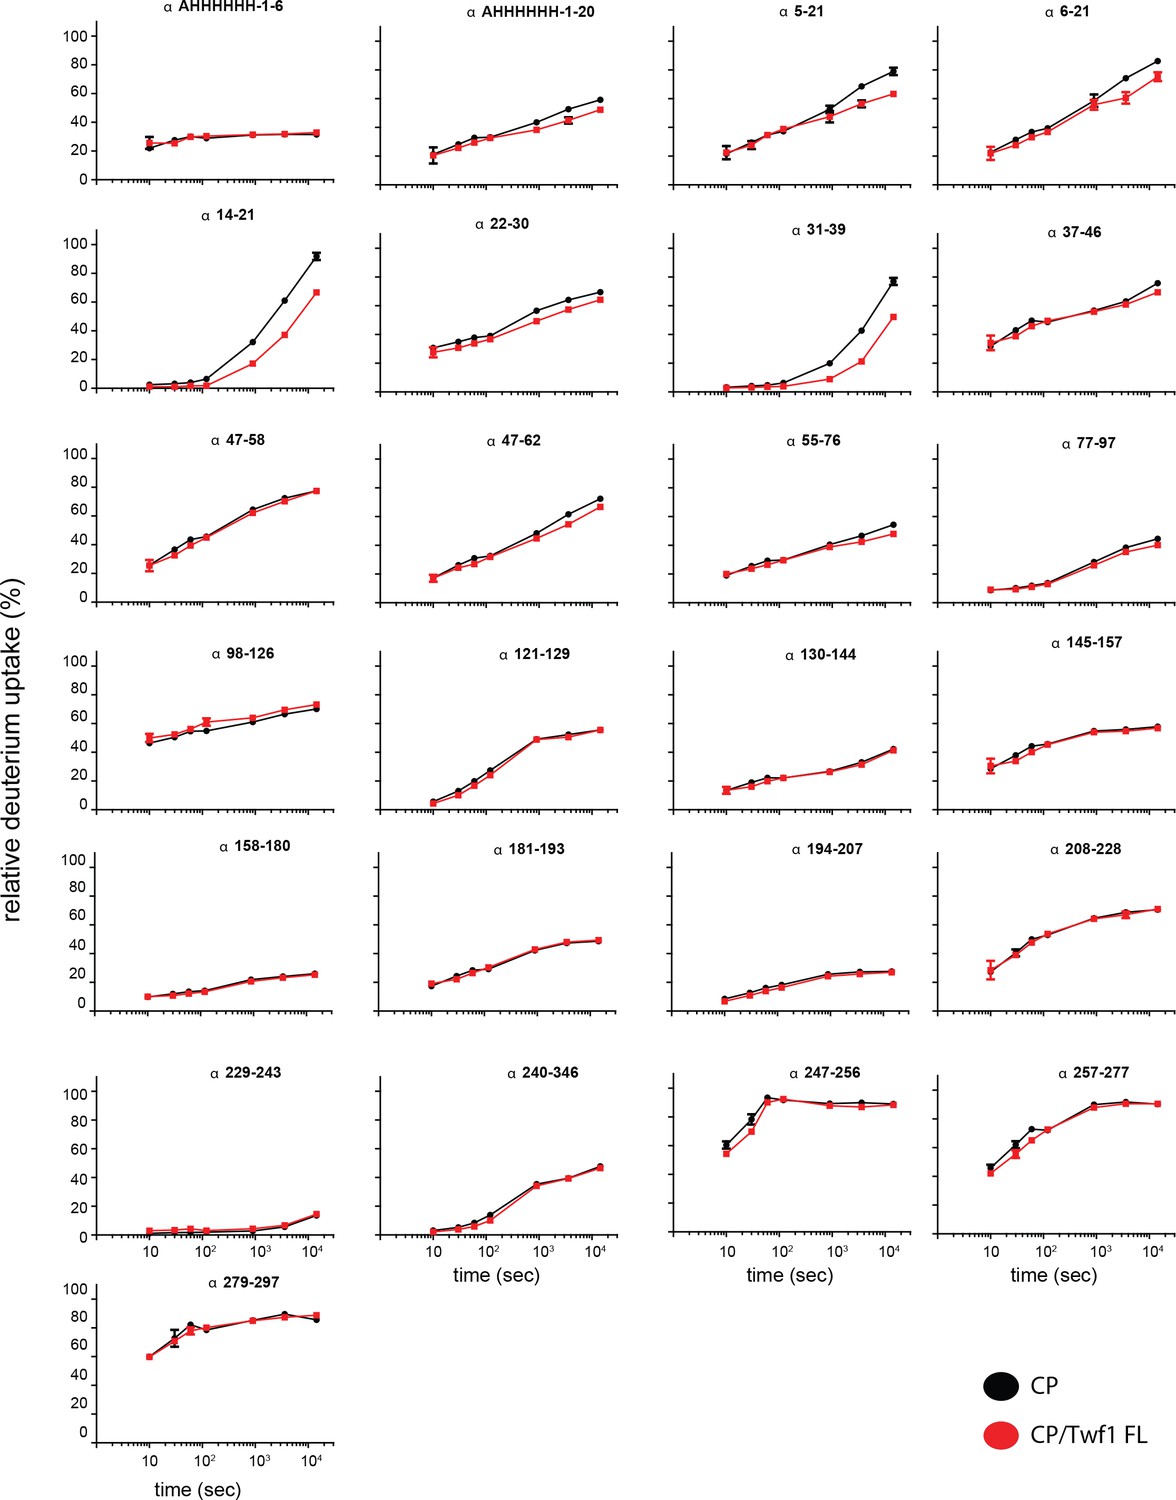
Supporting data for Figure 5 showing differential HDX results.
Deuterium uptake curves for all CP alpha-subunit peptides are shown for free CP (black) and mTwf1 bound CP (red). Data shown are representative of two independent experiments. Error bars representing the results of t-tests between samples are shown above each time point to illustrate statistical significance. When error bars are not shown explicitly, the error is within the radius of the symbol.
Figure 5—figure supplement 2
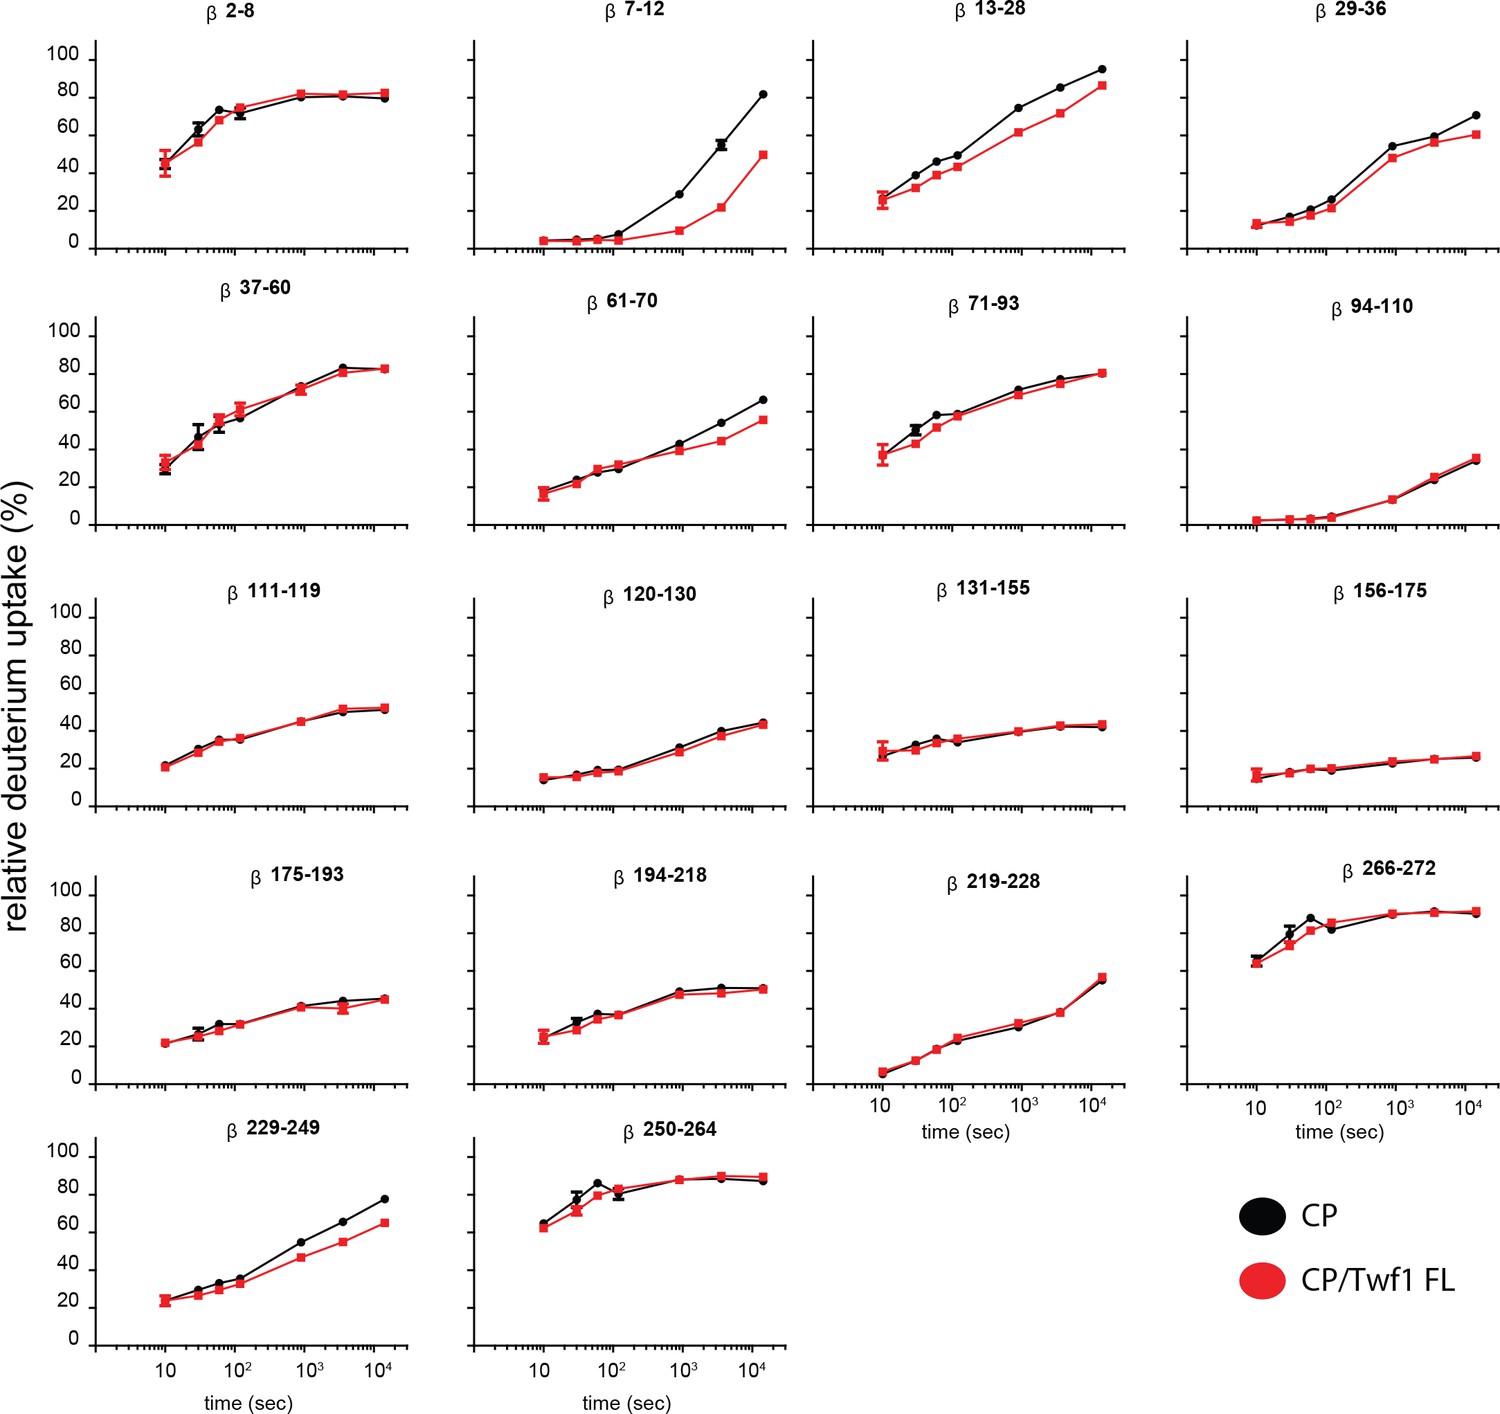
Supporting data for Figure 5 showing differential HDX results.
Deuterium uptake curves for all CP beta-subunit peptides are shown for free CP (black) and mTwf1 bound CP (red). Data shown are representative of two independent experiments. Error bars representing the results of t-tests between samples are shown above each time point to illustrate statistical significance. When error bars are not shown explicitly, the error is within the radius of the symbol.
Figure 6 with 1 supplement

mTwf1 and Capping Protein colocalize and have similar phenotypes in B16F10 melanoma cells.
(A) Representative images from immunofluorescence staining showing colocalization of endogenous mTwf1 (yellow) and Capping Protein (magenta). Scale bar, 20 μm. Close ups of boxed regions shown in Zooms; scale bar, 4 μm. (B) Mander’s correlation coefficient (M1 and M2) values of overlap between mTwf1 and Capping Protein (CP) measured from cells (n = 67 cells) as in (A). Error bars, s.e.m. (C) Comparison of the relative abundance of mTwf1 and Capping Protein (CP) in B16F10 cells measured from western blot analysis. Data averaged from four separate experiments. Error bars, s.d. n.s. p>0.05 by t-test. (D,E) Representative western blots and quantification of cellular levels of mTwf1 (D) and CP (E) in B16F10 cells treated with siRNA against mTwf1 (si-Twf1) or CP (si-CP) or negative control (Control). Band intensity for control cells was set to 1.0. Data averaged from at least three separate experiments., error bars, s.d. (F) Representative images showing F-actin immunofluorescence in B16F10 cells treated with siRNA against mTwf1 (si-Twf1) or CP (si-CP) or negative control (Control); siRNA treated cells (si-Twf1 or si-CP) were also rescued using plasmids expressing si-resistant FL-myc-mTwf1 (WT or mTwf1-11). Scale bar, 20 μm. Close ups of boxed regions shown in Zooms; scale bar, 4 μm. (G) Microspike density in cells treated as in (D). Box and whisker plots show mean, first and third quartile, and the maximum and minimum values. Data averaged from two experiments. From Left to right: n = 45, 53, 51, 24, 24, and 20 and mean microspike density 0.69, 1.34, 1.77, 0.59, 1.24, and 1.01 filopodia per 10 μm of cell cortex. Error bars, s.e.m. ****p≤0.0001, *p≤0.05, n.s. p>0.05 by one-way ANOVA with Tukey post hoc test.
Figure 6—figure supplement 1
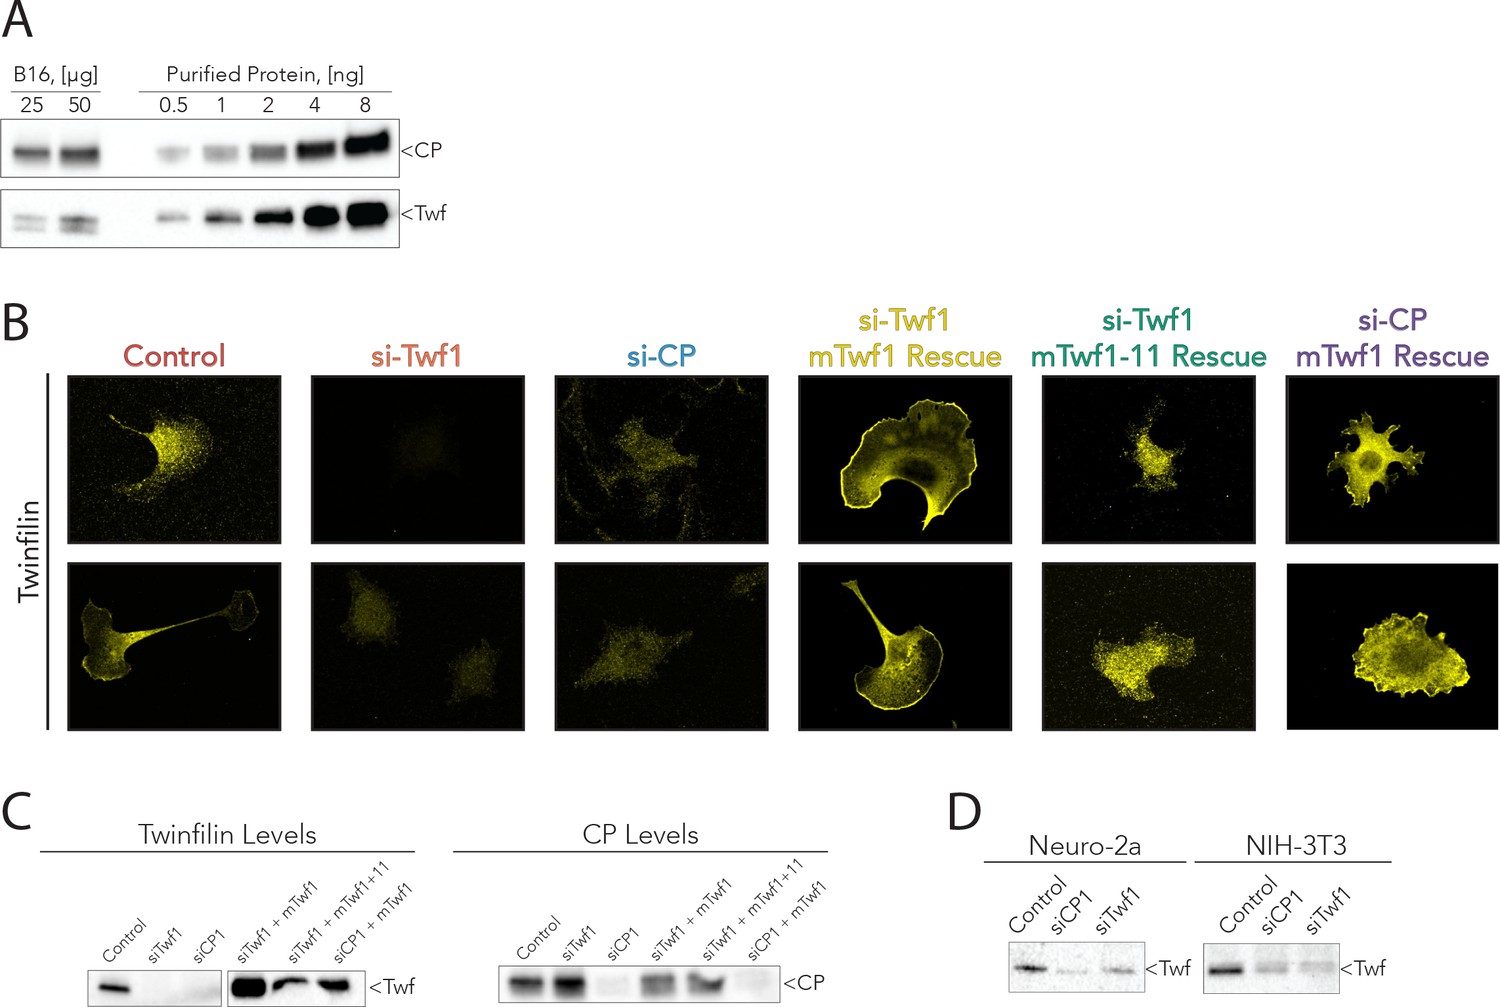
Supporting data for Figure 6.
(A) Representative western blots from the analysis shown in Figure 5C, quantifying mTwf1 and Capping Protein (CP) levels in B16F10 cells. Known quantities of total cell extract (µg) were immunoblotted alongside known quantities of purified protein (ng). (B) Representative images from immunofluorescence of mTwf1 in B16F10 cells after treatment with siRNA against Twinfilin (si-Twf1), or Capping Protein (si-CP), or negative control (Control), and siRNA treated cells (either si-Twf1 or si-CP) rescued by plasmids expressing si-resistant full-length (FL)-myc-mTwf1 (WT or mTwf1-11). Scale bar, 20 µm. (C) Representative western blots showing levels of mTwf1 and Capping in B16F10 cells treated as above in (B). (D) Representative western blots of mTwf1 (D) in NIH-3T3 and Neuro-2A cells treated with siRNA oligonucleotides against CP (si-CP) or mTwf1 (si-Twf1) or negative control (Control).
Figure 7 with 1 supplement
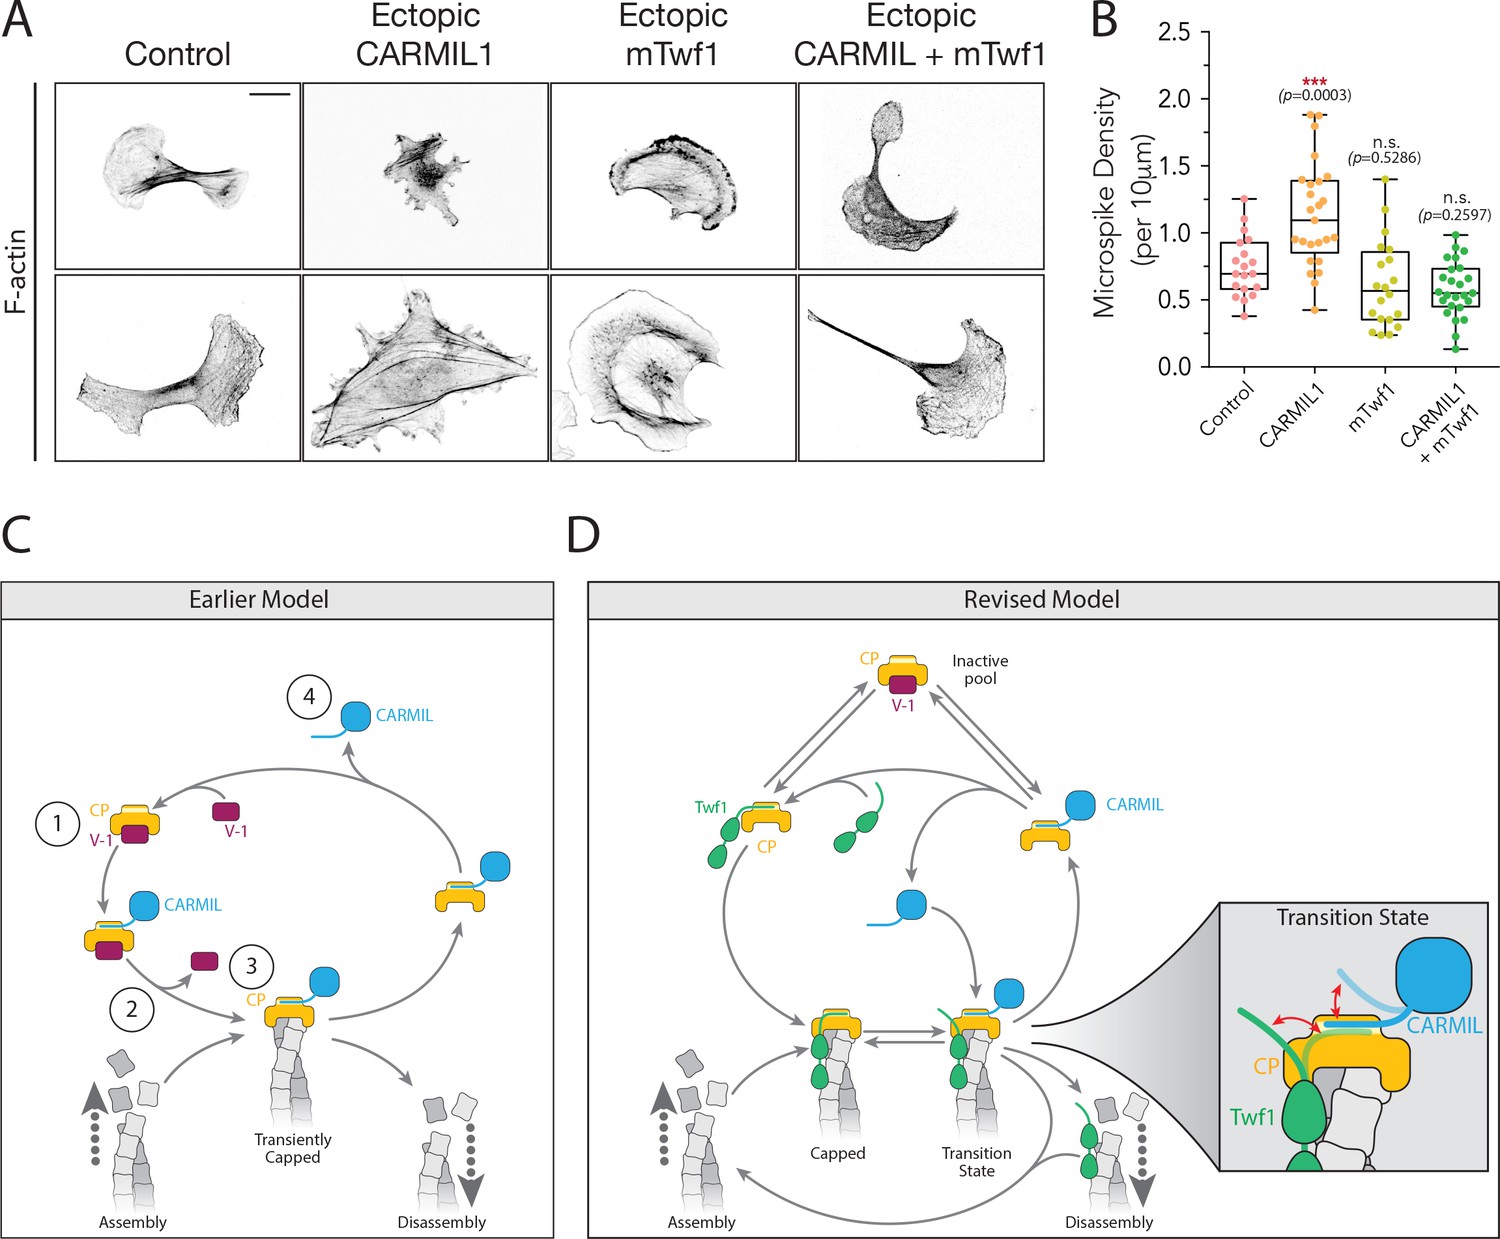
Overexpression of Twinfilin suppresses morphological defects caused by CARMIL hyperactivity.
(A) Representative images of F-actin staining in untreated B16F10 cells (control), and cells transfected with Flag-CARMIL1, full-length (FL)-myc-mTwf1, or both. Scale bar, 20 μm. (B) Average Microspike density in cells treated as in (A). Box and whisker plots show mean, first and third quartile, and the maximum and minimum values. Data averaged from two experiments (n = 19–25 cells per condition). Data averaged from two experiments. From Left to right: n = 19, 25, 20, and 25; mean microspike density 0.75, 1.13, 0.62, 0.58 filopodia per 10 μm of cell cortex. Error bars, s.e.m. ***p≤0.001, n.s. p>0.05 by one-way ANOVA with Tukey post hoc test. (C) ‘Earlier’ model for CP regulatory cycle, adapted from Fujiwara and colleagues (Fujiwara et al., 2014). Proposed steps in model: (1) V-1 globally inhibits Capping Protein (CP) in the cytoplasm, (2) membrane-associated CARMIL (at the protruding cell edge) catalyzes dissociation of V-1 from CP, (3) the resulting CARMIL-CP complex is partially active, binding weakly to free barbed ends to provide capping function, (4) an unknown factor or mechanism promotes dissociation of CARMIL from CP, allowing V-1 to rebind CP and complete the cycle. (D) Our revised working model for the CP regulatory cycle. We propose that V-1 functions to maintain a cytosolic reservoir of inactive CP, from which Twinfilin and CARMIL activate CP, generating two distinct forms of active CP in cells: Twinfilin-CP complexes and CARMIL-CP complexes. Twinfilin-CP complexes are fully active and support stable capping of barbed ends. In contrast, CARMIL-CP complexes have ~100 fold reduced affinity for barbed ends, and may therefore more transiently cap barbed ends, permitting restricted network growth at the cell membrane where CARMIL localizes. CARMIL and Twinfilin directly compete with each other for binding CP (shown in close up of Transition state), which may result in the displacement of CP from Twinfilin. This would leave Twinfilin at the barbed end to catalyze depolymerization, or alternatively return filaments back to the original state of assembly.
Figure 7—figure supplement 1
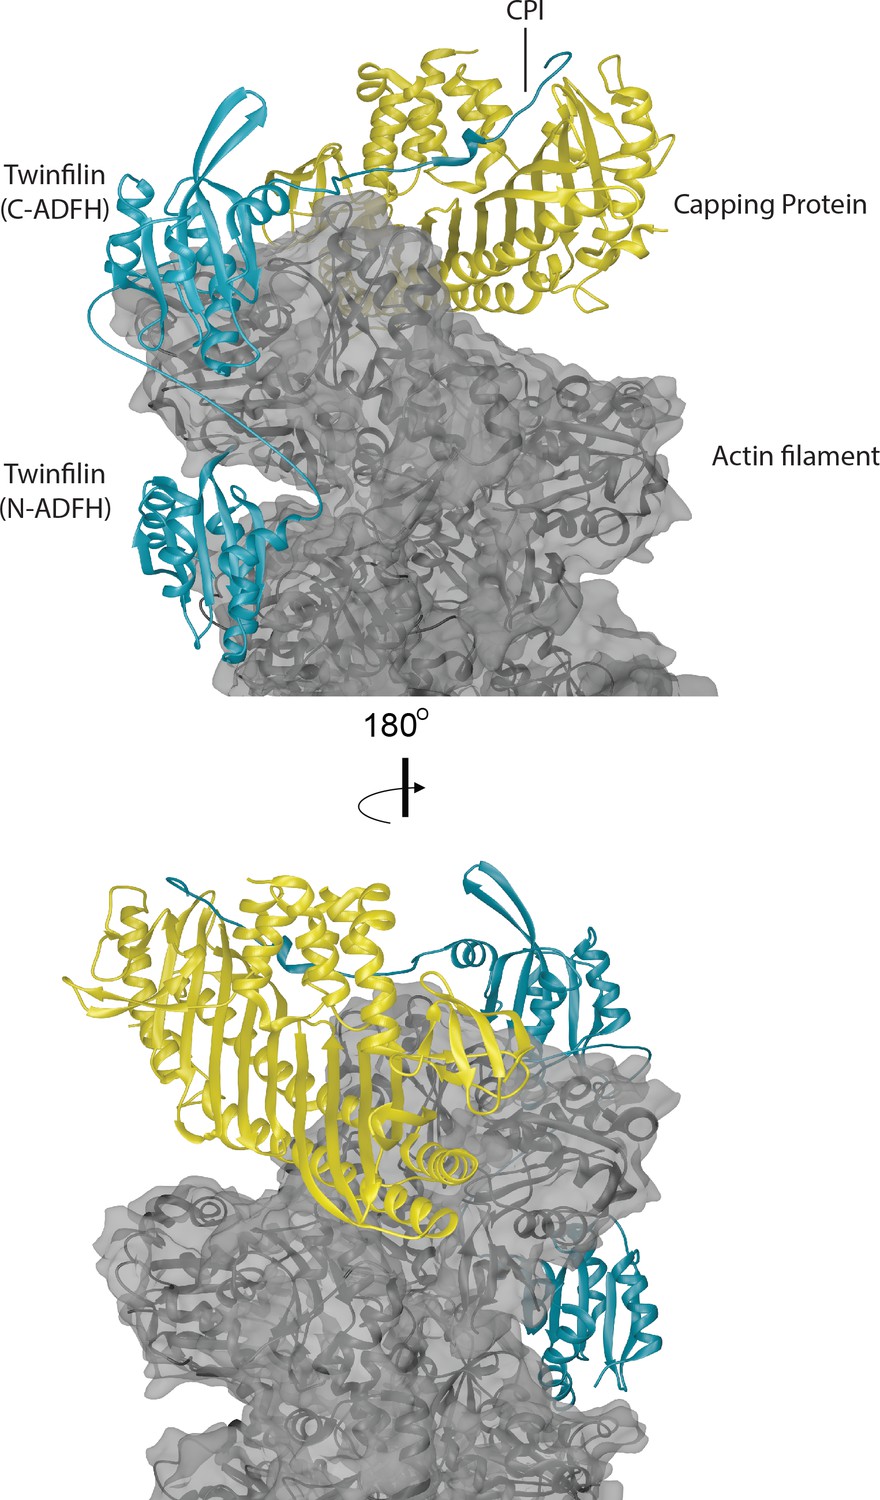
Structural model for a ternary complex formed by Twinfilin, Capping Protein and the barbed end of an actin filament.
The three actin protomers at the barbed end are shown in gray, the CP heterodimer is shown in yellow, and Twinfilin is shown in blue. The structure of CP bound to the barbed end was solved by cryo-EM (Narita et al., 2006). We docked the Twinfilin ADFH domains onto this structure using the following criteria. The Twinfilin N-terminal ADFH (N-ADFH) lobe, shown bound between the first and third subunits from the barbed end of the actin filament, is based on the structure of this domain bound to G-actin (PDB 3DAW) (Paavilainen et al., 2008), and assumes that this domain also uses its F-site to bind to F-actin in a manner similar to cofilin, which was solved by cryo-EM (PDB 5YU8) (Tanaka et al., 2018). The Twinfilin C-terminal ADFH (C-ADFH) lobe, shown bound to the first subunit of the actin filament barbed end, is based on the solution structure of this domain bound to G-actin via is G/F-site. The Twinfilin linker sequence (connecting the two ADFH domains) is depicted as an unstructured chain, 25 residues long, which if unstructured (87 Å) is sufficient in length to allow each ADFH domain to bind a different actin protomer. There is no structure available for the CPI motif-containing C-terminal tail of Twinfilin; therefore, in this model we used the known structure of the CPI region of CARMIL bound to the stalk of CP (PDB 3AAE) (Hernandez-Valladares et al., 2010). Attempts to model Twinfilin bound to the opposite strand of F-actin did not allow sufficient length between the tail (binding CP) and the C-terminal ADFH domain binding to actin.
Tables
Key resources table
| Reagent type (species) or resource | Designation | Source or reference | Identifiers | Additional information |
|---|---|---|---|---|
| Antibody | Rabbit anti- Twinfilin | Pekka Lappalainen (Univ. Helsinki) | WB (1:1000) IF (1:100) | |
| Antibody | mouse anti- Capping Protein | Development Studies Hybridoma Bank | Cat: 3F2 | WB (1:2000) IF (1:50) |
| Antibody | Mouse anti- Flag | Sigma Aldrich | Cat: F3165 | WB (1:5000) IF (1:500) |
| Antibody | Rabbit anti- Myc | GeneTex | Cat: GTX29106 | WB (1:5000) IF (1:500) |
| Antibody | Goat anti- mouse-HRP | GE Healthcare | Cat: 31430 | WB (1:10000) |
| Antibody | Goat anti- rabbit-HRP | GE Health care | Cat: 31460 | WB (1:10000) |
| Antibody | Donkey anti-rabbit Alexa Flour 488 | Thermo Fisher Scientific | Cat: A21206 | IF (1:1000) |
| Antibody | Donkey anti- mouse Alexa Flour 488 | Thermo Fisher Scientific | Cat: A21202 | IF (1:1000) |
| Antibody | Goat anti- rabbit Alexa Flour 633 | Thermo Fisher Scientific | Cat: A21071 | IF (1:1000) |
| Antibody | Donkey anti- mouse Alexa Flour 647 | Thermo Fisher Scientific | Cat: A31571 | IF (1:1000) |
| Cell line (M. musculus) | B16F10 | ATCC | CRL-6475 | |
| Cell line (M. musculus) | Neuro-2A neuroblast | ATCC | CCL-131 | |
| Cell line (M. musculus) | NIH3T3 filbroblast | ATCC | CRL-1658 | |
| Chemical compound, drug | NHS-XX- Biotin | Merck KGaA | Cat: 203188 | |
| Chemical compound, drug | Oregon-Green-488 iodoacetamide | Invitrogen | Cat: O6010 | |
| Chemical compound, drug | Ni2+-NTA- agarose beads | Qiagen | Cat: 30230 | |
| Chemical compound, drug | tetrame thylrhodamine (TAMRA)−5- maleimide | Invitrogen | Cat: T6027 | |
| Chemical compound, drug | methoxy-poly (ethylene glycol)- silane | Laysan Bio Inc | ||
| Chemical compound, drug | biotin-poly (ethylene glycol)- sil | Laysan Bio Inc | ||
| Chemical compound, drug | AquaMount | Thermo Fisher Scientific | Cat: 14-390-5 | |
| Chemical compound, drug | Alexa Flour 568- phalloidin | Thermo Fisher Scientific | Cat: A12380 | IF (1:1000) |
| Chemical compound, drug | Formaldehyde 37% | Sigma Aldrich | Cat: 252549 | |
| Commercial assay or kit | Lipofectamine RNAiMAX | Thermo Fisher Scientific | Cat: 137780–0775 | |
| Commercial assay or kit | Lipofectamine 3000 | Thermo Fisher Scientific | Cat: L2000-015 | |
| Commercial assay or kit | Pierce ECL Western Blotting Substrate detection kit | Thermo Fisher Scientific | Cat: 34580 | |
| Other | DMEM-Dulbecco's Modified Eagle Medium | Gibco BRL Life Technologies | Cat: 11995–073 | |
| Other | FBS-Fetal Bovine Serum | Sigma Aldrich | Cat: F9423 | |
| Other | 200 mM L- glutamine | Thermo Fisher Scientific | Cat: 25030–081 | |
| Peptide, recombinant protein | N-terminal HiLyte488 mTwf1 Tail | Anaspec | ||
| Peptide, recombinant protein | CARMIL CPI | WatsonBio Sciences | ||
| Peptide, recombinant protein | CARMIL CSI | WatsonBio Sciences | ||
| Peptide, recombinant protein | mTwf1 A305- D350 | WatsonBio Sciences | ||
| Peptide, recombinant protein | mTwf1 A305-D350, K325A | WatsonBio Sciences | ||
| Peptide, recombinant protein | PreScission protease | GE Healthcare | Cat: GE27-0843-01 | |
| Recombinant DNA reagent | chicken CPα1β1 | Soeno et al., 1998 Soeno et al., 1998 | Plasmid | |
| Recombinant DNA reagent | chicken SNAP- CPα1β1 | Bombardier et al., 2015 Bombardier et al., 2015 | Plasmid | |
| Recombinant DNA reagent | mouse CPα1β2 | Kim et al., 2012 | Plasmid | |
| Recombinant DNA reagent | mouse CPα1Δ28 | Kim et al., 2012 | Plasmid | |
| Recombinant DNA reagent | mouse CP α1β2 R15A/Y79A | Edwards et al., 2015 Edwards et al., 2015 | Plasmid | |
| Recombinant DNA reagent | human CARMIL1 CBR115 (964–1078) | Kim et al., 2012 | Plasmid | |
| Recombinant DNA reagent | human V-1 | Edwards et al., 2015 | Plasmid | |
| Recombinant DNA reagent | CARMIL1 | Edwards et al., 2013 Edwards et al., 2013 | Plasmid | |
| Recombinant DNA reagent | pGEX-6p-1- mTwf1 | Hilton et al., 2018 Hilton et al., 2018 | Plasmid | |
| Recombinant DNA reagent | pGEX-6p-1 -mTwf2a | Hilton et al., 2018 Hilton et al., 2018 | Plasmid | |
| Recombinant DNA reagent | pGEX-6p-1- mTwf1-11 | This paper | Plasmid | |
| Recombinant DNA reagent | pEGFP-C1 | Clontech | Plasmid | |
| Recombinant DNA reagent | pCMV-M1 | Addgene | Cat: 23007 | Plasmid |
| Recombinant DNA reagent | pCMV-myc-mTwf1 | This paper | Plasmid | |
| Recombinant DNA reagent | pCMV-myc-mTwf1-11 | This paper | Plasmid | |
| Sequence- based reagent | siTwf1 | This paper | siRNA; CGUUACCA UUUCUUUCUGUUU | |
| Sequence- based reagent | siCP1 | This paper | siRNA; CCUCAGCGA UCUGAUCGACUU | |
| Sequence- based reagent | siCP2 | This paper | siRNA; GCACGC UGAAUGAGAUCUA | |
| Sequence- based reagent | control RNAi oligos (Stealth RNAi) | Invitrogen | Cat: 12935–200 | |
| Software, algorithm | Fiji/Image J | Schindelin et al., 2012 | ||
| Software, algorithm | NIS Elements software - Version 4.30.02 | Nikon Instruments | ||
| Software, algorithm | GraphPad Prism 6.0 | GraphPad Software | ||
| Software, algorithm | Adobe Creative Cloud Illustrator | Adobe Systems | ||
| Strain, strain background (E. coli) | BL21 (DE3) pLysS | This paper | ||
| Strain, strain background (E. coli) | BL21 (DE3) pRIL | This paper | ||
| Strain, strain background (E. coli) | BL21 (DE3) pRARE | This paper |
Download links
A two-part list of links to download the article, or parts of the article, in various formats.
Downloads (link to download the article as PDF)
Open citations (links to open the citations from this article in various online reference manager services)
Cite this article (links to download the citations from this article in formats compatible with various reference manager tools)
A novel mode of capping protein-regulation by twinfilin
eLife 7:e41313.
https://doi.org/10.7554/eLife.41313


