Mitochondrial fusion supports increased oxidative phosphorylation during cell proliferation
- Washington University, United States
- Washington University School of Medicine, United States
Figures
Figure 1 with 2 supplements
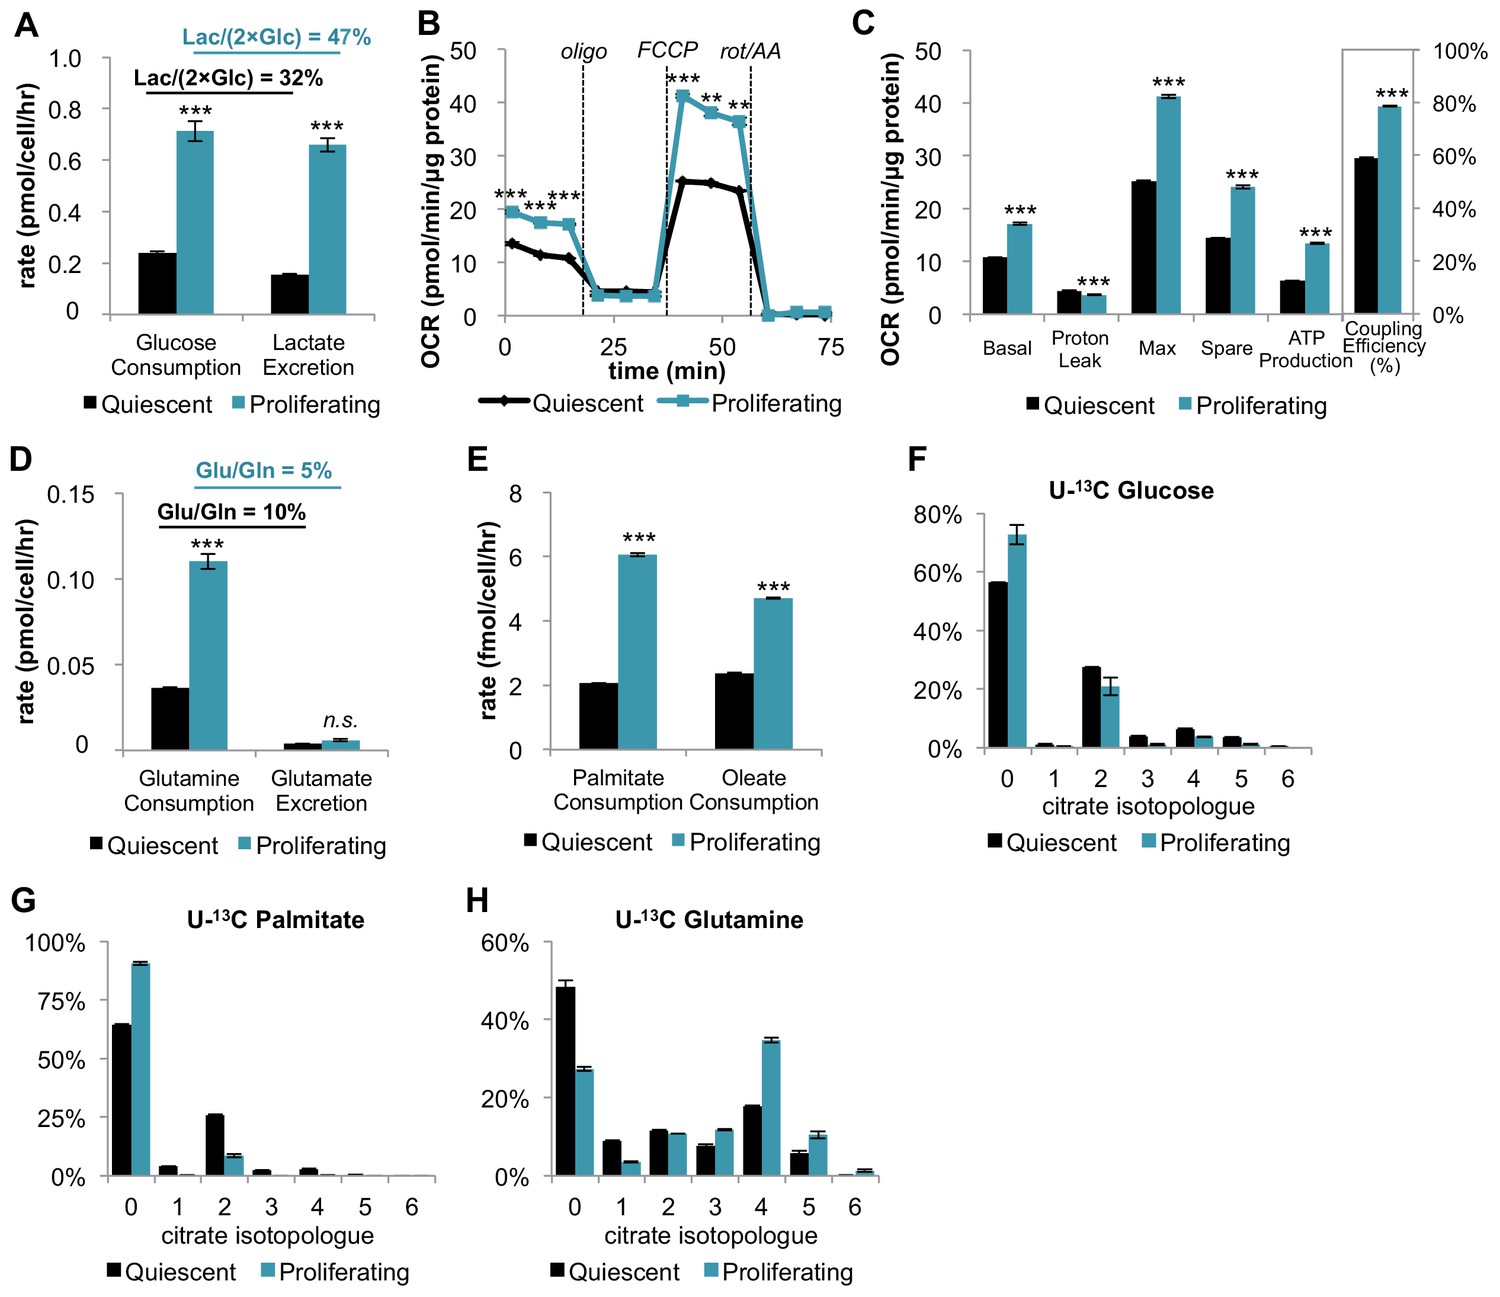
In addition to increasing glucose consumption and lactate excretion, proliferating fibroblasts also increase mitochondrial respiration and mitochondrial coupling efficiency.
(A) Glucose consumption and lactate excretion rates for quiescent and proliferating fibroblasts (n = 4). As expected, proliferating cells exhibit an enhanced glycolytic phenotype that is consistent with the Warburg effect. (B) Mitochondrial stress test of quiescent and proliferating fibroblasts. OCR was normalized to protein amount to take into account differences in cell size. Displayed OCR values were corrected for non-mitochondrial respiration (n = 3). (C) Measured and calculated parameters of mitochondrial respiration (using results from Figure 1B). We note that the coupling efficiency is calculated as the ratio of the OCR required for ATP production relative to the basal OCR in the same sample and therefore is independent of the sample normalization method (n = 3). (D) Glutamine consumption and glutamate excretion rates for quiescent and proliferating fibroblasts (n = 4). (E) Palmitate and oleate consumption rates for quiescent and proliferating fibroblasts (n = 4). (F–H) Isotopologue distribution pattern of citrate after cells were labeled with U-13C glucose (F), U-13C palmitate (G), or U-13C glutamine (H) for 6 hr (n = 3). Data are presented as mean ±SEM. **p<0.01, ***p<0.001, n.s. not statistically significant. OCR, oxygen consumption rate; oligo, oligomycin; rot, rotenone; AA, Antimycin A.
-
Figure 1—source data 1
Total accounting of glucose utilization in quiescent and proliferating cells.
Data are presented as mean ±SEM (n = 4).
- https://doi.org/10.7554/eLife.41351.006
-
Figure 1—source data 2
Labeling percentages of 13C-enriched precursors for Figure 1.
Data are presented as mean ±SEM (n = 3).
- https://doi.org/10.7554/eLife.41351.007
-
Figure 1—source data 3
Mass isotopologue distributions for all metabolites analyzed by LC-MS in Figure 1F–H.
- https://doi.org/10.7554/eLife.41351.008
Figure 1—figure supplement 1
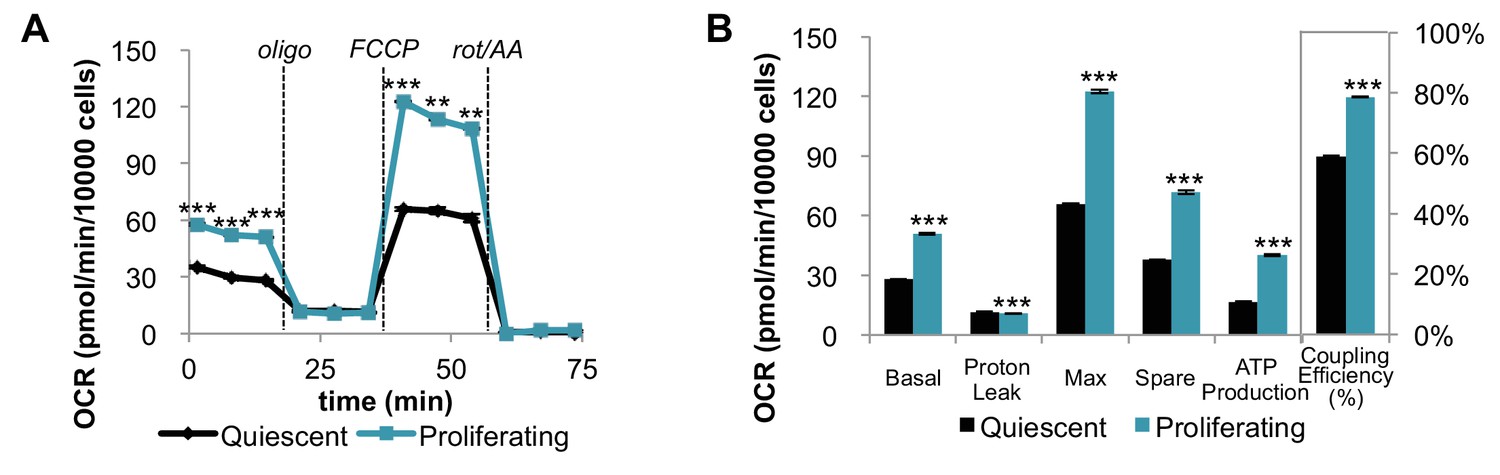
Mitochondrial stress test of quiescent and proliferating fibroblasts normalized by cell number.
Note, Figure 1—figure supplement 1 (normalization by cell number) is different from Figure 1 (normalization by protein amount). (A) When data from the mitochondrial stress test of quiescent and proliferating fibroblasts are normalized by cell number, the trend is consistent with the data shown in Figure 1B. Displayed OCR values were corrected for non-mitochondrial respiration (n = 3). (B) Measured and calculated parameters of mitochondrial respiration (using results in Figure 1—figure supplement 1A). Data are presented as mean ±SEM. **p<0.01, ***p<0.001. OCR, oxygen consumption rate; oligo, oligomycin; rot, rotenone; AA, Antimycin A.
Figure 1—figure supplement 2

Proliferating fibroblasts increase their consumption rate of cystine by two-fold without altering the expression level of the cystine/glutamate antiporter SLC7A11.
(A) Immunoblot analysis of whole-cell lysates for SLC7A11 in quiescent (Q) and proliferating (P) fibroblasts. (B) Relative change in cystine consumption rates for quiescent and proliferating fibroblasts (n = 3). Data are presented as mean ±SEM. *p<0.05.
Figure 2 with 5 supplements
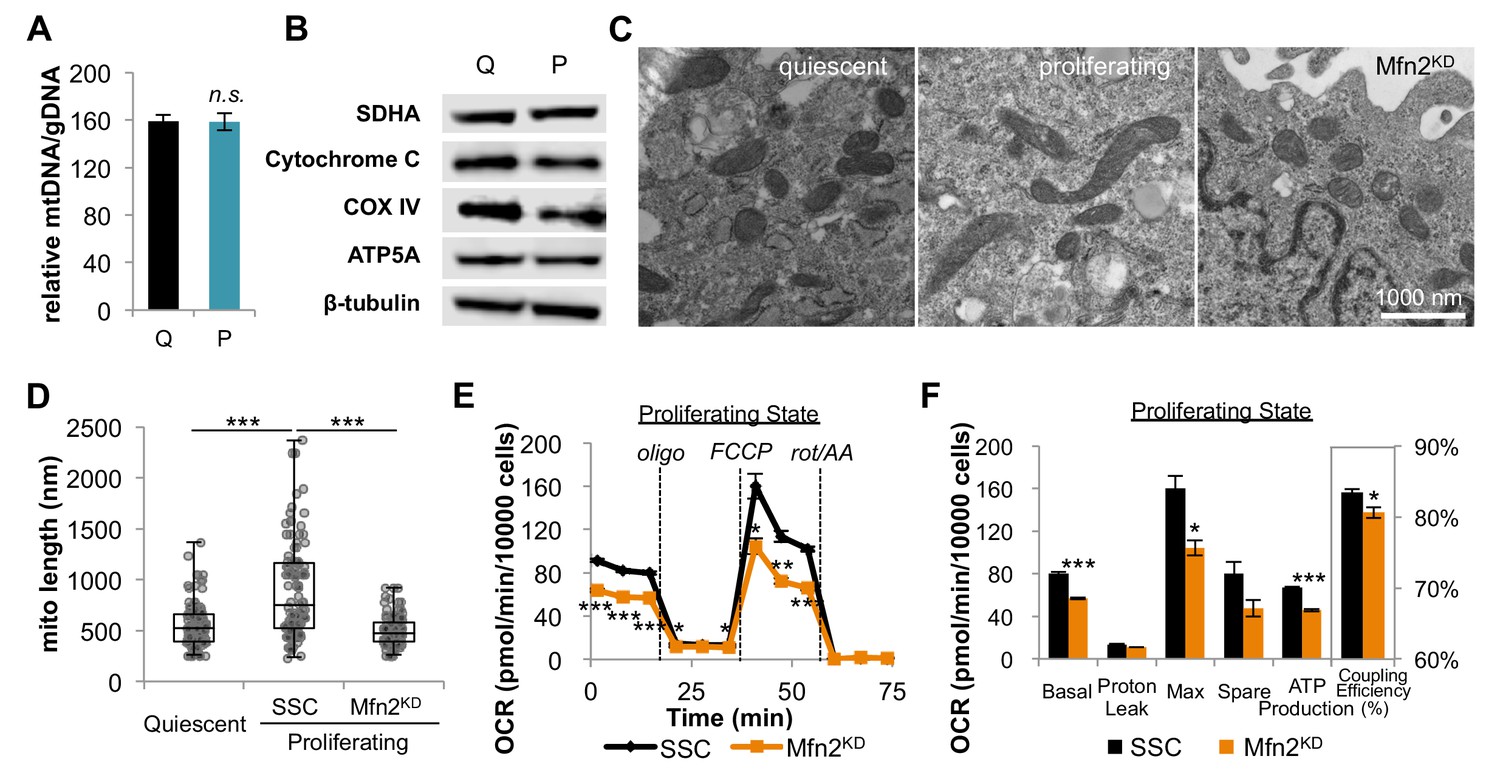
Proliferating fibroblasts regulate respiration by mitochondrial fusion.
(A) Mitochondrial mass remains the same for quiescent (Q) and proliferating (P) fibroblasts as estimated by the ratio of mtDNA to gDNA (n = 3). (B) Proliferating fibroblasts have similar protein expression levels of ETC subunits as quiescent fibroblasts. (C) Representative EM images of mitochondria in quiescent fibroblasts, proliferating fibroblasts, and proliferating Mfn2 knockdowns show changes in mitochondrial elongation. (D) Statistical analysis of mitochondrial length in quiescent fibroblasts, proliferating fibroblasts, and proliferating Mfn2 knockdowns. For each condition, 100 random mitochondria were measured from EM images. Data are presented as mean ±SD. (E) Mitochondrial stress test of scrambled siRNA control (SSC) cells and Mfn2 knockdown cells (Mfn2KD), both in the proliferating state (n = 3). Data are presented as mean ±SEM. (F) Measured and calculated parameters of mitochondrial respiration (using results from Figure 2E) (n = 3). Data are presented as mean ±SEM. *p<0.05, **p<0.01, ***p<0.001, n.s. not statistically significant. OCR, oxygen consumption rate; oligo, oligomycin; rot, rotenone; AA, Antimycin A.
Figure 2—figure supplement 1
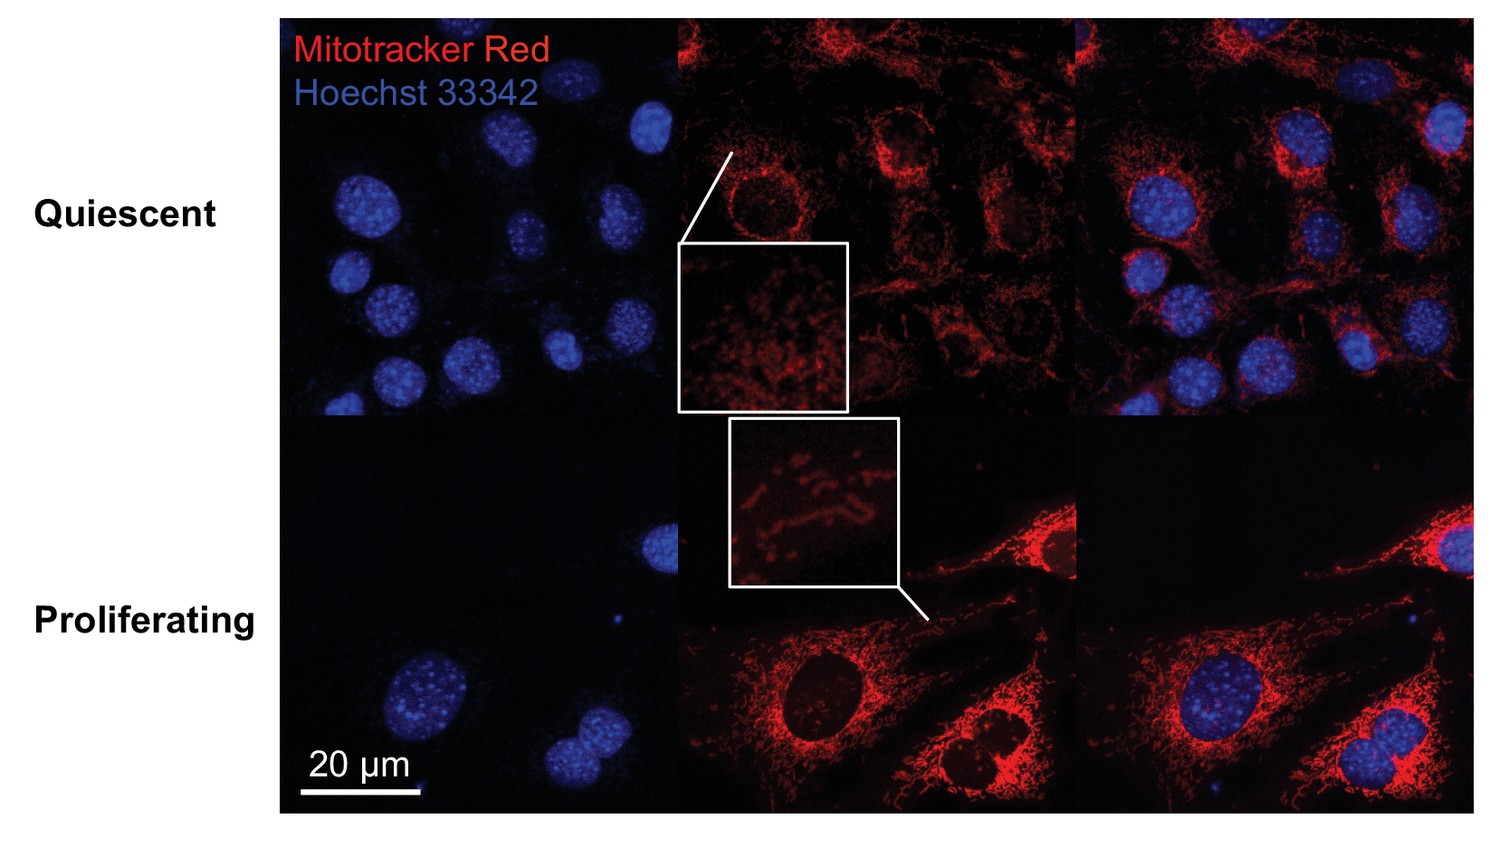
Fluorescence imaging shows that mitochondria are elongated in proliferating fibroblasts but not in quiescent fibroblasts.
Mitochondria were stained by Mitotracker red, and nuclei were stained by Hoechst 33342. Cells were subjected to live imaging.
Figure 2—figure supplement 2

Mitochondria in proliferating fibroblasts have increased levels of mitochondrial fusion proteins compared to quiescent fibroblasts.
Isolated mitochondrial lysates were immunoblotted for Mfn1, Mfn2, and OPA1. Pyruvate dehydrogenase (PDH) was used as a mitochondrial matrix loading control.
Figure 2—figure supplement 3

Immunoblot analysis shows that Mfn2 remained significantly knocked down during the course of the entire experiment.
Whole-cell lysates were analyzed after cells were treated with scrambled siRNA control (SSC), DsiRNA duplex #1, or DsiRNA duplex #2 for 48 hr or a mixture of the two duplexes for the indicated time.
Figure 2—figure supplement 4
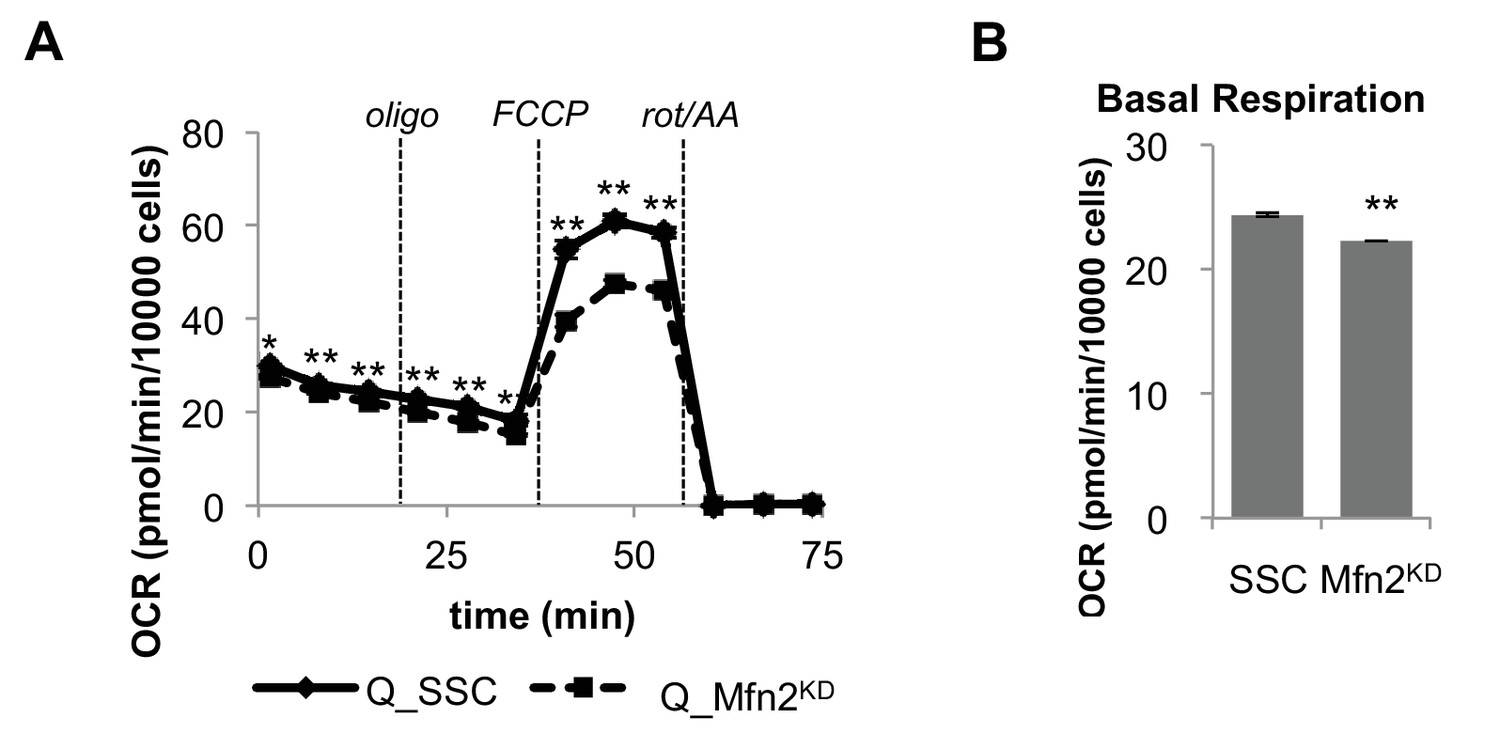
Mfn2 knockdown has minimal effect on basal mitochondrial respiration in quiescent (Q) fibroblasts.
(A) Mitochondrial stress test of scrambled siRNA control cells (SSC) and Mfn2 knockdown cells (Mfn2KD), both in the quiescent state (n = 3). (B) Basal respiration rates of SSC and Mfn2 cells (using results from Figure Figure 2—figure supplement 4A). Data are presented as mean ±SEM. *p<0.05, **p<0.01. OCR, oxygen consumption rate; oligo, oligomycin; rot, rotenone; AA, Antimycin A.
Figure 2—figure supplement 5
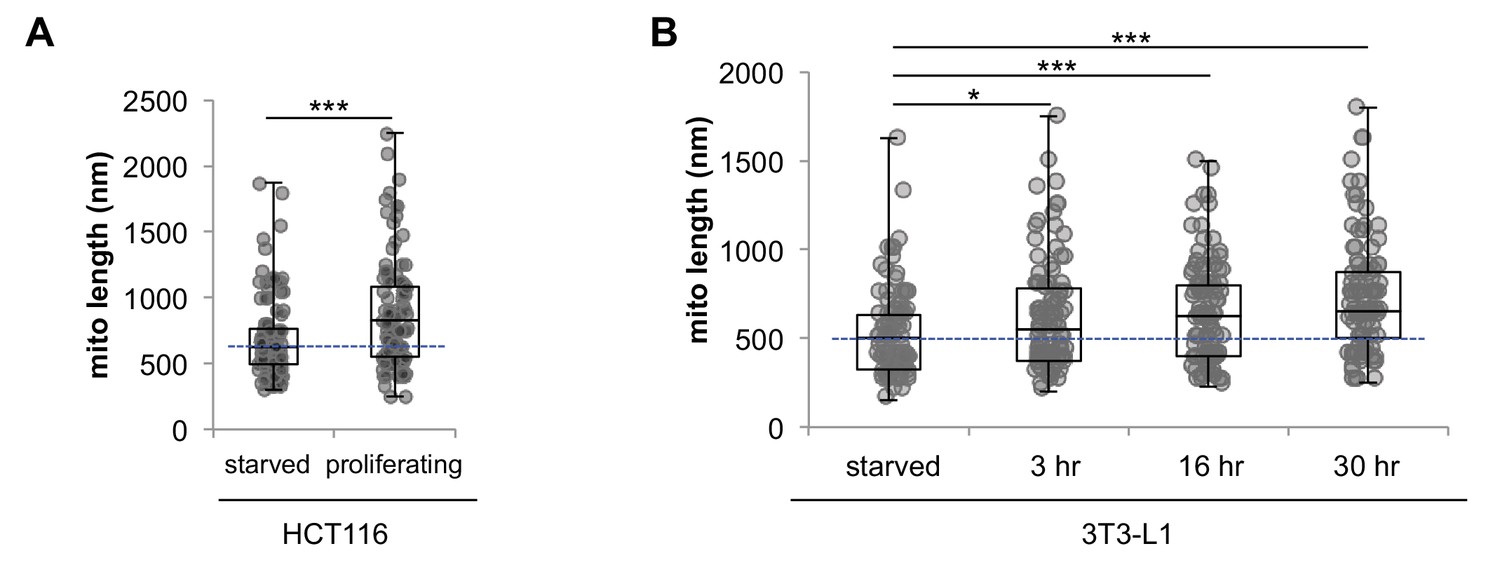
Serum starvation induces mitochondrial fragmentation in 3T3-L1 and HCT116 cells.
Mitochondrial elongation starts as soon as 3 hr after addition of serum. (A) Statistical analysis of mitochondrial length in serum starved HCT116 cells and proliferating HCT116 cells cultured in normal media. (B) Statistical analysis of mitochondrial length in serum starved quiescent 3T3-L1 fibroblasts. After serum was added to the media, mitochondrial length increased in as quick as 3 hr. For each condition, 100 random mitochondria were measured from EM images. Data are presented as mean ±SD.
Figure 3 with 3 supplements
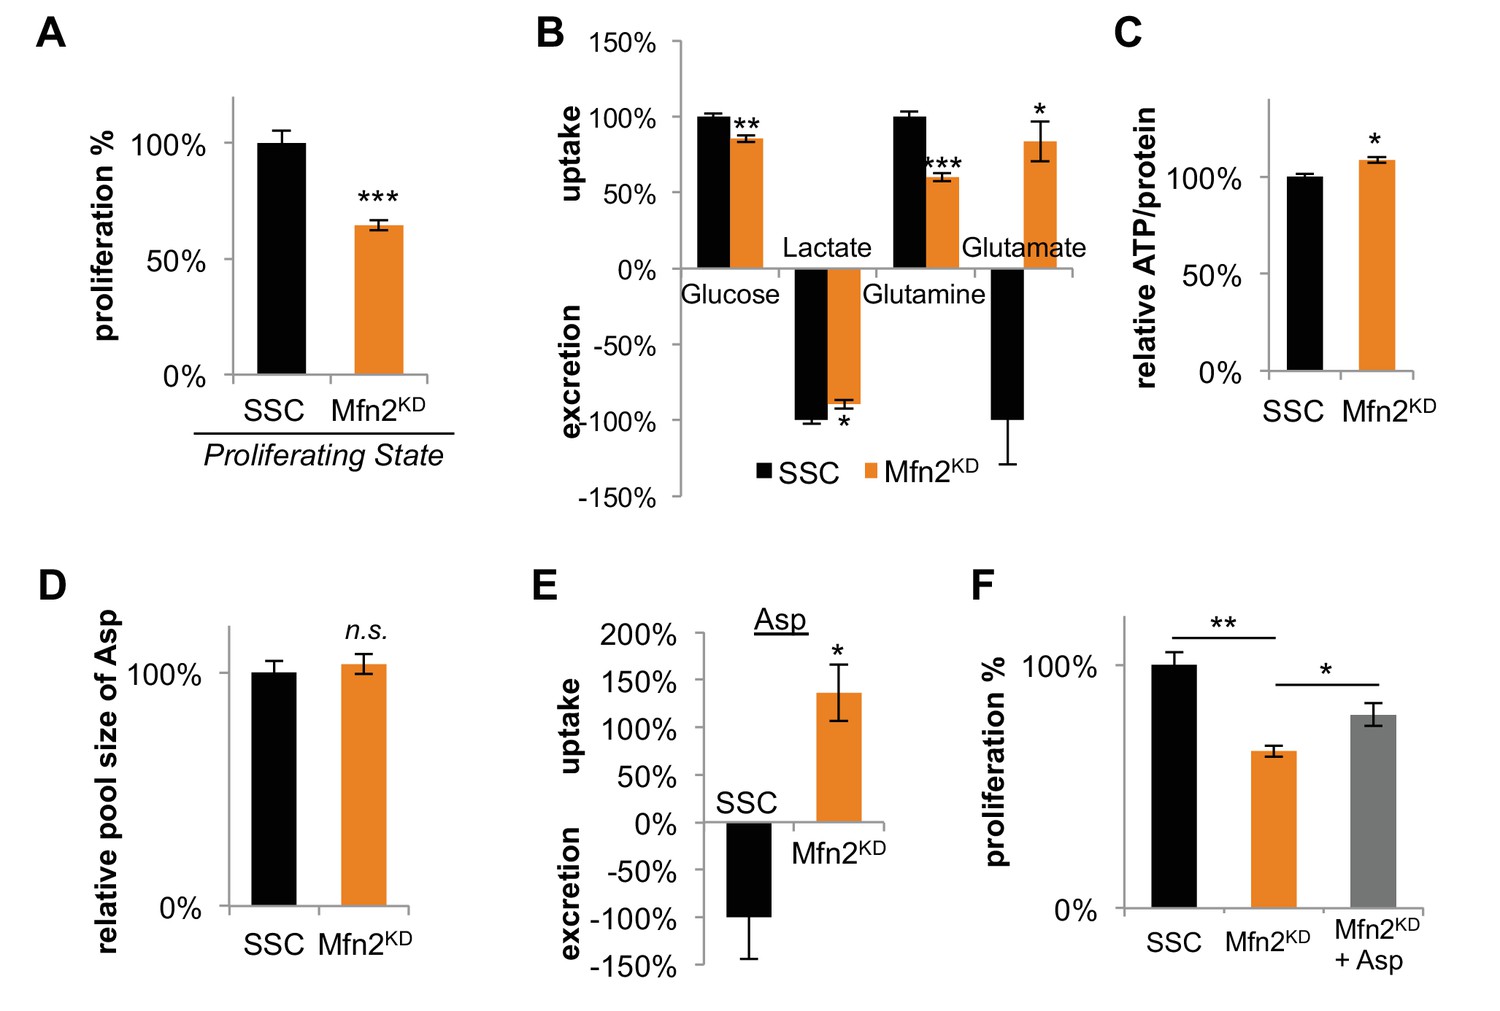
Inhibition of mitochondrial fusion by Mfn2 knockdown slows proliferation by limiting aspartate synthesis.
(A) Proliferation was assessed by using a CyQUANT assay after cells were treated with scrambled siRNA control (SSC) or Mfn2 siRNA for 72 hr (n = 5). (B) Mfn2 knockdown alters nutrient utilization (n = 4). Glutamine consumption decreases in Mfn2 knockdown cells, which is consistent with a decreased demand for glutamine to fuel a reduced level of OXPHOS. (C) Intracellular ATP levels in scrambled siRNA controls (SSC) were lower relative to Mfn2 knockdowns. ATP luminescence signals were normalized to protein amount (n = 5). (D) The intracellular pool of aspartate remained unchanged upon Mfn2 knockdown (n = 3). Pool sizes were normalized by dry cell mass and internal standard. (E) Scrambled siRNA controls excrete aspartate into the media, while Mfn2 knockdowns uptake aspartate from the media (n = 4). (F) Supplementing the media with 1 mM aspartate partially rescued the proliferation of Mfn2 knockdowns (n = 6). Data are presented as mean ±SEM. *p<0.05, **p<0.01, ***p<0.001, n.s. not statistically significant.
-
Figure 3—source data 1
Sequences for dicer-substrate short interfering RNA (DsiRNA) and siRNA-resistant Mfn2res.
- https://doi.org/10.7554/eLife.41351.019
Figure 3—figure supplement 1
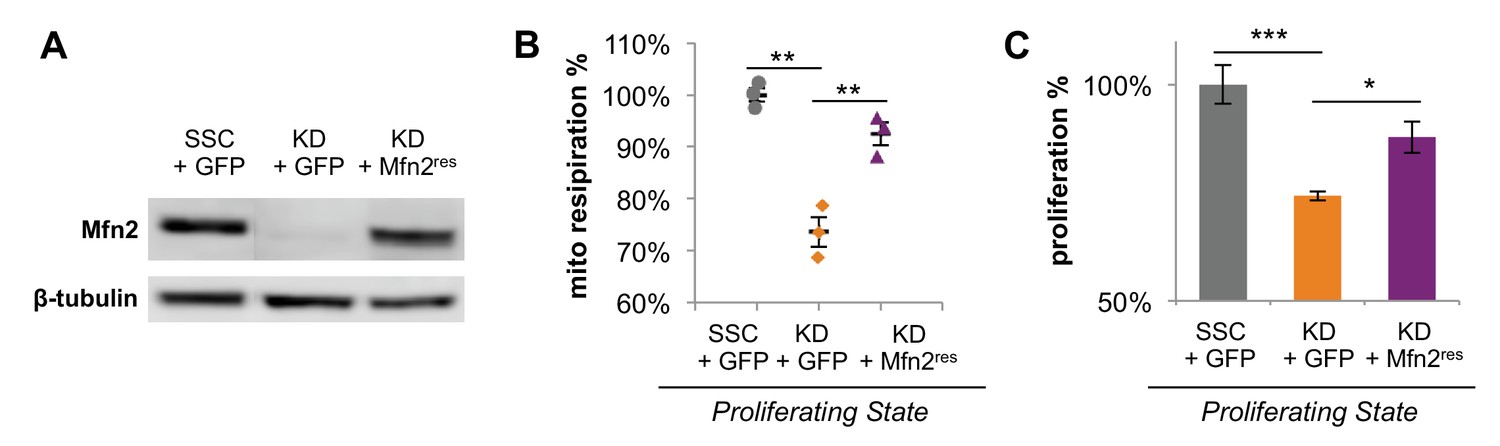
Expression of siRNA-resistant Mfn2 (Mfn2res) in Mfn2 knockdowns restored Mfn2 protein level, mitochondrial respiration, and cellular proliferation.
(A) Immunoblot analysis of Mfn2 in whole-cell lysates of scrambled siRNA controls expressing GFP (SSC + GFP), Mfn2 knockdowns expressing GFP (KD + GFP), and Mfn2 knockdowns expressing siRNA-resistant Mfn2 (KD+Mfn2res). (B) Basal respiration rates of SSC + GFP, KD + GFP, and KD+Mfn2res cells were determined by using a mitochondrial stress test (n = 3). (C) The proliferation of SSC + GFP, KD + GFP, and KD+Mfn2res was assessed by manual cell counting after a 64 hr knockdown and 48 hr overexpression (n = 5). Data are presented as mean ±SEM. *p<0.05, **p<0.01, ***p<0.001.
Figure 3—figure supplement 2
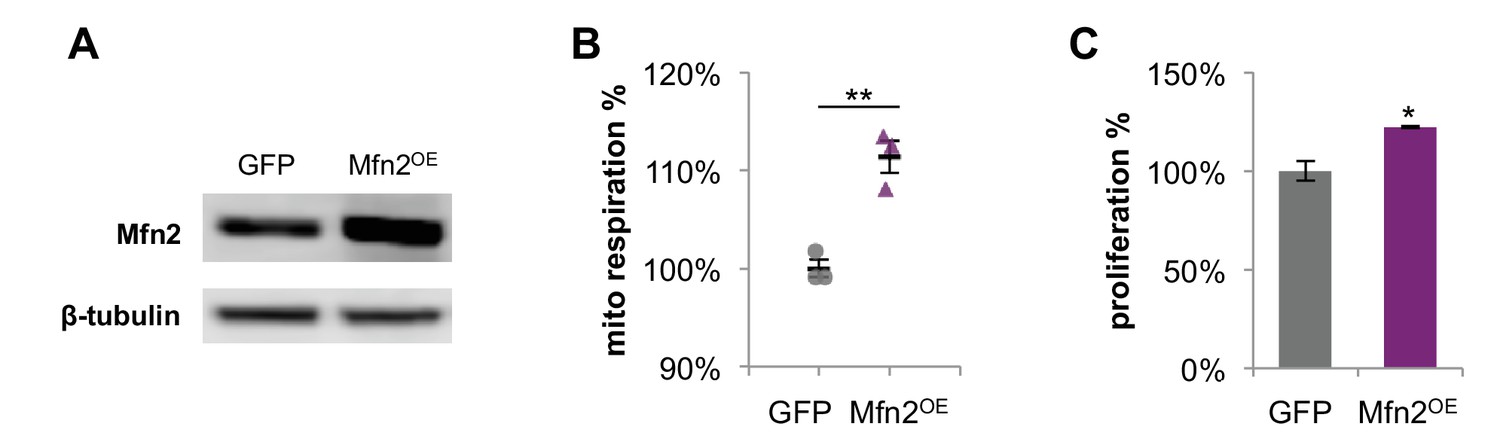
Overexpression of Mfn2 in 3T3-L1 fibroblasts increases mitochondrial respiration and cellular proliferation.
(A) Immunoblot analysis of Mfn2 in whole-cell lysates of control cells expressing GFP and cells expressing siRNA-resistant wildtype Mfn2 (Mfn2OE). (B) Basal respiration rates of GFP control cells and Mfn2OE cells were determined by using a mitochondrial stress test (n = 3). (C) The proliferation of GFP control cells and Mfn2OE cells was assessed by manual cell counting after a 48 hr overexpression (n = 4). Data are presented as mean ±SEM. *p<0.05, **p<0.01.
Figure 3—figure supplement 3
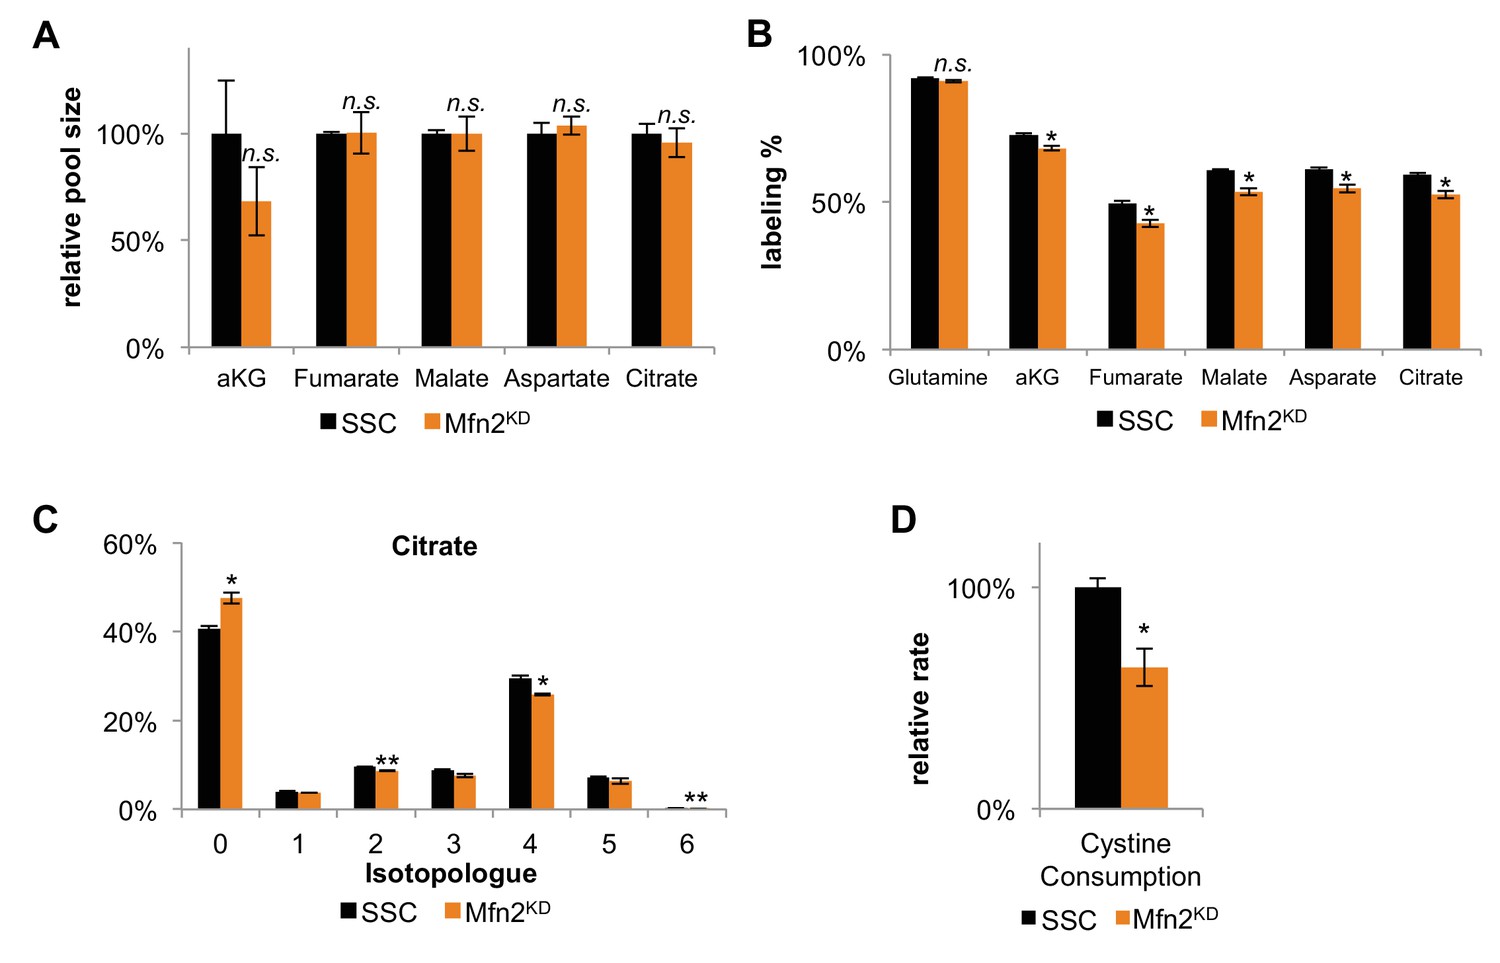
Decreased labeling percentages of TCA cycle intermediates and decreased cystine consumption in Mfn2 knockdowns (Mfn2KD) suggests a decrease in glutamine anaplerosis compared to scrambled siRNA controls (SSC).
(A) The relative pool size of TCA cycle intermediates remained unchanged in Mfn2 knockdowns. The pool sizes were normalized by dry cell mass and internal standards (n = 3). (B) The labeling percentages of TCA cycle intermediates were significantly decreased in Mfn2 knockdowns. (C) The isotopologue distribution of citrate shows a similar pattern, but decreased labeling for all isotopologues. These changes imply a change in TCA cycle flux. (D) Relative change in cystine consumption rates for SSC and Mnf2 knockdowns (n = 3). Data are presented as mean ±SEM. *p<0.05, **p<0.01, n.s. not statistically significant.
Figure 4 with 4 supplements

H-Ras transformed fibroblasts (Ras) have elongated mitochondria and increased OXPHOS that is supported by mitochondrial biogenesis.
(A) Immunoblotting of whole-cell lysates shows H-Ras expression in transformed fibroblasts, but not in empty vector (EV) controls. (B) Growth curve shows the loss of contact inhibition in H-Ras transformed fibroblasts. The proliferation of EV controls remains cell-density dependent (n = 4). (C) Ras cells exhibit a morphological change and gain the ability to grow on top of each other to form multiple cell layers. (D) Mitochondrial stress test of EV controls and Ras cells (n = 3). The respiration of Ras cells is statistically increased compared to EV controls. (E) Measured and calculated parameters of mitochondrial respiration (using results from Figure 4D) (n = 3). (F) Statistical analysis of mitochondrial length in EV controls and Ras cells. In each condition, 100 random mitochondria were measured from EM images. Data are presented as mean ±SD. (G) RT-PCR shows that Ras cells have over a 20-fold increase in mRNA levels of PGC1α (n = 3). (H) Ras cells have increased mitochondrial mass, as indicated by an increased mtDNA/gDNA compared to EV controls (n = 3). (I) Immunoblotting of whole-cell lysates shows that Ras cells have higher expression levels of ETC subunits compared to EV controls. (J) Mfn2 knockdown decreases cellular proliferation in both EV controls and Ras cells. Proliferation was assessed by manual counting after cells were treated with scrambled siRNA control (SSC) or Mfn2 siRNA (Mfn2KD) for 72 hr. Relative proliferation was normalized to either an EV SSC or a RAS SSC for each condition (n = 4). (K) Mfn2 knockdown decreases cellular proliferation in H460 (lung cancer cells), HeLa (cervical cancer cells), BT549 (breast cancer cells), and MCF7 (breast cancer cells). Proliferation was assessed by using a CyQUANT proliferation assay after cells were treated with scrambled siRNA control (SSC) or Mfn2 siRNA (Mfn2KD) for 72 hr (n = 5). Unless specified, data are presented as mean ±SEM. *p<0.05, **p<0.01, ***p<0.001, n.s. not statistically significant. OCR, oxygen consumption rate; oligo, oligomycin; rot, rotenone; AA, Antimycin A.
Figure 4—figure supplement 1

β-Galactosidase staining shows that empty vector control (EV) and H-Ras transformed fibroblasts (Ras) do not undergo senescence.
Positive staining controls (pH = 5) are shown on top. Negative staining results from H-Ras transformed fibroblasts indicate that the cells are not undergoing senescence.
Figure 4—figure supplement 2
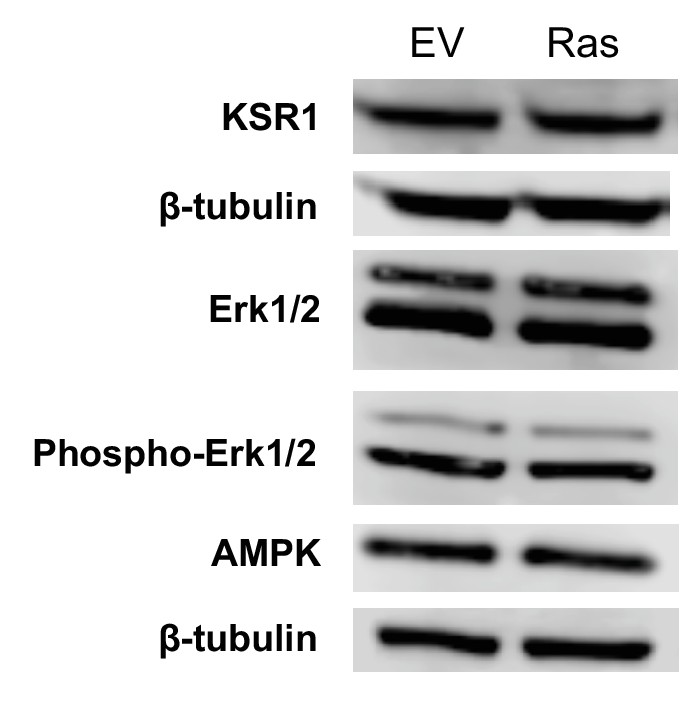
Immunoblot analysis of components in the ERK/AMPK pathway and the KSR1 pathway shows no difference between empty vector controls (EV) and Ras transformed fibroblasts (Ras).
https://doi.org/10.7554/eLife.41351.022
Figure 4—figure supplement 3
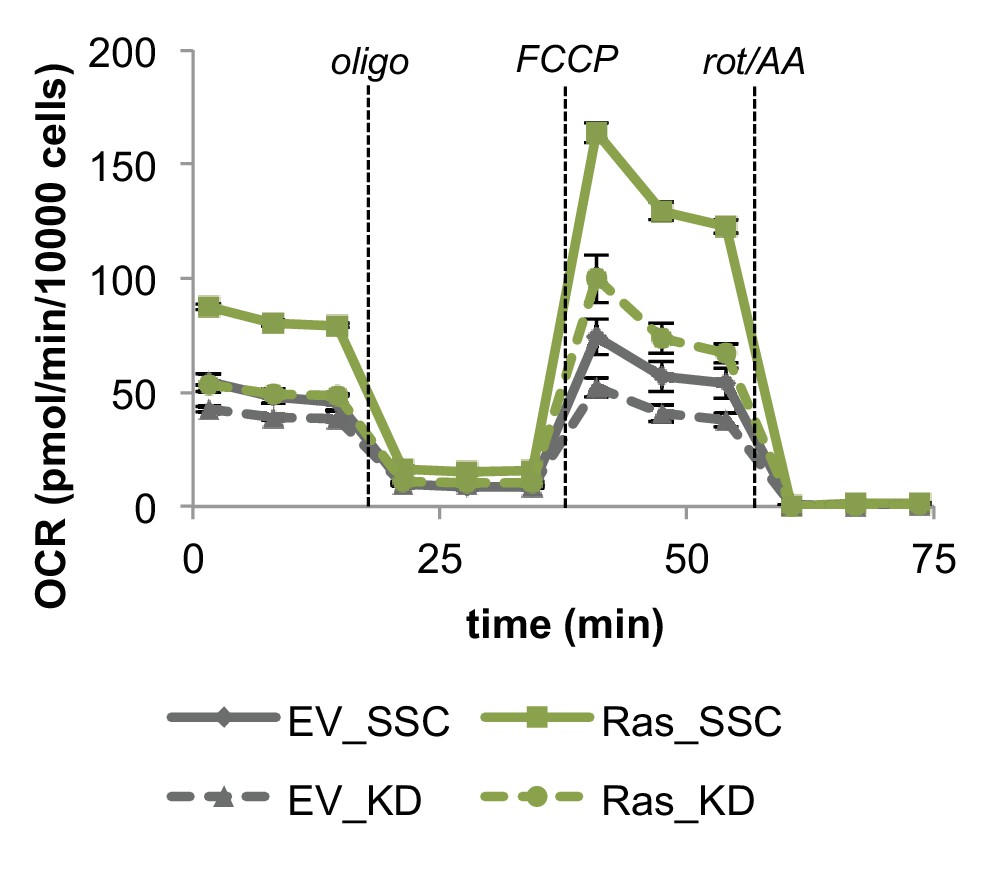
Inhibiting mitochondrial fusion by Mfn2 knockdown decreases mitochondrial respiration rates in EV controls and Ras cells.
Mitochondrial stress test of EV controls and Ras cells. OCR was normalized by cell number. Displayed OCR values were corrected for non-mitochondrial respiration (n = 3). Data are presented as mean ±SEM. OCR, oxygen consumption rate; oligo, oligomycin; rot, rotenone; AA, Antimycin A.
Figure 4—figure supplement 4
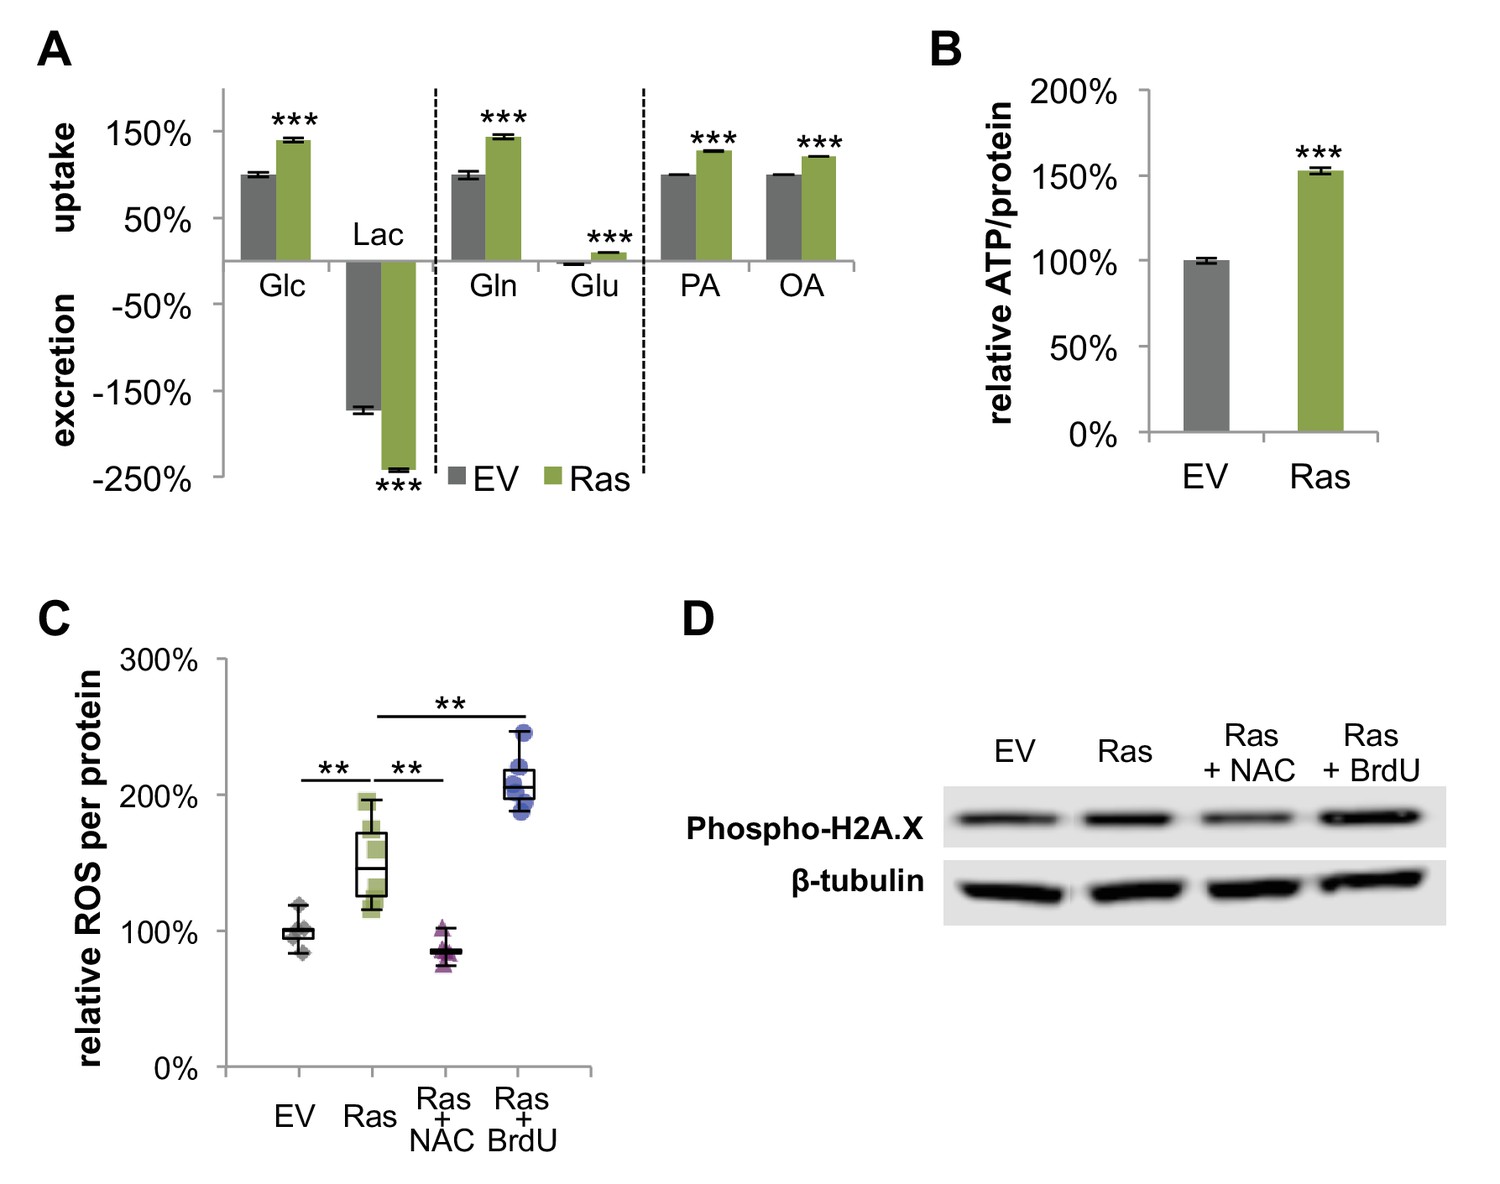
H-Ras transformed fibroblasts have increased metabolic activity, elevated levels of ROS, and DNA damage.
(A) Ras cells have increased glucose uptake and lactate excretion compared to proliferating EV controls. Ras cells also exhibited altered profiles for glutamine, glutamate, and fatty acid consumption (n = 4). (B) Ras cells have higher intracellular ATP levels than EV controls. ATP luminescence signals were normalized to protein amount (n = 5). (C) Intracellular ROS was measured by using a DCFDA assay and normalized to protein amount. Negative controls (Ras +NAC) were treated with NAC, a ROS scavenger for 48 hr. Positive controls were treated with BrdU to induce oxidative stress for 48 hr (n = 6). (D) DNA damage was determined by measuring the protein amount of phospho-histone H2A.X (Ser139). Data are presented as mean ±SEM. **p<0.01, ***p<0.001.
Figure 5

Schematic representation of the metabolic differences between quiescent and proliferating fibroblasts.
Compared to quiescent fibroblasts, proliferating cells increase both glycolysis and OXPHOS. The increase in OXPHOS is supported by mitochondrial fusion.
Author response image 1
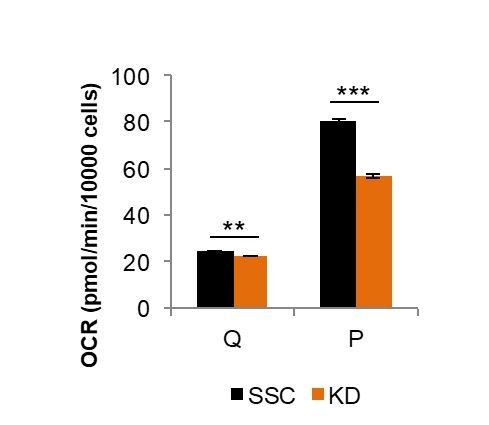
Comparison of Mfn2 knockdown on basal respiration in quiescent (Q) and proliferating (P) fibroblasts.
Loss of Mfn2 had only minimal effects on oxygen consumption rate (OCR) in quiescent cells but had a substantial impact on proliferating cells. This plot is derived from data shown in Figure 2E and Figure 2—figure supplement 4, but is not included in the revised manuscript directly.
Author response image 2
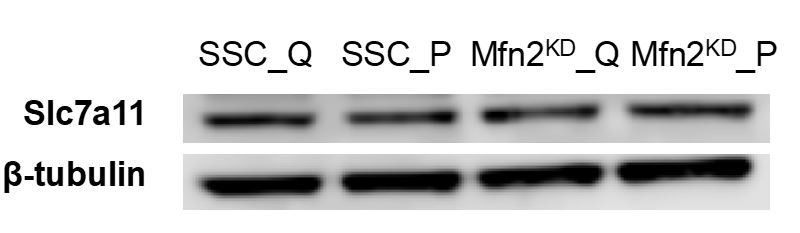
Immunoblot of SLC7A11 from whole-cell lysates for scrambled siRNA control cells in the quiescent state (SSC_Q), siRNA control cells in the proliferating state (SSC_P), Mfn2 knockdown cells in the quiescent state (Mfn2KD_Q), and Mfn2 knockdown cells in the proliferating state (Mfn2KD_P).
https://doi.org/10.7554/eLife.41351.029
Author response image 3
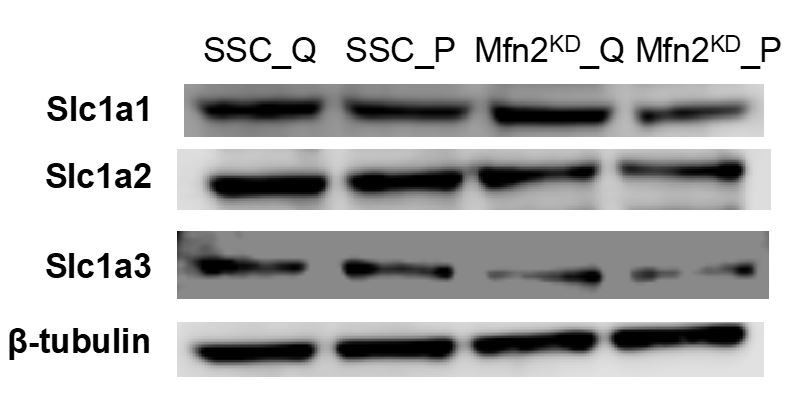
Immunoblot of SLC1A1/2/3 transporters from whole-cell lysates for scrambled siRNA control cells in the quiescent state (SSC_Q), siRNA control cells in the proliferating state (SSC_P), Mfn2 knockdown cells in the quiescent state (Mfn2KD_Q), and Mfn2 knockdown cells in the proliferating state (Mfn2KD_P).
https://doi.org/10.7554/eLife.41351.030Tables
Key resources table
| Reagent type (species) or resource | Designation | Source or reference | Identifiers | Additional information |
|---|---|---|---|---|
| Cell line (M. musculus) | 3T3-L1 | American Type Culture Collection | RRID:CVCL_0123 | |
| Recombinant DNA reagent | Mfn2res | this study | codon-optimized cDNA of Mfn2 in pcDNA3.1(+) vector (siRNA-resistant) | |
| Recombinant DNA reagent | GFP | Genscript | pcDNA3.1_N-eGFP | |
| Recombinant DNA reagent | pCMV-VSV-G | Washington University | Addgene plasmid # 8454 | |
| Recombinant DNA reagent | pCMVDR8.2 | Washington University | Addgene plasmid # 12263 | |
| Recombinant DNA reagent | pLVX-HRasV12- hygromycin | Washington University | ||
| Antibody | Rabbit anti-Mfn2, monoclonal | Cell Signaling | Cat.#: 9482, RRID:AB_2716838 | WB (1:1000) |
| Antibody | Rabbit anti-OPA1, monoclonal | Cell Signaling | Cat.#: 80471 | WB (1:1000) |
| Antibody | Rabbit anti-COXIV, monoclonal | Cell Signaling | Cat.#: 4850, RRID:AB_2085424 | WB (1:1000) |
| Antibody | Rabbit anti-Ras (G12V), monoclonal | Cell Signaling | Cat.#: 14412, RRID:AB_2714031 | WB (1:1000) |
| Antibody | Rabbit anti- phospho-H2A.X, monoclonal | Cell Signaling | Cat.#: 9718, RRID:AB_2118009 | WB (1:1000) |
| Antibody | Rabbit anti-AMPKα, monoclonal | Cell Signaling | Cat.#: 5831, RRID:AB_10622186 | WB (1:1000) |
| Antibody | Rabbit anti-KSR1,, polyclonal | Cell Signaling | Cat.#: 4640 | WB (1:1000) |
| Antibody | Rabbit anti- p44/42 MAPK (Erk1/2), monoclonal | Cell Signaling | Cat.#: 4695 | WB (1:1000) |
| Antibody | Rabbit anti- Phospho-p44/42 MAPK (Erk1/2), monoclonal | Cell Signaling | Cat.#: 4370 | WB (1:1000) |
| Antibody | Rabbit anti-EAAT1, monoclonal | Cell Signaling | Cat.#: 5684 | WB (1:1000) |
| Antibody | Rabbit anti-EAAT2, polyclonal | Cell Signaling | Cat.#: 3838 | WB (1:1000) |
| Antibody | Rabbit anti-EAAT3, monoclonal | Cell Signaling | Cat.#: 14501 | WB (1:1000) |
| Antibody | Rabbit anti-β-tubulin (HRP conjugated), monoclonal | Cell Signaling | Cat.#: 5346 | WB (1:1000) |
| Antibody | Mouse anti-SDHA, monoclonal | Santa Cruz Biotechnology | Cat.#: sc-166909, RRID:AB_10611174 | WB (1:500) |
| Antibody | Mouse anti- Cytochrome c, monoclonal | Santa Cruz Biotechnology | Cat.#: sc-13156, RRID:AB_627381 | WB (1:1000) |
| Antibody | Mouse anti-ATP5A, monoclonal | Santa Cruz Biotechnology | Cat.#: sc-136178 | WB (1:500) |
| Antibody | Mouse anti-Mfn1, monoclonal | Invitrogen | Cat.#: MA5-24789, RRID:AB_2717262 | WB (1:1000) |
| Antibody | Rabbit anti-SLC7A11, polyclonal | Invitrogen | Cat.#: PA1-16893, RRID:AB_2286208 | WB (1:1000) |
| Antibody | Mouse anti-PDH, monoclonal | Invitrogen | Cat.#: 459400, RRID:AB_2532238 | WB (1:1000) |
| Antibody | Goat anti-Rabbit | LiCor | Cat.#: 926–80011, RRID:AB_2721264 | WB (1:5000) |
| Antibody | Goat anti-Mouse | LiCor | Cat.#: 926–80010 | WB (1:5000) |
| Sequence-based reagent | Mfn2 siRNA | Intergrated DNA Technologies | TriFECTa DsiRNA Kit | |
| Commercial assay or kit | CyQUANT proliferation assay | Thermo Fisher | Cat.#: C7026 | |
| Commercial assay or kit | BCA protein assay | Thermo Fisher | Cat.#: 23225 | |
| Commercial assay or kit | NovaQUANT mouse mitochondrial to nuclear DNA ratio kit | Millipore Sigma | Cat.#: 72621 | |
| Commercial assay or kit | ATP luminescence detection assay kit | Cayman Chemical | Cat.#: 700410 | |
| Commercial assay or kit | DCFDA assay | Cayman Chemical | Cat.#: 601520 |
Additional files
-
Transparent reporting form
- https://doi.org/10.7554/eLife.41351.026
Download links
A two-part list of links to download the article, or parts of the article, in various formats.
Downloads (link to download the article as PDF)
Open citations (links to open the citations from this article in various online reference manager services)
Cite this article (links to download the citations from this article in formats compatible with various reference manager tools)
Mitochondrial fusion supports increased oxidative phosphorylation during cell proliferation
eLife 8:e41351.
https://doi.org/10.7554/eLife.41351


