Pat1 promotes processing body assembly by enhancing the phase separation of the DEAD-box ATPase Dhh1 and RNA
- ETH Zurich, Switzerland
- University of California, Berkeley, United States
Figures
Figure 1 with 1 supplement
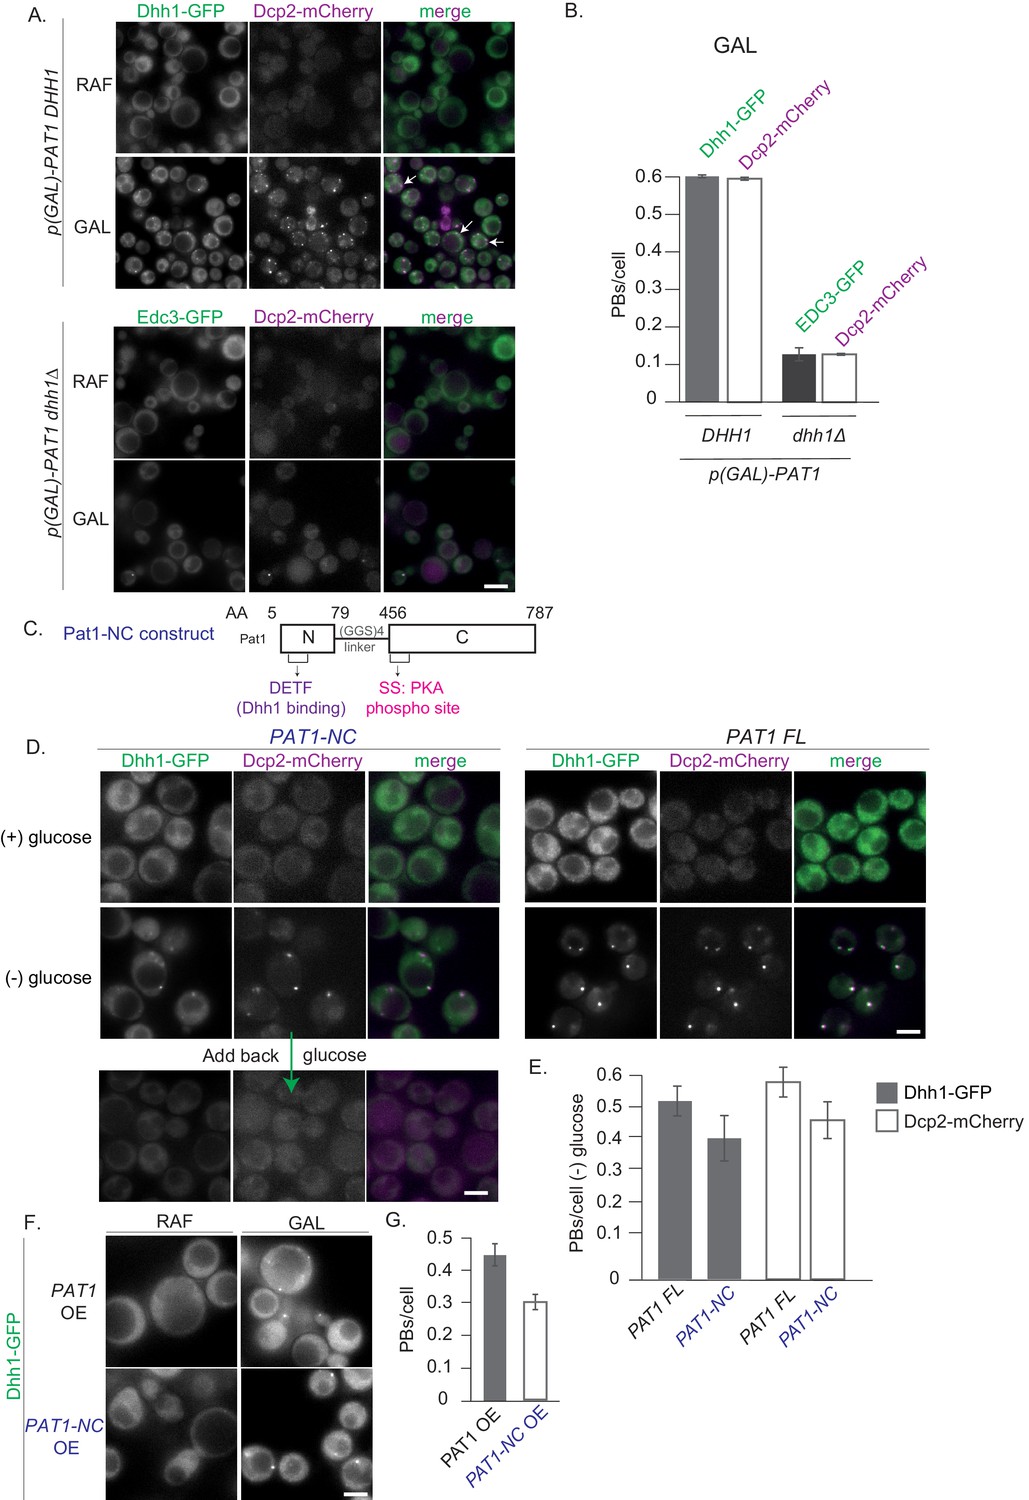
Constitutive PB formation upon Pat1 overexpression is Dhh1 dependent.
(A) Overexpression (OE) of Pat1 leads to constitutive PB formation but only in the presence of Dhh1. Cells co-expressing the indicated PB components were grown in synthetic complete (SC) raffinose media to exponential growth phase after which Pat1 was overexpressed via addition of galactose. Cells in both raffinose and galactose were observed by fluorescence microscopy. In all Pat1 OE strains the endogenous promoter of Pat1 was replaced by the galactose 1–10 promoter (p-GAL-PAT1). Scale bar: 5 µm. (B) Quantification of images in A depicting number of PBs/cell. N = 3 biological replicates with >800 cells/replicate. Error bars: SEM. (C) Pat1-NC (AA 5–79 + 456–587) is functional in vivo. Cartoon of the Pat1-NC construct (see text for details). (D) PAT1-NC induces PB formation upon stress in vivo. Cells co-expressing the indicated the PB components in PAT1 full length or PAT1-NC background were grown in synthetic complete (SCD) media to exponential growth phase then shifted to glucose-rich or glucose-starvation conditions for 30 min and observed by fluorescence microscopy. PBs induced in the PAT1-NC background were dissolved by addition of 2% glucose demonstrating reversibility. Scale bar: 5 µm. (E) Quantification of images shown in A depicting number of PBs/cell. Bars: SEM. N = 3 biological replicates with >800 cells/replicate. (F) PAT1-NC (AA 5–79 + 456–587) OE leads to constitutive PB induction. p(GAL)-PAT1 or p(GAL)-PAT1-NC cells expressing Dhh1-GFP were grown in SC raffinose media to exponential growth phase after which Pat1 OE was induced with galactose. Scale bar: 5 µm. (G) Graph depicts Dhh1 PBs/cell, SEM. N = 3 biological replicates with >800 cells/replicate. [Diatrack 3.05 and cell segmentation using in house Matlab code was used for the quantification of PB and cell numbers respectively for all the experiments shown in the manuscript].
Figure 1—figure supplement 1
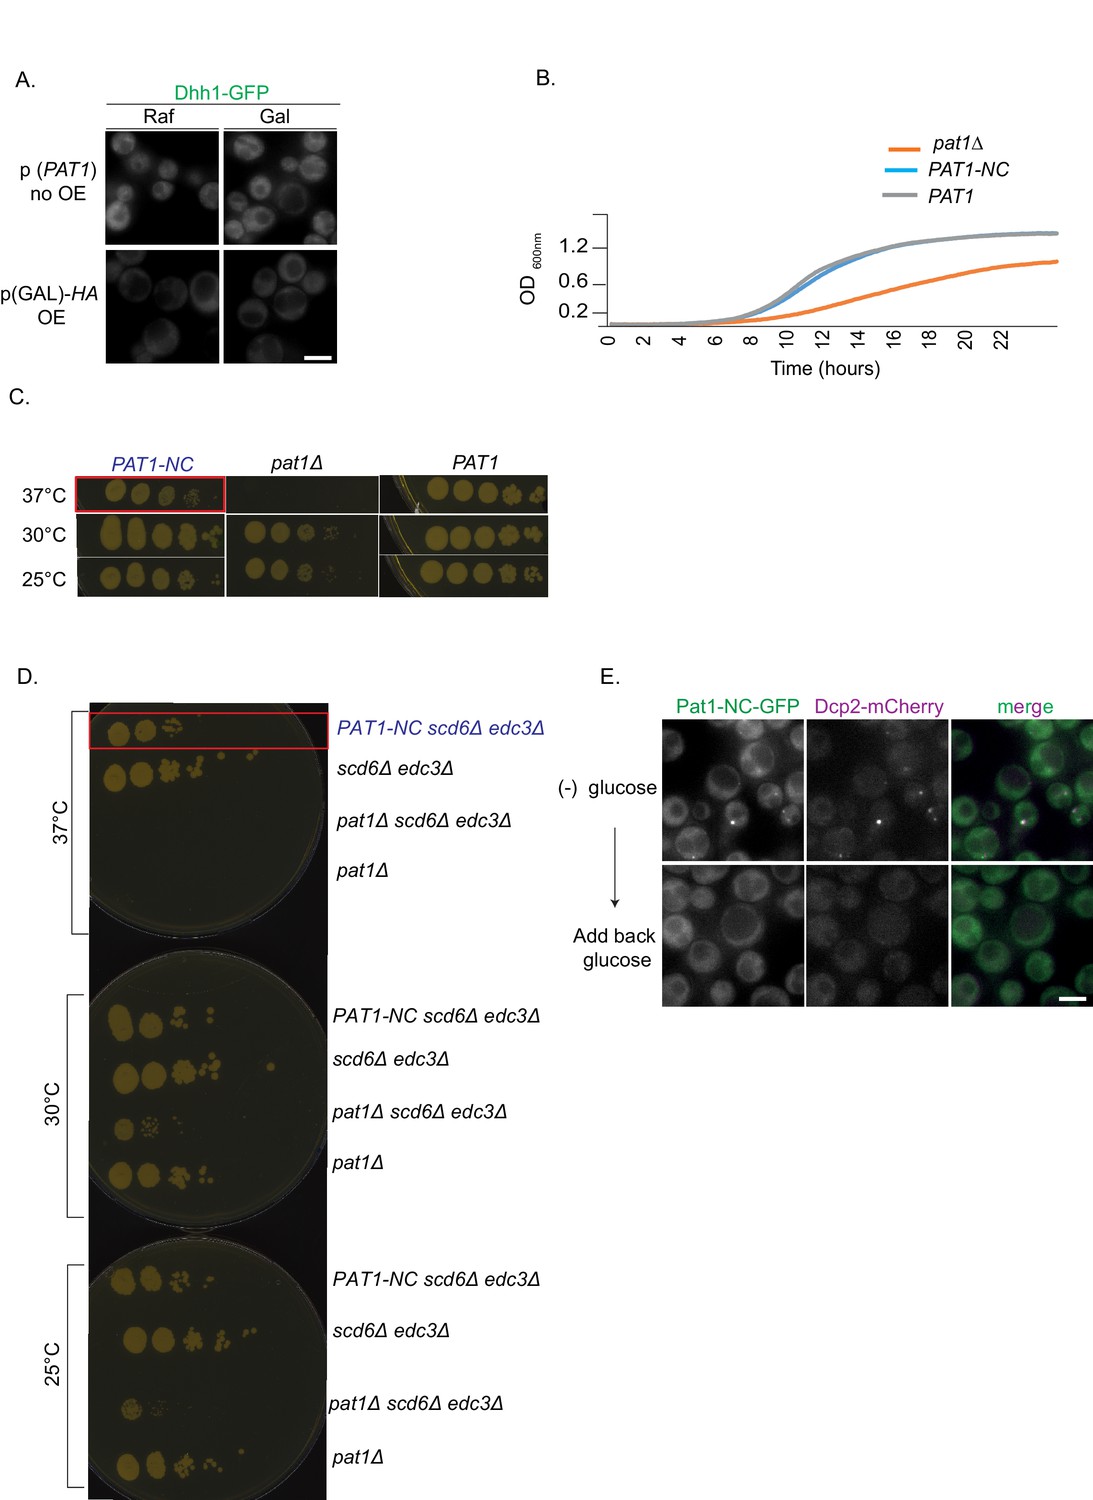
Controls for Pat1 OE related to Figure 1 and growth rescue experiments of Pat1-NC.
(A) Controls for the Pat1 OE, relating to Figure 1. Upper panel: PAT1 (endogenous promoter) cells expressing Dhh1-GFP were grown in (SC) raffinose media to exponential growth phase after which galactose was added and cells were imaged by fluorescence microscopy. Lower Panel: p(GAL)-HA pat1Δ (Hemagglutinin tag) OE does not lead to constitutive PB formation. Scale bar: 5 µm. (B) PAT1-NC rescues the pat1Δ growth phenotype. PAT1, pat1Δ and PAT1-NC cells were grown overnight in SCD media to saturation and the next day the different strains were inoculated to OD 0.1 in SCD. Absorbance based growth measurements were recorded for 24 hrs. The growth curve depicts O.D. 600 nm versus time. (C) PAT1-NC rescues the thermosensitive growth phenotype of pat1Δ. Cells expressing PAT1-NC, PAT1 and cells lacking PAT1 were grown to saturation in SCD media overnight and the next day spotted on YPD plates at the indicated temperatures. Growth was monitored after 2–3 days of incubation. The phenotype was confirmed with three biological replicates. (D) PAT1-NC fully rescues the growth phenotype in pat1Δ edc3Δ scd6Δ cells at 37°C. Cells expressing PAT1 edc3Δ scd6Δ, pat1Δ edc3Δ scd6Δ and PAT1-NC edc3Δ scd6Δ were grown to saturation in SCD media overnight and the next day spotted on YPD plates at the indicated temperatures. Growth was monitored after 2–3 days of incubation. The phenotype was confirmed with three biological replicates. (E) Pat1-NC localizes to PBs upon stress in vivo. Cells co-expressing Pat1-NC-GFP and Dcp2-mCherry as an additional PB marker were grown in SCD media to exponential growth phase then shifted to glucose-rich or glucose-starvation conditions for 30 min and observed by fluorescence microscopy. After visualization 2% final concentration of glucose was added for one hour to demonstrate reversibility and dissolution of Pat1-NC PBs. Scale bar: 5 µm.
Figure 2 with 1 supplement
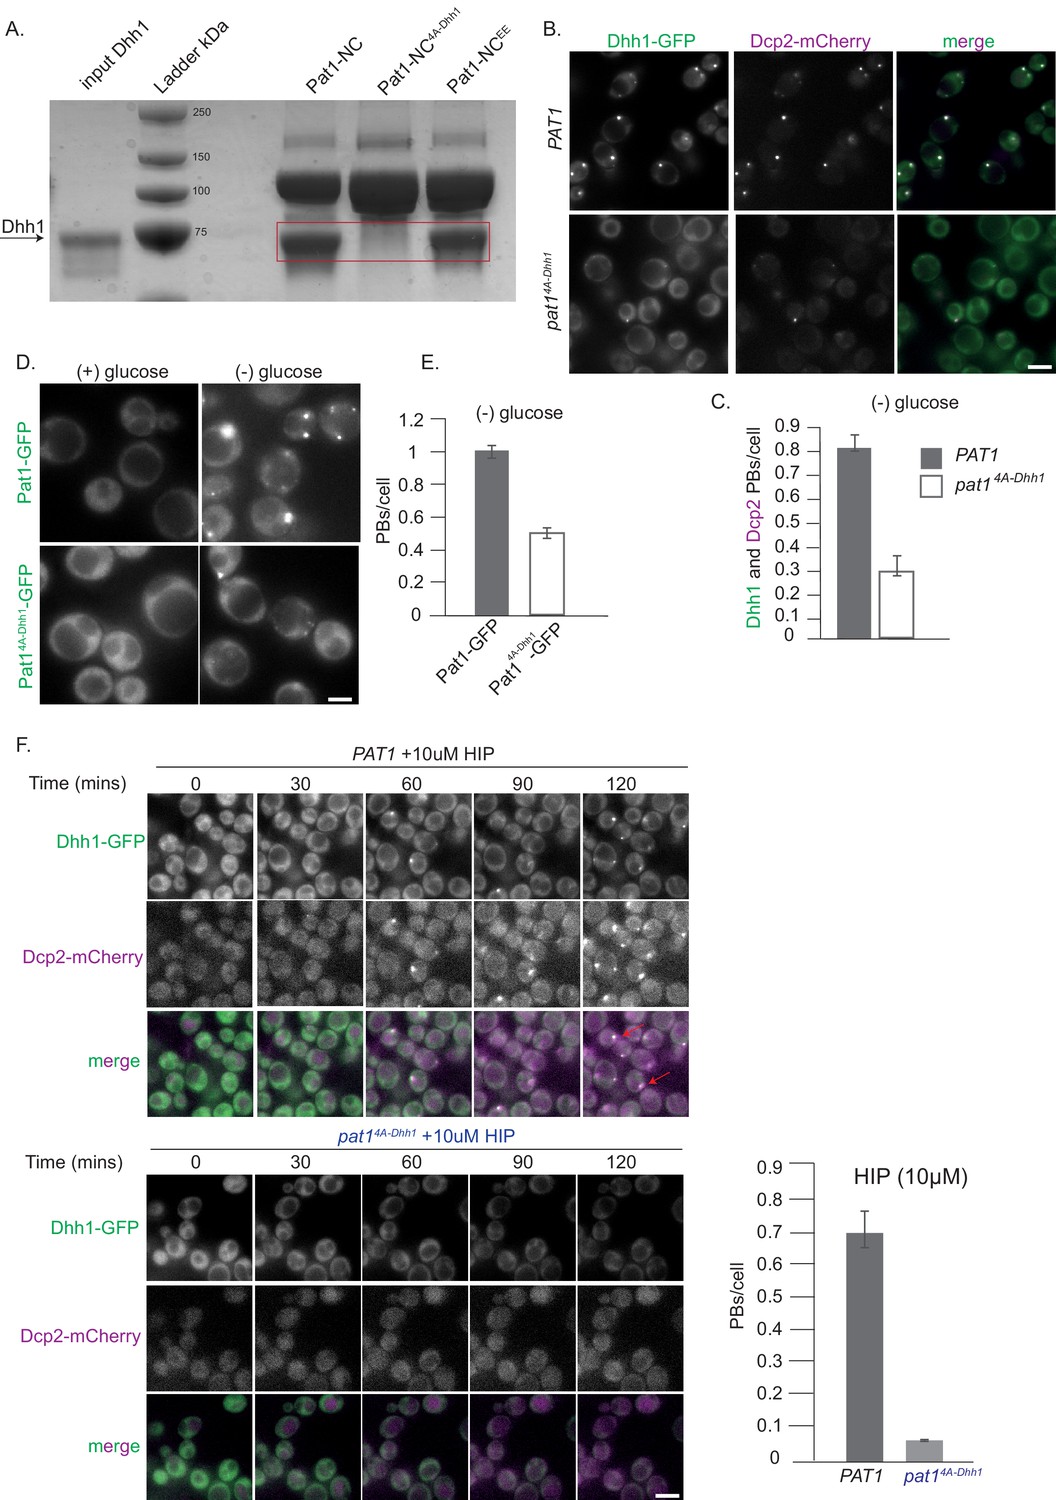
Pat1-Dhh1 interaction is essential for PB assembly.
(A) Recombinant Pat1-NC4A-Dhh1 is defective for Dhh1 binding. GST pull-down with GST-Pat1-NC and mutants thereof as matrix-bound bait and Dhh1 as prey. After 1 hr of binding at 4°C, the samples were washed five times with a buffer containing 300 mM NaCl and visualized by Coomassie staining after separation on a 12% acrylamide gel. (B) Expression of pat1 4A-Dhh1 (Dhh1 binding mutant) leads to a drastic reduction in PB formation. Cells co-expressing the indicated PB components in the PAT1 or pat14A-Dhh1 background were grown in SCD media to exponential growth phase, then shifted to glucose-rich or glucose-starvation conditions for 30 min and observed by fluorescence microscopy. Scale bar: 5 µm. (C) Quantification of images in B depicting number of PBs/cell, (Dhh1-GFP PBs co-localizing with Dcp2-mCherry) are shown, three biological replicates, bars: SEM. (D) Pat14A-Dhh1-GFP mutant is defective for PB localization. Cells expressing either Pat1-GFP or the Pat14A-Dhh1-GFP mutant were grown in SCD media to exponential growth phase then shifted to glucose-rich or glucose-starvation conditions for 30 min and observed by fluorescence microscopy. Scale bar: 5 µm. (E) Quantification of images shown in D depicting number of PBs/cell. N = 3 biological replicates with >500 cells/replicate. Error bars: SEM. (F) pat14A-Dhh1 mutant is defective in PB formation upon hippuristanol treatment. Cells expressing either PAT1 or the pat14A-Dhh1 were grown in SCD media to exponential growth phase after which they were treated with 10 µM hippuristanol for 2 hrs. The kinetics of PB formation was monitored using Dhh1-GFP and its co-localization with Dcp2-mCherry. Quantification of PBs/cell is depicted. Stills from the live imaging time course are shown. N = 2 biological replicates, two technical replicates each with >300 cells/replicate, SD.
Figure 2—figure supplement 1
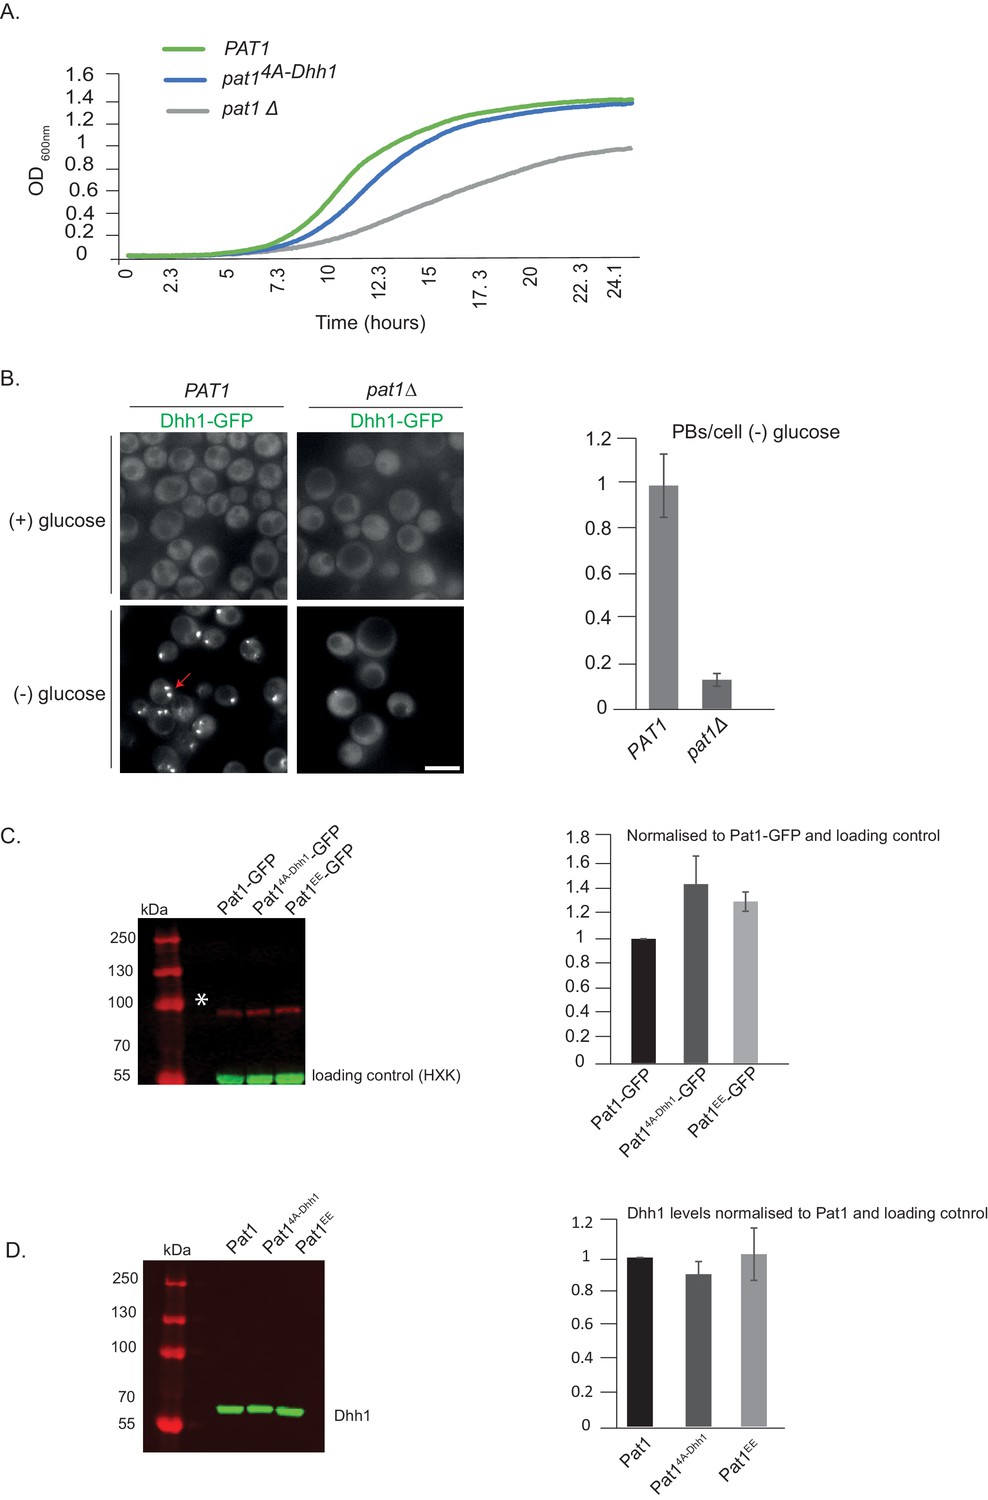
Expression levels of various Pat1 mutants used in this study and their growth phenotypes.
(A) pat14A-Dhh1 mutant has a slight growth defect. PAT1, pat1Δ and pat14A-Dhh1 cells were grown overnight in SCD media to saturation and the next day the different strains were inoculated to OD 0.1 and growth curves were recorded for 24 hr. The growth curve depicts O.D. 600 nm versus time. (B) pat1Δ abolishes PB formation. Cells expressing Dhh1-GFP in pat1Δ or PAT1 strains were grown in SCD media to exponential growth phase then shifted to glucose-rich or glucose-starvation conditions for 30 min and observed by fluorescence microscopy. The graph depicts the number of PBs/cell. N = 2 biological replicates, 300 cells per replicate, SD. (C) Pat14A-Dhh1 and Pat1EE are expressed to similar levels as wild-type Pat1. Pat1-GFP, Pat14A-Dhh1–GFP and Pat1EE-GFP expressing cells were grown in SCD media to exponential growth phase and protein levels were measured using Western blot with an anti-GFP antibody. Hexokinase was used as a loading control. The graph depicts the expression levels of different Pat1 mutants normalized to the loading control. N = 2 biological replicates. SD shown. (D) Dhh1 expression in different Pat1 mutants is comparable to Dhh1 expression in wild-type Pat1. Pat1-GFP, Pat14A-Dhh1–GFP and Pat1EE-GFP expressing cells were grown in SCD media to exponential growth phase and Dhh1 protein levels were measured using Western blot with an anti-Dhh1 antibody. A non-specific band detected by the antibody was used as an internal control. The graph depicts the expression levels of Dhh1 in Pat1 mutants normalized to the internal control. N = 2 biological replicates. SD shown.
Figure 3 with 1 supplement

Dhh1R295D and Dhh1S292DN294D (Pat1 binding mutants) are defective in PB formation.
(A) Expression of two distinct Pat1 binding mutants, Dhh1R295D and Dhh1S292DN294D, leads to a drastic reduction in PB formation. Cells co-expressing the indicated PB components in either Dhh1, Dhh1R295D or Dhh1S292DN294D cells were grown in SCD media to exponential growth phase, then shifted to glucose-rich or glucose-starvation conditions for 30 min and observed by fluorescence microscopy. Scale bar: 5 µm. (B) Quantification of images in A depicting number of Dhh1 positive and Dcp2 positive PBs/cell; N = 4 biological replicates with >300 cells/replicate, SEM. (C) Dhh1R295D and Dhh1S292DN294D mutants are defective in PB formation upon hippuristanol treatment. Cells expressing either Dhh1, Dhh1R295D, Dhh1S292DN294D or dhh1Δ, were grown in SCD media to exponential growth phase after which they were treated with 10 µM hippuristanol for 3 hrs. The kinetics of PB formation was monitored using Dhh1-GFP and its co-localization with Dcp2-mCherry. (D) Quantification of PBs/cell. Stills from the live imaging time course are shown. N = 3 biological replicates with >300 cells/replicate, SEM.
Figure 3—figure supplement 1
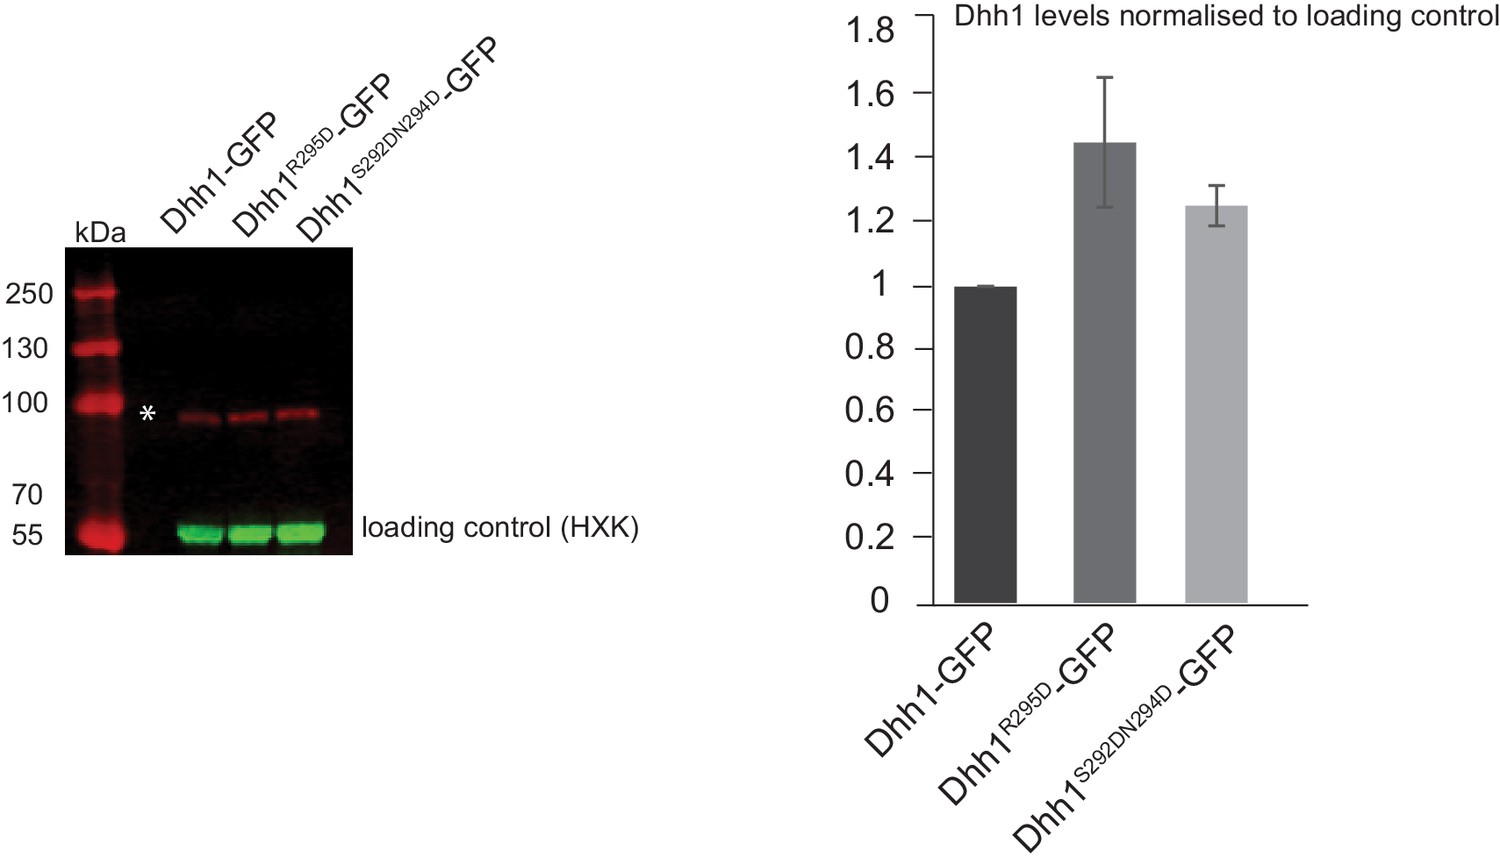
Dhh1 mutants that abolish Pat1 binding are expressed at similar levels to wild-type Dhh1.
Dhh1-GFP, Dhh1R295D–GFP and Dhh11S292DN294D-GFP expressing cells were grown in SCD media to exponential growth phase and protein levels were measured using Western blot with an anti-GFP antibody. Hexokinase was used as a loading control. The graph depicts the expression levels of different Dhh1 mutants normalized to the loading control. N = 2 biological replicates. SD shown.
Figure 4 with 1 supplement
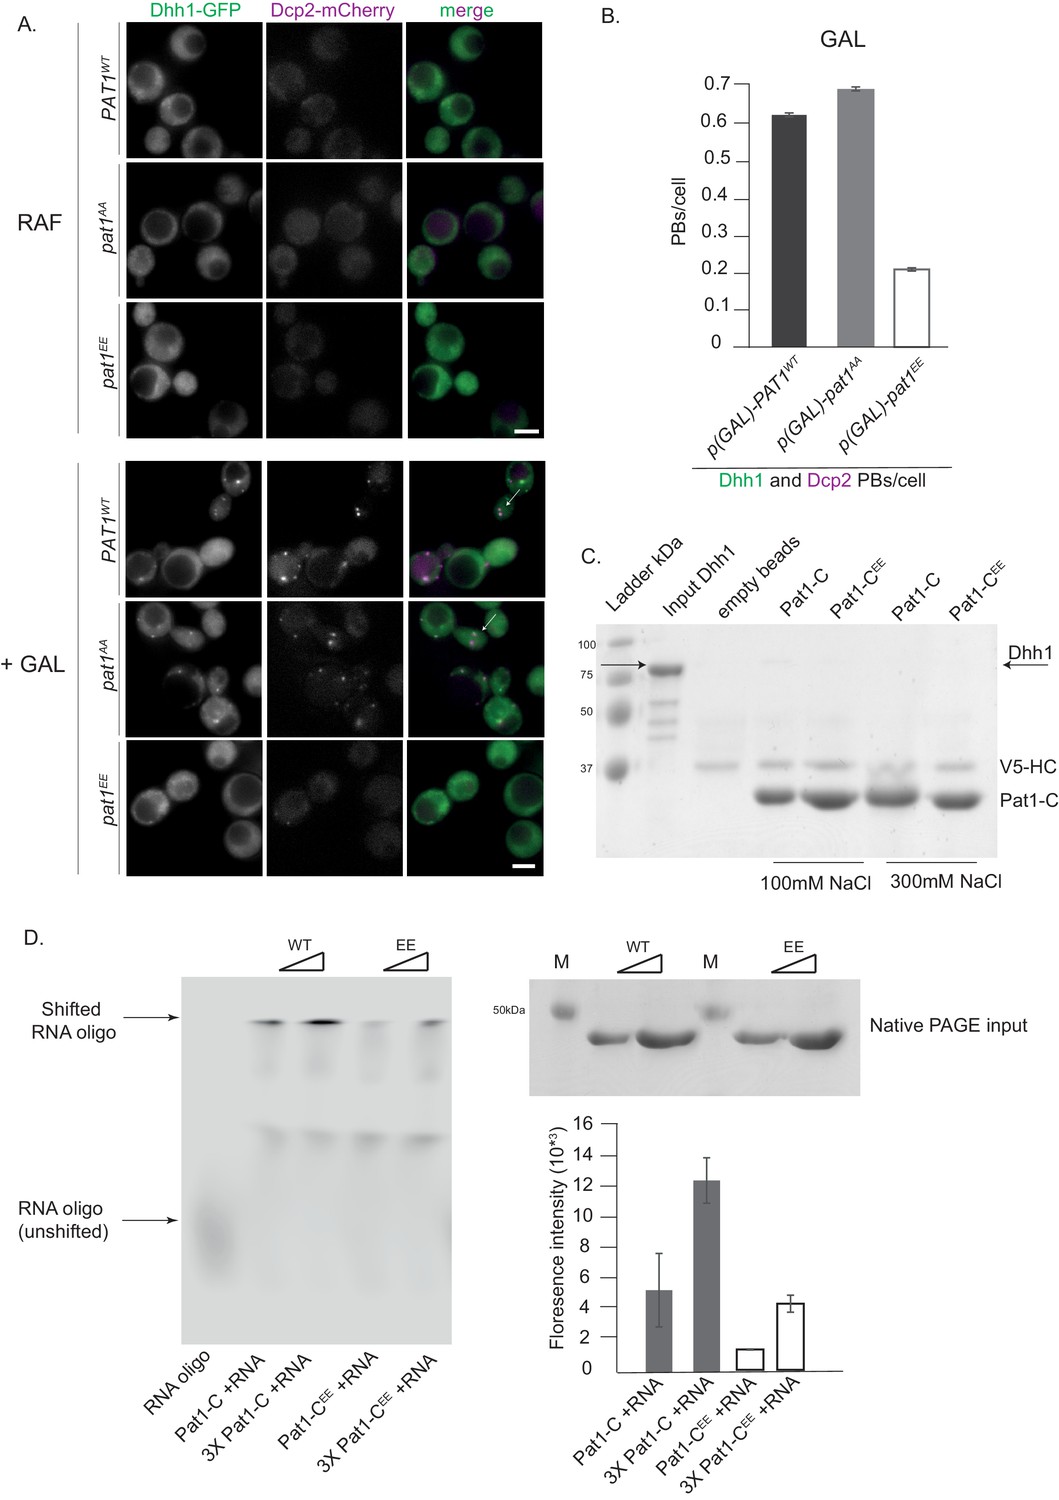
Overexpression (OE) of PAT1WT (wild-type) and pat1AA (non- phosphorylatable) leads to constitutive PB formation but OE of pat1EE (phospho-mimetic) does not and the Pat1-CEE mutant weakens Pat1-RNA binding.
(A) Cells co-expressing the indicated PB components were grown in SC raffinose media to exponential growth phase after which OE of different Pat1 alleles was induced by galactose addition. Cells were imaged using fluorescence microscopy. (B) Quantification of images shown in A depicting number of PBs/cell. Scale bar: 5 µm, SEM. N = 3 biological replicates with >800 cells/replicate. (C) Pat1-C-terminal domain does not bind Dhh1. V5 pull-down with V5-Pat1-C and V5-Pat1-CEE as matrix-bound bait and Dhh1-mCherry as prey. After 1 hr of binding at 4°C, the samples were washed four times with a buffer containing NaCl as indicated and visualized by Coomassie staining after separation on a 12% acrylamide gel. (D) Pat1-CEE weakens the interaction with RNA compared to Pat1-C. Recombinant Pat1-C (WT) and Pat1-CEE were incubated with a Cy5-labeld 29nt RNA oligo in the presence of 300 mM NaCl and separated on a NativePage gradient gel. The fluorescence of the oligo was detected by LI-COR imaging. Reactions were performed in triplicate and the intensity of the upper shifted RNA oligo band was quantified. Equal input of the Pat1-C proteins was verified by acrylamide PAGE and Coomassie staining. Error bars: SD.
Figure 4—figure supplement 1
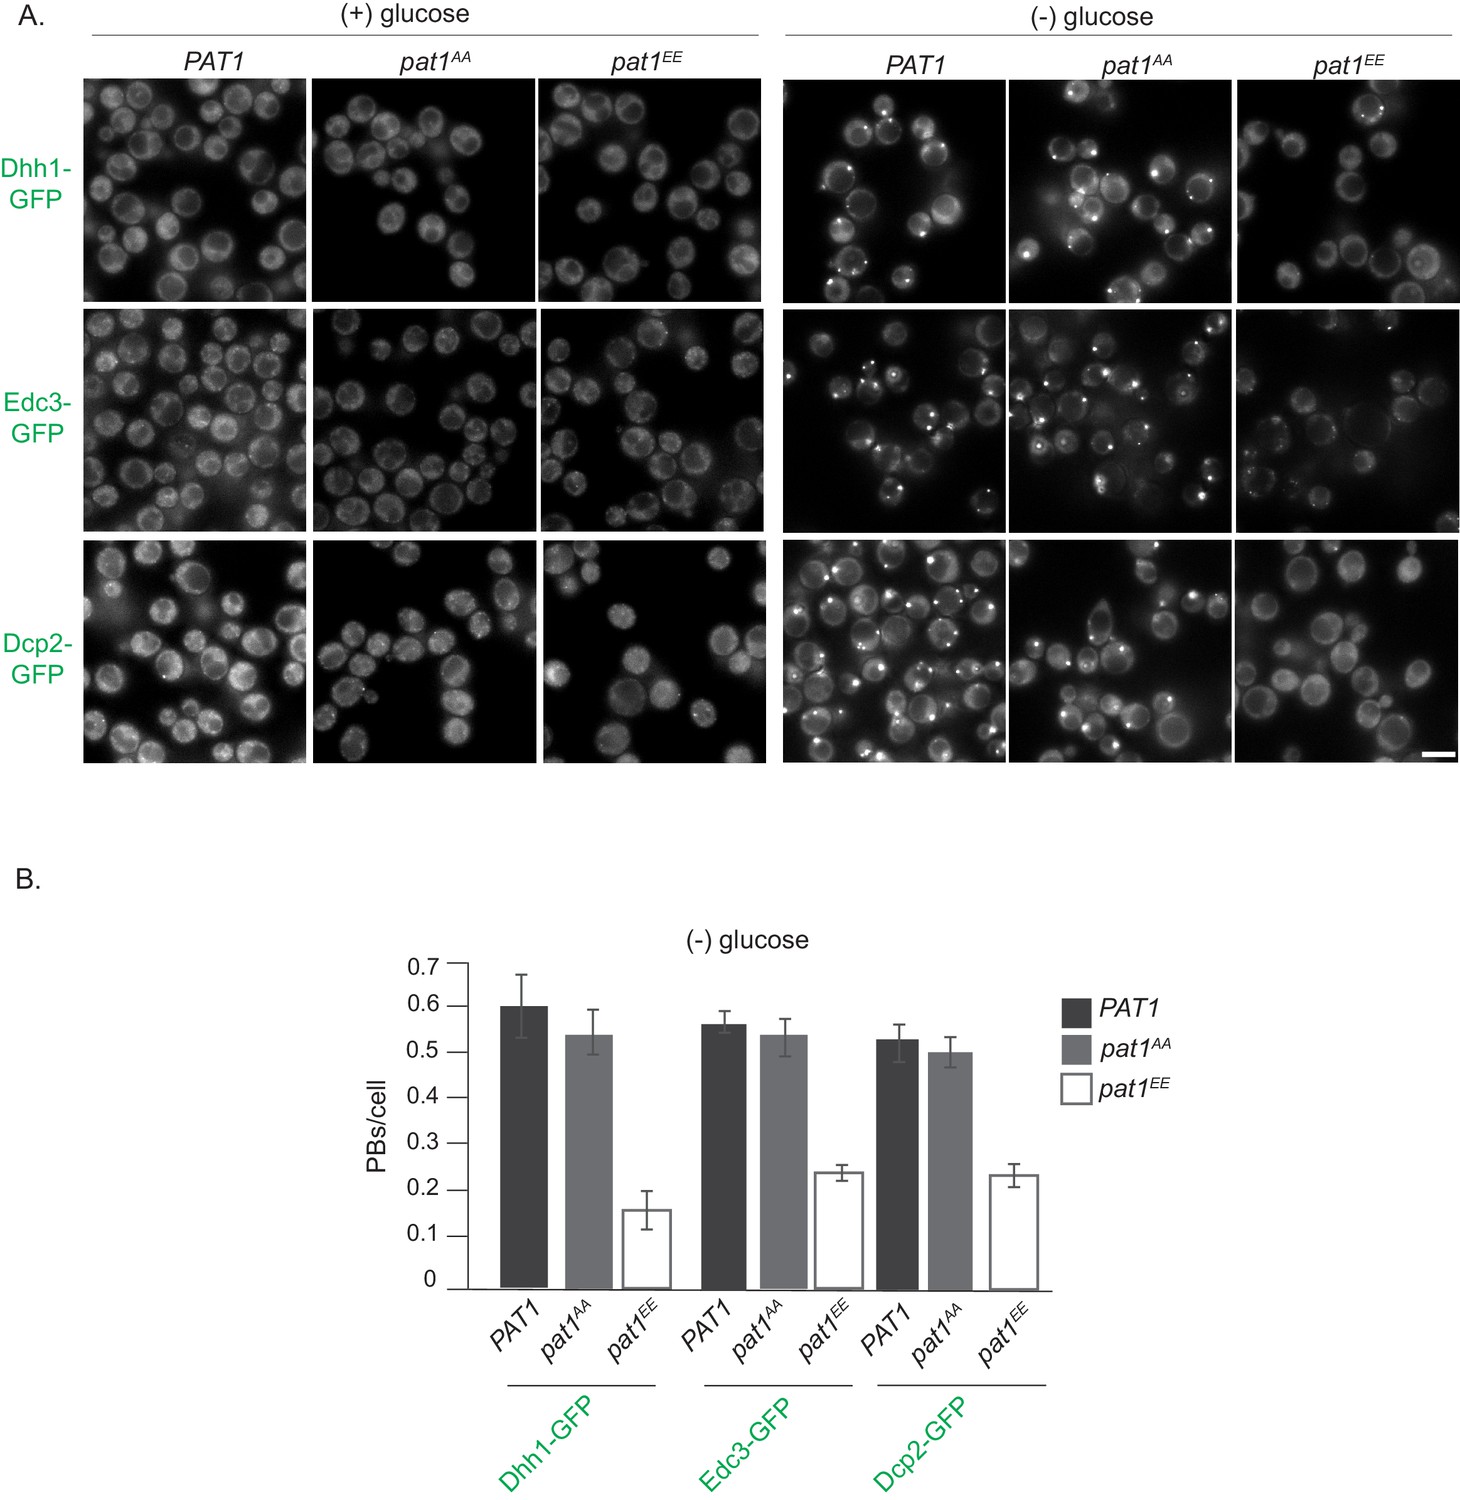
PAT1 and pat1AA lead to PB induction upon stress, which is drastically reduced in the pat1EE background.
(A) Cells expressing the indicated GFP-PB markers (in the PAT1WT/SS, pat1AA and pat1EE backgrounds) were grown in SCD media to exponential growth phase then shifted to glucose-rich (left panel) or glucose-starvation conditions (right panel) for 30 min and observed by fluorescence microscopy. Scale bar: 5 µm. (B) Quantification of images shown in A depicting PBs/cell. Bars: SEM, N = 3 biological replicates with >800 cells/replicate.
Figure 5
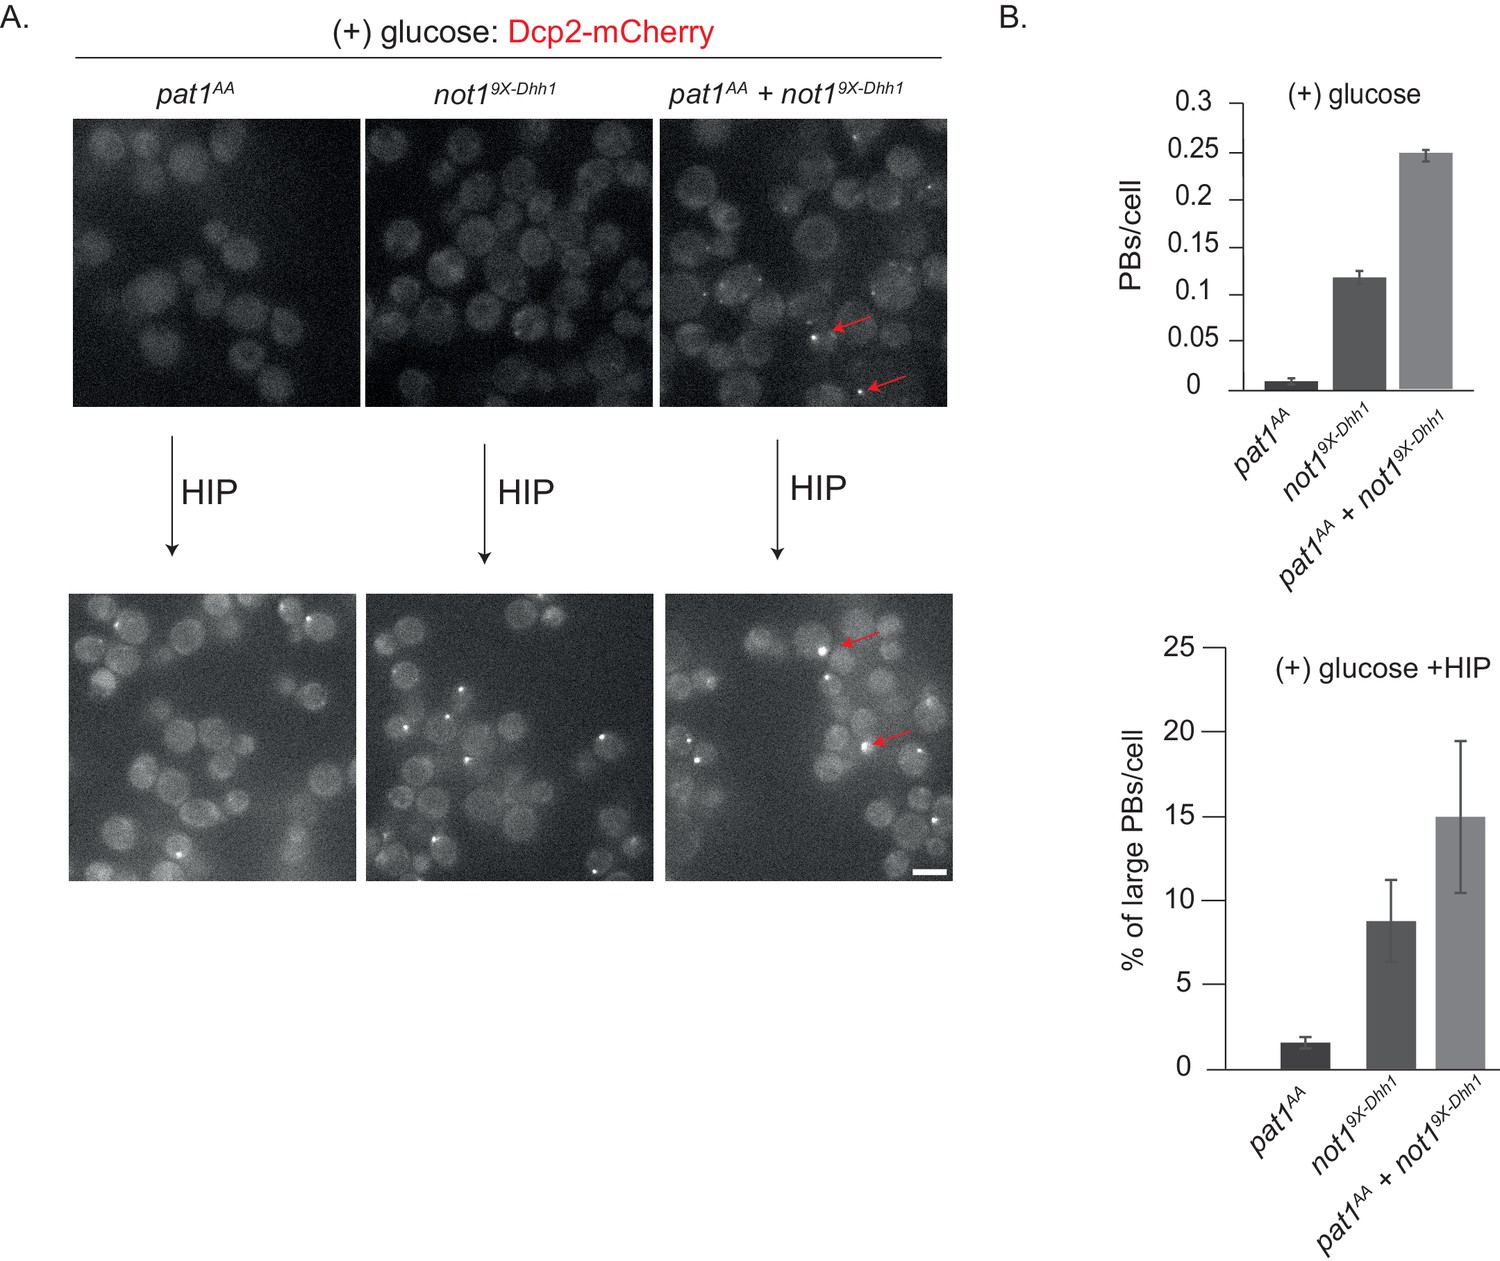
not19X-Dhh1 (Dhh1 binding mutant) combined with pat1AA (non-phosphorylatable Pat1) enhances constitutive PB formation in the absence of stress.
(A) Cells expressing either not19X-Dhh1 or pat1AA or the combination of both mutants were grown in SCD media to exponential growth phase and PBs visualized by fluorescence microscopy using Dcp2-mCherry as a bona fide PB marker. Scale bar: 5 µm. (B) The graph depicts the number of Dcp2 positive PBs/cell. N = 3 biological replicates with >500 cells visualized in each replicate, bars: SEM.
Figure 6 with 2 supplements
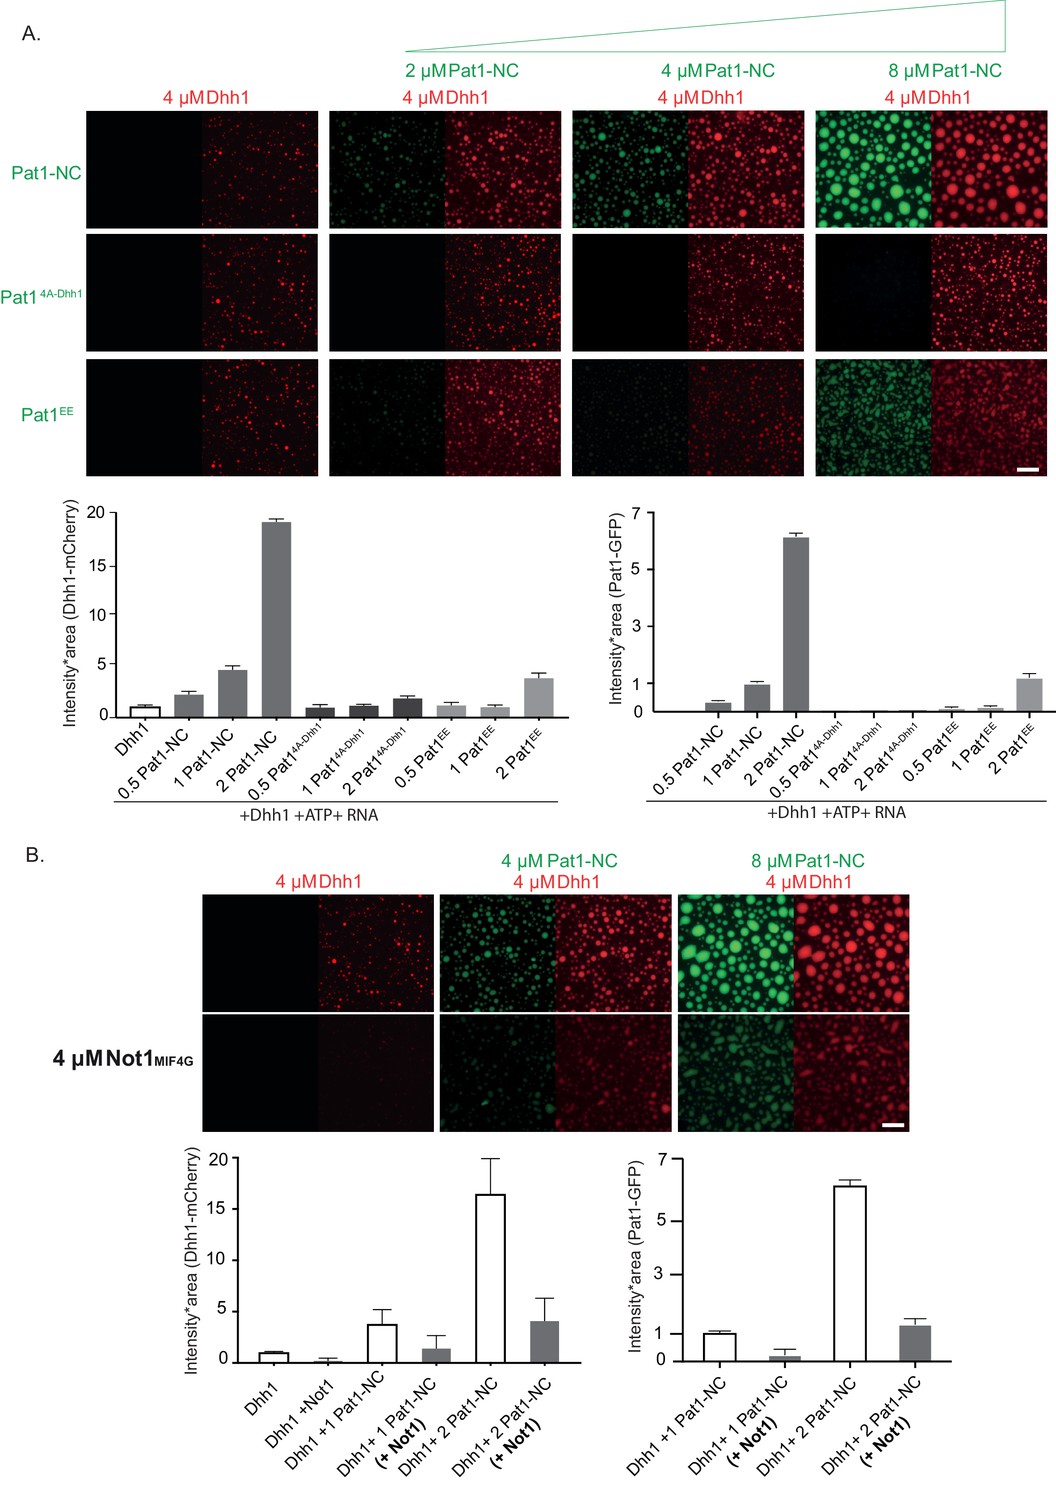
Pat1 WT but not Pat14A-Dhh1/EE mutant enhances the phase separation of Dhh1 and RNA in vitro.
(A) 4 µM Dhh1-mCherry was mixed with 3.2 mM ATP and 0.2 mg/ml polyU as RNA-analog in a 150 mM KCl buffer. Pat1-NC-GFP and mutants thereof were added in increasing concentrations, as indicated. mCherry and GFP intensities are scaled identically in all images displayed. Representative images, scale bar 25 µm. Quantification of the droplet intensity multiplied by area (mCherry and GFP channels separately normalized to Dhh1 alone and Pat1 4 µM, respectively) of three technical replicates of the reactions displayed in Figure 5A, mean and standard deviation. (B) Not1 prevents droplet formation also in the presence of Pat1. Proteins were mixed as indicated, and droplet formation induced by addition of low salt buffer, ATP and polyU. Scale bar 25 mM, quantification (intensity multiplied by area) of two biological replicates (one to three technical replicates each), mean and standard deviation.
Figure 6—figure supplement 1
Pat1 does not slow down the ATPase cycle of Dhh1.
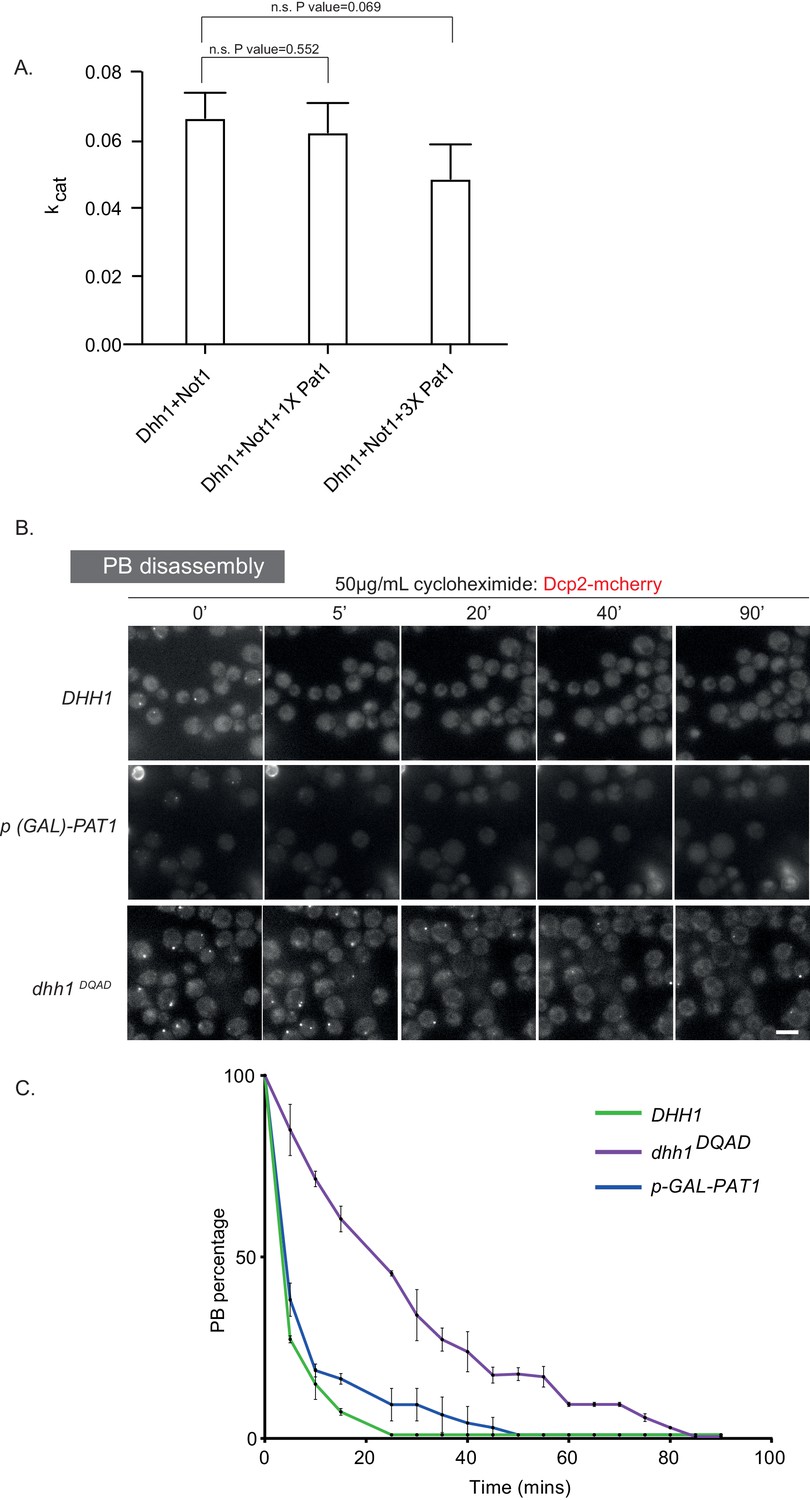
(A) Pat1 does not inhibit the Not1MIF4G-stimulatd ATPase activity of Dhh1. ATPase reactions were performed under saturating concentrations of polyU using a Not1MIF4G concentration that stimulates Dhh1 to 0.75 Vmax. Pat1 was added to either 2- and 6-fold excess over Not1. Three biological replicates (each of three technical replicates); mean and standard deviation of kcat values. The values are corrected for blank (that is Pat1 alone or Not1 alone). P values are obtained from a two-tailed t-test. (B) Pat1 OE PBs are more dynamic than the Dhh1DQAD PBs. Cells expressing Dcp2-mCherry in the p(GAL)-PAT1 OE strain were grown in (SC) raffinose to exponential growth phase after which galactose was added to 2% final concentration for 2 hr to induce PBs. Then the cells were treated with 50 µg/ml cycloheximide (CHX) and disappearance of Dcp2-mCherry PBs per cell was monitored for 90 min by fluorescence microscopy. In order to study PB dynamics in the DHH1 and dhh1 DQAD background cells were grown as described before except PBs were induced by carbon starvation and their disassembly monitored by CHX. Each time point shows a representative image. (C) The graph shows the foci number per cell measurements for Dcp2-mCherry normalized to one to account for differences in PB formation under different PB induction conditions. Scale bar: 5 µm. N = 2 biological replicates with >200 cells counted per experiments. Error bars: SD.
Figure 6—figure supplement 2
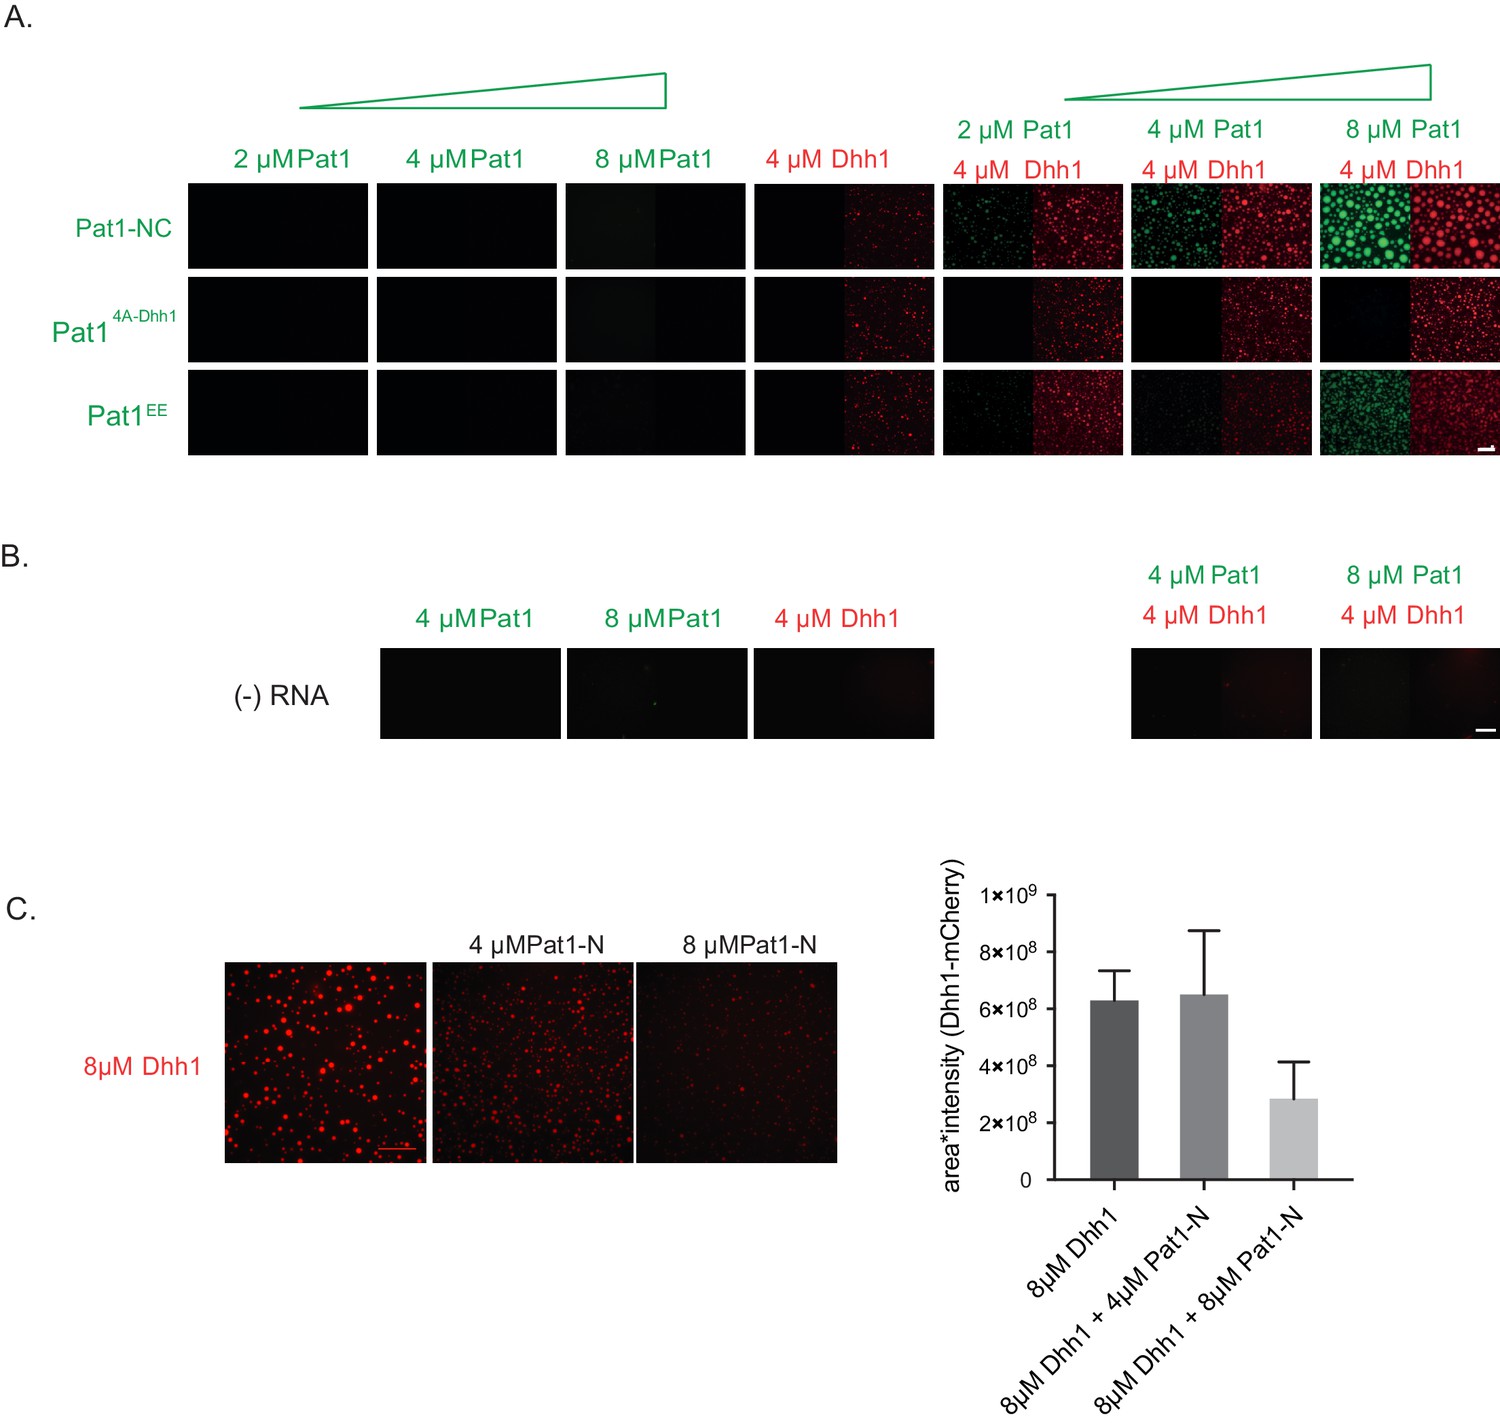
Pat1 does not phase separate in vitro and the enhancement of Dhh1's phase separation via Pat1 is RNA dependent.
(A) Pat1 by itself does not phase separate in vitro. Reactions are performed in the presence of ATP and polyU at indicated protein concentrations. N = three technical replicates. (B) Enhancement of Dhh1’s phase separation by Pat1 is RNA-dependent. Reactions are performed in the presence of ATP but absence of polyU at indicated protein concentrations. N = three technical replicates (C) Pat1-N terminus does not enhance the phase separation of Dhh1. Reactions are performed in the presence of ATP and polyU at indicated protein concentrations. Quantification (intensity multiplied by area of droplets) of three technical replicates, mean and standard deviation.
Figure 7 with 2 supplements

Stoichiometry of Pat1 and Dhh1 in PBs in vivo and in liquid droplets in vitro.
(A) Pat1-GFP and Dhh1-GFP expressing cells were grown in SCD media to exponential growth phase and then shifted to SC (minus glucose) for the indicated time points. PB formation was visualized by fluorescence microscopy. Graph depicts the ratio of Dhh1: Pat1 in PBs in vivo. N = 3 biological replicates, SEM. (B) Calibration curves to determine the protein concentration of Dhh1-mCherry and Pat1-NC-GFP within the droplets: the fluorescence intensity of homogeneous solutions of the respective proteins was measured at different protein concentrations (blue circles). The unknown protein concentration was determined by linear fitting of this calibration curve (violet circle). Confocal fluorescence microscopy images of phase-separated droplets of Dhh1-mCherry in the absence and presence of Pat1-GFP are shown. Scale bar: 20 µM. (C) Tug-of-war model between Pat1 and Not1 to regulate PB dynamics. Model depicting three inputs that cooperatively regulate PB formation. The solid black arrows on the left show interaction between the Pat1 N-terminus with the RecA2 core of Dhh1, Pat1 C-terminus with RNA, Dhh1 interaction with RNA and potential Dhh1-Dhh1 interactions via low-complexity unstructured tails. The dotted grey arrows on the right demonstrate multivalent interactions in a PB driven by the LLPS of Dhh1 and RNA (a process enhanced by Pat1). Colors: green: inputs that promote PB assembly, red factors that negatively regulate PB formation. Violet: Dhh1, light green: Pat1-NC, blue: RNA.
Figure 7—figure supplement 1
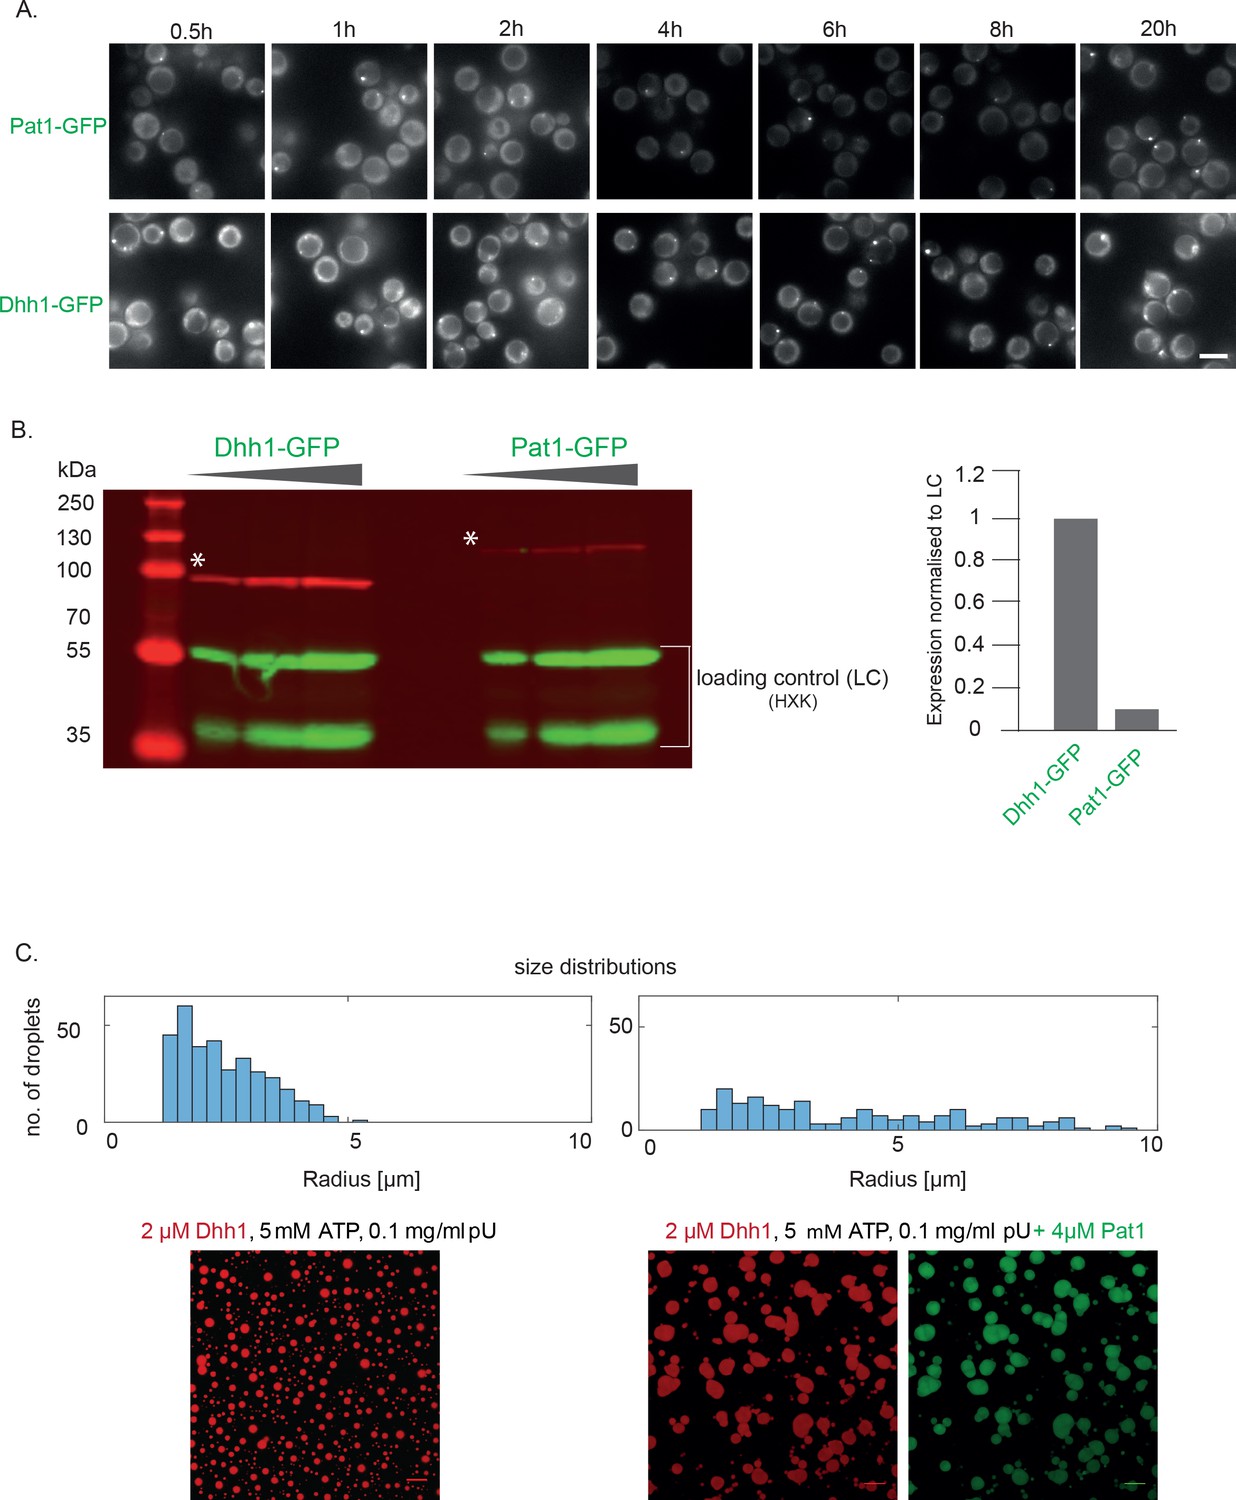
Images and protein expression levels related to stoichiometry of Pat1 and Dhh1 in PBs in vivo and in liquid droplets in vitro.
(A) Images of the Pat1-GFP and Dhh1-GFP stoichiometry. Cells expressing Pat1-GFP and Dhh1-GFP were grown in SCD media to exponential growth phase then shifted to glucose-starvation conditions for different time points as indicated and PBs were imaged by fluorescence microscopy. Images are representative for each times. Scale: 5 µM. (B) Dhh1-GFP and Pat1-GFP expressing cells (used for imaging in A) were grown in SCD media to exponential growth phase and protein levels were measured using Western blot with an anti-GFP antibody. Hexokinase was used as a loading control. The graph depicts the expression levels of Dhh1 and Pat1 normalized to the loading control. (C) Size distributions of in vitro assembled Dhh1 and Pat1 LLPS droplets (relating to Figure 6B). In presence of Pat1, the droplet size increases and the size distribution shifts to larger radii. Moreover, the number of droplets decreases, thereby indicating that the droplets have higher propensity to fuse in presence of Pat1. Scale bar: 20 µm.
Figure 7—figure supplement 2
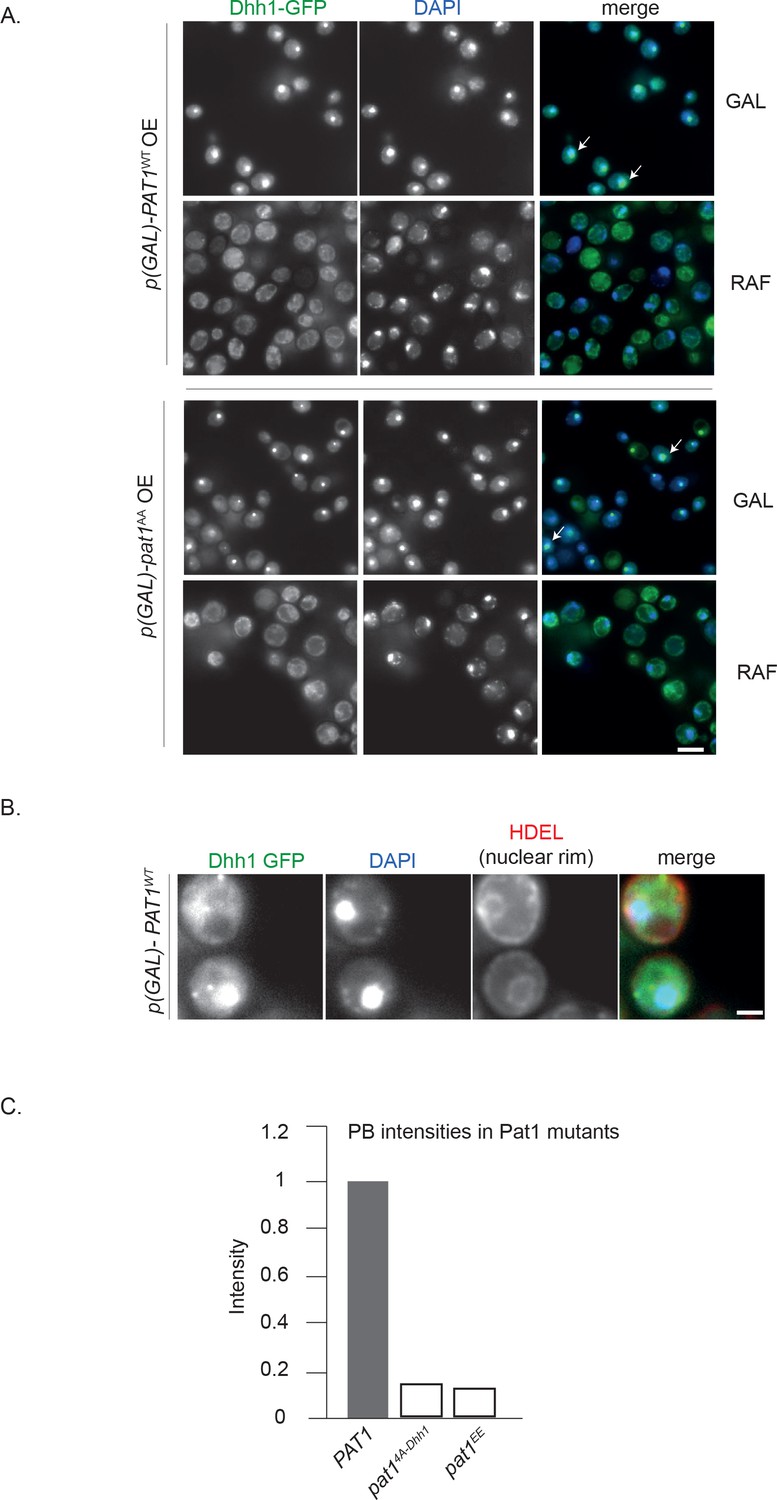
OE of Pat1 in the presence of the endogenous copy of Pat1 [p-PAT1 +p(GAL)-PAT1] leads to the nuclear localization of PB components.
(A) Cells expressing Dhh1-GFP [p-PAT1 +p(GAL)-PAT1 background] were grown in SC raffinose media to exponential growth phase after which Pat1 OE was induced with galactose. Localization of Dhh1-GFP to the nucleus was confirmed by co-localization with DAPI staining after 2 hr of PAT1 or pat1AA OE. White arrows depict the co-localization of Dhh1-GFP and DAPI. Scale bar: 5 µm. N = 2 biological replicates. (B) HDEL Td tomato was used as a marker of the nuclear rim, scale bar: 5 µm. (C) PBs formed in pat14A-Dhh1 and pat1EE expressing cells are less intense than PBs formed in PAT1 wild-type cells. Graph showing the average intensity of PBs (obtained from Figures 2B and 3).
Videos
Video 1
Hippuristanol induces PBs in cells expressing wild-type PAT1.
The video depicts PB formation (Dhh1-GFP and Dcp2-mCherry co-localization) in cells expressing wild-type PAT1 upon hippuristanol treatment. (2 hr video, 5 min intervals; video played at seven fps). Each frame is a single plane.
Video 2
Hippuristanol fails to induce PBs in cells expressing pat14A-Dhh1 mutant.
The video depicts failure to form PBs (Dhh1-GFP and Dcp2-mCherry co-localization) in cells expressing pat14A-Dhh1 upon hippuristanol treatment. (2 hr video, 5 min intervals; video played at seven fps). Each frame is a single plane.
Video 3
Hippuristanol induces PBs in cells expressing wild-type Dhh1.
The video depicts PB formation (Dhh1-GFP and Dcp2-mCherry co-localization) in cells expressing wild-type Dhh1 upon hippuristanol treatment. (3 hr video, 5 min intervals; video played at seven fps). Each frame is a single plane.
Video 4
Hippuristanol does not induce PBs in cells expressing the Dhh1S292DN294D mutant.
The video depicts PB formation (Dhh1S292DN294D -GFP and Dcp2-mCherry co-localization) in cells expressing the Dhh1S292DN294D mutant upon hippuristanol treatment. (3 hr video, 5 min intervals; video played at seven fps). Each frame is a single plane.
Video 5
Hippuristanol fails to induce PBs in cells expressing the Dhh1R295D mutant.
The video depicts PB formation (Dhh1R295D-GFP and Dcp2-mCherry co-localization) in cells expressing the Dhh1R295D mutant upon hippuristanol treatment. (3 hr video, 5 min intervals; video played at seven fps). Each frame is a single plane.
Video 6
dhh1Δ cells do not form PBs upon hippuristanol treatment.
The video depicts PB formation (Dcp2-mCherry co-localization) in cells lacking dhh1 upon hippuristanol treatment. (3 hr video, 5 min intervals; video played at seven fps). Each frame is a single plane.
Video 7
Cycloheximide treatment causes wild-type PB disassembly.
Dcp2-mCherry expressing cells in the DHH1 background were grown in (SC) raffinose media to exponential growth phase, after which galactose was added to 2% final concentration for 2 hr and then starved for 30 mins to allow PBs to form. The cells were then treated with 50 µg/mL cycloheximide for 90 min and disappearance of foci was monitored using fluorescence microscopy. (5 min intervals; video played at seven fps). Each frame is a single plane.
Video 8
Cycloheximide treatment causes Pat1 OE PB disassembly albeit faster than PB disassembly in cells expressing dhh1 DQAD.
Cells expressing Dcp2-mCherry in the p(GAL)-PAT1 OE strain were grown in (SC) raffinose to exponential growth phase, after which galactose was added to 2% final concentration for 2 hr to allow PBs to form. Thereafter, the cells were treated with 50 µg/mL cycloheximide (CHX) for 90 min and disappearance of foci was monitored using fluorescence microscopy. (5 min intervals; video played at seven fps). Each frame is a single plane.
Video 9
Cycloheximide treatment of dhh1 DQAD PBs.
Dcp2-mCherry expressing cells in the dhh1DQAD mutant background were grown in (SC) raffinose to exponential growth phase, after which galactose was added to 2% final concentration for 2 hr. The cells were then carbon starved for 30 min to allow PBs to form after which, 50 µg/mL cycloheximide was added and disappearance of foci was monitored for 90 mins using fluorescence microscopy. (5 min intervals; video played at seven fps). Each frame is a single plane.
Tables
Key resources table
| Reagent type (species) or resource | Designation | Source or reference | Identifiers | Additional information |
|---|---|---|---|---|
| Strain, strain background (Yeast: Saccharomyces cerevisiae) | W303 | SGD:https://www.yeastgenome.org/strain/S000203491 | KWY XYZ | MATa/MATα {leu2-3,112 trp1-1 can1-100 ura3-1 ade2-1 his3-11,15} [phi+] |
| Strain, strain background (Escherichia coli) | E.Coli DH5α | Thermo Fisher Scientific | 18258012 | |
| Strain, strain background (Escherichia coli) | E.Coli BL21 star (DE3) | Thermo Fisher Scientific | C601003 | |
| Genetic reagent () | Please see Supplementary file 1, 2—S2A | |||
| Antibody | mouse-anti-GFP | Roche | Cat# 11814460001, RRID: AB_390913 | Western blot: 1:1000 |
| Antibody | rabbit-anti-Hxk1 | US Biological | Cat# H2035-01, RRID: AB_2629457, Salem, MA | Western blot: 1:3000 |
| Antibody | IRdye 680RD goat-anti-rabbit | LI-COR Biosciences | Cat# 926–68071, RRID: AB_10956166 | Western blot: 1:5000 |
| Antibody | IRdye 800 donkey-anti-mouse | LI-COR Biosciences | Cat# 926–32212, RRID: AB_621847 | Western blot: 1:10000 |
| Antibody | Rabbit-anti-Dhh1 | in house | #100 | Western blot: 1:5000 |
| Recombinant DNA reagent | Please see Supplementary file 2—table S2B | |||
| Chemical compound, drug | hippuristanol | kind gift from Junichi Tanaka, University of the Ryukyus | hippuristanol | 10 µM in DMSO |
| Chemical compound, drug | cyclohexi | Sigma-Aldrich, CH | CAS Number 66-81-9 | 50 ug/ml in DMSO |
| Software, algorithm | Diatrack | http://www.diatrack.org/ | Diatrack | used for counting PB number and intensity |
| Software | fiji/imagej | NIH | https://fiji.sc/ | adjusting brightness, contrast and making final figures |
Additional files
-
Source code file 1
MATLAB script to count the yeast cell number in an automated manner.
- https://doi.org/10.7554/eLife.41415.026
-
Supplementary file 1
Details regarding all the yeast strains used in this study.
- https://doi.org/10.7554/eLife.41415.027
-
Supplementary file 2
Details regarding the plasmids , mutants and DNA oligos used in this study.
Supplementary table S2A contains all the plasmids used in this study. Table Supplementary S2B contains the mutants used in this study and Table S2C describes the entire DNA oligos used for this manuscript.
- https://doi.org/10.7554/eLife.41415.028
-
Transparent reporting form
- https://doi.org/10.7554/eLife.41415.029
Download links
A two-part list of links to download the article, or parts of the article, in various formats.
Downloads (link to download the article as PDF)
Open citations (links to open the citations from this article in various online reference manager services)
Cite this article (links to download the citations from this article in formats compatible with various reference manager tools)
Pat1 promotes processing body assembly by enhancing the phase separation of the DEAD-box ATPase Dhh1 and RNA
eLife 8:e41415.
https://doi.org/10.7554/eLife.41415


