ASH1-catalyzed H3K36 methylation drives gene repression and marks H3K27me2/3-competent chromatin
- University of Oregon, United States
- Charles University, Czech Republic
- St. George's University School of Medicine, Caribbean
- University of Fukui, Japan
Figures
Figure 1
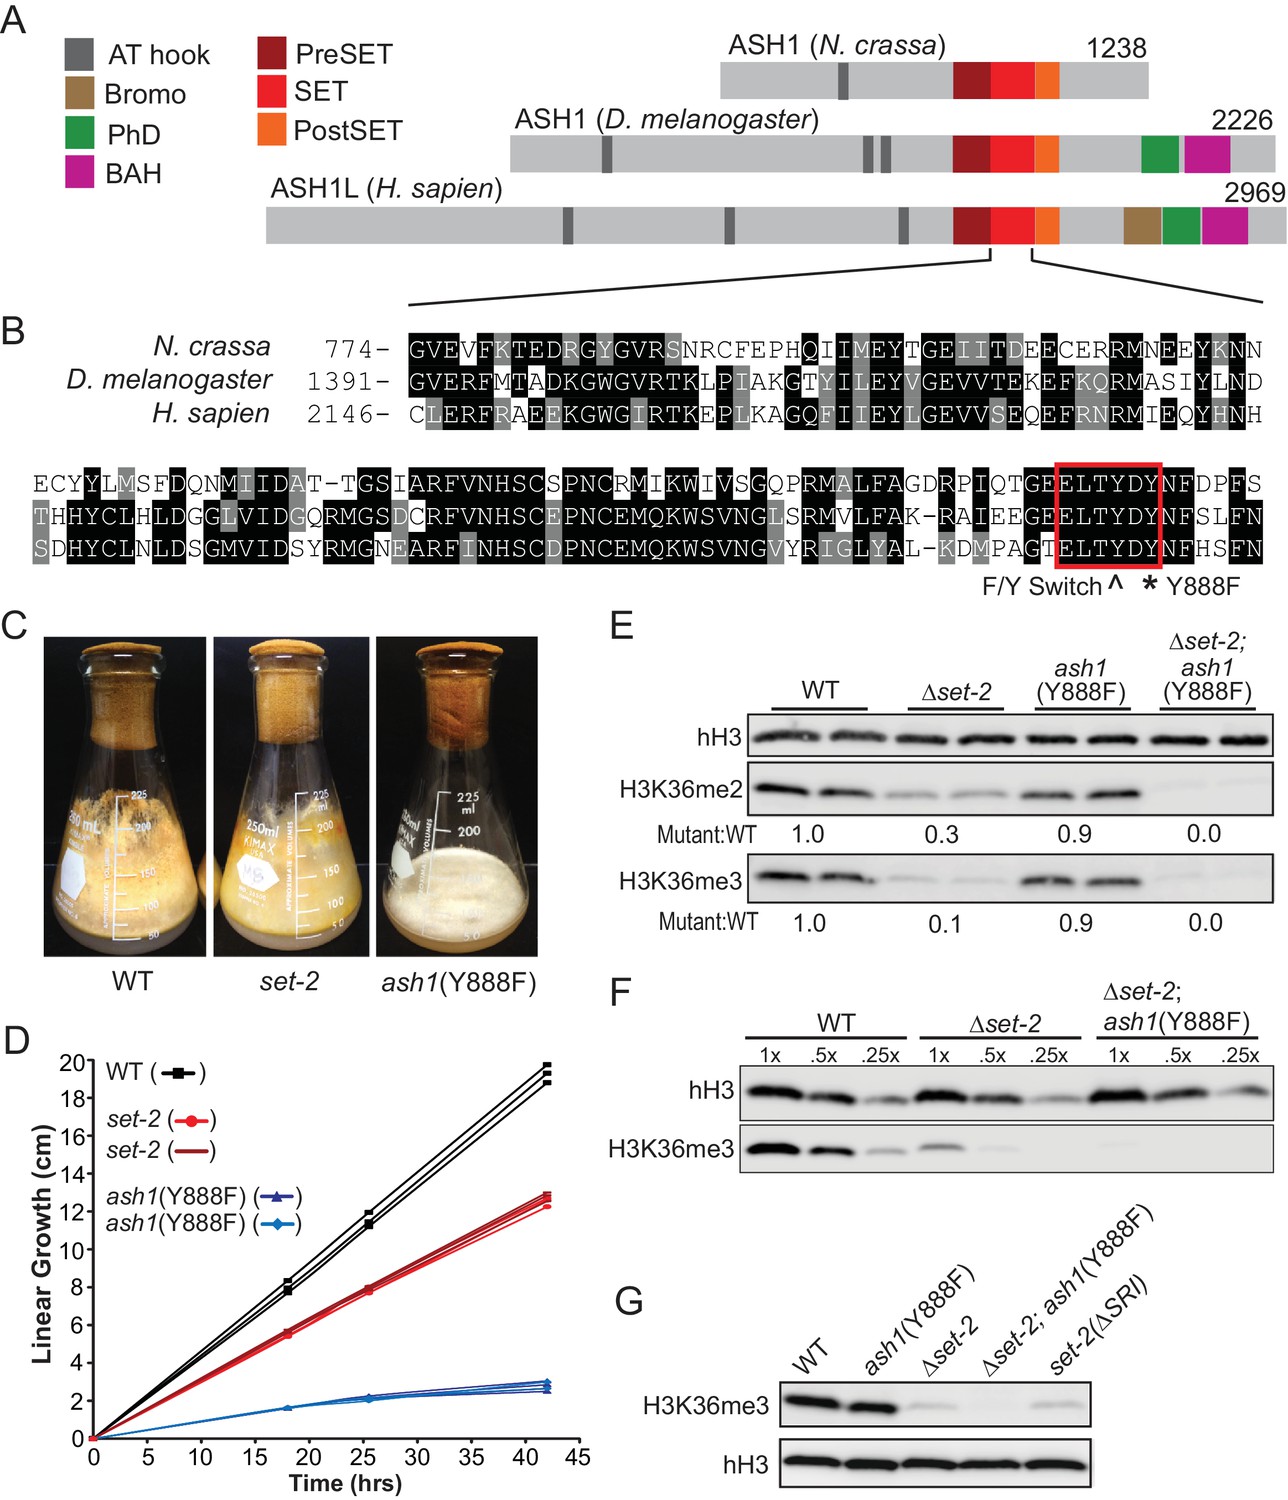
H3K36 KMT activity in Neurospora crassa.
(A) Schematic of ASH1-orthologs in Neurospora crassa, Drosophila melanogaster, and Homo sapiens. (B) Multiple sequence alignment of the SET domain of ASH1 orthologs. Highlighted: F/Y Switch and Y888. (C) Culture flasks demonstrating growth phenotypes of Δset-2 and ash1(Y888F) strains compared to WT. (D) Linear growth rates of Δset-2, ash1(Y888F), and WT. Biological replicates of the mutant strains were measured in triplicate. (E) Immunoblot analysis of H3K36me2 and H3K36me3 in WT, Δset-2, ash1(Y888F), and Δset-2; ash1(Y888F) backgrounds. Sibling replicates are included for each genotype. H3K36me signals were normalized to hH3 levels and compared to WT. (F) Immunoblot analysis of bulk H3K36me3 level in serial diluted extracts of WT, Δset-2, and Δset-2; ash1(Y888F) strains. (G) Immunoblot analysis of H3K36me3 levels in the set-2 (ΔSRI) background.
Figure 2 with 1 supplement
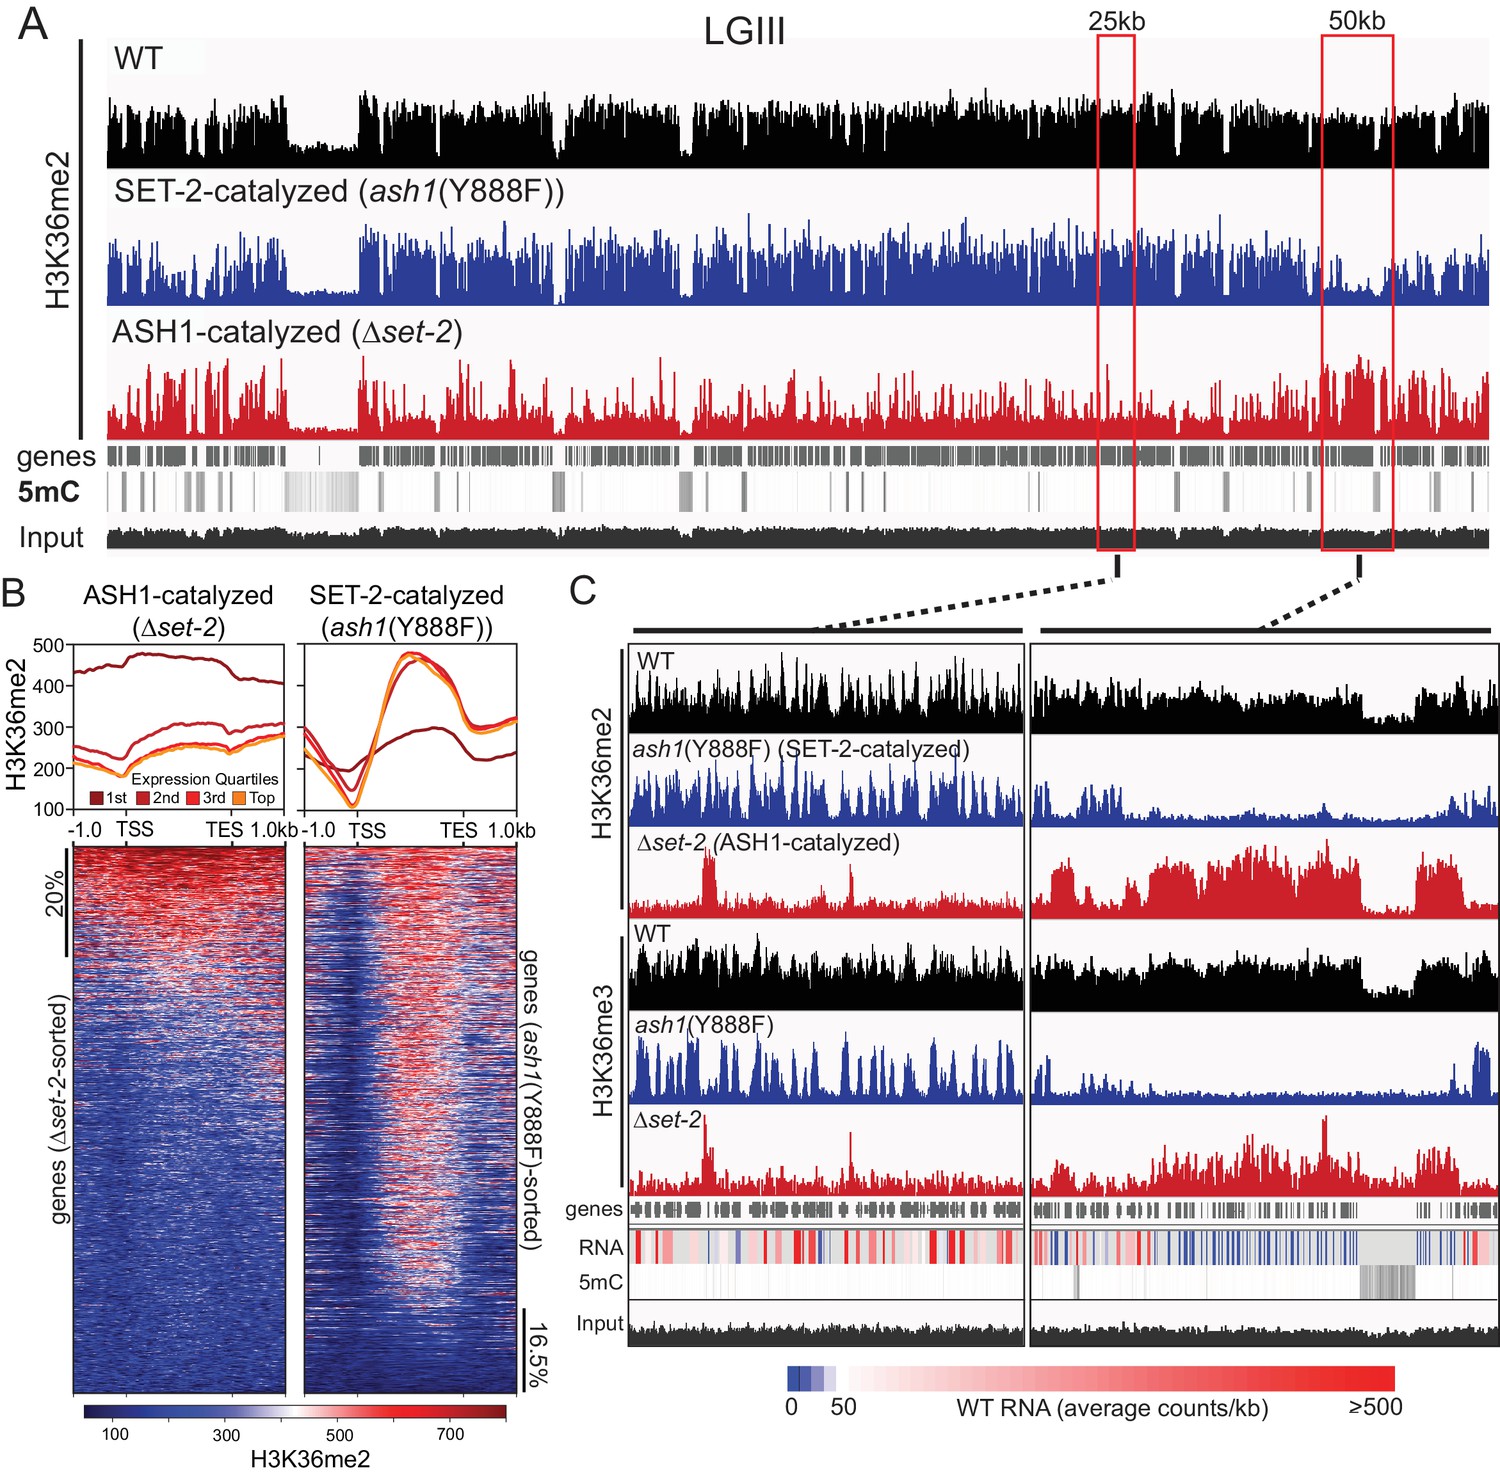
ASH1 and SET-2 specificities segregate the genome into compartments of poorly and robustly transcribed genes.
(A) Representative IGV tracks of H3K36me2 ChIP-seq in WT, Δset-2, and ash1(Y888F) backgrounds. Gene location, DNA methylation (to highlight constitutive heterochromatin), and ‘input’ tracks are included for reference. All of linkage group (LG) III is shown. (B) H3K36me2 profiles as determined by ChIP-seq in set-2 and ash1(Y888F) backgrounds. Metaplots divide the H3K36me2 profile across gene quartiles determined by WT expression (i.e., ‘1 st’=genes in the lowest 25% of WT expression). Heatmaps were independently sorted by signal intensity in descending order. (C) IGV tracks of H3K36me2 and H3K36me3 ChIP-seq in WT, Δset-2, and ash1(Y888F) backgrounds. Gene location, WT RNA abundance, DNA methylation, and input tracks are included for reference. Representative SET-2-rich and ASH1-rich regions are presented in the left and right panels, respectively.
Figure 2—figure supplement 1
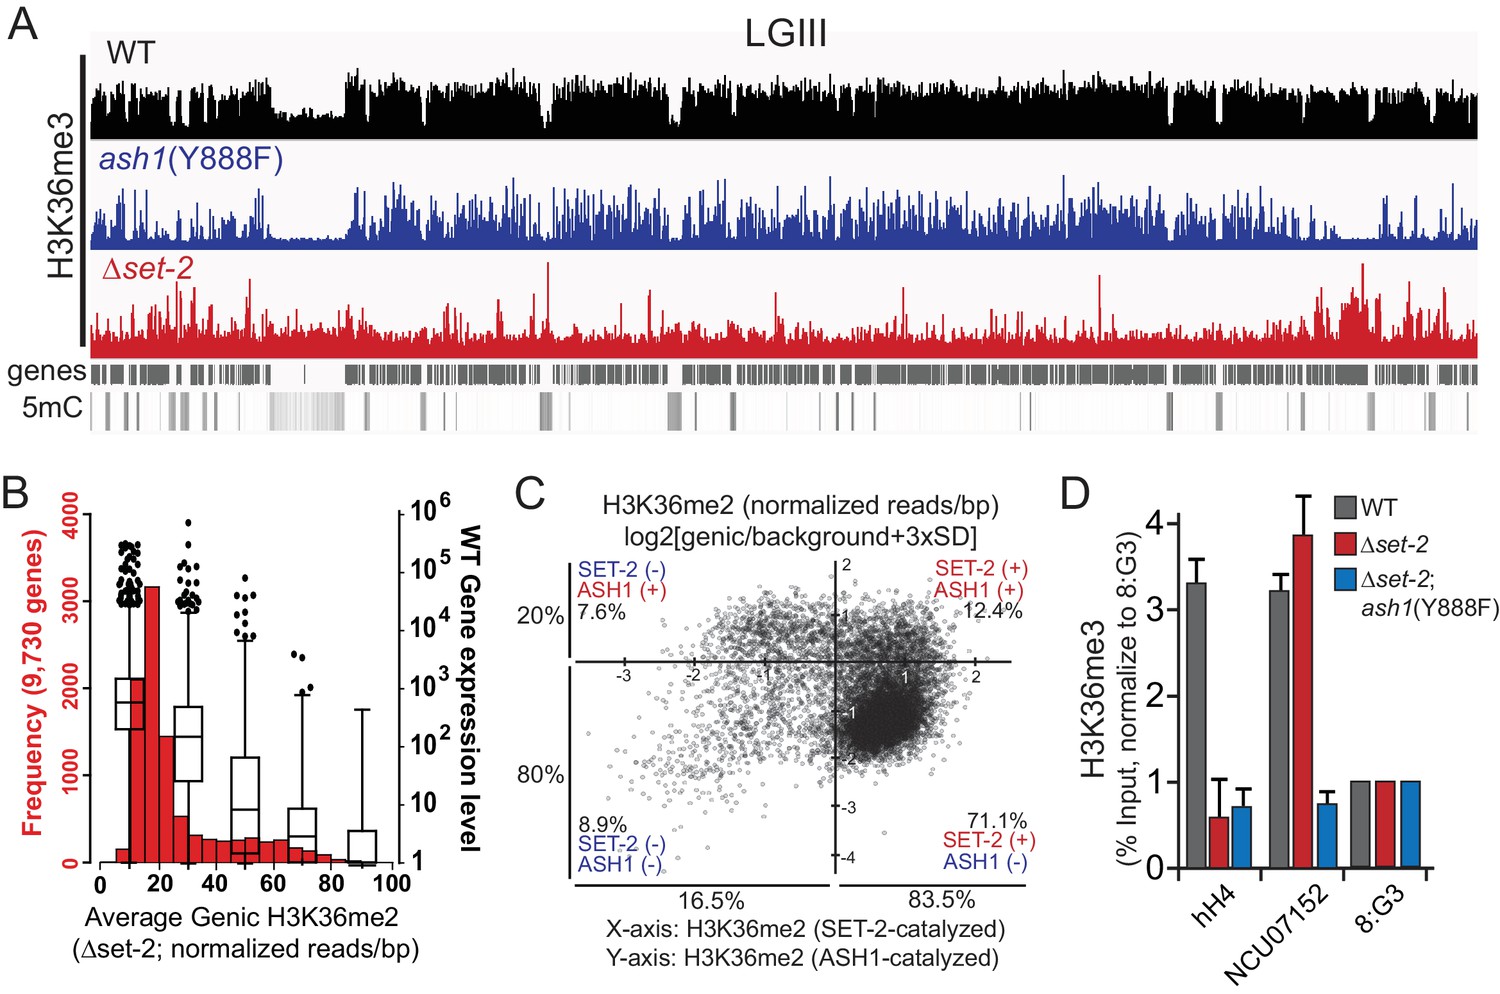
(A) Representative IGV tracks of H3K36me3 ChIP-seq in WT, ash1(Y888F), and Δset-2 backgrounds are shown for LGIII.
Gene location and DNA methylation are included for reference. All of LGIII is shown. (B) Average H3K36me2 signal was determined for each gene in the Δset-2 background and the distribution of signal intensity is represented in a histogram (red). Average expression level (RPKM) in WT is overlayed as a Whisker plot (black) for each quintile of H3K36me2 intensity. Pseudo-reads of 1 were assigned to genes with expression values <1. Whisker plot shows median, 25th, 75th, and 99th percentiles, and outliers. (C) Average genic H3K36me2 levels (reads/bp) were normalized to ‘background’ as defined by average H3K36me2 level across each centromere. Log2 values are plotted in the ash1(Y888F) background (X-axis) and Δset-2 background (Y-axis). Genes with positive X- or Y-axis values were defined as SET-2-marked or ASH1-marked, respectively. (D) H3K36me3 ChIP results are shown for wt, Δset-2, and Δset-2; ash1(Y888F) strains (each performed in triplicate) at three genomic regions with distinct H3K36me profiles. 8:G3 is a constitutive heterochromatin region that lacks H3K36me and is used to assess ‘background’ in the ChIP. hH4 is an actively expressed gene that is marked by SET-2-catalyzed H3K36me but not ASH1-catalyzed H3K36me. NCU07152 in a silent ‘uncharacterized gene’ that is densely marked by ASH1-catalyzed H3K36me and H3K27me2/3.
Figure 3 with 1 supplement
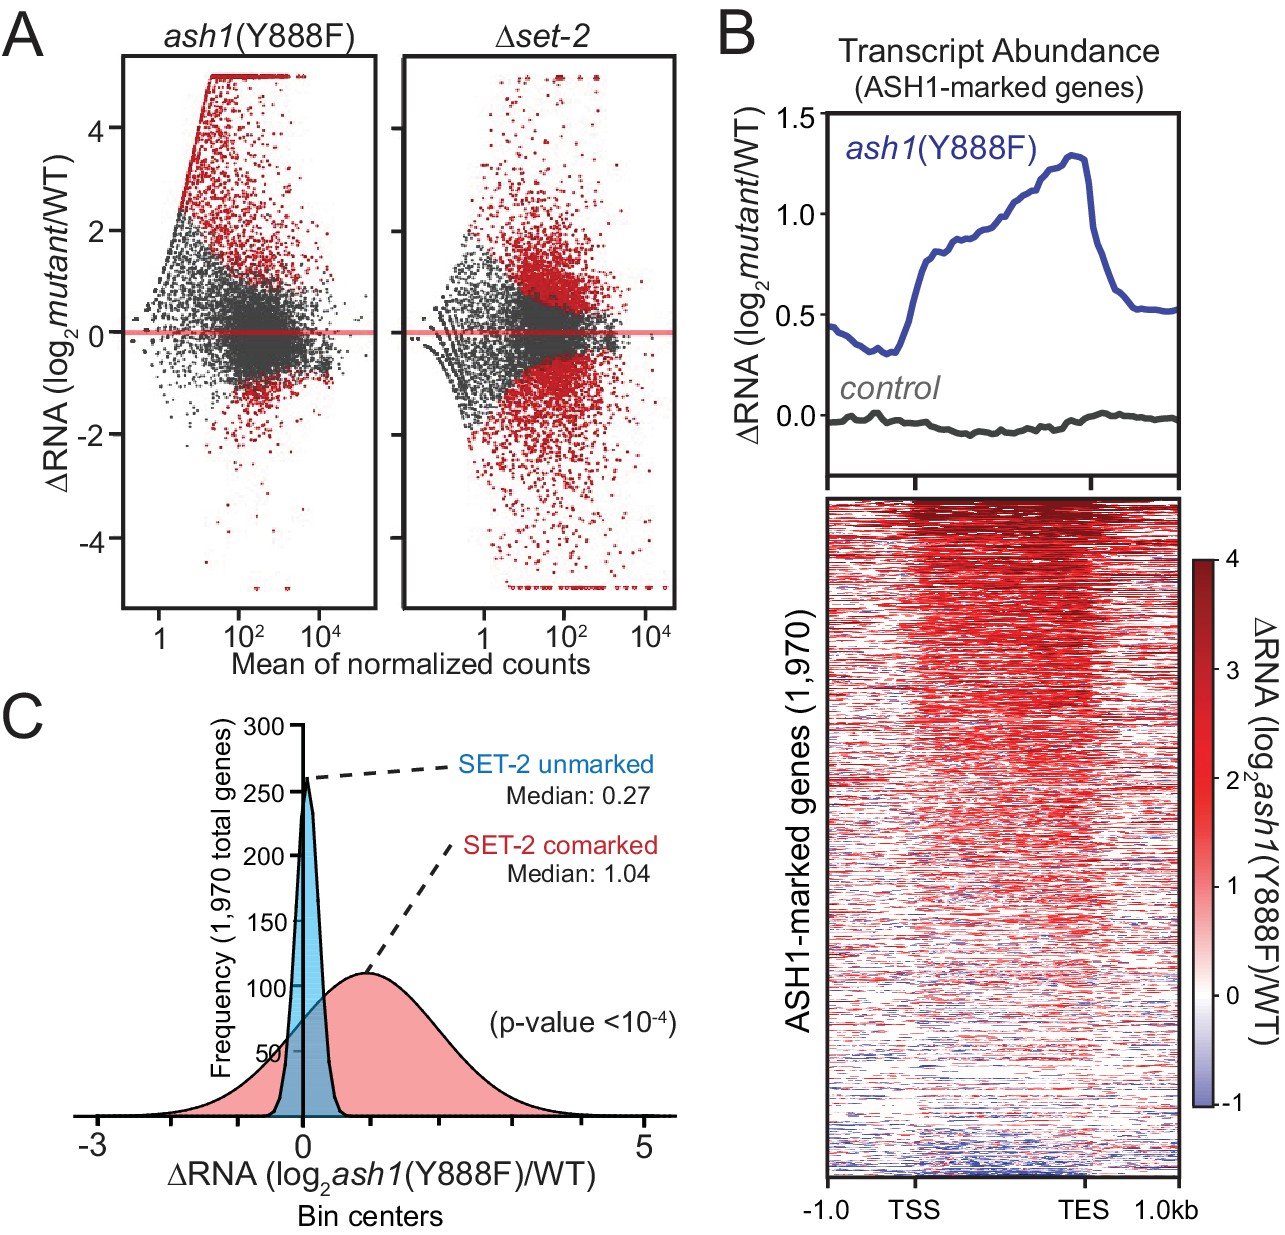
ASH1 catalytic activity maintains repression of poorly transcribed genes.
(A) Gene expression changes are displayed as scatter plots of log2-fold changes vs. mean of normalized counts for ash1(Y888F) and Δset-2 strains compared to WT controls. Duplicate biological replicates were analyzed, and points with p values < 0.1 are colored red. (B) Metaplot and heatmap illustrating change in RNA abundance as determined by RNAseq. ash1(Y888F) and WT replicates were normalized, averaged, and log2-ratios generated for ASH1-marked genes. The parent strain, N2930 (see Materials and Methods), is included as a control. (C) Frequency distribution of ash1(Y888F)/WT expression-change for genes marked by H3K36me2 in Δset-2 strain (‘ASH1-marked’; Guassian fit). SET-2-unmarked (blue) and SET-2-comarked (red) compartments are separated and median values highlighted. Statistical significance (two-tailed p-value<10−4) was determined by a two sample Mann-Whitney test (Mann and Whitney, 1946).
Figure 3—figure supplement 1
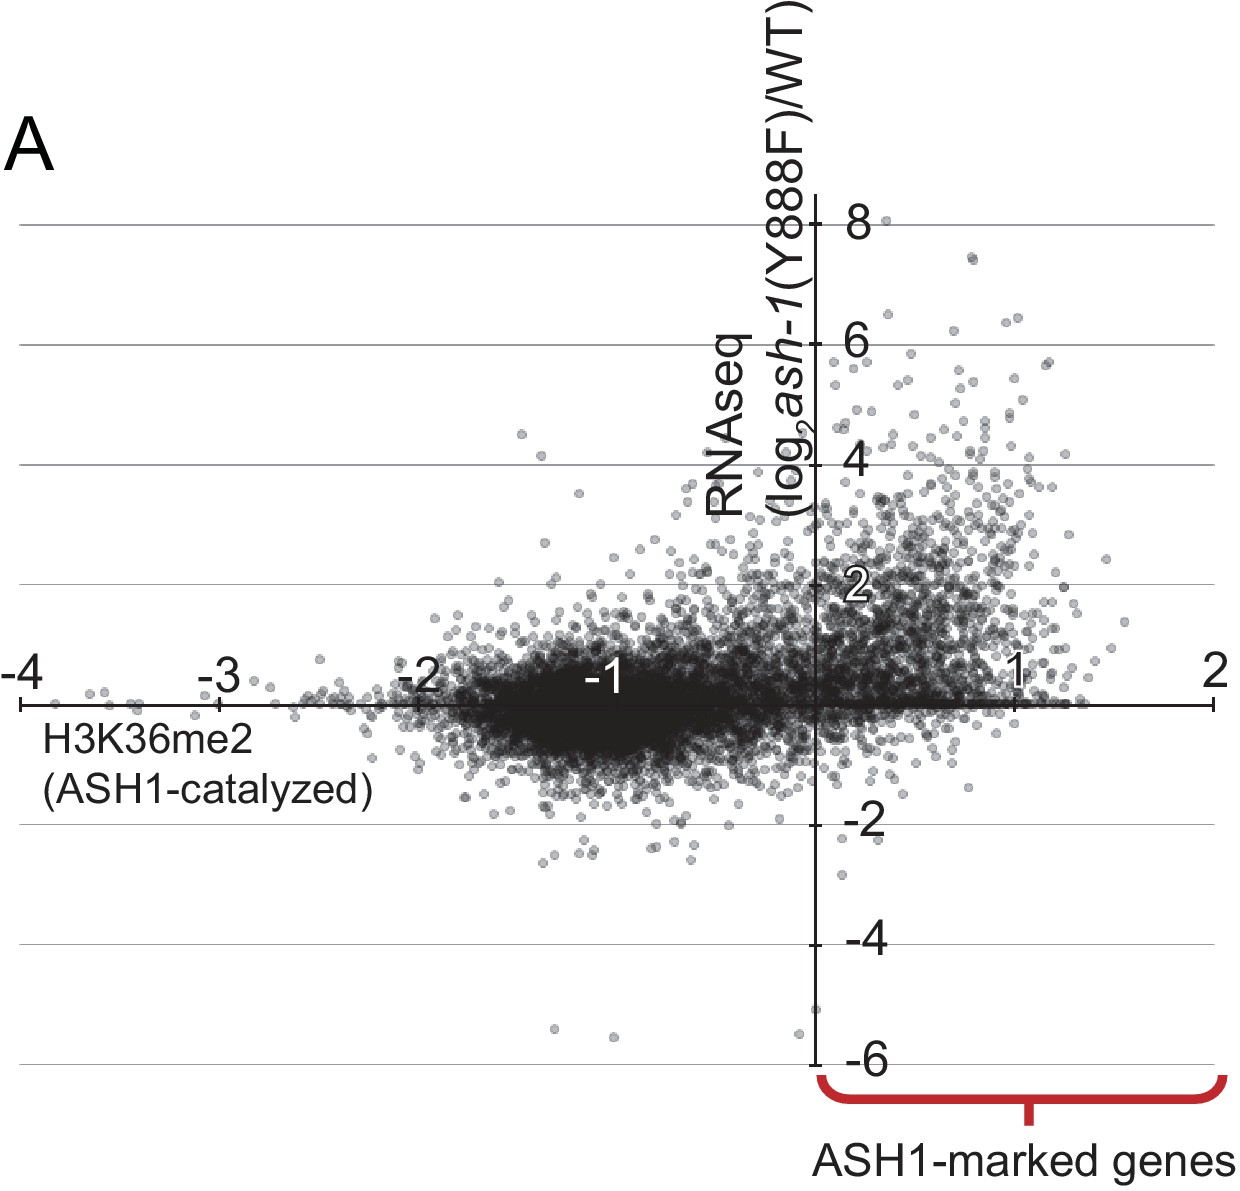
(A) Average genic H3K36me2 levels (X-axis) catalyzed by ASH1 (defined in Figure 2) are plotted against change in gene expression (Y-axis) in the ash1(Y888F) background.
https://doi.org/10.7554/eLife.41497.007
Figure 4
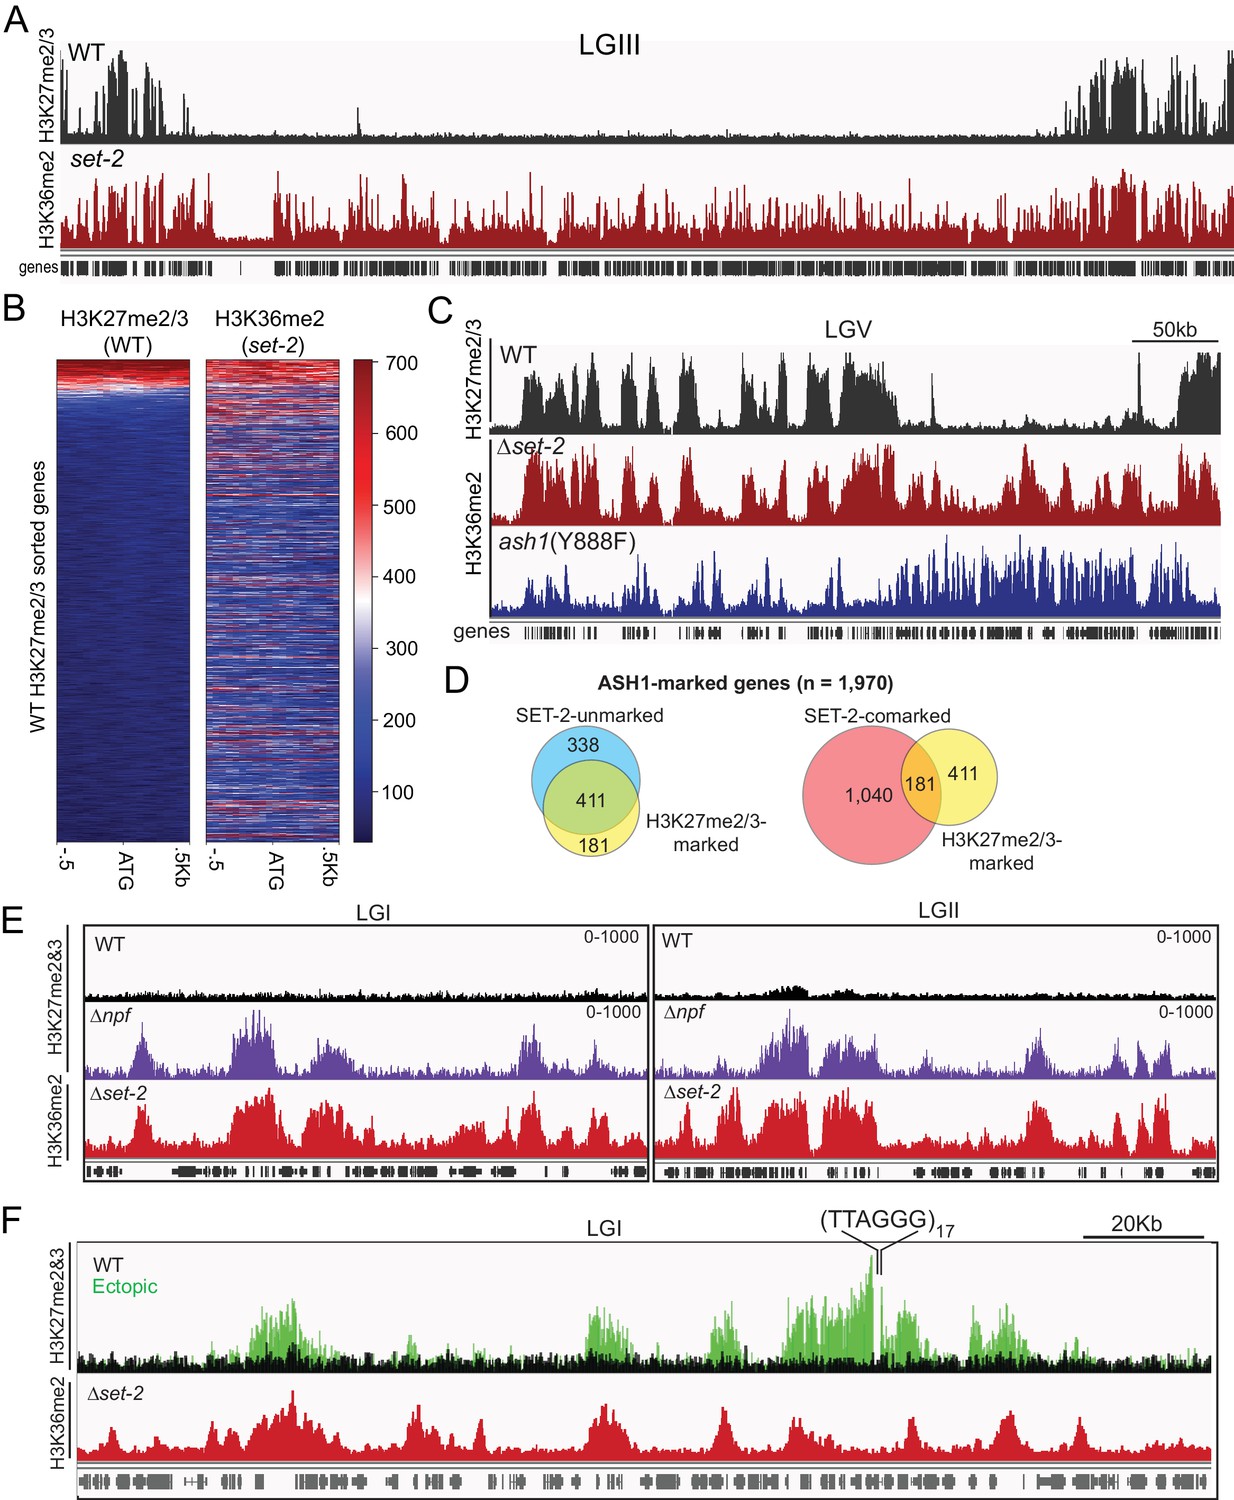
ASH1-catalyzed H3K36me2 delineates H3K27me2/3-competent chromatin.
(A) Representative IGV tracks for H3K27me2/3 in WT and H3K36me2 as catalyzed by ASH1. All of LGIII is shown. (B) Heatmap showing the distribution of average H3K27me2/3 signal intensity in WT (left) and ASH1-catalyzed H3K36me2 (right) across the promoter region of all genes. Genes are sorted by WT H3K27me2/3 intensity. (C) Representative IGV tracks of H3K27me2/3 in WT and H3K36me2 as catalyzed by ASH1 or SET-2. (D) Fraction of ASH1-marked genes co-marked by SET-2, SET-7, or both SET-2 and SET-7. The distribution of SET-7/ASH1-comarked genes (yellow circle) in the SET-2-comarked (red) and SET-2-unmarked (blue) compartments shows that most (411/592) ASH1/SET-7 doubly marked genes are not marked by SET-2. Statistical significance (two-tailed p-value<10−4) was determined by the Chi-square test. (E) H3K27me2/3 ChIPseq tracks from WT (black) andΔnpf (purple) strains are compared to H3K36me2 ChIPseq in Δset-2. Depicted regions were selected for their multiple aberrant domains of H3K27me3. (F) H3K27me2/3 ChIPseq track from WT (black) and ectopic telomere-repeat (green) strains are superimposed and compared to H3K36me2 ChIPseq in a Δset-2 strain.
Figure 5 with 2 supplements
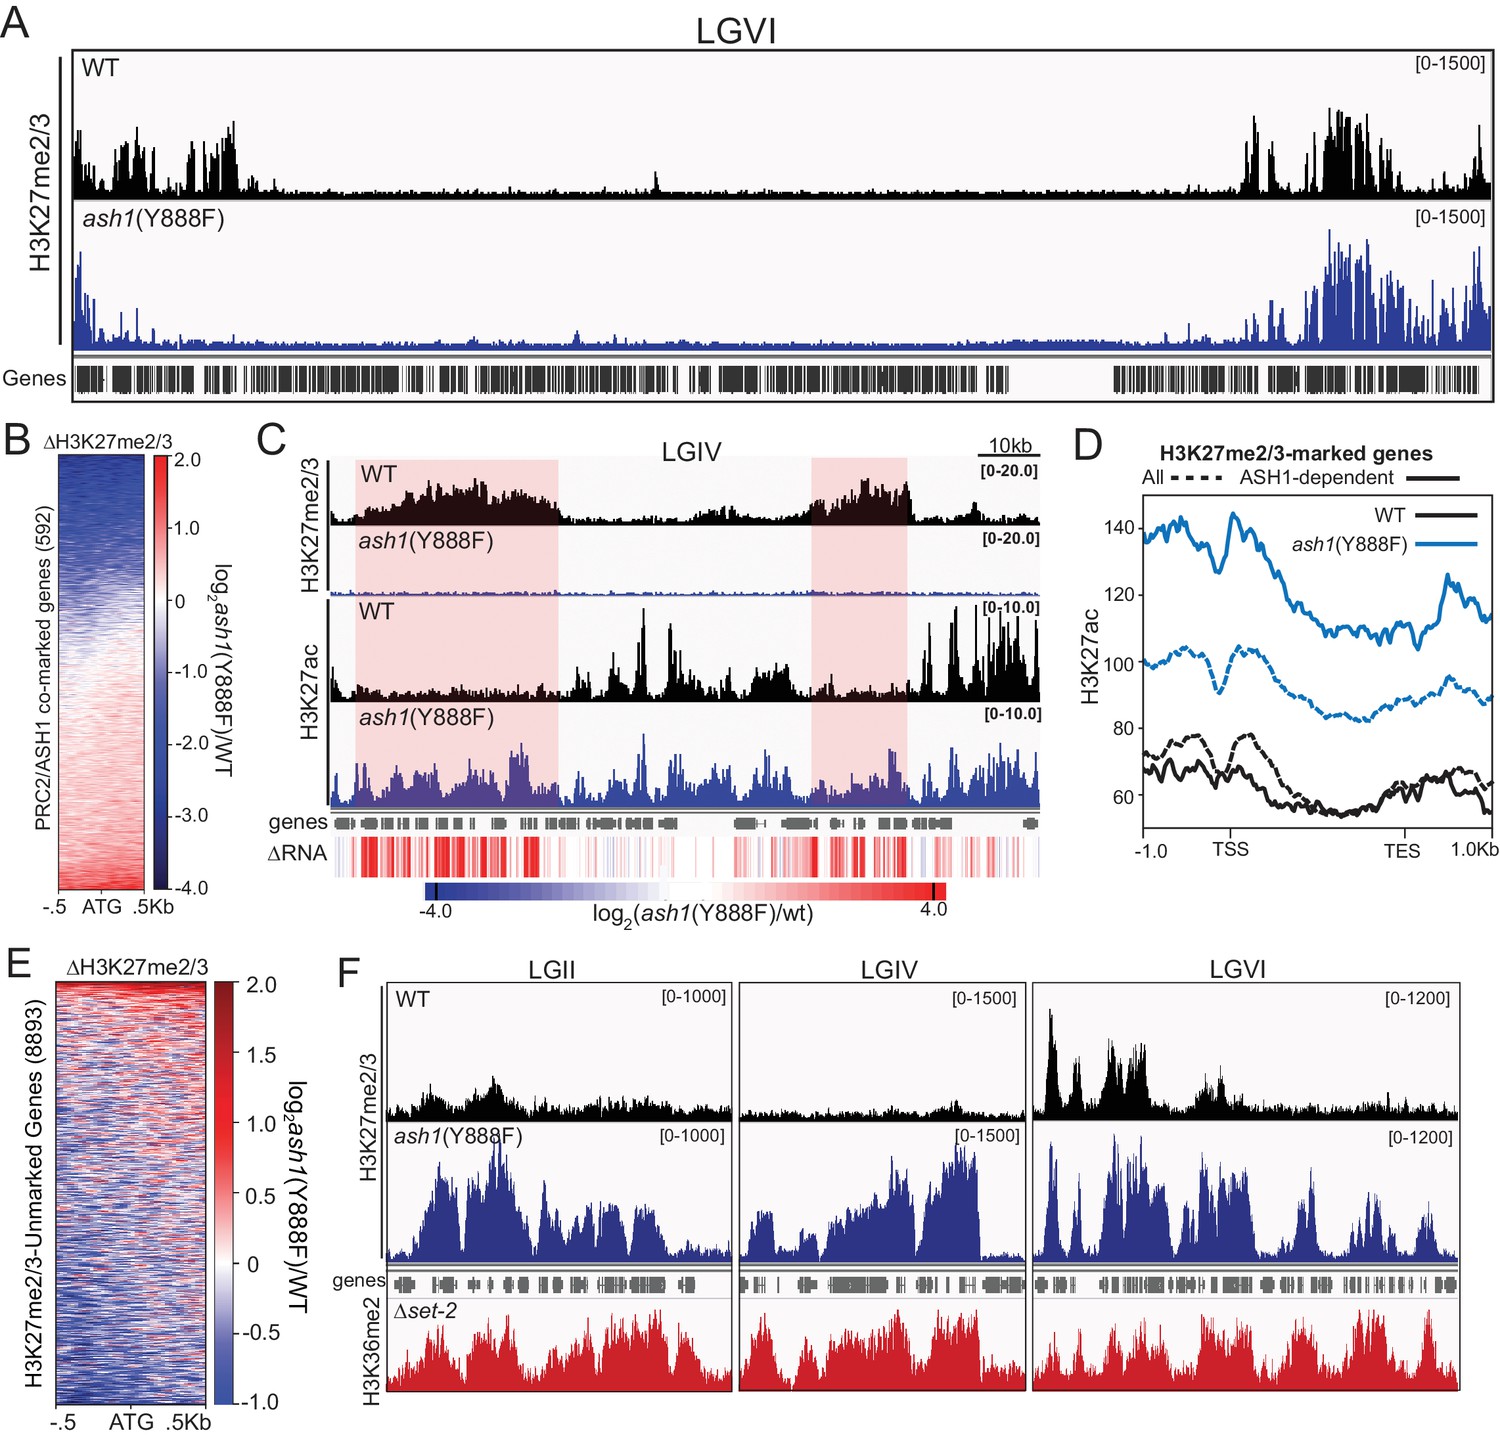
ASH1 activity differentially regulates H3K27me2/3 accumulation.
(A) Representative IGV tracks of H3K27me2/3 in WT and ash1(Y888F) are shown for LGVI. Gene locations are included for reference. (B) Heatmap highlighting frequency and intensity of H3K27me2/3 loss over in the ash1(Y888F) background. (C) IGV tracks of H3K27me2/3 and H3K27ac in WT and ash1(Y888F) strains. Regions of H3K27ac accumulation correlating with gene upregulation (ΔRNA track) are highlighted. (D) Metaplot of H3K27ac accumulation in WT (black) and ash1(Y888F) (blue) strains at either all WT H3K27me2/3-marked genes (dashed line) or genes identified as ‘ASH1-dependent’ (solid line). (E) Change in H3K27me2/3 signal intensity by ChIPseq in the ash1(Y888F) background. Only genes established as ‘unmarked’ are included (Figure 4B). (F) ChIPseq tracks demonstrating H3K27me2/3 gains in ash1(Y888F) and comparison to H3K36me2 in the set-2 background. Depicted regions were selected for their multiple aberrant domains of H3K27me3.
Figure 5—figure supplement 1
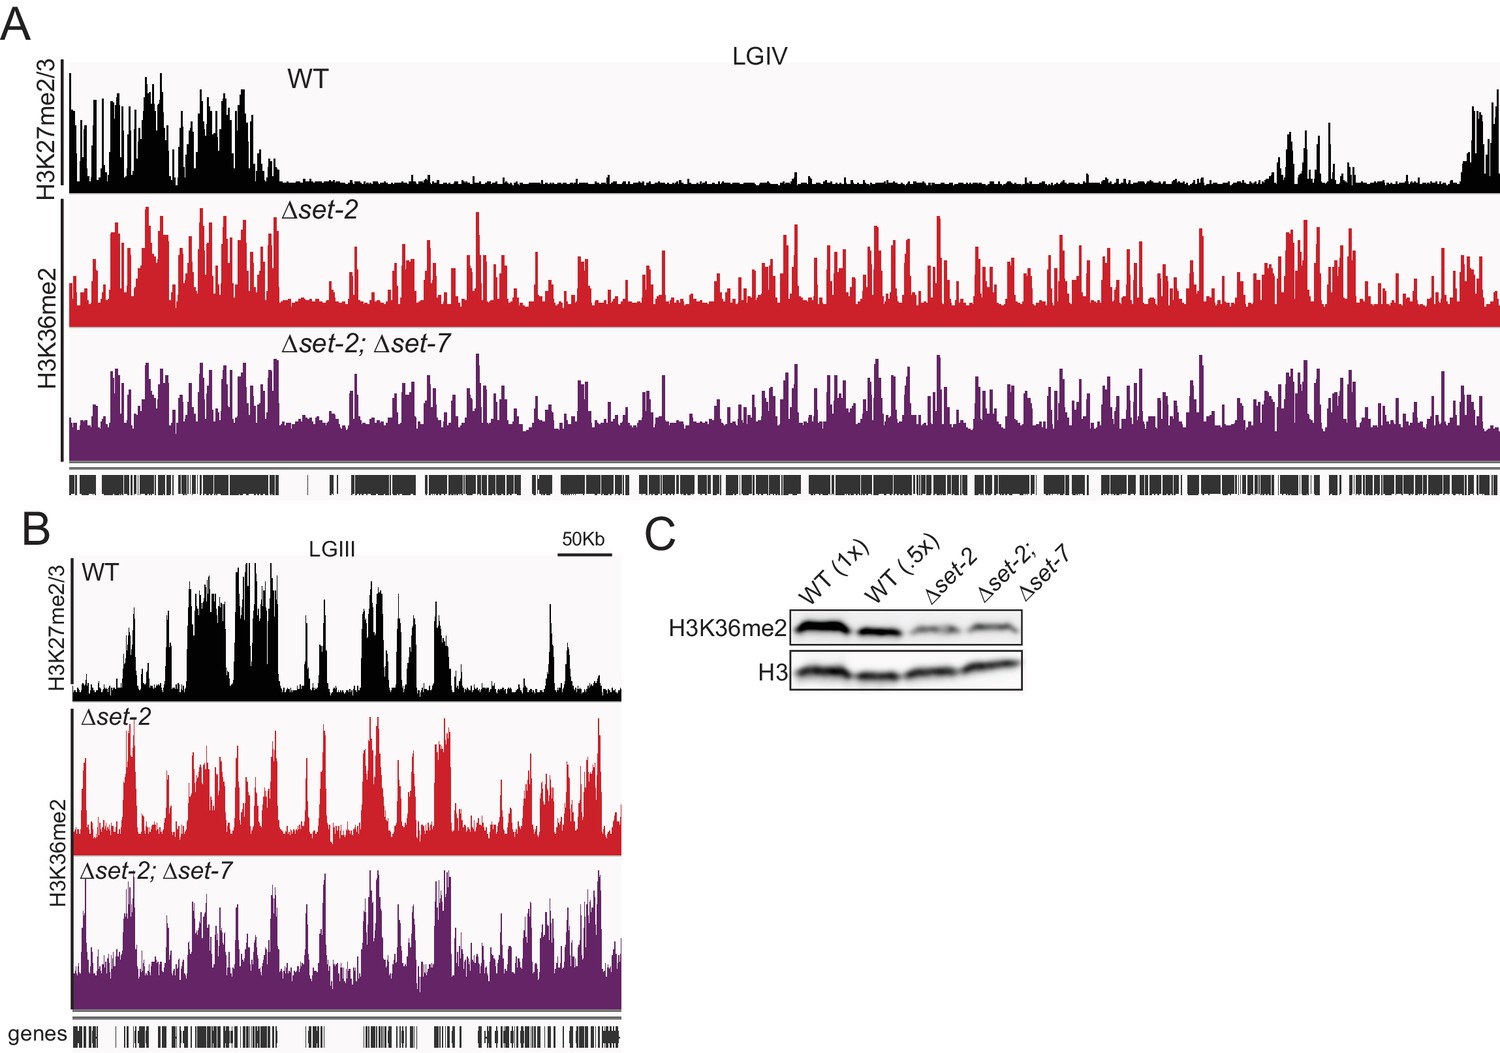
(A, B) H3K36me2 ChIPseq in a set-2; set-7 strain displayed on IGV with WT H3K27me2/3 and set-2 H3K36me2.
All of LGIV is included in (A) and a zoomed-in segment of LGIII in (B). (C) Immunoblotting H3K36me2 and H3 in WT, set-2, and set-2; set-7 strains.
Figure 5—figure supplement 2
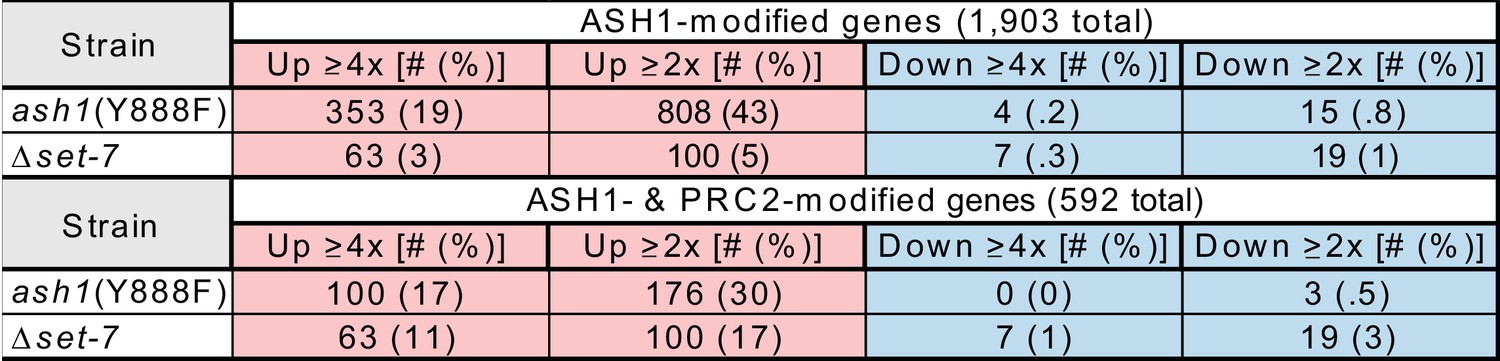
Gene expression changes are summarized for genes marked by ASH1-catalyzed H3K36me2 (Top) and genes comarked by ASH1-catalyzed H3K36me2 and SET-7-catalyzed H3K27me2/3 (Bottom) in the ash1(Y888F) and Δset-7 strains.
Results for Δset-7 are derived from Klocko et al., 2016.
-
Figure 5—figure supplement 2—Source data 1
Gene expression changes (log2 ash1(Y888F)/wt).
- https://doi.org/10.7554/eLife.41497.012
Figure 6

Model for H3K36me deposition in Neurospora crassa.
Neurospora genes can be divided into two groups depending upon their source of H3K36me. SET-2 marks the gene body of actively transcribed genes, and conversion to the trimethylated state is tied to transcription. ASH1 establishes large domains of H3K36me that covers silent genes and flanking regions. ASH1 predominantly deposits H3K36me2, but also appears to have the capacity to produce H3K36me3; the significance of di- versus tri-methylation remains unclear. In both cases, H3K36me appears to have a repressive function, protecting active genes from cryptic transcription and maintaining general repression of inactive genes. Genes marked by ASH1 can be co-modified by PRC2 with H3K27me2/3. Genes marked by both ASH1 and PRC2 appear ‘locked’ in a dormant state (i.e., they are less likely to be activated in the absence of ASH1).
Tables
Key resources table
| Reagent type (species) or resource | Designation | Source or reference | Identifiers | Additional information |
|---|---|---|---|---|
| Strain, strain background (N. crassa) | WT | FGSC#6103 | N623 | mat A; his-3 |
| Strain, strain background (N. crassa) | WT | Honda and Selker, 2008 | N2930 | mat A; his-3; ∆mus-52::bar |
| Strain, strain background (N. crassa) | WT | FGSC#2489 | N3752 | mat A |
| Strain, strain background (N. crassa) | WT | FGSC#4200 | N3753 | mat a |
| Strain, strain background (N. crassa) | ash1-3xFLAG | this study | N4865 | mat A; his-3; ash1- 3xFLAG::hph |
| Strain, strain background (N. crassa) | ash1(Y888F) | this study | N4877 | mat A; his-3; ash1(Y888F)− 3xFLAG::hph; ∆mus-52::bar |
| Strain, strain background (N. crassa) | ash1(Y888F) | this study | N4878 | mat A; his-3; ash1(Y888F) −3xFLAG::hph |
| Strain, strain background (N. crassa) | ash1(Y888F) | this study | N6268 | mat A; his-3; ash1(Y888F) −3xFLAG::hph |
| Strain, strain background (N. crassa) | ash1(Y888F) | this study | N6269 | mat A; his-3; ash1(Y888F) −3xFLAG::hph |
| Strain, strain background (N. crassa) | ash1(Y888F) | this study | N6875 | mat a; ash1(Y888F)−3x FLAG::nat |
| Strain, strain background (N. crassa) | ash1(Y888F) | this study | N6878 | mat a; ash1(Y888F) −3xFLAG::nat; ∆mus-52::bar |
| Strain, strain background (N. crassa) | ∆set-2 | FGSC#15504 | N5761 | mat a; ∆set-2::hph |
| Strain, strain background (N. crassa) | ∆set-2 | this study | N6335 | mat A; ∆set-2::hph |
| Strain, strain background (N. crassa) | set-2(∆SRI) | this study | N6956 | mat A; set-2(∆SRI) ::nat |
| Strain, strain background (N. crassa) | ∆set-7 | FGSC# 11182 | N4718 | mat a; ∆set-7::hph |
| Strain, strain background (N. crassa) | ∆set-7 | Jamieson et al., 2018 | N4730 | mat A; ∆set-7::bar |
| Strain, strain background (N. crassa) | ∆npf | FGSC# 13915 | N4721 | mat a; ∆npf::hph |
| Strain, strain background (N. crassa) | ash1(Y888F); ∆set-2::nat | this study | N6266 | mat A; his-3; ash1(Y888F) −3xFLAG::hph; ∆set-2::nat; ∆mus-52::bar |
| Strain, strain background (N. crassa) | ash1(Y888F); ∆set-2 | this study | N6267 | mat A; his-3; ash1(Y888F) −3xFLAG::hph; ∆set-2::nat |
| Strain, strain background (N. crassa) | ∆set-2; ∆set-7 | this study | N6333 | mat ?; ∆ set-2::hph; ∆set-7::bar |
| Strain, strain background (N. crassa) | ∆set-2; ∆set-7 | this study | N6334 | mat ?; ∆set-2::hph; ∆set-7::bar |
| Strain, strain background (N. crassa) | csr-1: (TTAGGG)17 | Jamieson et al., 2018 | N6383 | mat a; csr-1: (TTAGGG)17; ∆mus-52::bar |
| Antibody | H3K36me3 | Cell Signaling | Cat#4909S, Clone (D5A7)) | immunoblot (1:1000) |
| Antibody | H3K36me2 | Abcam | Cat#ab9049 | immunoblot (1:1000) |
| Antibody | Histone H3 | Abcam | Cat#ab1791 | immunoblot (1:2000) |
| Antibody | IRDye 680RD Goat-anti-Rabbit secondary antibody | Licor | Cat#926–68071 | immunoblot (1:5000) |
| Antibody | H3K27me3 | Millipore | Cat#07–449 | Chromatin immuno precipitation |
| Antibody | H3K36me3 | Abcam | Cat#ab9050 | Chromatin immuno precipitation |
| Antibody | H3K36me2 | Abcam | Cat#ab9049 | Chromatin immuno precipitation |
| Antibody | H3K27ac | ActiveMotif | Cat#39133 | Chromatin immuno precipitation |
| Antibody | H3K27me2/3 | ActiveMotif | Cat#39535 | Chromatin immuno precipitation |
Additional files
-
Transparent reporting form
- https://doi.org/10.7554/eLife.41497.014
Download links
A two-part list of links to download the article, or parts of the article, in various formats.
Downloads (link to download the article as PDF)
Open citations (links to open the citations from this article in various online reference manager services)
Cite this article (links to download the citations from this article in formats compatible with various reference manager tools)
ASH1-catalyzed H3K36 methylation drives gene repression and marks H3K27me2/3-competent chromatin
eLife 7:e41497.
https://doi.org/10.7554/eLife.41497


