Genetic diversity of CHC22 clathrin impacts its function in glucose metabolism
- Imperial College London, United Kingdom
- University College London, United Kingdom
- University of Colorado, United States
- Birkbeck College and University College London, United Kingdom
- CNRS, France
- University of Ferrara, Italy
- University of Bristol, United Kingdom
- University of Pennsylvania, United States
- Stanford University, United States
Figures
Figure 1 with 2 supplements
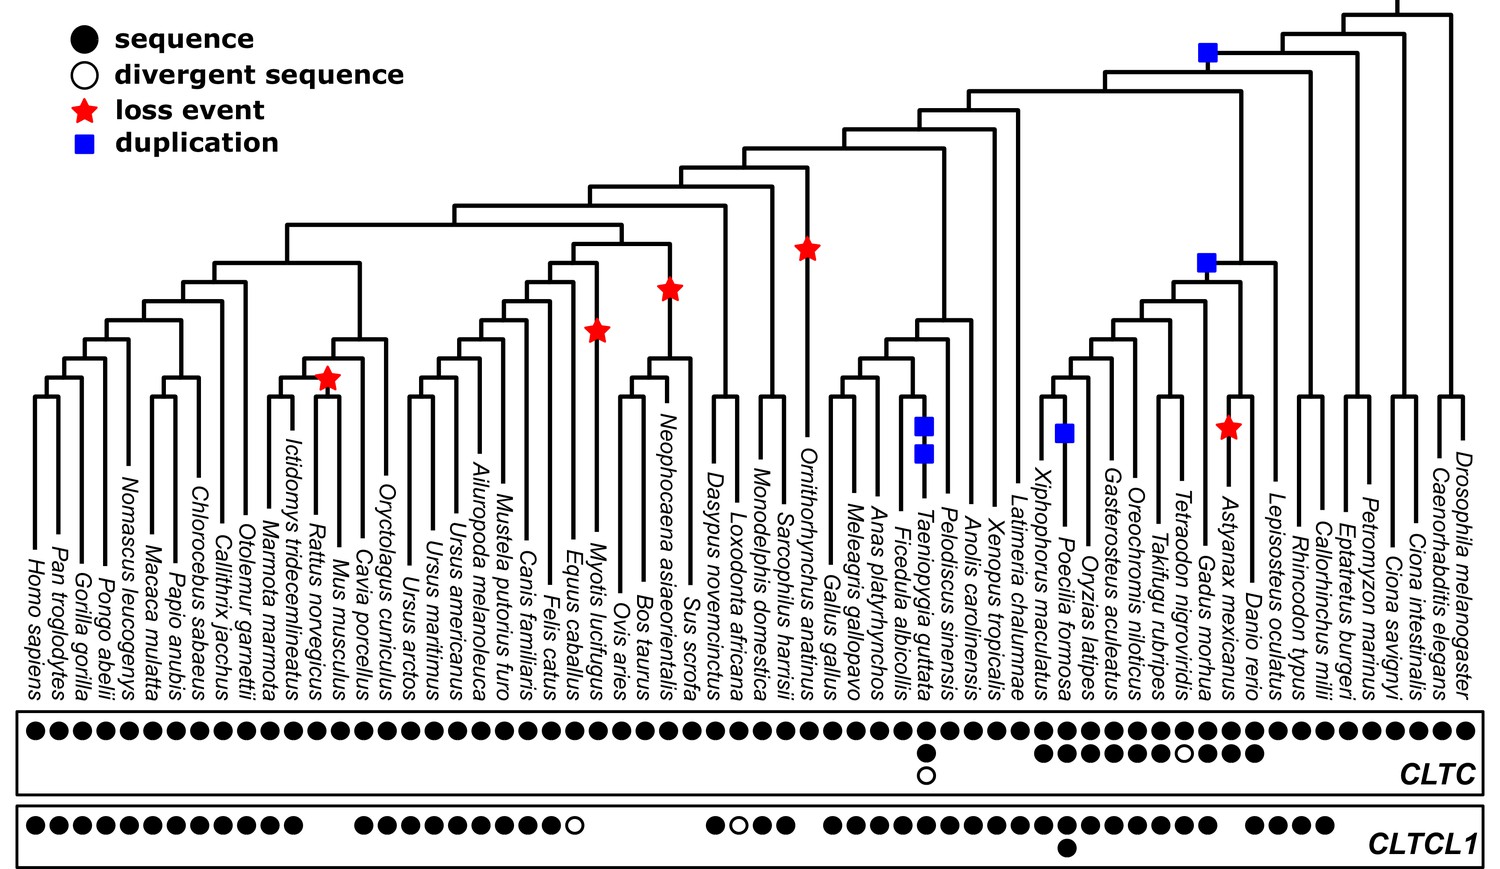
Phylogenetic analysis of CLTC/CLTCL1 reveals independent loss of the gene encoding CHC22 clathrin from vertebrate lineages and complete conservation of the gene encoding CHC17 clathrin.
Phylogenetic profiles of CLTC/CLTCL1 are shown, with gene presence in the corresponding genome indicated by a filled black circle. All sequences used have less than 5% unspecified residues (‘X’s in the relevant database). Divergent gene sequences with low sequence similarity but that still fall within the CLTC clade are shown as empty circles (see Materials and methods for similarity threshold and sequence IDs). Based on the profile and species tree the most parsimonious phylogenetic tree for loss and duplication events is inferred and shown as red stars and blue squares, respectively.
Figure 1—figure supplement 1

Unreconciled phylogenetic tree for CLTC and CLTCL1 across all investigated species.
https://doi.org/10.7554/eLife.41517.004
Figure 1—figure supplement 2
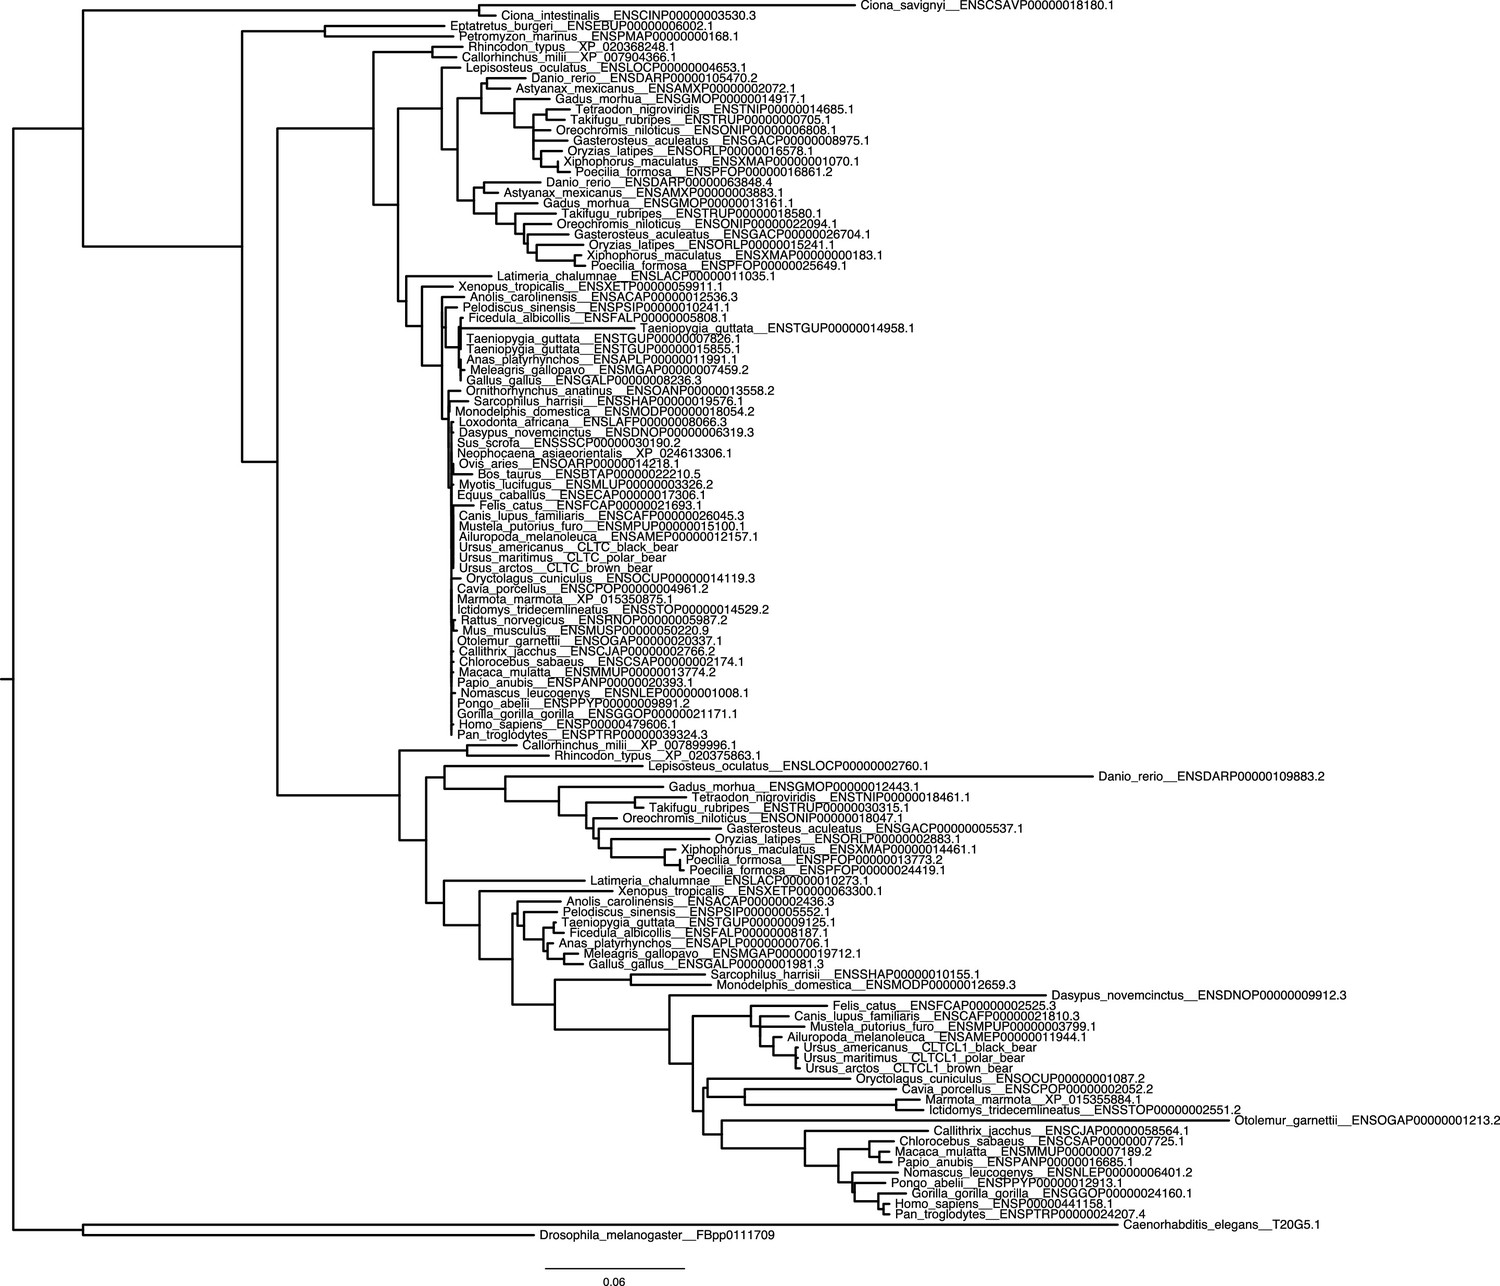
Reconciled phylogenetic tree (therefore missing support values) for CLTC and CLTCL1 across all investigated species.
https://doi.org/10.7554/eLife.41517.005
Figure 2
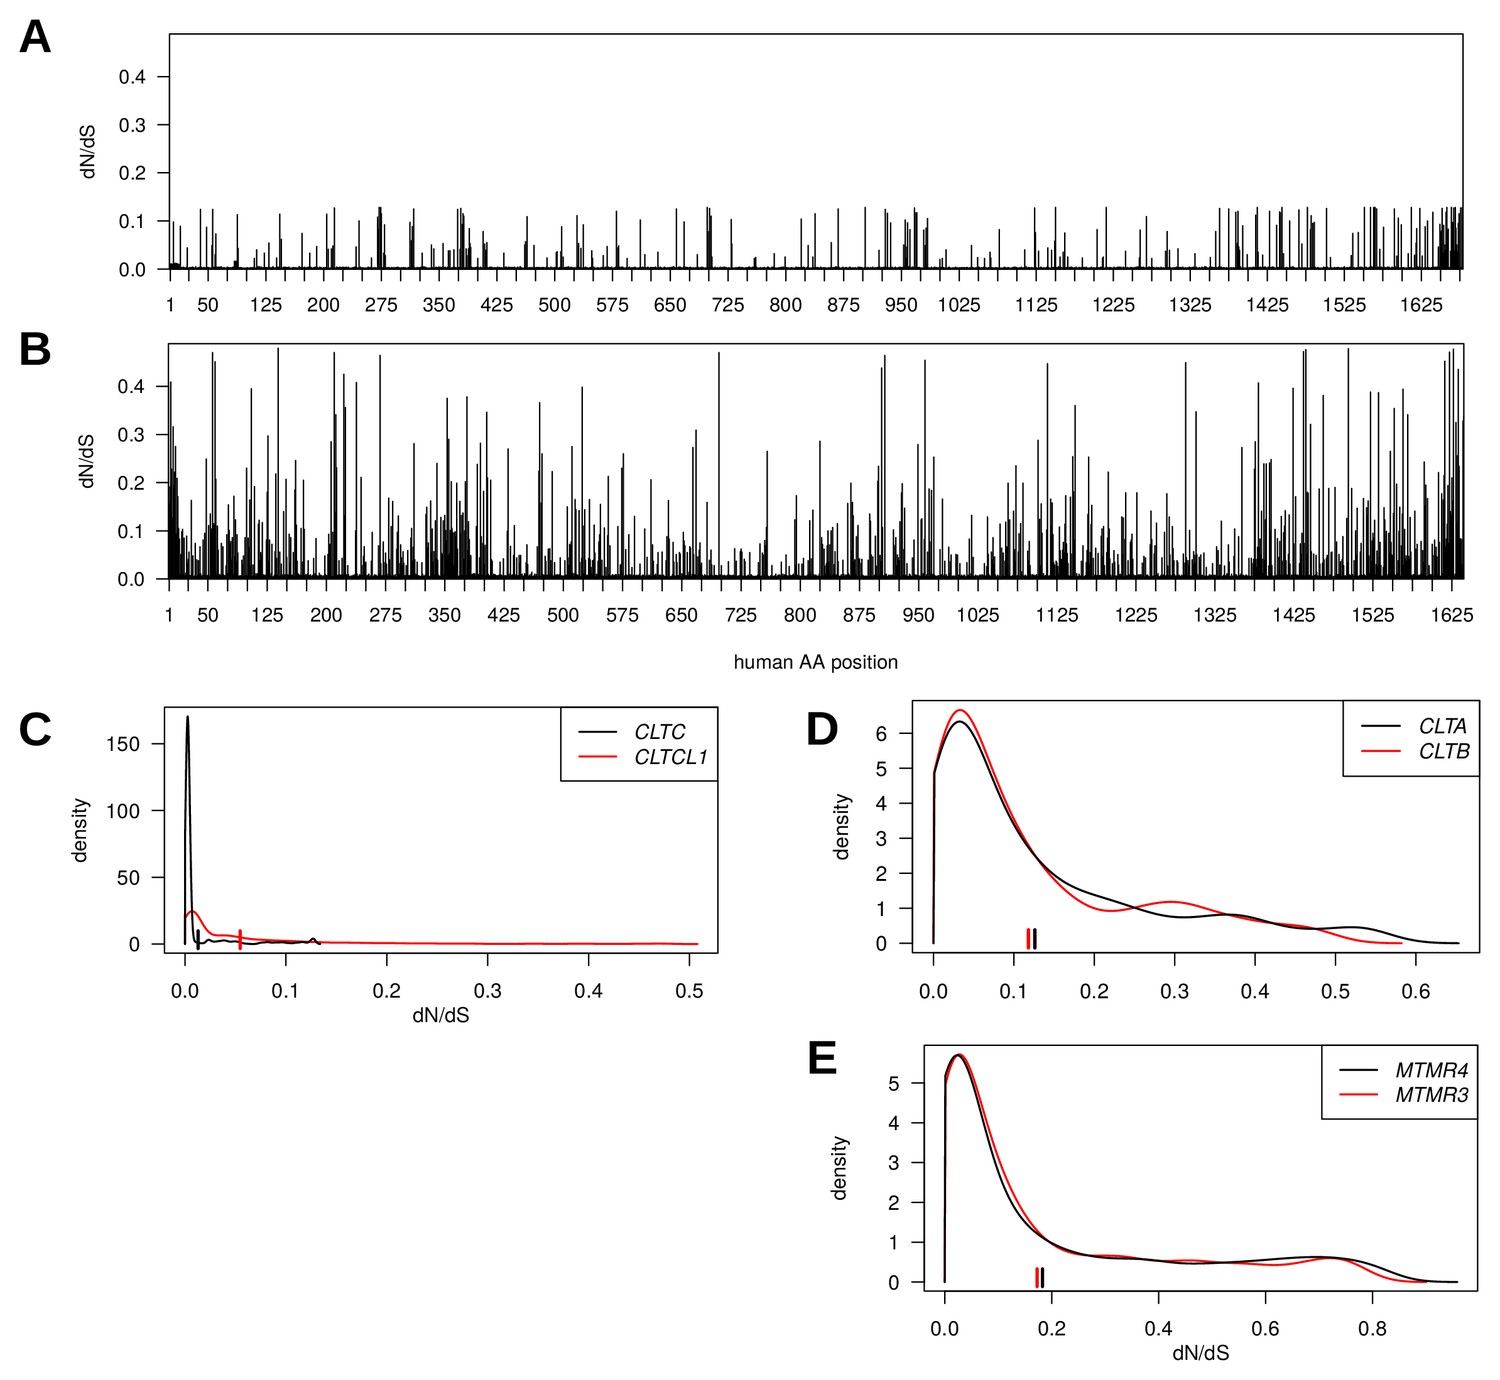
Genes encoding clathrin heavy chains show evidence for purifying selection with CLTCL1 (CHC22-encoding) being more variable than CLTC (CHC17-encoding) over evolutionary time.
Evolutionary rates expressed as dN/dS ratios are shown for each position in CLTC (A) and CLTCL1 (B). Rates are averages over an entire phylogenetic tree and therefore not specific to the human proteins. However, to assist interpretation, only rates for residues present in the human proteins are shown. Kernel density estimates of the distributions of dN/dS ratios per paralogous pair of proteins (C–E). CLTA and CLTB encode clathrin light chains A and B, respectively. MMTR3 and MMTR4 encode myotubularin lipid phosphatases. Mean dN/dS ratios averaged over all sites are shown as hatched marks.
Figure 3 with 1 supplement
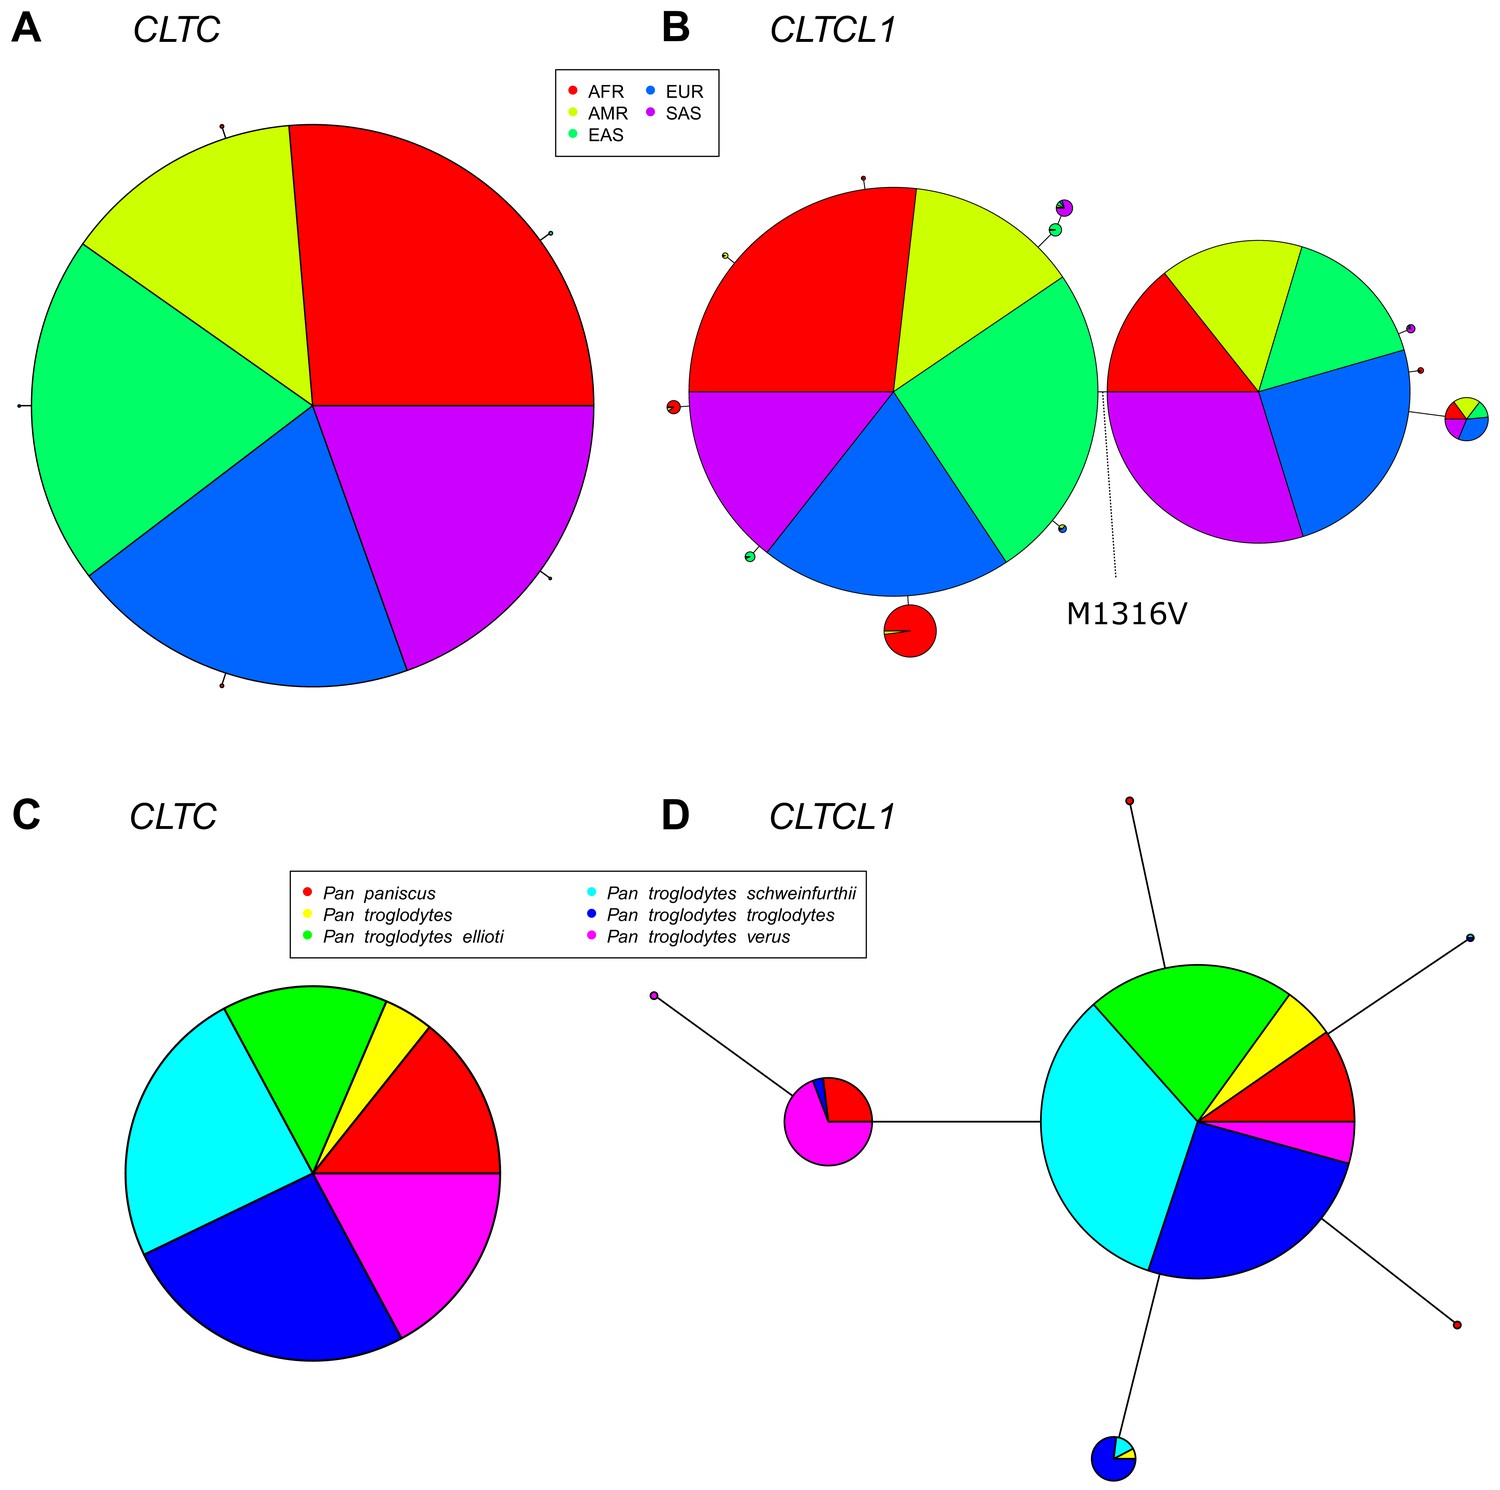
The CLTCL1 gene encoding human CHC22 has two major variants, and is highly polymorphic relative to the human CLTC gene encoding CHC17, with a similar pattern in chimpanzees.
Median joining network of human alleles for CLTC (A) and CLTCL1 (B) are shown. Each circle represents a unique allele whose global frequency is proportional to its circle’s size and the line length between circles is proportional to the number of non-synonymous changes between alleles. For CLTC, the least common alleles have a frequency ranging from 0.04% and 0.06% and the circles representing them were magnified by a factor of 10. For CLTCL1, only alleles with a frequency greater than 20% were plotted. The two major alleles show a combined frequency of 77% while the other alleles depicted in the figure have a frequency ranging from 0.44% to 5.67%. Segregation of the M1316V variation is depicted with a hashed line, with alleles carrying the M variant on the left-hand side, and alleles carrying the V variant on the right-hand side. The meta-populations in which the allele is found are indicated in color representing their percentage of the total frequency of the allele in humans. Meta-populations analyzed are African (AFR), American (AMR), East Asian (EAS), European (EUR), South Asian (SAS). (C–D) Median joining network of CLTC (C) and CLTCL1 (D) alleles for chimpanzees (Pan troglodytes, four identified subspecies and one unidentified) and bonobos (Pan paniscus). The species and subspecies in which each variant is found are indicated in color representing their percentage of the of the total frequency of the variant in chimpanzees and bonobos.
Figure 3—figure supplement 1
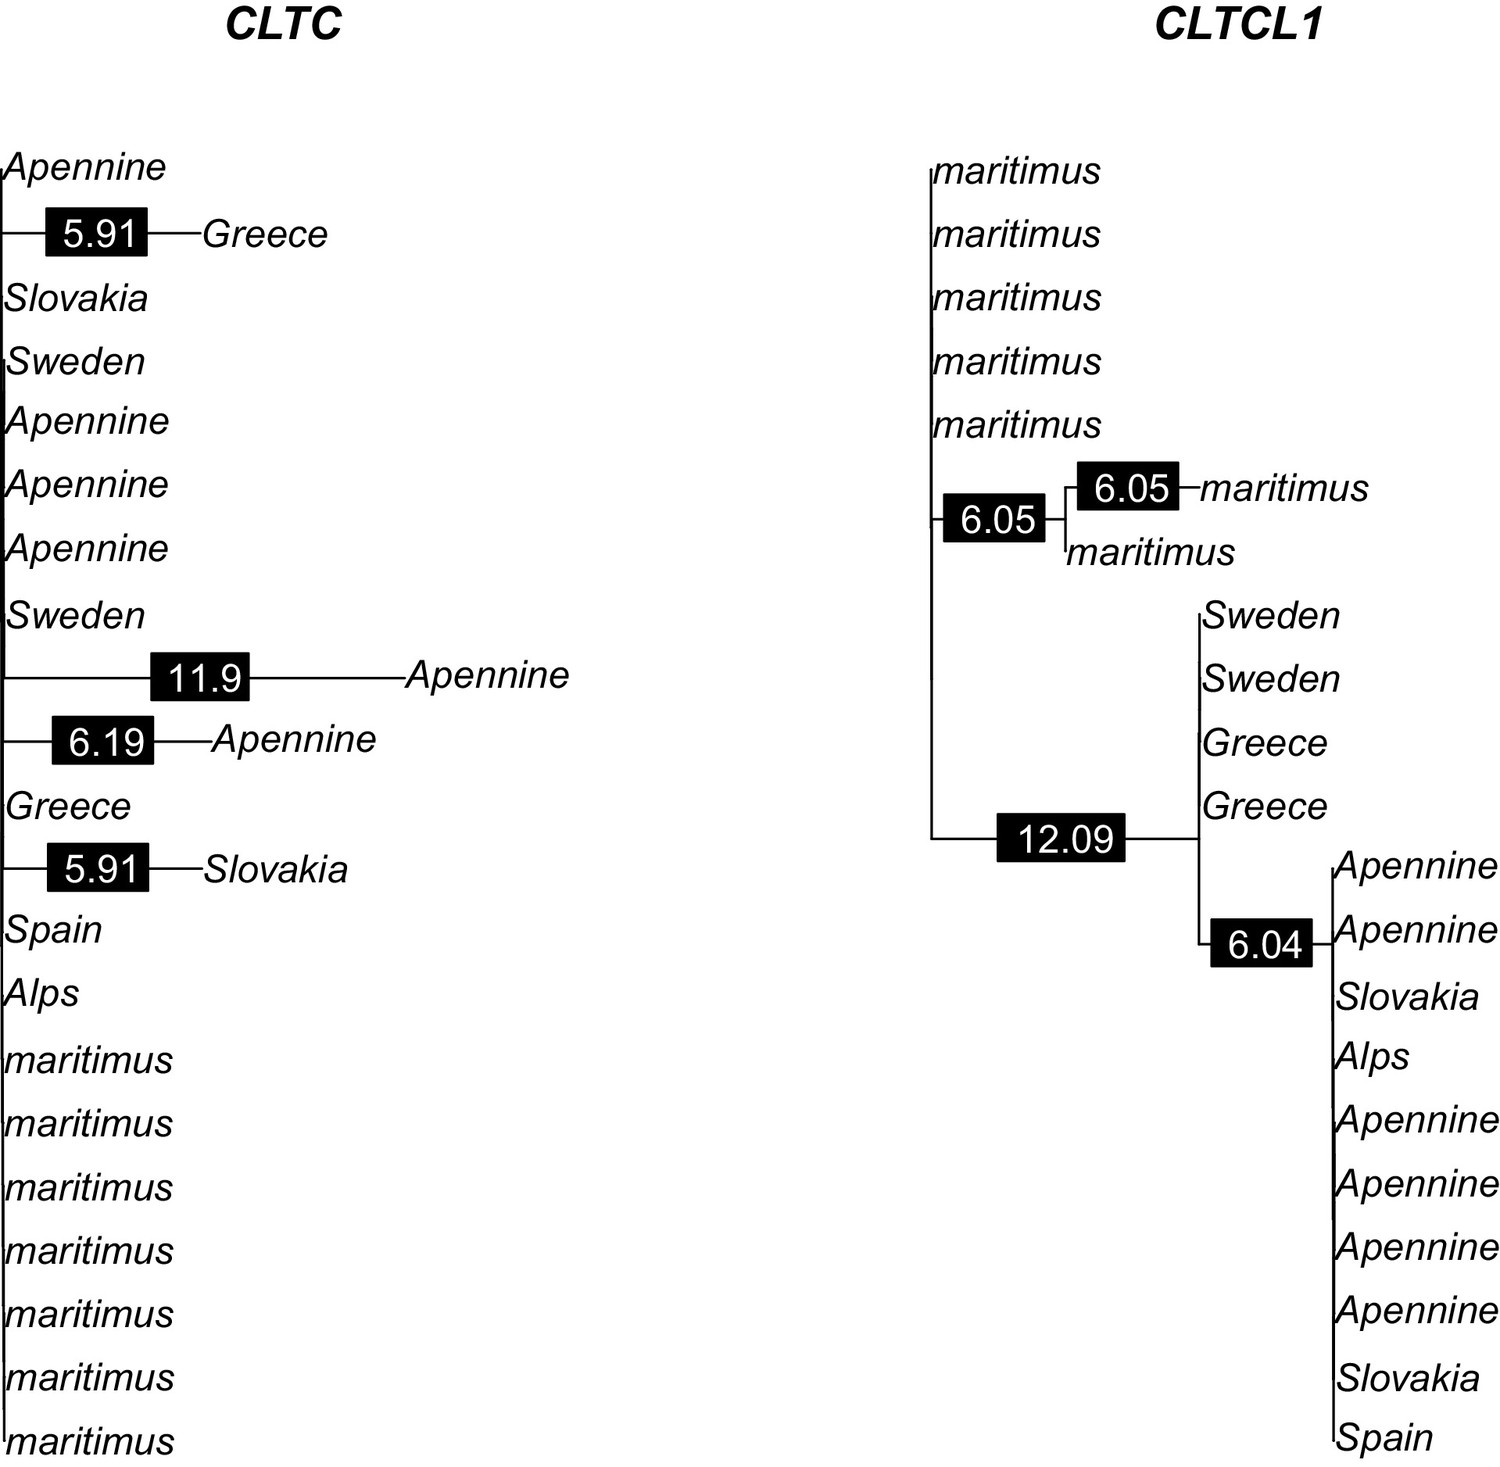
Phylogenetic trees of amino acid sequences for CLTC and CLTCL1 in the bear samples analyzed.
Polar bear samples are labeled as ‘maritimus’ while brown bear samples are labeled by the sampling country. Branch labels indicate branch lengths in 1/10,000 units.
Figure 4 with 3 supplements
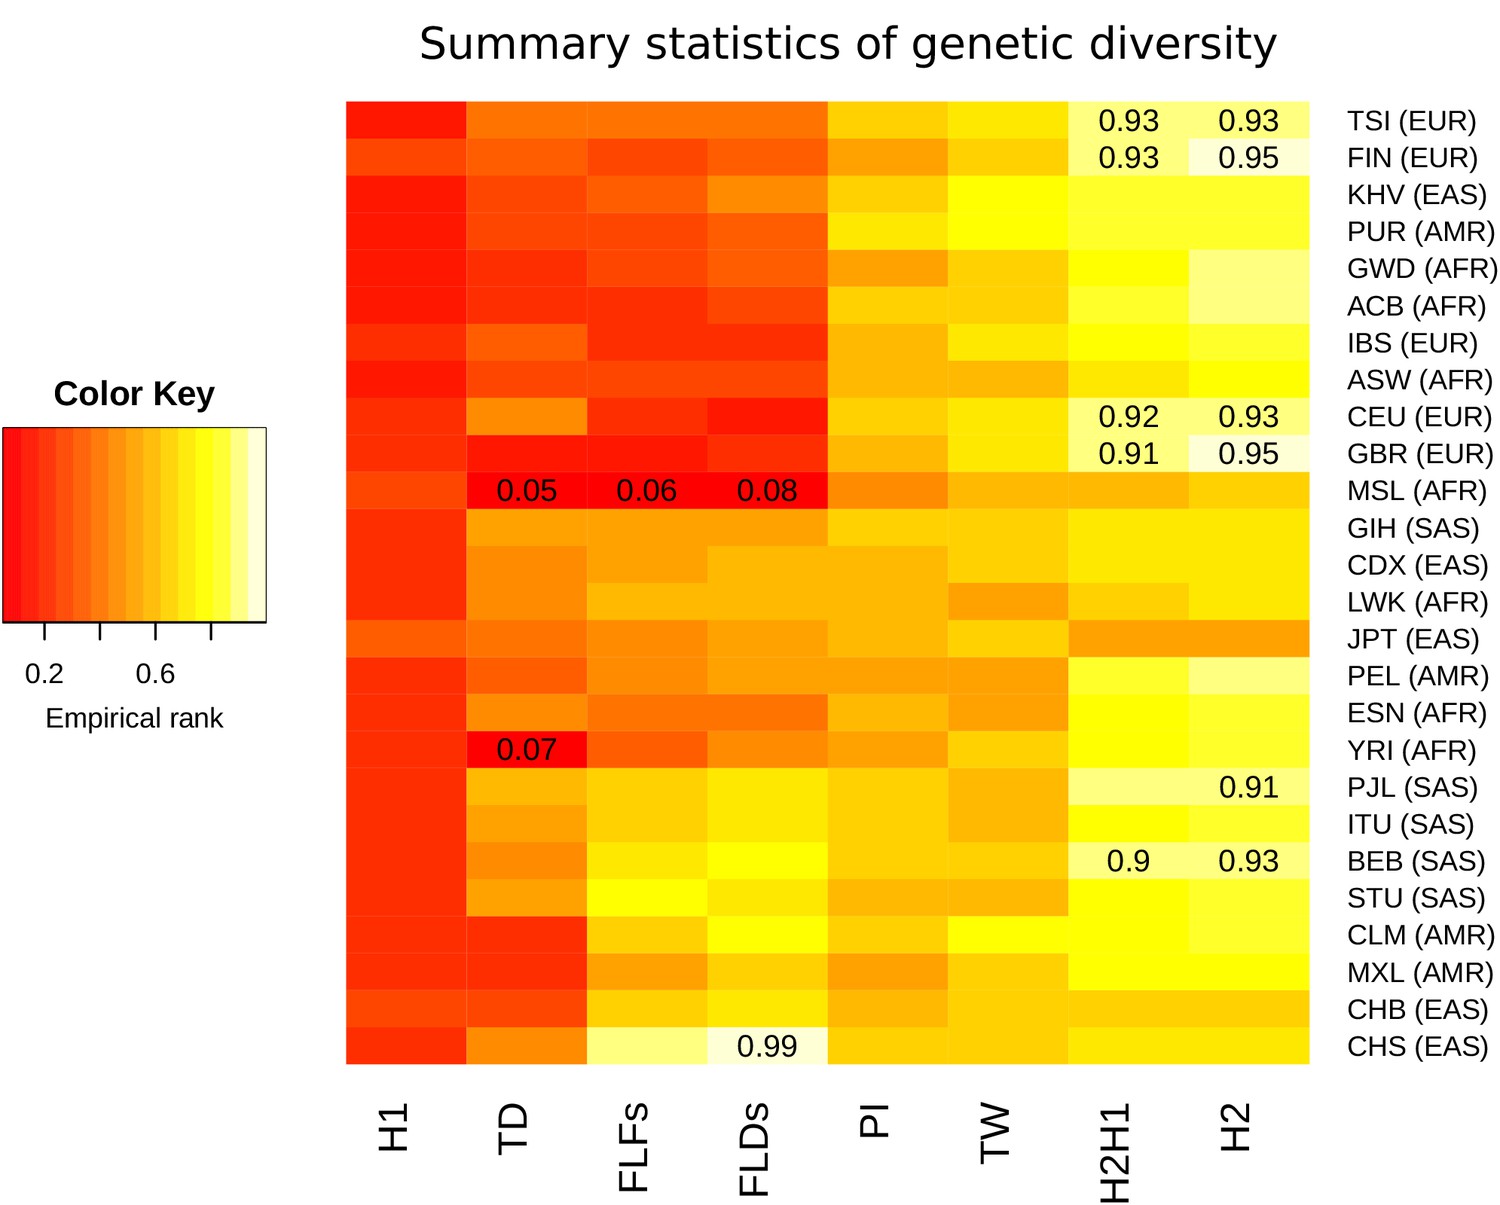
Summary statistics for genetic diversity of CLTCL1 indicate selection over neutral variation.
For each human population (on the rows) we calculated several summary statistics to analyze diversity (on the columns, defined in Materials and methods) and reported their percentile rank against their corresponding empirical distribution based on 500 control genes. The resulting matrix was then sorted on both axes as a dendrogram (not reported) based on the pairwise distances between each pair of populations. The populations analyzed, with their abbreviations, are listed in Supplementary file 1a, and the inclusive meta-population is indicated in parentheses, defined as in the legend to Figure 3. As depicted in the color legend, red and yellow denote low and high percentile ranks, respectively. Percentiles lower than 0.10 or greater than 0.90 are given in the corresponding cell.
Figure 4—figure supplement 1
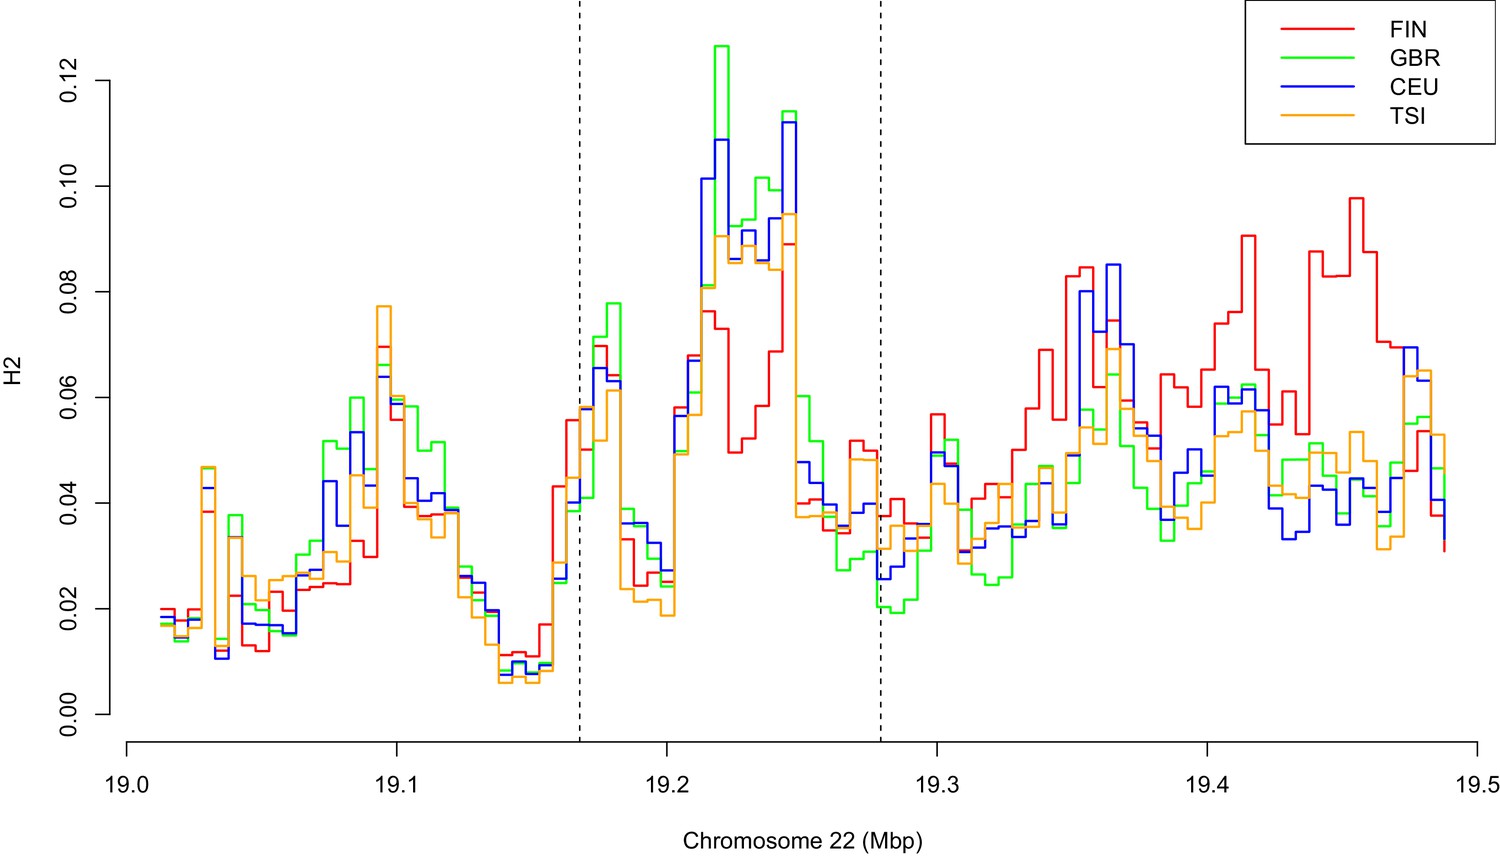
Variation of H2 statistics along a genomic region surrounding CLTCL1 in four European populations, with abbreviations as defined in Supplementary file 1a.
Each window has a size of 20 kbp and step is five kbp.
Figure 4—figure supplement 2

Geographical distribution of M1316- and V1316-encoding alleles across human populations in the HGDP-CEPH panel data set.
The ancestral allele T refers to amino acid M, while the derived nucleotide C refers to V.
Figure 4—figure supplement 3
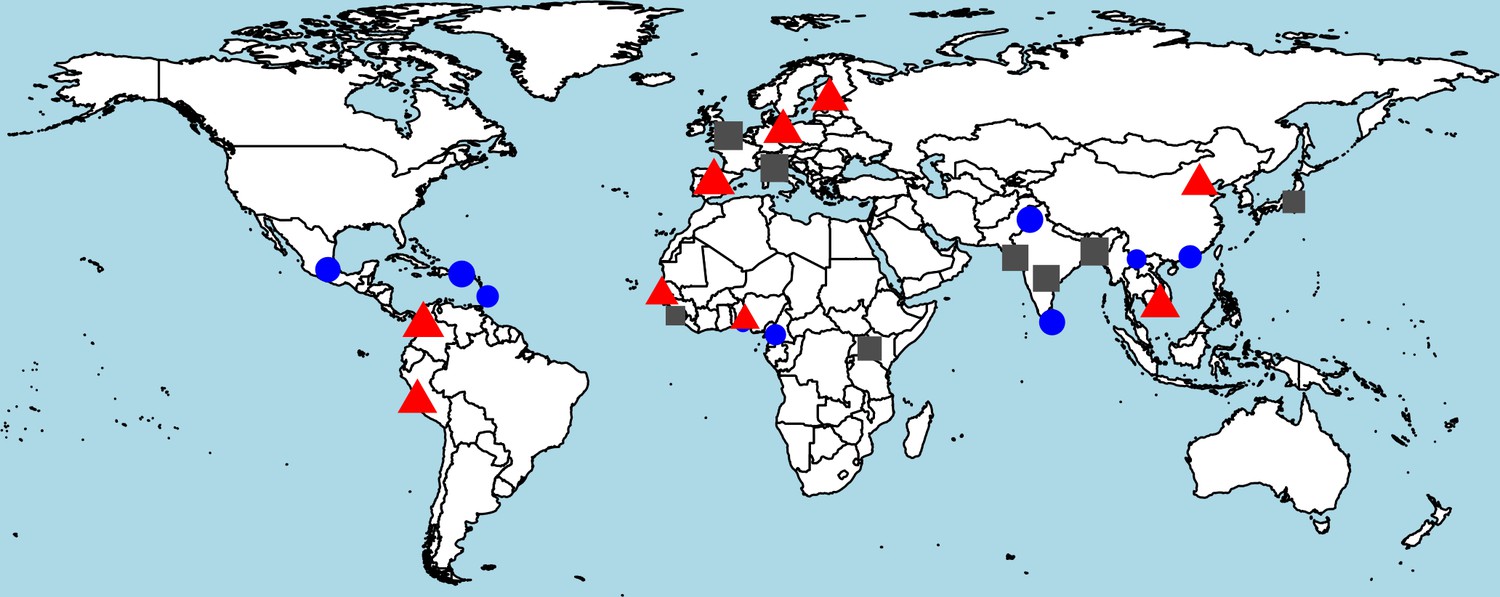
Worldwide distribution of heterozygosity of M1316- and V1316-encoding alleles.
A red triangle indicates an excess of heterozygosity (third tertile of the ratio between observed and expected heterozygosity), a blue circle a deficiency of heterozygosity (first tertile), and a gray square otherwise. The size of each symbol is proportional to the frequency of heterozygous genotypes.
Figure 5
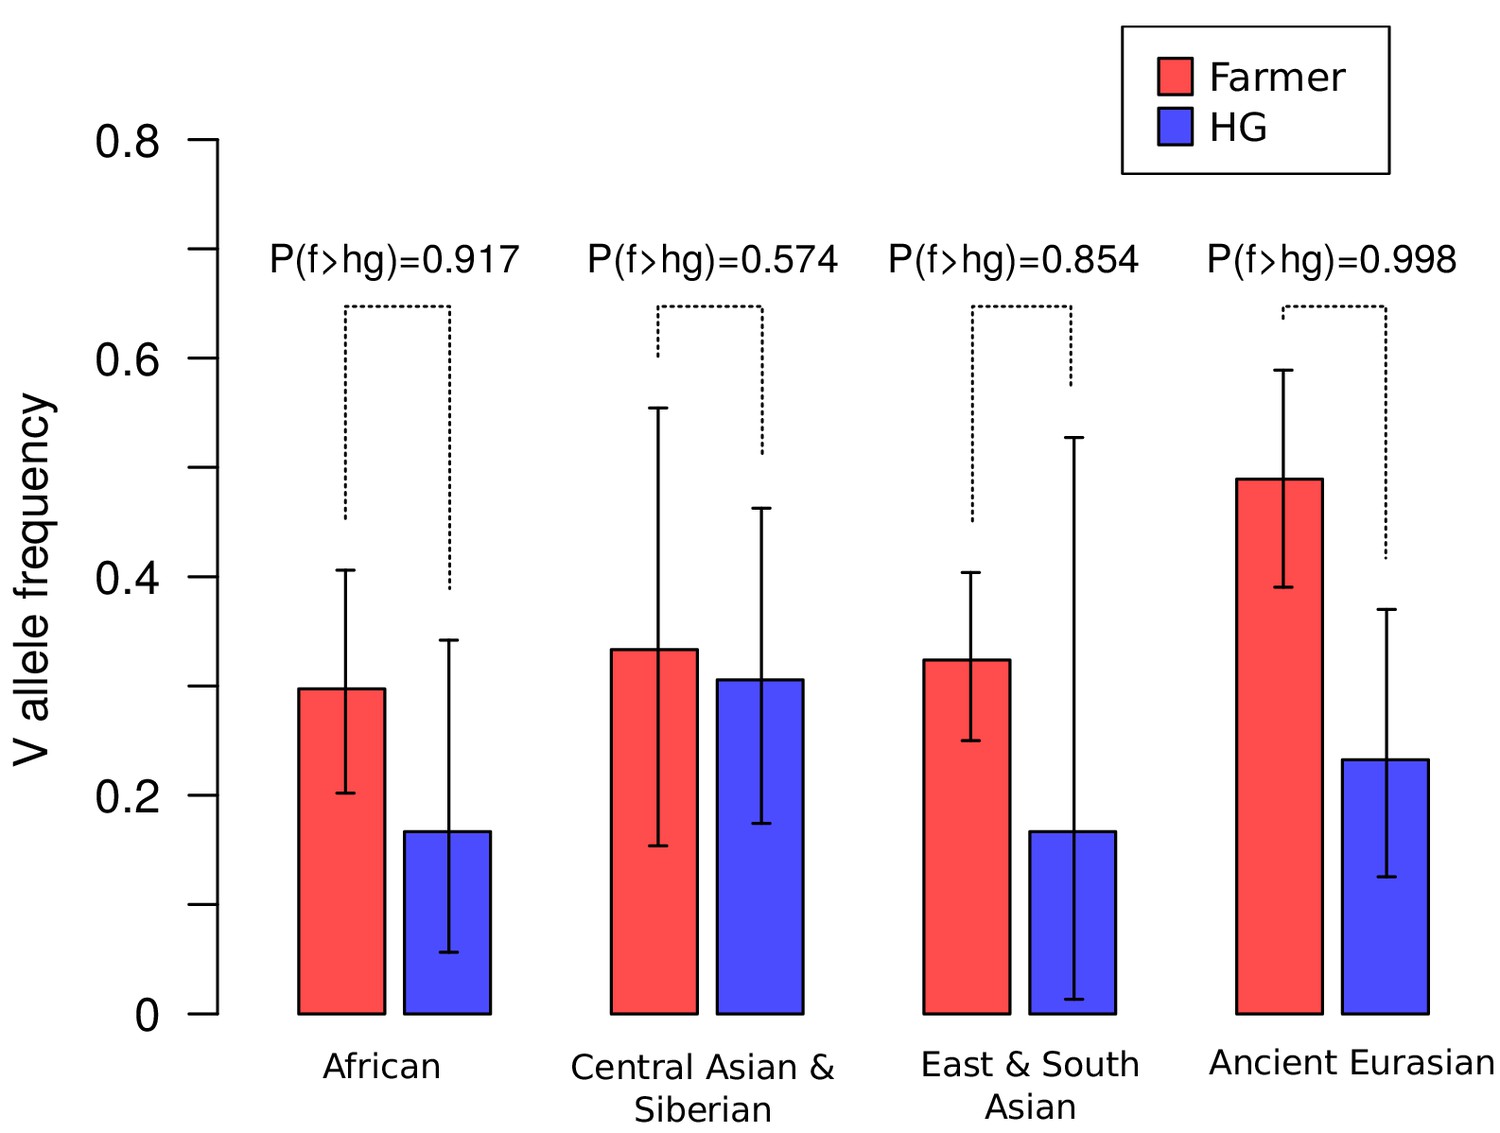
Frequencies of the V1316 variant of CHC22 trend higher in populations of farmers compared to hunter-gatherers.
Maximum a posteriori estimates and 95% highest posterior density credible intervals of the frequency of V1316 are compared for modern and ancient hunter-gatherer (HG) and farmer populations indigenous to three continents. Probability of the V allele being at a higher frequency in farmers, labeled as P(f > hg), is also reported.
Figure 6

Modeling of the structural changes in clathrin caused by the methionine-valine dimorphism at residue 1316 predicts conformational alteration.
Model of the CHC17 clathrin lattice (A) is reproduced with permission (Fotin et al., 2004) with the region comprising residue 1316 boxed. Panel B (top part) is the magnified boxed region in A with a CHC22-M1316 model (residues 1210 to 1516) docked into one of the four clathrin heavy chains (CHC-1) forming the edge of the lattice. The black arrow shows the location of the amino acid residue 1316 with the side chain highlighted in CHC-1. The density of the other three CHCs is indicated. Computational models of human CHC22 (residues 1210 to 1516) with either Met or Val at position 1316 (B, lower parts). The yellow circle encloses space opened by reducing the side chain size, which would require a shift in CHC torque to regain structurally favorable side chain contacts.
© 2004, Springer Nature. All Rights Reserved. Panel A reproduced, with permission, from Fotin et al. (2004).
Figure 7
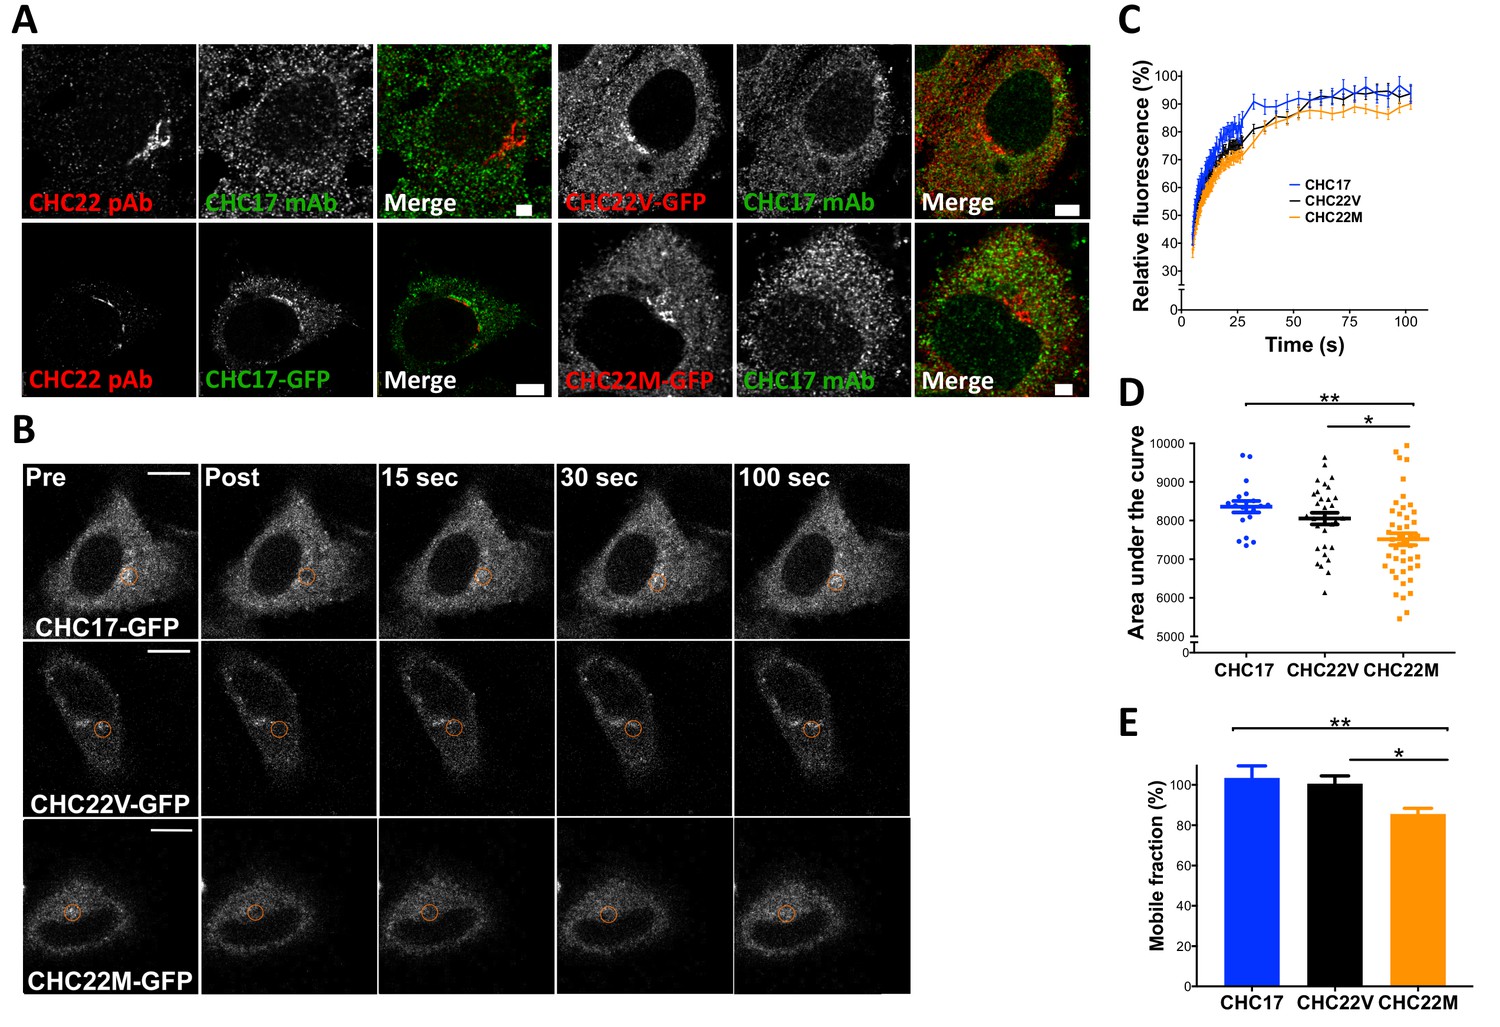
The CHC22-M1316 and CHC22-V1316 allotypes have different dynamics of membrane association, as measured by fluorescence recovery after photobleaching (FRAP).
HeLa cells were transfected with CHC22-M1316-GFP (CHC22M) or CHC22-V1316-GFP (CHC22V) or CHC17-GFP and the expressed constructs were localized relative to endogenous CHC22 and CHC17, which were also compared to each other (A). Endogenous CHC22, CHC17 and the transfected proteins were visualized by immunofluorescence with anti-CHC22 rabbit polyclonal antibody (pAb, red), anti-CHC17 mouse monoclonal antibody (mAb, green) and anti-GFP chicken polyclonal antibody (green for CHC17-GFP or red for CHC22-GFP), respectively. Bars represent 3 μm (untransfected and CHC22M-GFP) and 5 μm (CHC22V-GFP and CHC17-GFP). Transfectants were photobleached in the circular region indicated (B) and recovery of fluorescence (FRAP) was visualized over time (bars, 10 μm) and quantified within the bleached regions (C). For the data in (C), area under the curves (D) and mobile fractions Mf (E) were calculated (Lippincott-Schwartz et al., 2001). We performed a one-way analysis of variance (ANOVA) with Tukey’s multiple comparison post-hoc test: * p-value<0.05, ** p-value<0.01.
-
Figure 7—source data 1
FRAP experiment data set 1.
- https://doi.org/10.7554/eLife.41517.016
-
Figure 7—source data 2
FRAP experiment data set 2.
- https://doi.org/10.7554/eLife.41517.017
-
Figure 7—source data 3
FRAP experiment data set 3.
- https://doi.org/10.7554/eLife.41517.018
Figure 8
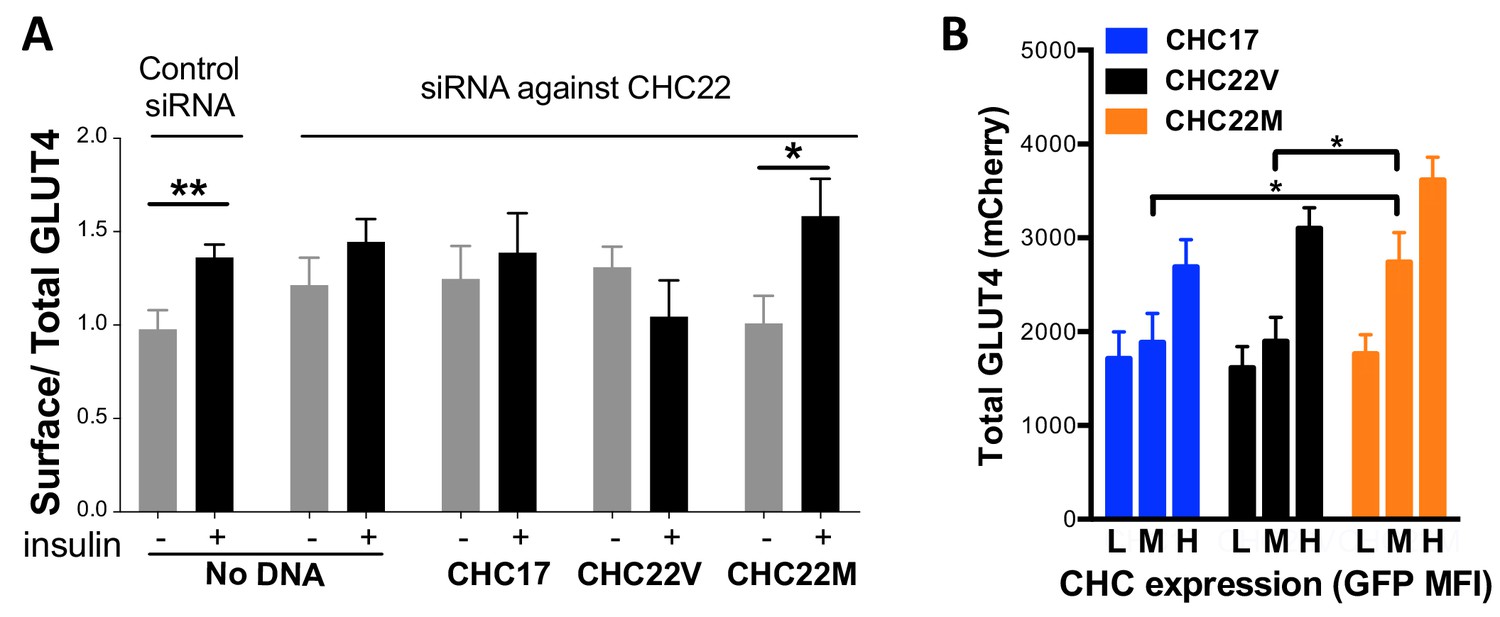
Differences in intracellular GLUT4 sequestration and stability occur in cells expressing the CHC22-M1316 or CHC22-V1316 allotypes.
HeLa cells were treated with siRNA to deplete endogenous CHC22 or with control siRNA, then transfected to co-express HA-GLUT4-mCherry along with CHC17-GFP (CHC17), CHC22-M1316-GFP (CHC22M) or CHC22-V1316-GFP (CHC22V) (A and B). Total levels of expressed GLUT4 and CHC were measured by FACS (mean fluorescence intensity (MFI) for mCherry or GFP, respectively). Surface levels of GLUT4 were measured with anti-HA antibody at basal conditions (-) or after 30 min of exposure to insulin (+) and surface/total GLUT4 is reported as a measure of GLUT4 translocation to the cell surface (A) in cells expressing equivalent total levels of CHC-GFP. The extent of GLUT4 translocation was assessed in each experimental group before and after insulin stimulation; Student t-test, * p-value<0.05. Transfected cells treated with siRNA to deplete endogenous CHC22, but not treated with insulin, were gated into thirds expressing equivalently low (L), medium (M) and high (H) levels of CHC-GFP for each type of CHC, then total levels of HA-GLUT4-mCherry in each population were plotted (B). We performed a one-way analysis of variance (ANOVA) with Tukey’s multiple comparison post-hoc test: * p-value<0.05.
-
Figure 8—source data 1
GLUT4 translocation experiment.
- https://doi.org/10.7554/eLife.41517.020
-
Figure 8—source data 2
Total GLUT4-mCherry levels.
- https://doi.org/10.7554/eLife.41517.021
Author response image 1

Author response image 2

Tables
Key resources table
| Reagent type (species) or resource | Designation | Source or reference | Identifiers | Additional information |
|---|---|---|---|---|
| Cell line (human) | HeLa | ATCC | Cat. #: CCL-2; RRID:CVCL_0030 | |
| Antibody | Mouse monoclonal anti-CHC17 (X22) | Frances Brodsky PMID: 2415533 | IF (5 mg/mL) | |
| Antibody | Mouse monoclonal anti-CHC17 (TD.1) | Frances Brodsky PMID: 1547490 | WB (1.3 mg/mL) | |
| Antibody | Rabbit polyclonal anti-CHC22 (SHL-KS) | Frances Brodsky PMID: 29097553 | WB (0.4 mg/mL) | |
| Antibody | Mouse monoclonal anti-β-actin (AC-15) | Sigma | Cat. #: A1978; RRID:AB_476692 | WB (1:2000) |
| Antibody | Purified anti-HA.11 (16B12) | Covance | Cat. #: MMS-101P; RRID:AB_10064068 | |
| Antibody | Rabbit polyclonal anti-CHC22 | Proteintech | Cat. #: 22283–1-AP; RRID:AB_11183764 | |
| Antibody | Goat anti-rabbit IgG coupled to HRP | ThermoFisher Scientific | Cat. #: 172–1019 | WB (1:8000) |
| Antibody | Goat anti-mouse IgG coupled to HRP | ThermoFisher Scientific | Cat. #: 170–6516 | WB (1:8000) |
| Antibody | Anti-mouse IgG1 coupled to Brilliant Violet 421 (RMG1-1) | Biolegend | Cat. #: 406616; RRID:AB_2562234 | FC (1:200) |
| Recombinant DNA reagent | HA-GLUT4-mCherry | This paper | Generated from HA- GLUT4-GFP (gift from Dr Tim McGraw, PMID: 11058093) | |
| Recombinant DNA reagent | CHC22V (pEGFP-C1-GFP-CHC22V) | Frances Brodsky PMID: 20065094 | ||
| Recombinant DNA reagent | CHC22M (pEGFP-C1-GFP-CHC22M) | This paper | Generated by Quick change mutagenesis from CHC22V | |
| Recombinant DNA reagent | CHC17 (pEGFP-C1-GFP-CHC17) | Frances Brodsky PMID: 29097553 | ||
| Sequence-based reagent | AllStars Negative Control siRNA | Qiagen | Cat. #: SI03650318 | |
| Commercial assay or kit | Quick change mutagenesis | New England Biolabs, USA | Cat. #: E0554S | |
| Commercial assay or kit | BCA | Pierce | Cat. #: 23225 | |
| Commercial assay or kit | Western Lightning Chemilumi-nescence Reagent | GE Healthcare | Cat. #: RPN2209 | |
| Chemical compound, drug | JetPrime transfection reagent | PolyPlus | Cat. #: 114–07 | |
| Chemical compound, drug | Insulin | Sigma | Cat. #: I9278 | |
| Chemical compound, drug | Bovine serum albumin (BSA) | Sigma | Cat. #: A7906 | |
| Software, algorithm | FlowJo | Treestar | ||
| Software, algorithm | ImageJ | NIH | ||
| Software, algorithm | Prism | Graphpad | ||
| Software, algorithm | R | R Project | Packages: pegas, Smisc, gplots | |
| Other | CellView glass bottom culture dish | Greiner Bio-one | Cat. #: 627860 | |
| Other | Nitrocellulose membrane | Biorad | Cat. #: 1620112 |
Additional files
-
Supplementary file 1
Human population genetics data.
(a) Human populations from the 1000 Genomes Project analyzed with their abbreviation. (b) Human alleles for the coding region of CLTCL1 extracted from the 1000 Genomes project data set. For each unique allele (hap_ID on the first column), the count of occurrences in each meta-population (EUR, EAS, AMR, SAS, AFR defined as in the legend to Figure 3), archaic humans (Altai Neanderthal and Denisovan) and modern chimpanzees is reported. Columns numbered 1–46 indicate the nucleotide sequence at all retrieved SNPs present in each allele. Hap-1 is the most frequent allele encoding M1316 in CHC22 and Hap-2 is the most frequent allele encoding V1316 in CHC22. (c) Functional annotation for each coding polymorphism of CLTCL1 reported in Supplementary file 1b. Columns represent chromosome, genomic position, SNP ID, reference allele, alternate allele and functional impact. (d) Archaic and ancient human M1316V genotypes retrieved. Genotype likelihoods and sources for each sample are reported.
- https://doi.org/10.7554/eLife.41517.022
-
Supplementary file 2
Summary statistics and tests for neutrality.
(a) Summary statistics of genetic diversity for CLTCL1 calculated for all analyzed human populations. Abbreviations for summary statistics (on the columns) are reported in Materials and methods while abbreviations for populations (POP, on the rows) are listed in Supplementary file 1a. (b) List of 500 control genes used to assess deviation from neutrality in the summary statistics of CLTCL1. (c) Expected and observed heterozygosity for M1316 and V1316 for all analyzed human populations. For each population (Pop., on rows, with abbreviations described in Supplementary file 1a), the frequency of observed homozygous (Obs.Homo1 and Obs.Homo2) and heterozygous genotypes (Obs.Hetero), the corresponding expected values under Hardy-Weinberg equilibrium (Exp.Homo1, Exp.Homo2, Exp.Hetero), the ratio (RatioHetero) between observed and expected heterozygosity, and p-values for deviation from Hardy-Weinberg equilibrium (chi-squared test) are reported.
- https://doi.org/10.7554/eLife.41517.023
-
Supplementary file 3
Inferred allotypes for CHC22.
(a) Inferred CHC22 allotypes for great apes and human genome reference. For each unique allele (hap_ID on the first column), the frequency in each species or subspecies and the amino acid sequence at each numbered position in the encoded CHC22 allotype is reported. (b) Inferred CHC22 allotypes for chimpanzees and bonobos. For each unique allele (hap_ID on the first column), the frequency in each species or subspecies, and the amino acid sequence at each numbered position in the encoded CHC22 allotype is reported. (c) Differences in the amino acid sequences for CHC22 allotypes in bears. The first row depicts the species, while the second row is the originating country for each sample. All remaining rows are the numbered positions of the polymorphic sites in CHC22 encoded in brown bears and polar bears and indicate the amino acid is present in each sample’s sequence. Amino acids for the reference sequences of black bears, pandas and humans are also reported at these polymorphic positions.
- https://doi.org/10.7554/eLife.41517.024
-
Transparent reporting form
- https://doi.org/10.7554/eLife.41517.025
Download links
A two-part list of links to download the article, or parts of the article, in various formats.
Downloads (link to download the article as PDF)
Open citations (links to open the citations from this article in various online reference manager services)
Cite this article (links to download the citations from this article in formats compatible with various reference manager tools)
Genetic diversity of CHC22 clathrin impacts its function in glucose metabolism
eLife 8:e41517.
https://doi.org/10.7554/eLife.41517


