Biophysical mechanisms in the mammalian respiratory oscillator re-examined with a new data-driven computational model
- National Institute of Neurological Disorders and Stroke, National Institutes of Health, United States
- University of New Hampshire, United States
- Georgia State University, United States
Figures
Figure 1

Manipulations of in the and networks produce opposite effects on network activity amplitude (spikes/s) and frequency.
(A and B) Histograms of neuronal population activity amplitude in the , and networks with linearly increasing . (C) Plot of (% of the baseline mean value for the simulated population) vs. network activity amplitude for the and networks in A and B. (D) Plot of (%) vs. network frequency for the and networks in A and B. network parameters: , , and . network parameters: , , and .
Figure 2

Calcium source and -dependent effects on cellular properties regulating network frequency for the simulations presented in Figure 1.
(A) Average magnitude of in pacemaker neurons during the interburst interval for the (red) and (blue) networks. (B) Average inactivation ( of the burst generating current in pacemaker neurons immediately preceding each network burst as a function of (%) for the voltage-gated and synaptic calcium networks. network parameters: , , and . network parameters: , , and .
Figure 3
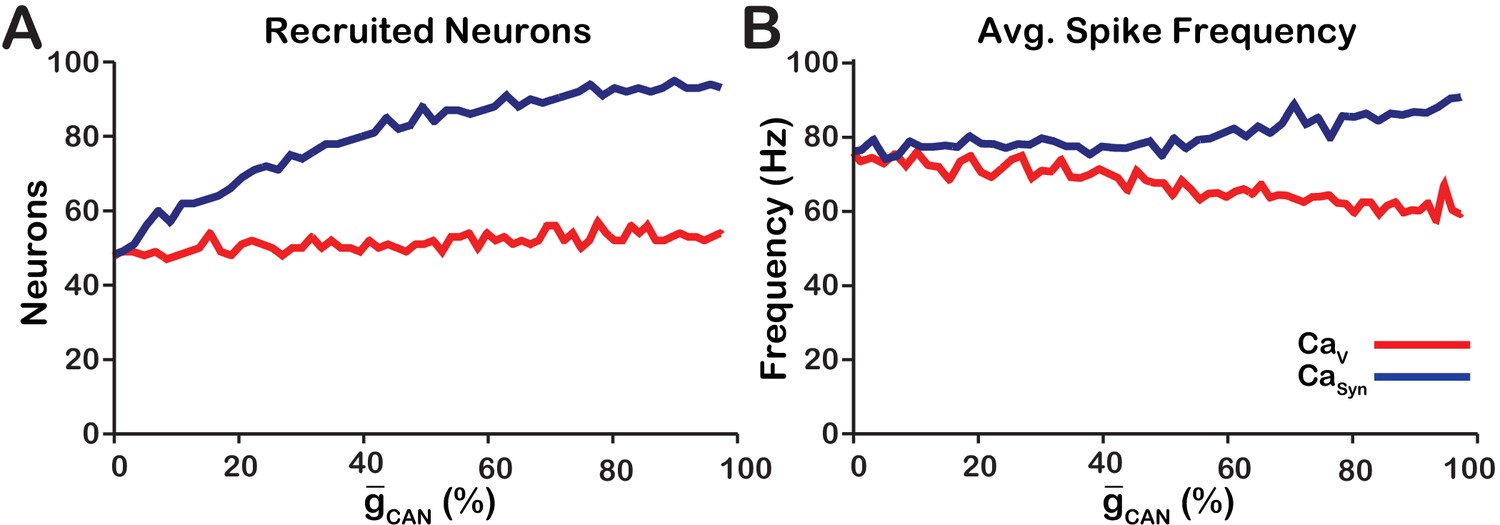
Calcium source and -dependent effects on cellular properties regulating network activity amplitude for the simulations presented in Figure 1.
(A) Number of recruited neurons in the modeled population of 100 neurons as a function of (%) for voltage-gated and synaptic calcium sources. The number of recruited neurons is defined as the peak number of spiking neurons per bin during a network burst. (B) Average spiking frequency of recruited neurons as a function of for the voltage-gated and synaptic calcium mechanism. Average spiking frequency is defined the number of spikes per bin divided by the number of recruited neurons. The parameters used in these simulations are: : , , and . : , , and .
Figure 4
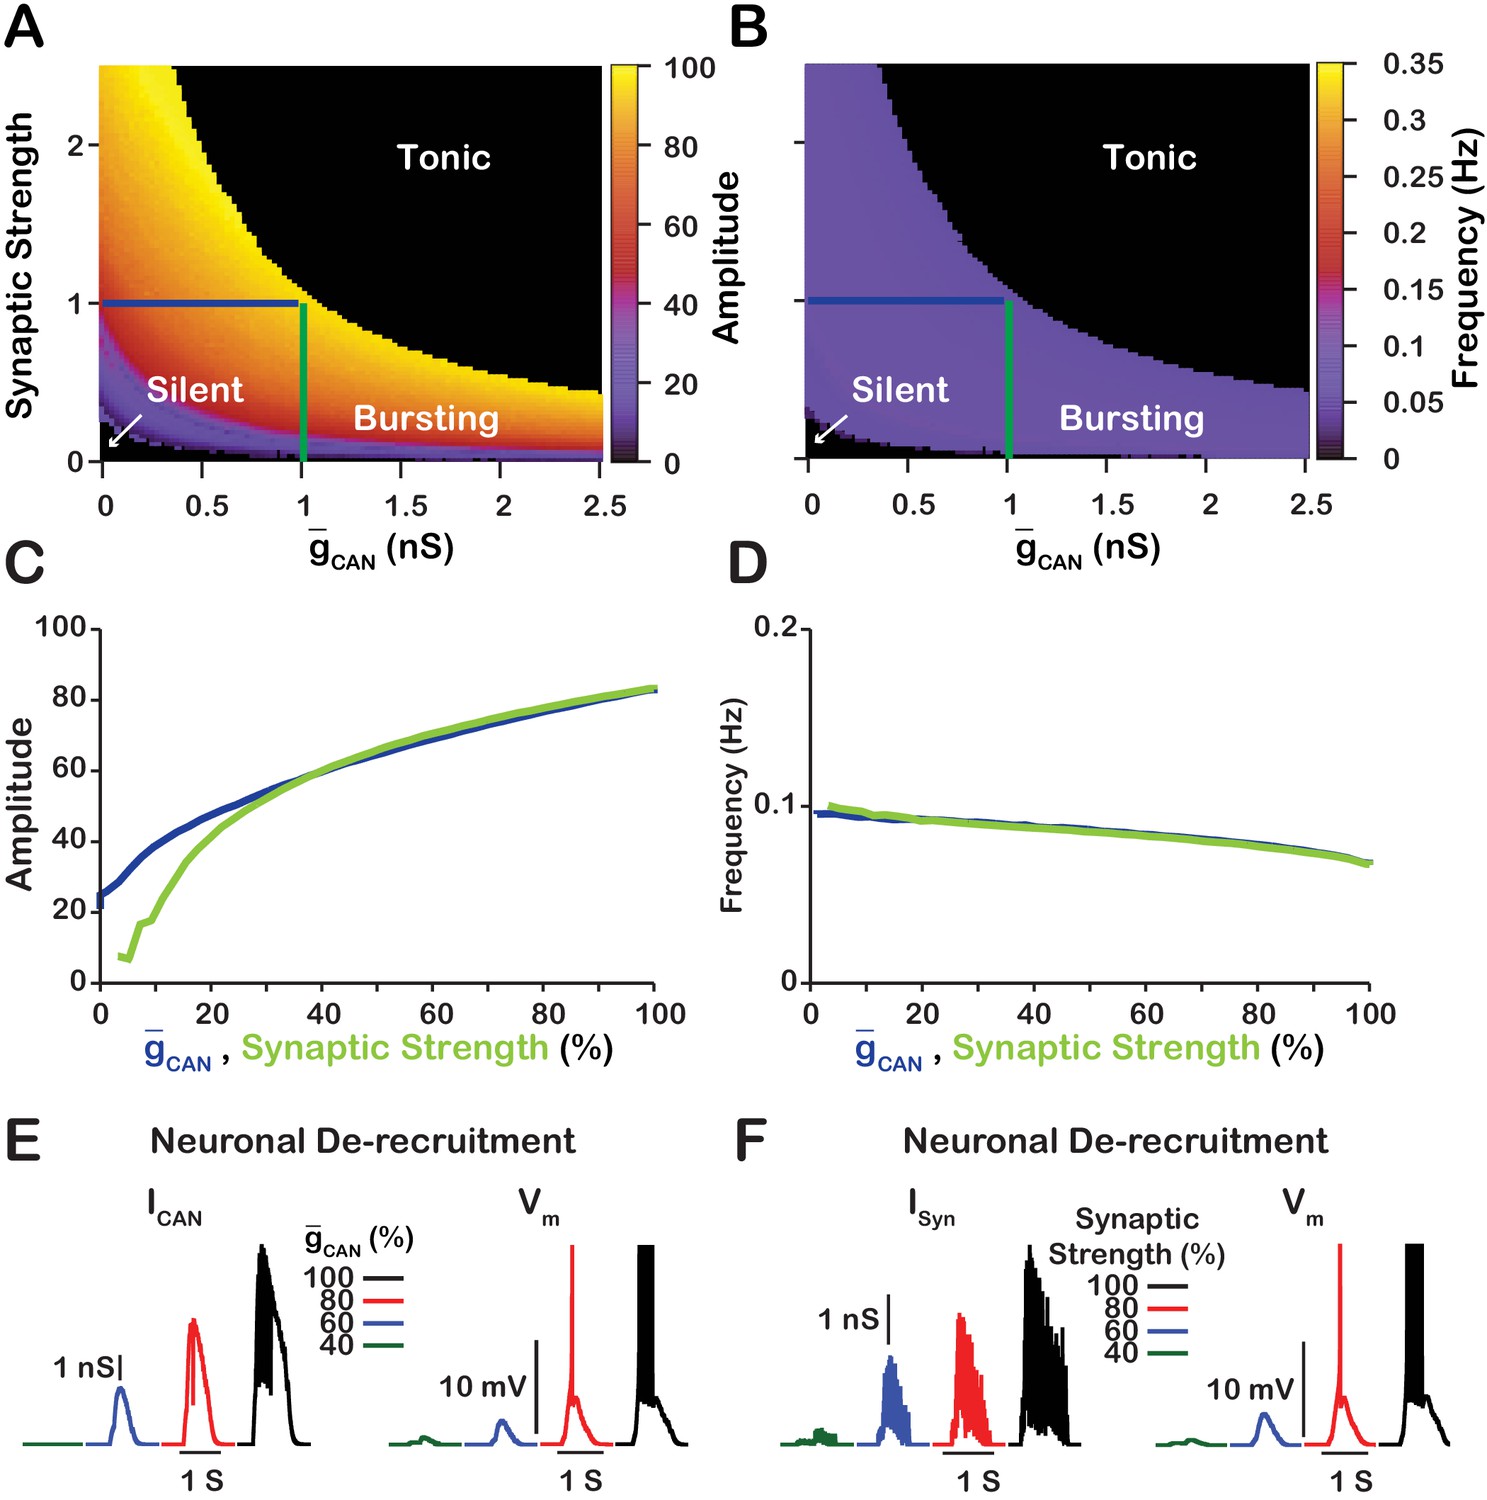
Manipulations of synaptic strength () and have equivalent effects on network activity amplitude, frequency and recruitment of inspiratory neurons not involved in rhythm generation.
(A and B) Relationship between (mean values for the simulated populations), synaptic strength and the amplitude and frequency in the network. Notice the symmetry about the X=Y line in panels A and B, which, indicates that changes in and or synaptic strength are qualitatively equivalent. Synaptic strength was changed by varying . (C) Relationship between network activity amplitude and the reduction of (blue) or synaptic strength (green). (D) Relationship between network frequency and the reduction of (blue) or synaptic strength (green). (E and F) Decreasing or synaptic strength de-recruits neurons by reducing the inspiratory drive potential, indicated by the amplitude of subthreshold depolarization, right traces. The solid blue and green lines in panels A and B represent the location in the 2D parameter space of the corresponding blue and green curves in C and D. The action potentials in the right traces of E and F are truncated to show the change in neuronal inspiratory drive potential. The parameters used for these simulations are : , , and .
Figure 5
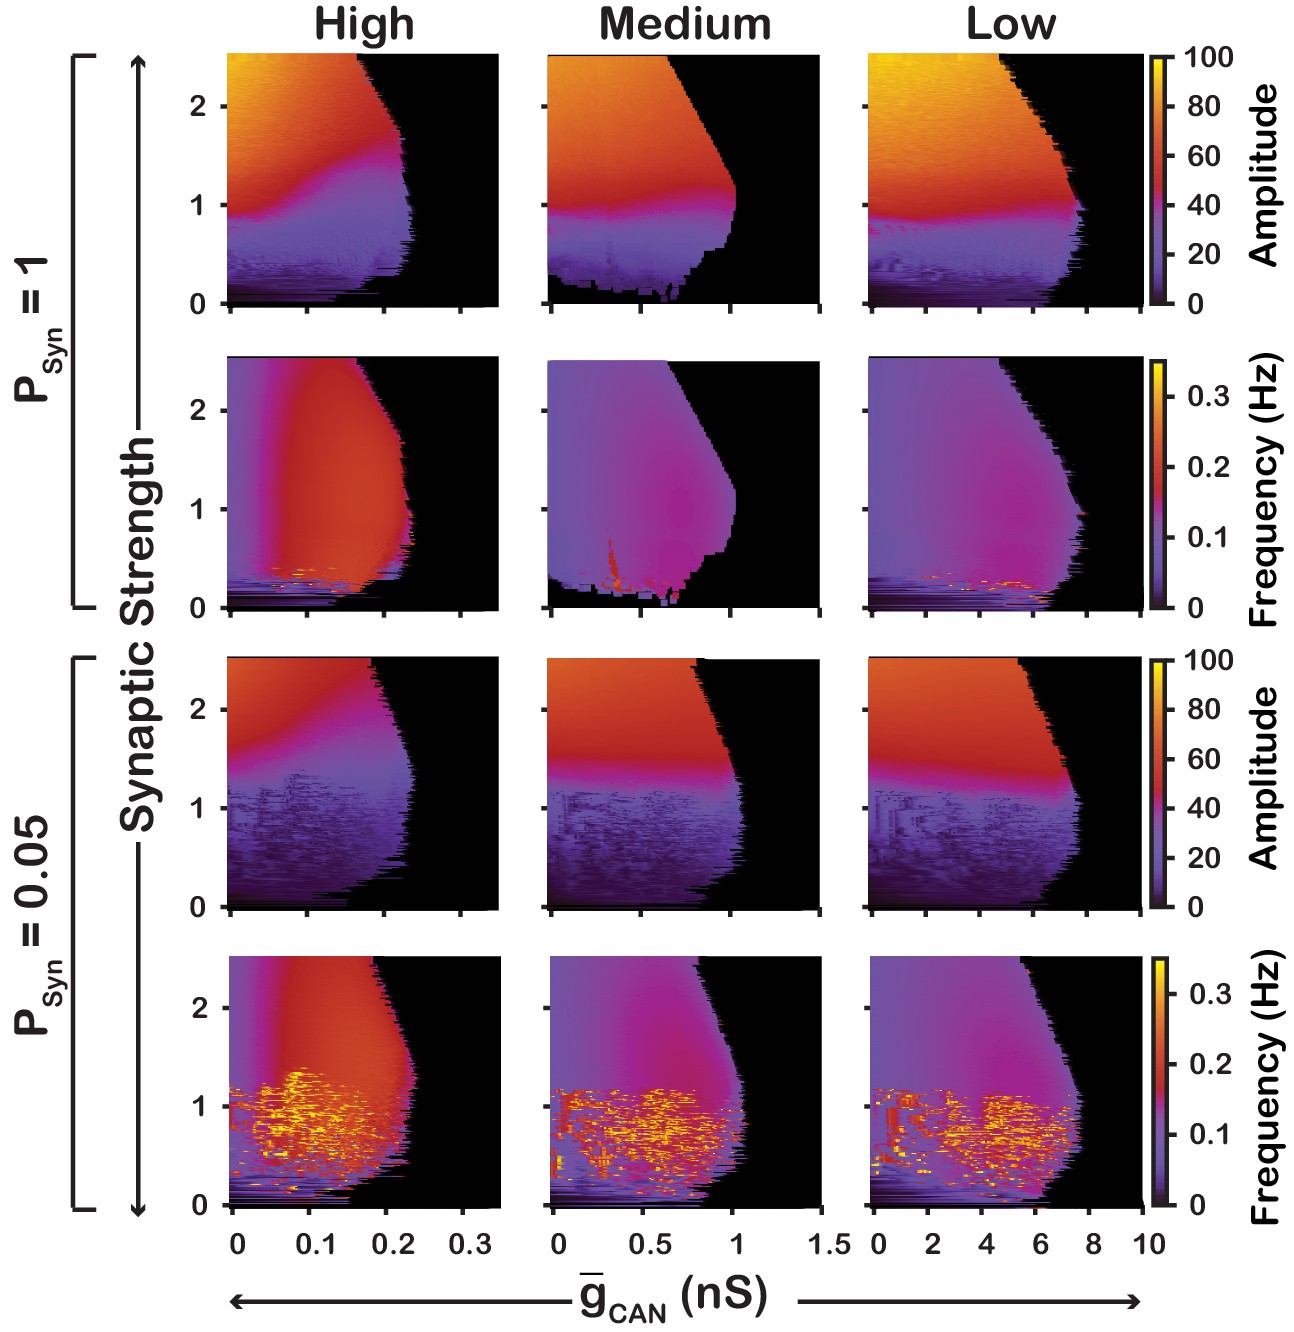
Robustness of amplitude and frequency effects to changes in and synaptic strength in the network for ‘high’ (left), ‘medium’ (middle) and ‘low’ (right) conductance of the voltage-gated calcium channel as well as ‘high’ (top) and ‘low’ (bottom) network connection probabilities.
Amplitude and frequency are indicated by color (scale bar at right). Black regions indicate tonic network activity. Values of indicated are the mean values for the simulated neuronal populations.
Figure 6
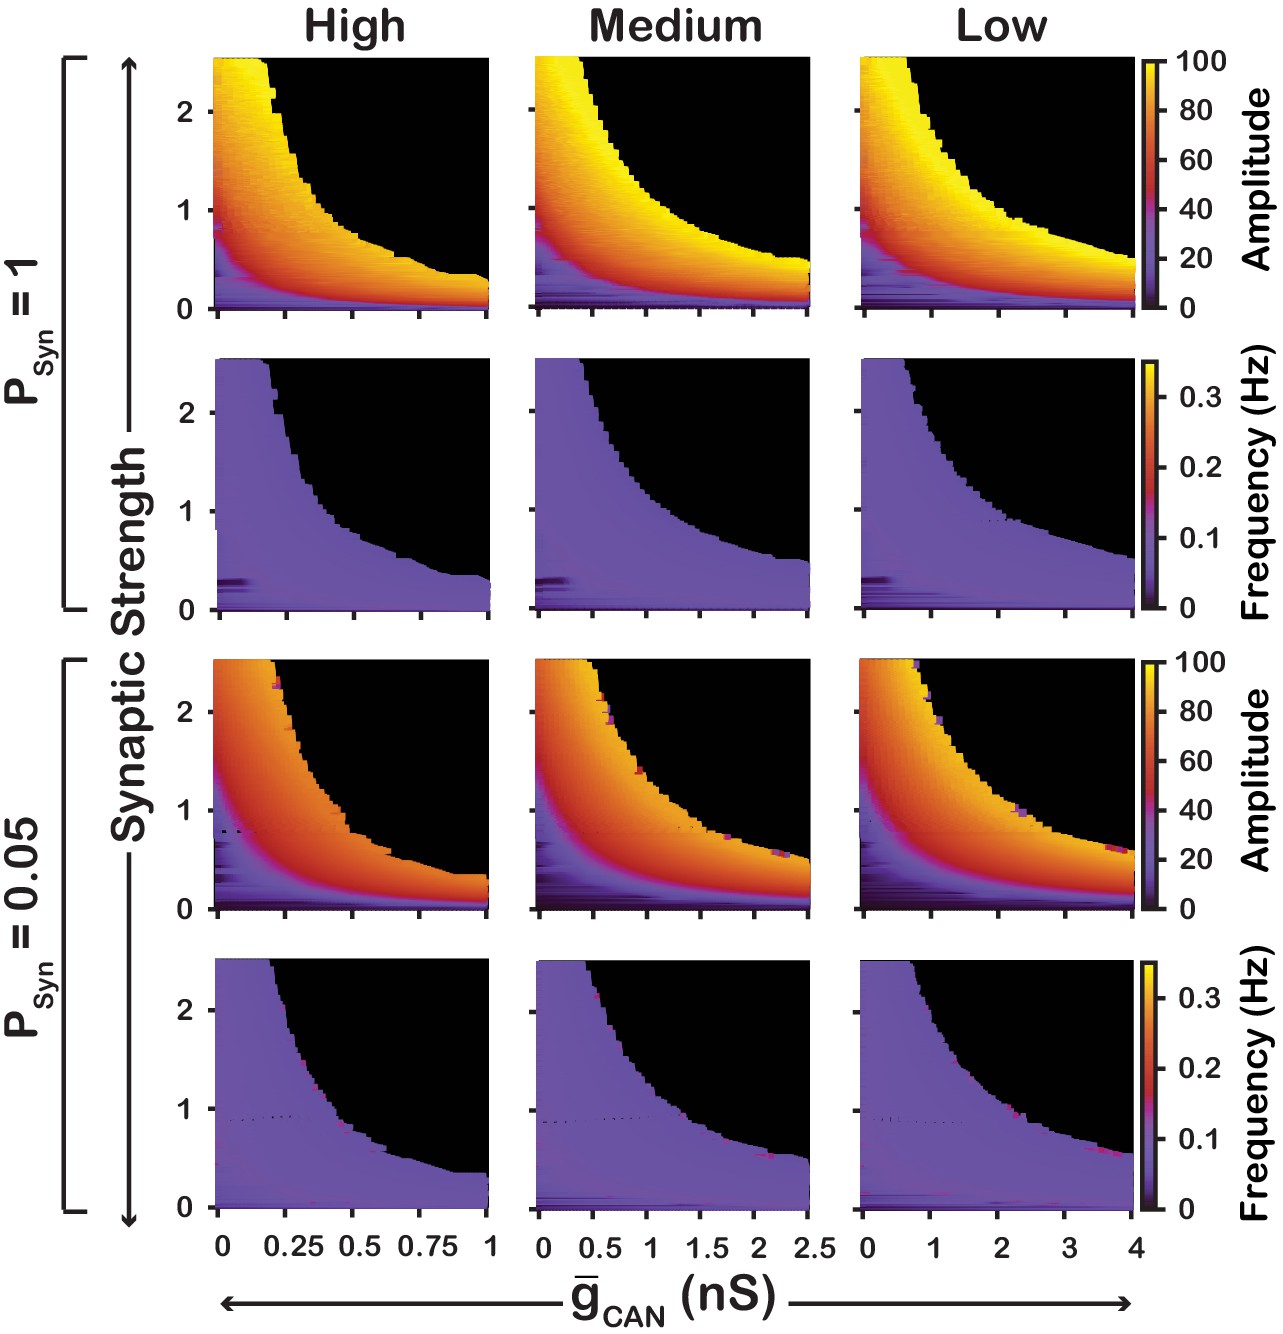
Robustness of amplitude and frequency effects to changes in and synaptic strength in the network for ‘high’ (left), ‘medium’ (middle) and ‘low’ (right) calcium conductance in synaptic currents as well as ‘high’ (top) and ‘low’ (bottom) network connection probabilities.
Amplitude and frequency are indicated by color (scale bar at right). Black regions indicate tonic network activity. Values of indicated are the mean values for the simulated neuronal populations.
Figure 7
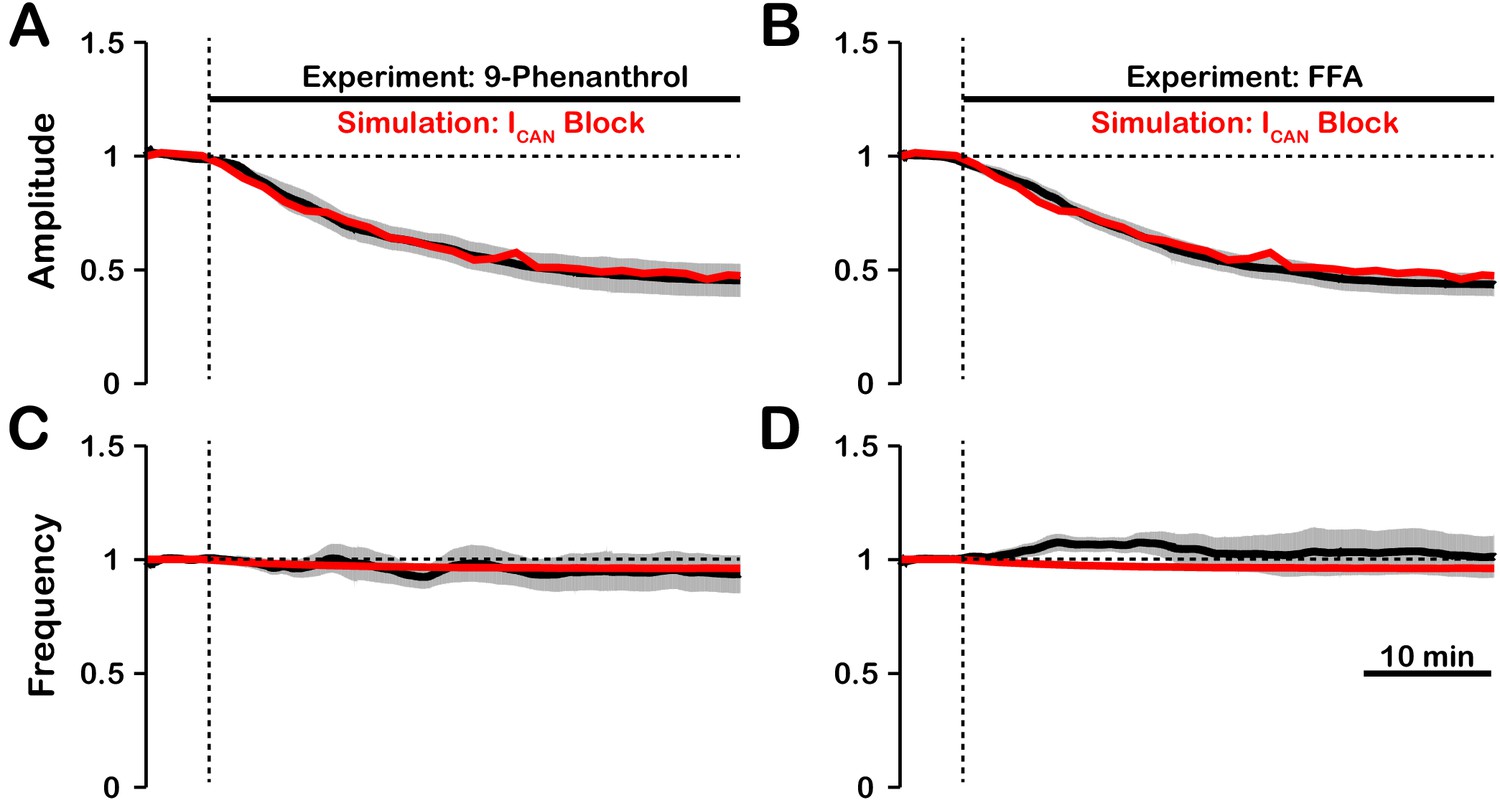
Experimental and simulated pharmacological blockade of by (A and C) 9-phenanthrol and (B and D) flufenamic acid (FFA).
Both voltage-gated and synaptic sources of intracellular calcium are included. Experimental blockade of (black) by 9-phenanthrol and FFA significantly reduce the (A and B) amplitude of network oscillations while having little effect on (C and D) frequency. The black line represents the mean and the gray band is the S.E.M. of experimental integrated XII output recorded from neonatal rat brainstem slices in vitro, reproduced from Koizumi et al., 2018. Simulated blockade of (red) closely matches the reduction in (A and B) amplitude of network oscillations and slight decrease in (C and D) frequency seen with 9-phenanthrol and FFA. Simulated and experimental blockade begins at the vertical dashed line. Blockade was simulated by exponential decay of with the following parameters: 9-phenanthrol: , ; FFA: , . The network parameters are: , , and .
Figure 8
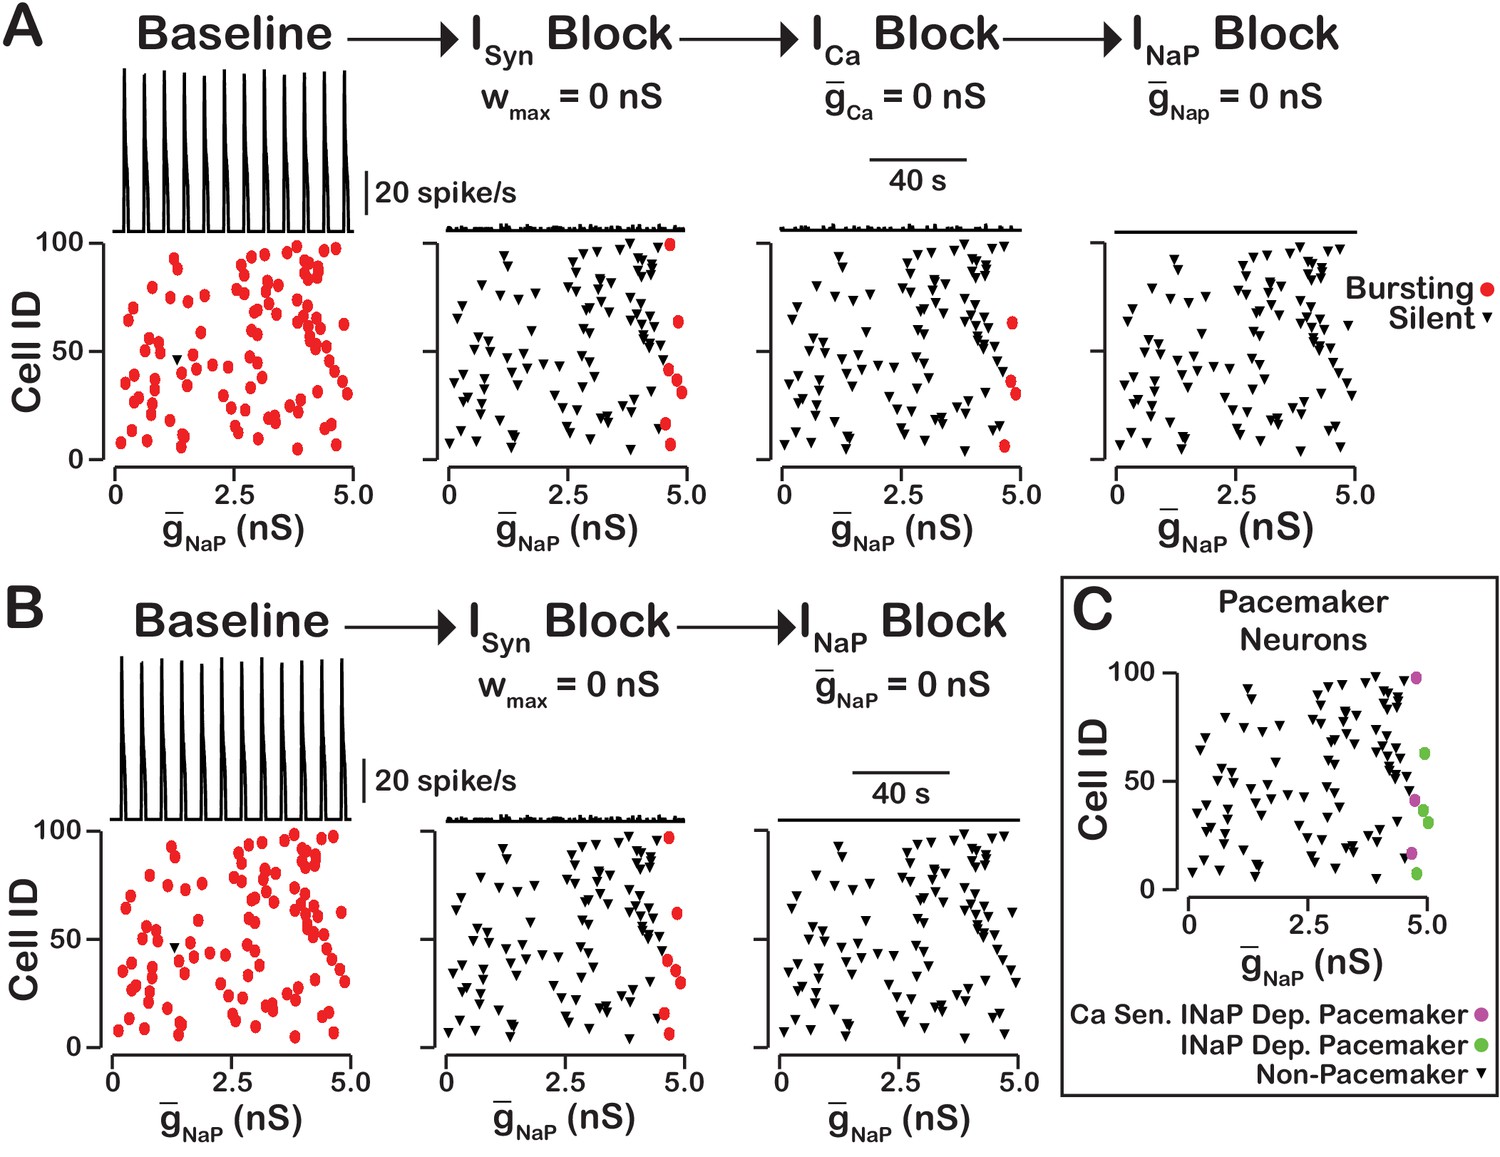
-dependent and -sensitive intrinsic bursting.
(A) From left to right, intrinsic bursters (pacemakers) are first identified by blocking synaptic connections. Cells whose activity is elminated under these conditions are non-pacemaker neurons. Then, calcium sensitive neurons are silenced and identified by blockade. The remaining neurons are identifed as sensitive to block. Top traces show the network output and Cell ID vs. scatter plots that identify silent and bursting neurons under each condition. (B) blockade after synaptic blockade eleminates bursting in all neurons. Therefore, all intrinsic bursters are dependent. (C) Identification of calcium-sensitive and -dependent as well as calcium-insensitive and -dependent intrinsic bursters. Notice that only the neurons with the highest value of are intrinsic bursters and that a subset of these neurons are sensitive to calcium blockade but all are dependent on . The network parameters are: , , and . The values of given in the scatter plots indicate the magnitude of for each neuron in the network and show the range of the distribution.
Figure 9
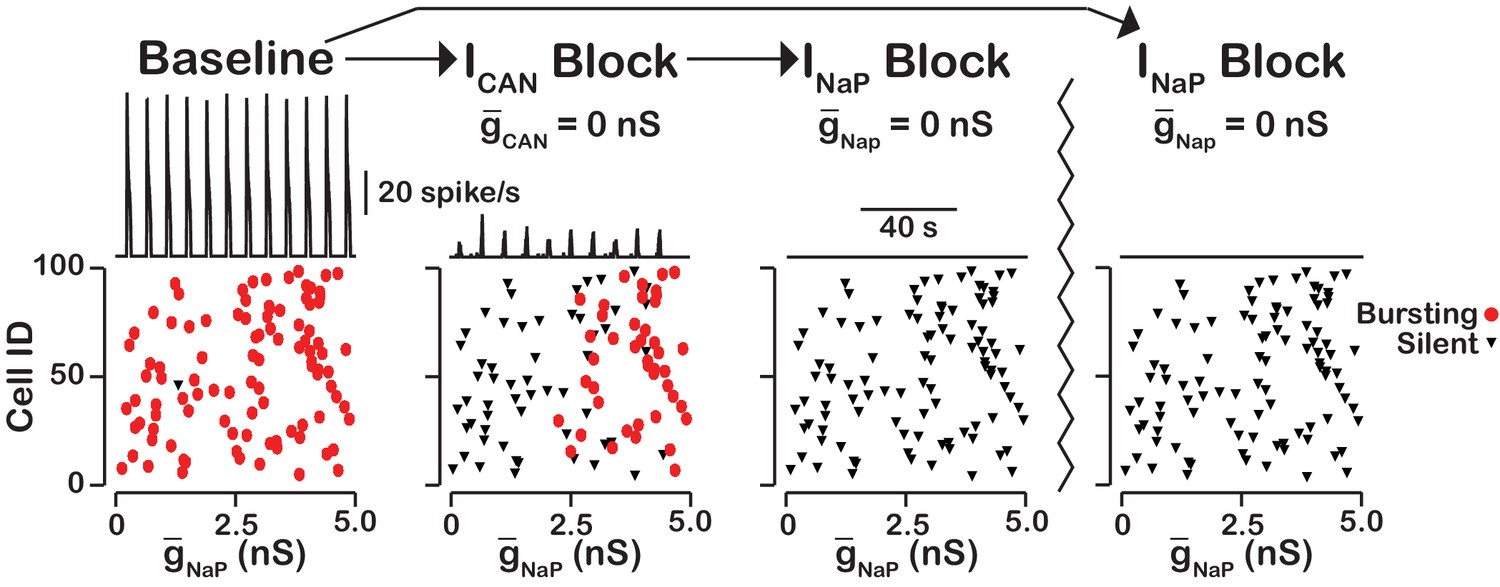
blockade reveals an -dependent rhythmogenic kernel.
The top traces show the network output at baseline, after blockade and blockade. The bottom Cell ID vs. scatter plots identify silent and bursting neurons in each conditon. Notice that only neurons with relitively high remain active after block. The network parameters used are: , , and . The values of given in the scatter plots indicate the magnitude of for each neuron in the network and show the range of the distribution.
Figure 10
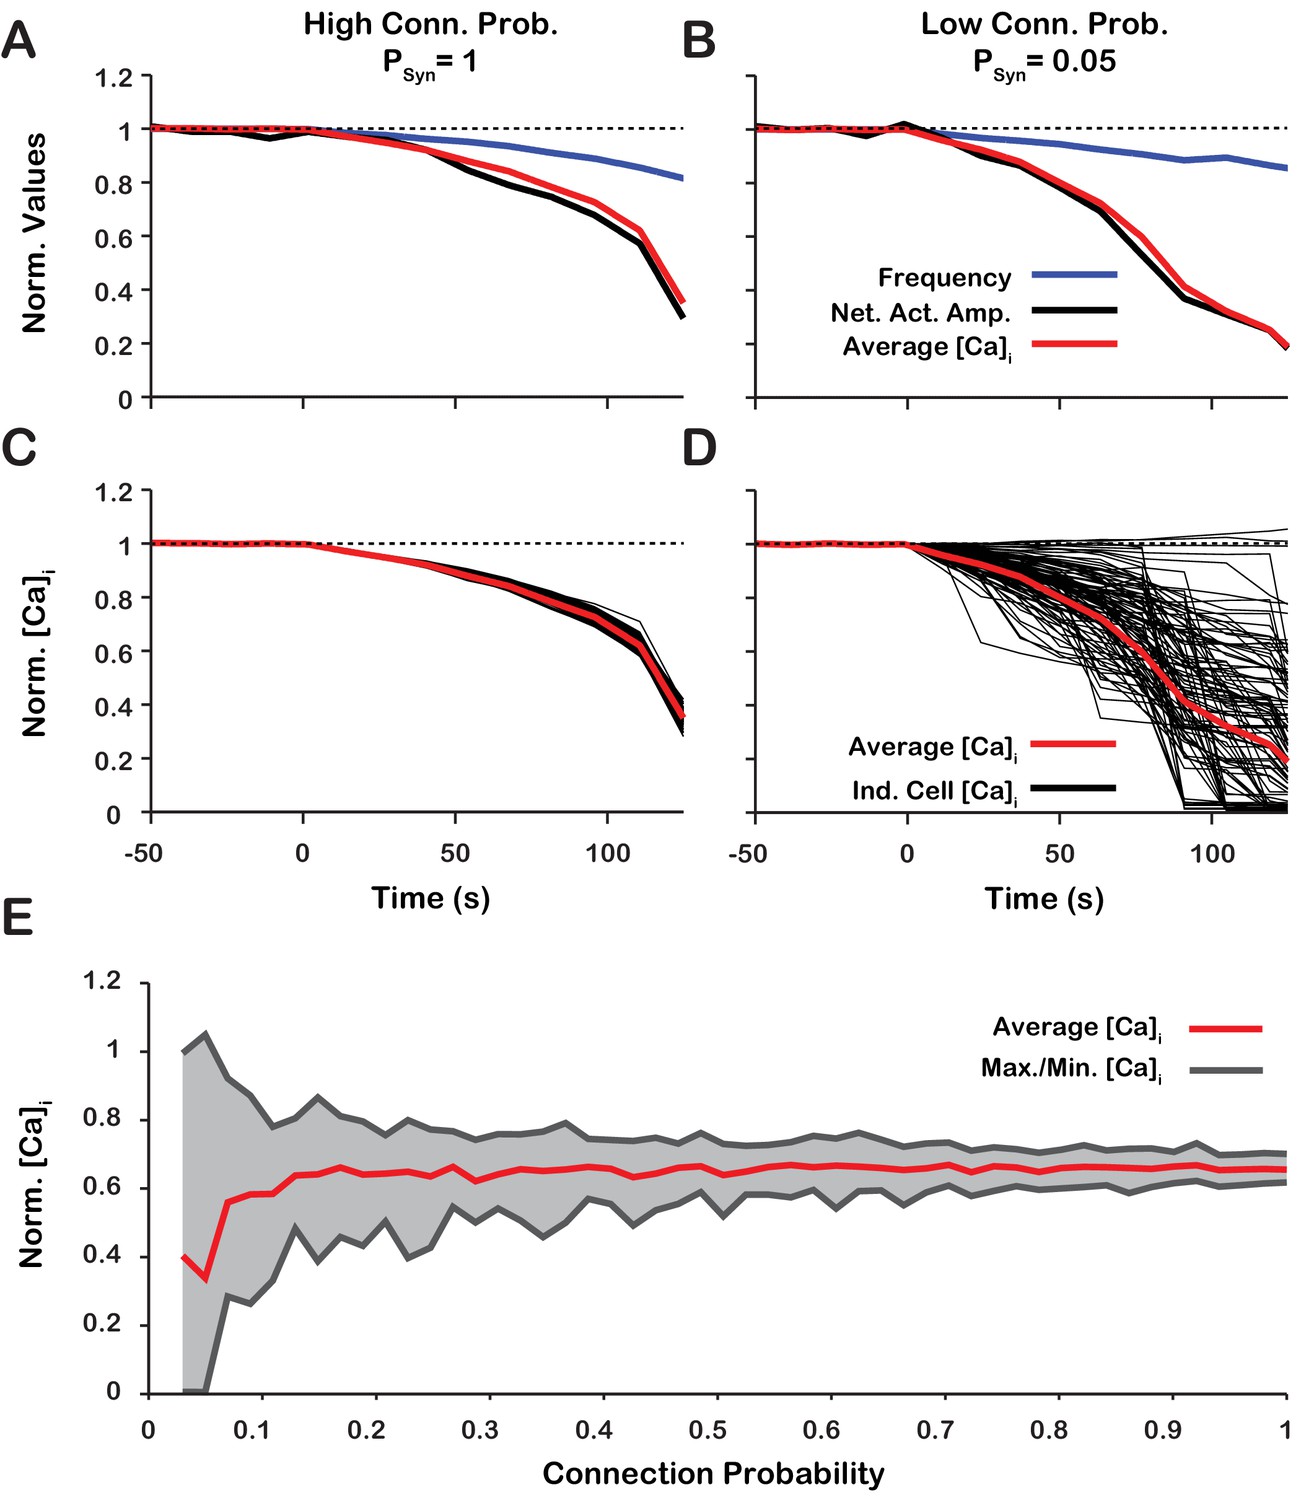
Changes of network activity amplitude, average network intracellular calcium concentration amplitude, and single model neuron amplitude during simulated blockade.
(A and B) Effect of block on network activity amplitude, network calcium amplitude and frequency for network connection probabilities (A) P = 1 and (B) P = 0.05. (C and D) Effect of block on changes in the magnitude of peak cellular calcium transients for network connection probabilities (C) and (D) . (E) Maximum, minimum and average change in the peak intracellular calcium transient of individual neurons as a function of synaptic connection probability. All curves in A through E are normalized to their baseline values. Synaptic weight was adjusted to keep the average synaptic strength () constant. Notice that lowering the synaptic connection probability increases the variability in the peak intracellular calcium concentration during blockade. Interestingly, for connection probabilities below approximately 5%, blocking can increase the peak calcium transient in a small subset of neurons. The network parameters used are: and and .
Figure 11
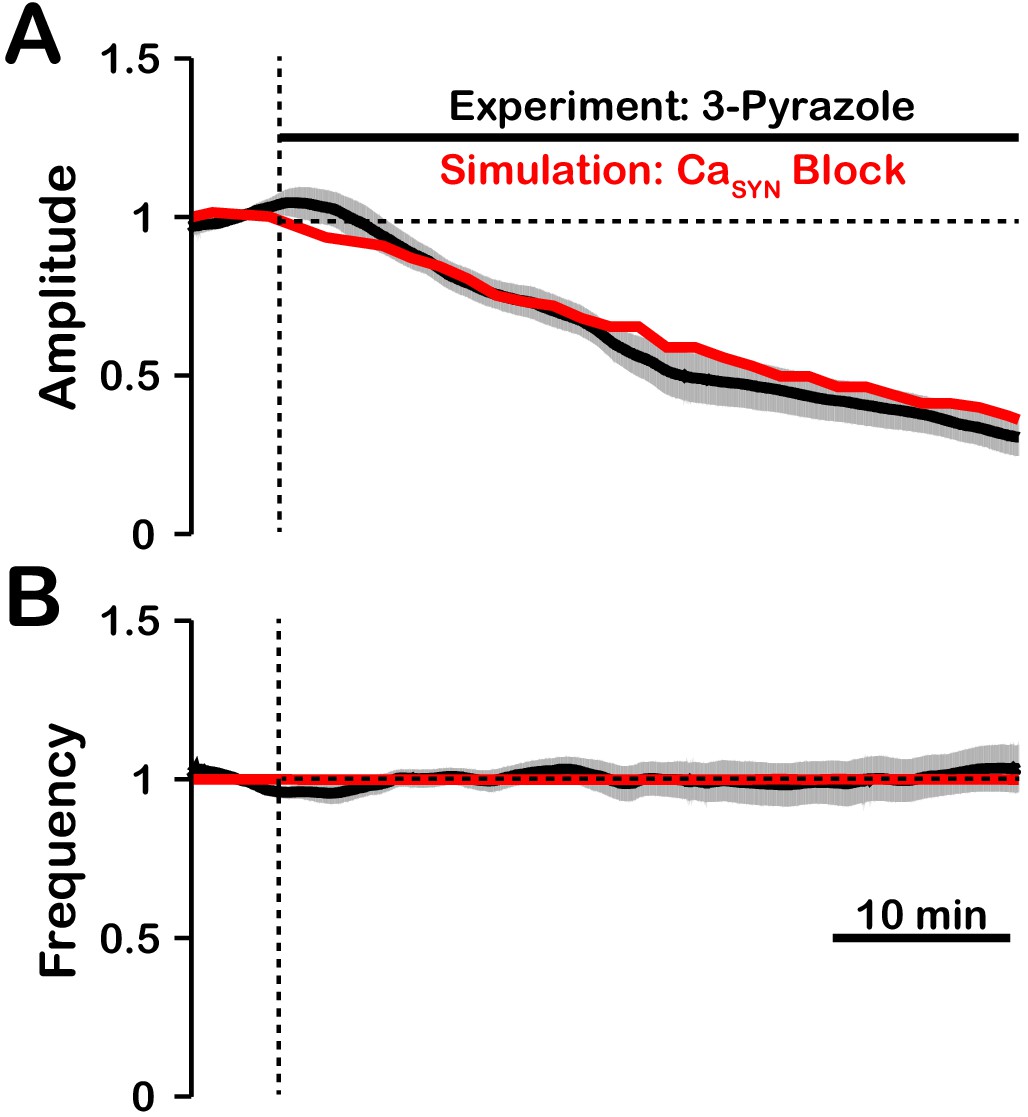
Comparison of experimental (black) and simulated (red) TRPC3 blockade (by block) on network activity amplitude (A) and frequency (B).
Simulated and experimental blockade begins at the vertical dashed line. The black line represents the mean and the gray band represents the S.E.M. of experimental integrated XII output recorded from neonatal rat brainstem slices in vitro, reproduced from Koizumi et al., 2018. Blockade was simulated by exponential decay of with the following parameters: 3-pyrazole: , . The network parameters are: , , and .
Tables
Table 1
Model parameter values.
The channel kinetics, intracellular Ca2+ dynamics and the corresponding parameter values, were derived from previous models (see Jasinski et al., 2013) and the references therein).
| Channel | Parameters |
|---|---|
| , ,, ,, , ,, ,, , | |
| , , , , , , | |
, | |
| , , , , , , , , , , | |
| , , | |
| , , , , , , , , , , | |
| , , , | |
| , , |
Additional files
-
Source code 1
Phillips et al. model source code.
- https://doi.org/10.7554/eLife.41555.014
-
Transparent reporting form
- https://doi.org/10.7554/eLife.41555.015
Download links
A two-part list of links to download the article, or parts of the article, in various formats.
Downloads (link to download the article as PDF)
Open citations (links to open the citations from this article in various online reference manager services)
Cite this article (links to download the citations from this article in formats compatible with various reference manager tools)
Biophysical mechanisms in the mammalian respiratory oscillator re-examined with a new data-driven computational model
eLife 8:e41555.
https://doi.org/10.7554/eLife.41555


