Short-term plasticity at cerebellar granule cell to molecular layer interneuron synapses expands information processing
- CNRS UPR 3212, Université de Strasbourg, France
- Plateforme Imagerie in vitro, CNRS UPS 3156, France
Figures
Figure 1 with 1 supplement

Heterogeneous profile of STP at unitary GC-MLI synapses.
(A) Typical experiment showing the profile of STP during 100 trains at three unitary inputs recruited by local stimulation of PF at two different locations (Z1 to Z3). Figure shows post-hoc reconstruction of a recorded MLI. The left and right dashed lines represent the location of the Purkinje cell layer (PCL) and the pia, respectively. (B) Superimposed traces correspond to EPSCs recorded during trains of 10 stimuli at 100 Hz after minimal stimulation at Z1, Z2 and Z3 locations. Averaged traces from 10 successive stimulations are represented in purple (Z1), green (Z2) and blue (Z3). (C) Corresponding EPSC charges versus stimulus number at Z1, Z2 and Z3 locations.
Figure 1—figure supplement 1
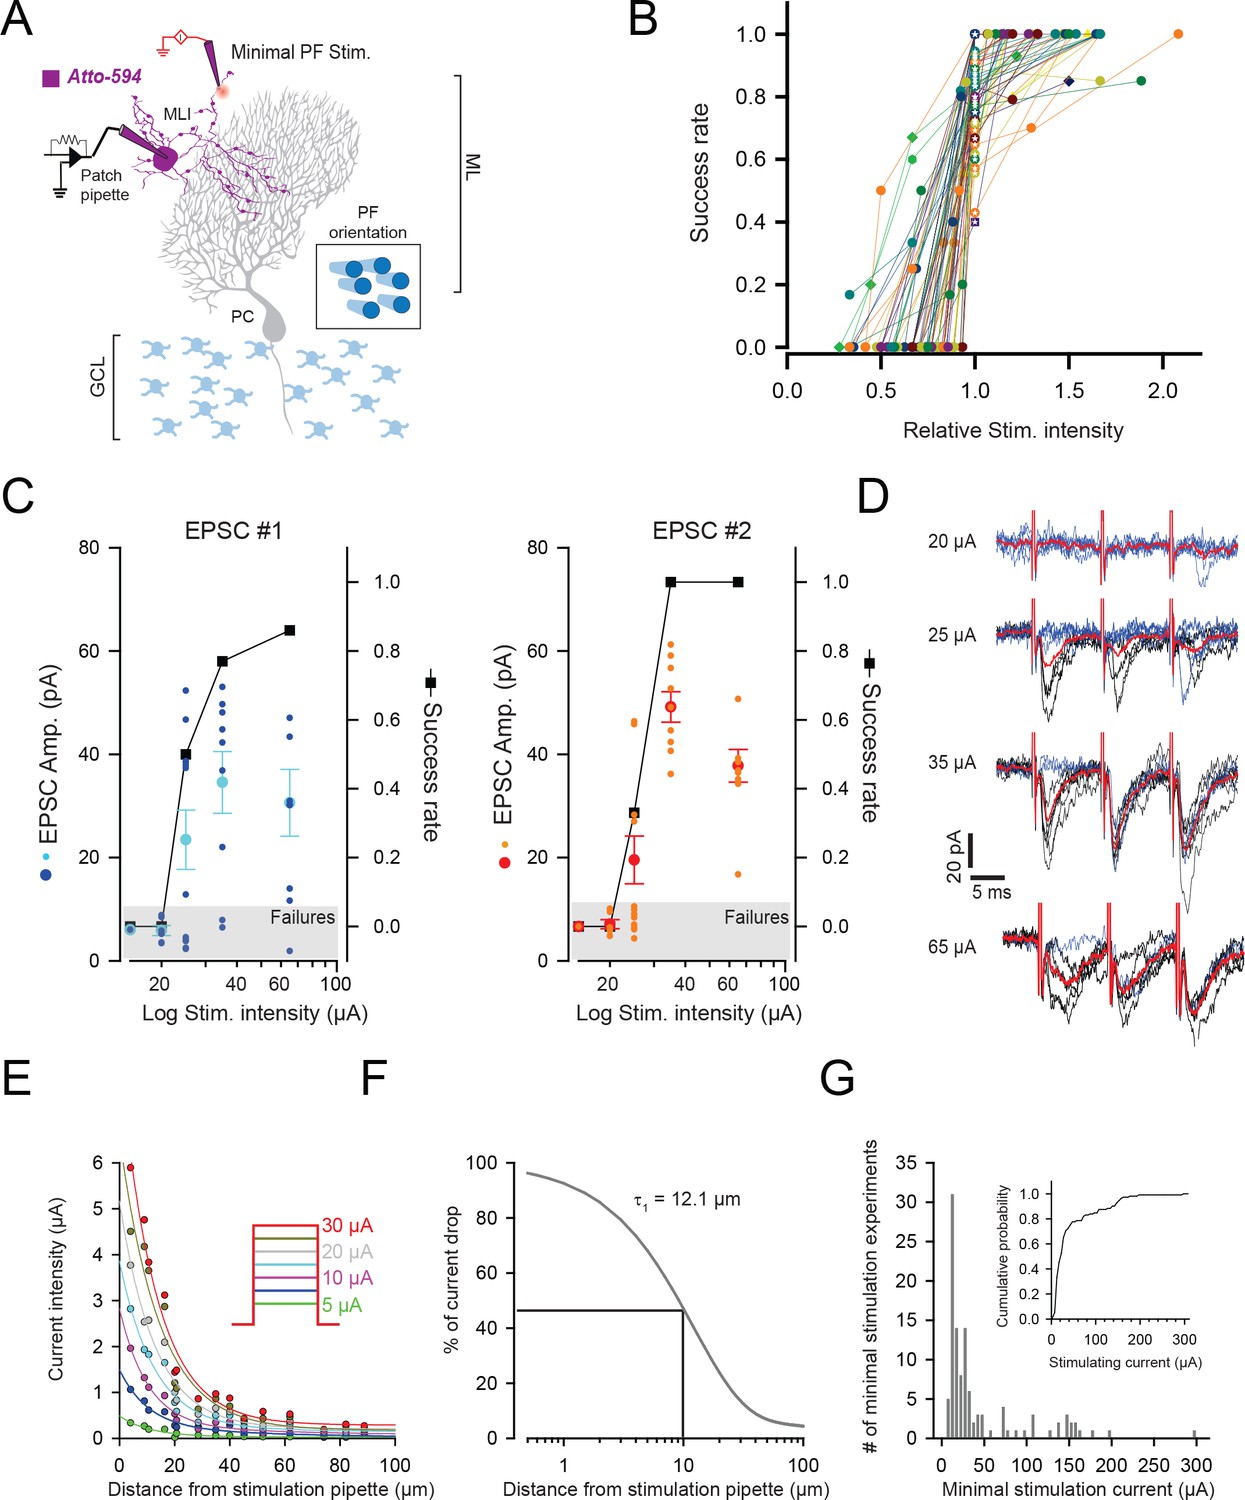
Minimal stimulation protocol.
(A) Schematic showing the method used for minimal stimulation. Patch-pipettes were filled with Atto-594 to visualize the dendritic tree of the recorded MLI. To put the stimulating pipettes in close vicinity of MLI dendrite, those pipettes were also filled with Atto-594. Recordings were performed in parasagittal sections which optimized the visualization of MLI morphology. GCL: granule cell layer (B) Minimal configuration is used to stimulate unitary GC contacts. Intensity of stimulation was chosen as the lowest intensity enable to evoke reliable synaptic responses. The plot of the success rate versus stimulation current intensity was systematically performed for each GC-MLI contact. Current values were normalized with respect to the intensity chose for minimal stimulation (star-containing symbols). The plot profile of minimal stimulation was one of the criteria used to include or reject any recording in the dataset for further analysis. The graph displays the results of experiments that were included in the dataset for PCA and k-mean clustering analysis (Figure 2). (C) Representative experiment showing how current intensity was set to ensure the stimulation of a single synaptic contact. The graphs show amplitudes of EPSC#1 and EPSC#2 (cyan and orange points for individual responses and dark blue and red points for mean values) and the success rate (black squares) following stimulation of increasing intensities. In this example, current values of 15 µA, 20 µA and 25 µA were unable to induce reliable stimulation of GC-MLI contact; 15 µA and 20 µA currents were associated with systematic failures at the first and second stimulus and 25 µA currents were associated with a high failure rate at the second stimulus. The current value of 35 µA was chosen for minimal stimulation because the success rate and the mean amplitude of EPSC#1 reached a plateau at this intensity and because of absence of failure at the second stimulus. (D) Corresponding traces at the indicated current intensity. Blue traces correspond to responses associated with failures at the first and red traces correspond to averaged traces. (E) Estimation of current spread from stimulation pipette in cerebellar slices. Currents of increasing intensities were recorded at variable distances from the tip of the stimulation pipette. The graph shows the current drop at variable intensities (inset) plots again the distance from the stimulation pipette. Solid colored lines represent the fit to the data using biexponential decay functions. Current-distance constants were conserved at any current intensity. (F) The percentage of current drop could be fitted by a biexponential decay function with 93.4% ± 1.8 of current drop described with a current-distance constant of 12.1 µm ± 0.6 µm. (G) Current intensity histogram of values used in minimal stimulation experiments. Note that the median of current intensity used for minimal stimulations median was equal to 25 µA and that almost 80% of currents were inferior to 50 µA (inset). In MLI dendrites, intersynaptic distances were estimated to 10 µm (Soler-Llavina and Sabatini, 2006). In our experimental conditions, a current of 50 µA is supposed to drop to 22.16 µA at 10 µm away from the tip of the stimulation pipette.
Figure 2 with 3 supplements
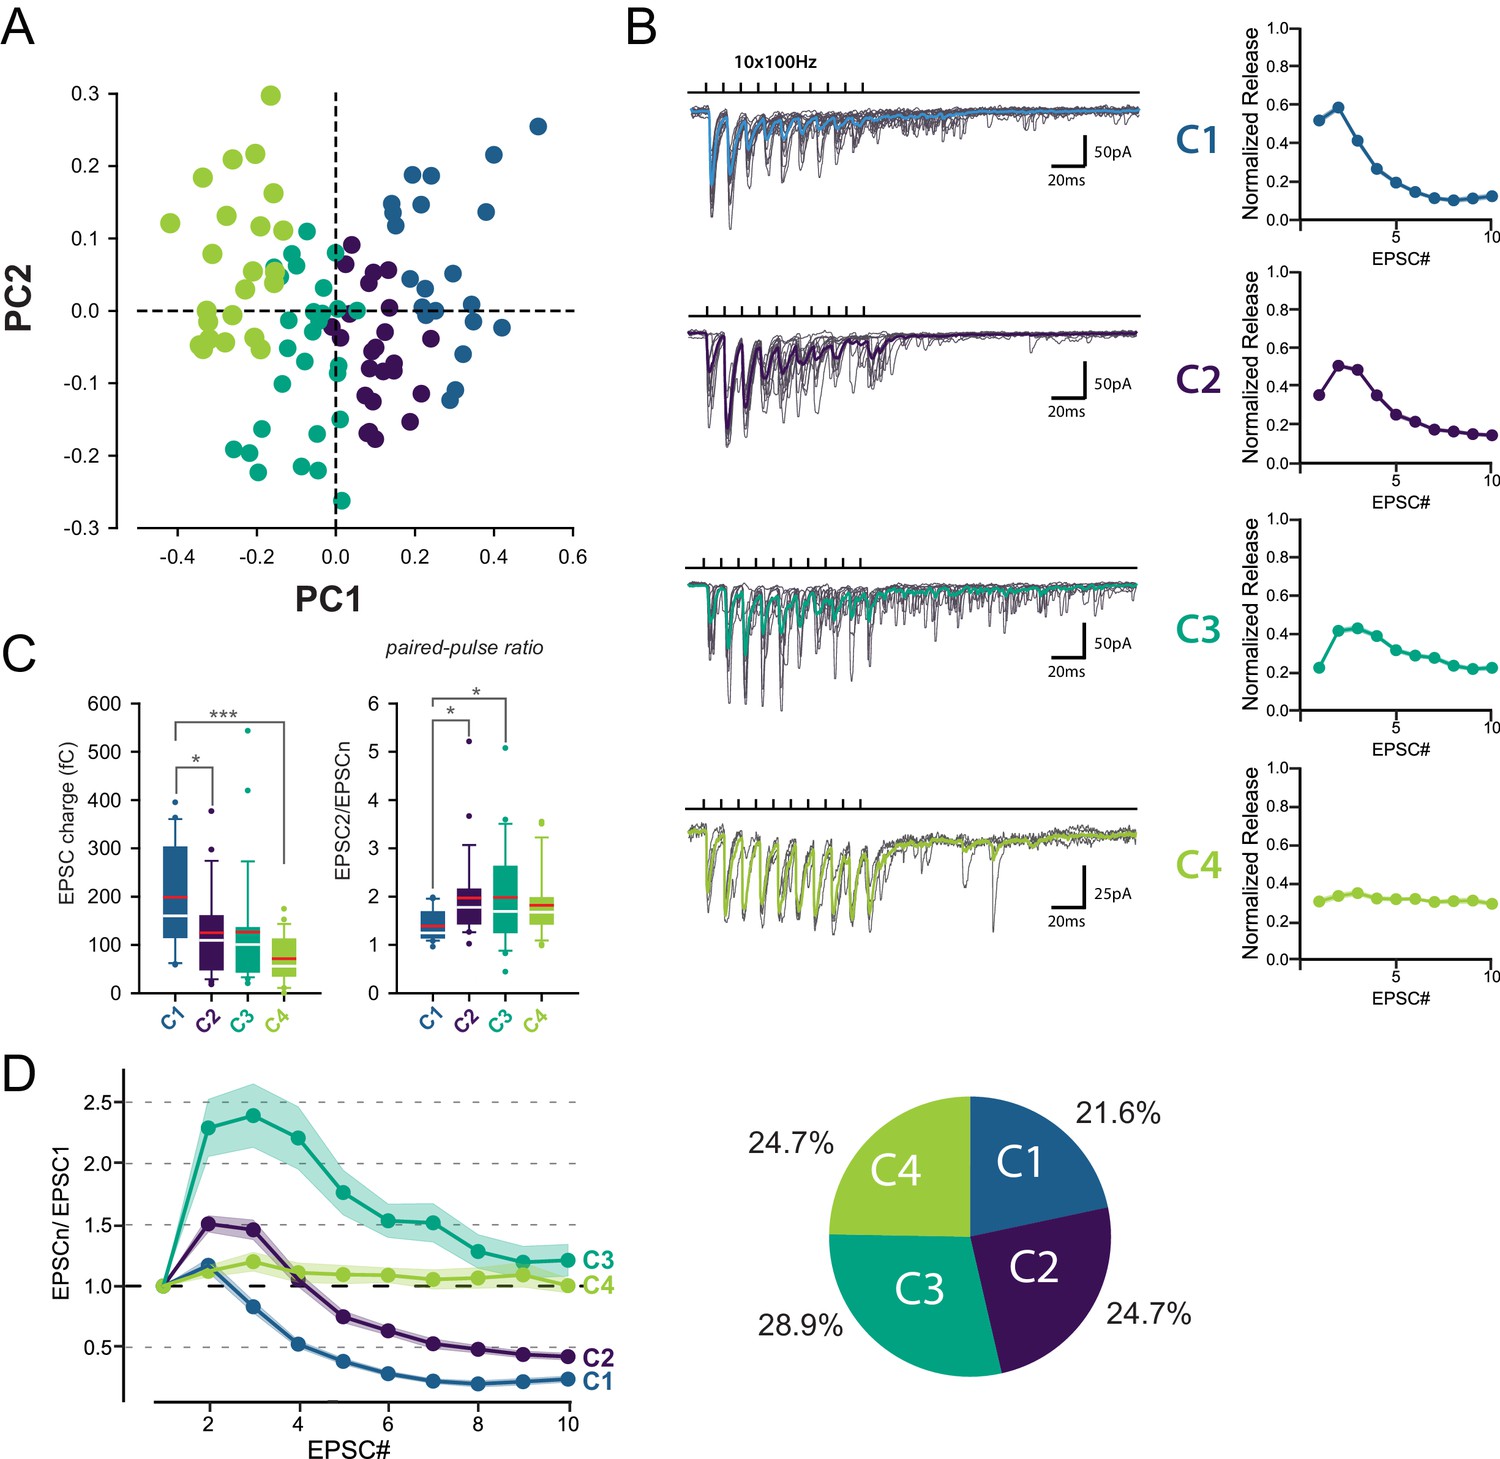
Identification of 4 classes of MC-MLI synapses using PCA followed by k-means clustering analysis of EPSC properties during high-frequency stimulation.
(A) PCA transformation of GC-MLI STP profiles. Scatter plot of the first two principal components (PC1, PC2) obtained by analyzing EPSC properties during 100 Hz trains at numerous unitary GC-MLI synapses (n = 96). The first two components explain 69.4% of the total variance of STP. Synapses with negative PC1 values sustain glutamate release during the 10 EPSCs of the burst while PC1 with positive values synapses are depressing synapses. Positive PC2 synapses are depressing synapses while negative PC2 synapses are facilitating during EPSC #2 and EPSC #3. (B) Representative traces of the four classes of inputs (C1 to C4) determined by k-means clustering analysis during ten minimal stimulations of unitary inputs at 100 Hz. The corresponding values of averaged EPSC amplitudes plotted versus the stimulus number and normalized again the vector space model (see method) were displayed on the right panels. (C) Box plots of the charge of EPSC recorded at the first stimulus (left panel) and the paired pulse ratio (PPR) (right panel) according to the four categories of input. EPSC charges: C1 = 198.78 fC±23.46 fC, C2 = 124.96 fC±18.78 fC, C3 = 126.52 fC±22.10 fC, C4 = 74.41 fC±9.48 fC. PPR: C1 = 1.39 ± 0.07, C2 = 1.97 ± 0.19, C3 = 1.98 ± 0.19, C4 = 1.82 ± 0.14. Red bars refer to means and white bars to medians. Multiple comparisons were performed using one-way ANOVAs with Tukey post hoc tests. Only statistically significant differences between categories were shown above box plots (D) Mean values of normalized EPSC amplitudes during 100 Hz train according to the four categories of inputs. The circular diagram represents the relative proportion of each category of input from 96 unitary GC-MLI synapses.
Figure 2—figure supplement 1
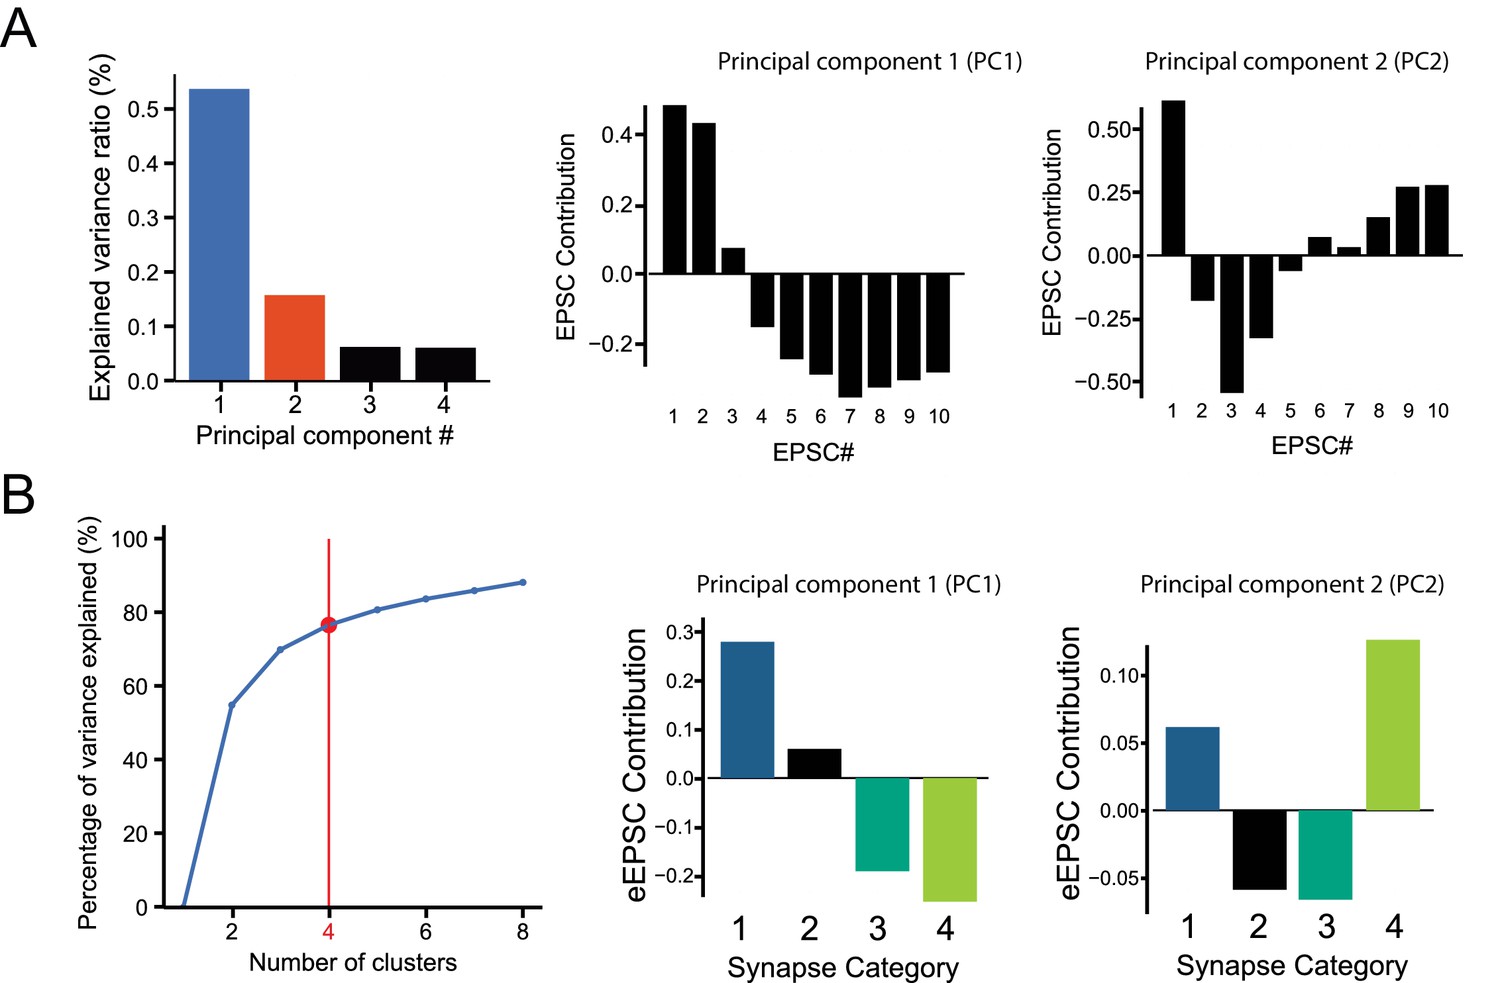
Details on Principal Component Analysis and k-Mean clustering parameters of minimal stimulation GC-MLI STP data.
(A) Principal components 1 and 2 (PC1 and PC2) represent over 58.4% of the total variation of GC-MLI STP dataset. PC1 and PC2 explain the highest source of variability within the dataset (see Materials and methods). Thus, these two variables were used to illustrate different categories of GC-MLI STP behavior over a population of 99 synapses. A negative PC1 eigenvalue is correlated with phasic synapses while synapses displaying tonic glutamate release have a positive PC1 eigenvalue. However, PC2 is correlated to a facilitating glutamate release behavior between EPSC #2 and EPSC #4. (B) We determined the number of GC-MLI STP categories by increasing one-by-one the number of clusters obtained by k-Mean clustering method plotted against total variance for all individual observations. Using the ‘elbow method’, we chose a number of clusters ‘by eye’ above which variance of clustered observations does not increase substantially.
Figure 2—figure supplement 2

Robustness of intrinsic STP evoked by 100 Hz train at unitary GC-MLI synapses.
(A) Functional mapping of synaptic responses recorded during 100 Hz trains in 99 neurons (See Materials and methods). PCA transformation are computed independently for each train (n > 1000) based on the charge value of each EPSC in the train. Consecutive recordings from the same synaptic terminals are represented with the same color code (orange, purples blue or pink points). Note that these recordings are located in a very specific position inside the cloud of points indicating that the profile of STP is conserved during successive stimulation at 100 Hz of the same synaptic input. (B) Normalized EPSC charges plotted against the stimulus number for responses highlighted in A (same color code). Left panel, synaptic responses from synapses with the same behavior during 100 Hz train are clustered nearby inside the PCA transform. Right panel, synaptic responses from synapses with distinct behaviors during 100 Hz trains are positioned at distant positions in the PCA transform. (C) STP profile was not skewed by changes in PF excitability in minimal stimulation experiments. Potentially, high current values can recruit additional PFs during trains and low current values can be associated with failures of PF excitation. These non-synaptic phenomena can induce unexpected changes in the profile of STP. However, neither charges of EPSC at the first stimuli (blue points), PPR (green points), PC1 (purple point) or PC2 (orange points) could be correlated with stimulus intensities. The lack of valid relationships between these parameters and current intensity indicated that in the vast majority of experiments, STP profile was shaped by synaptic mechanisms rather than change in PF excitability.
Figure 2—figure supplement 3
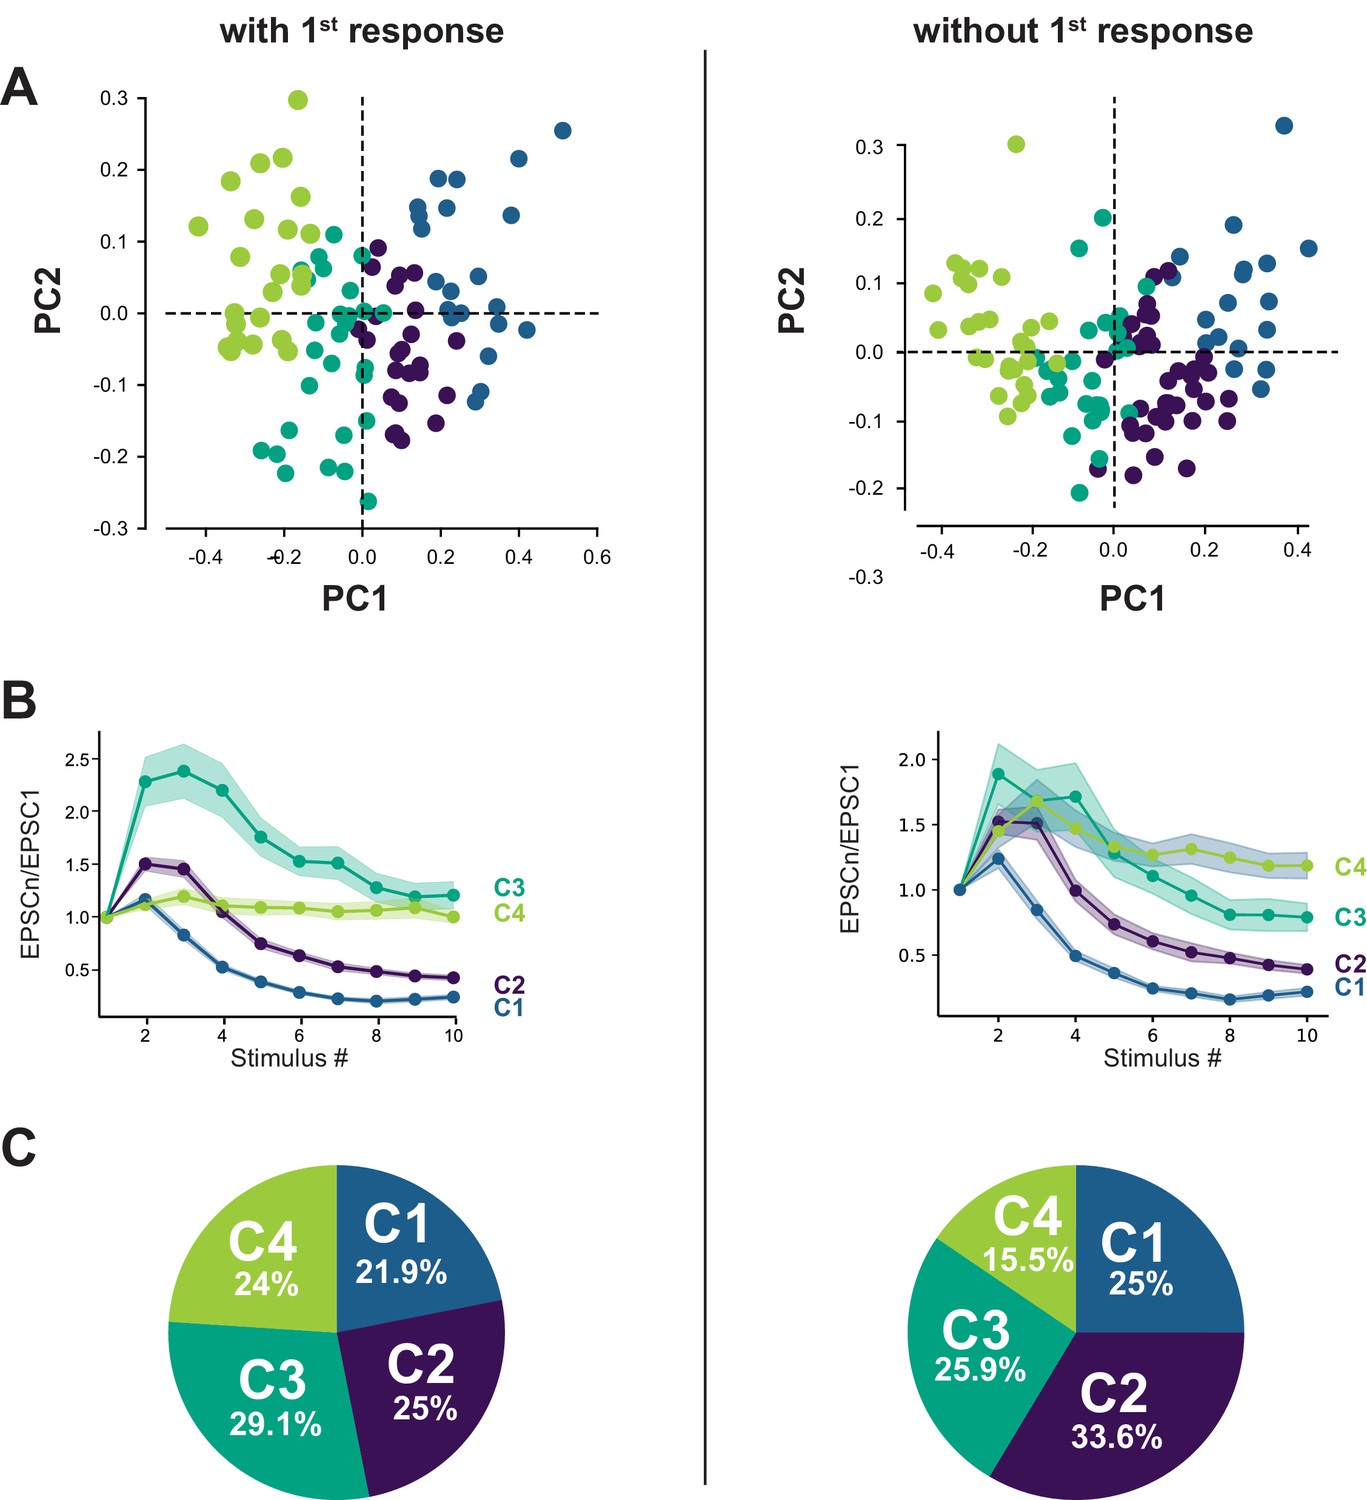
The classification of GC-MLI synapses using PCA transformation followed by k-means clustering analysis was weakly impacted by the first response.
(A) Scatter plot of PC1 and PC2 obtained by analyzing EPSC properties during 100 Hz train in WT mice (n = 96) either by taking in account the first response (left, same dataset as in Figure 2) or without taking in account the first response in the train (right). (B) Corresponding mean values of normalized EPSC amplitudes during 100 Hz train according to the four categories of inputs for both types of analysis. (C) Corresponding circular diagrams representing the relative proportion of each category for each type of analysis.
Figure 3 with 2 supplements
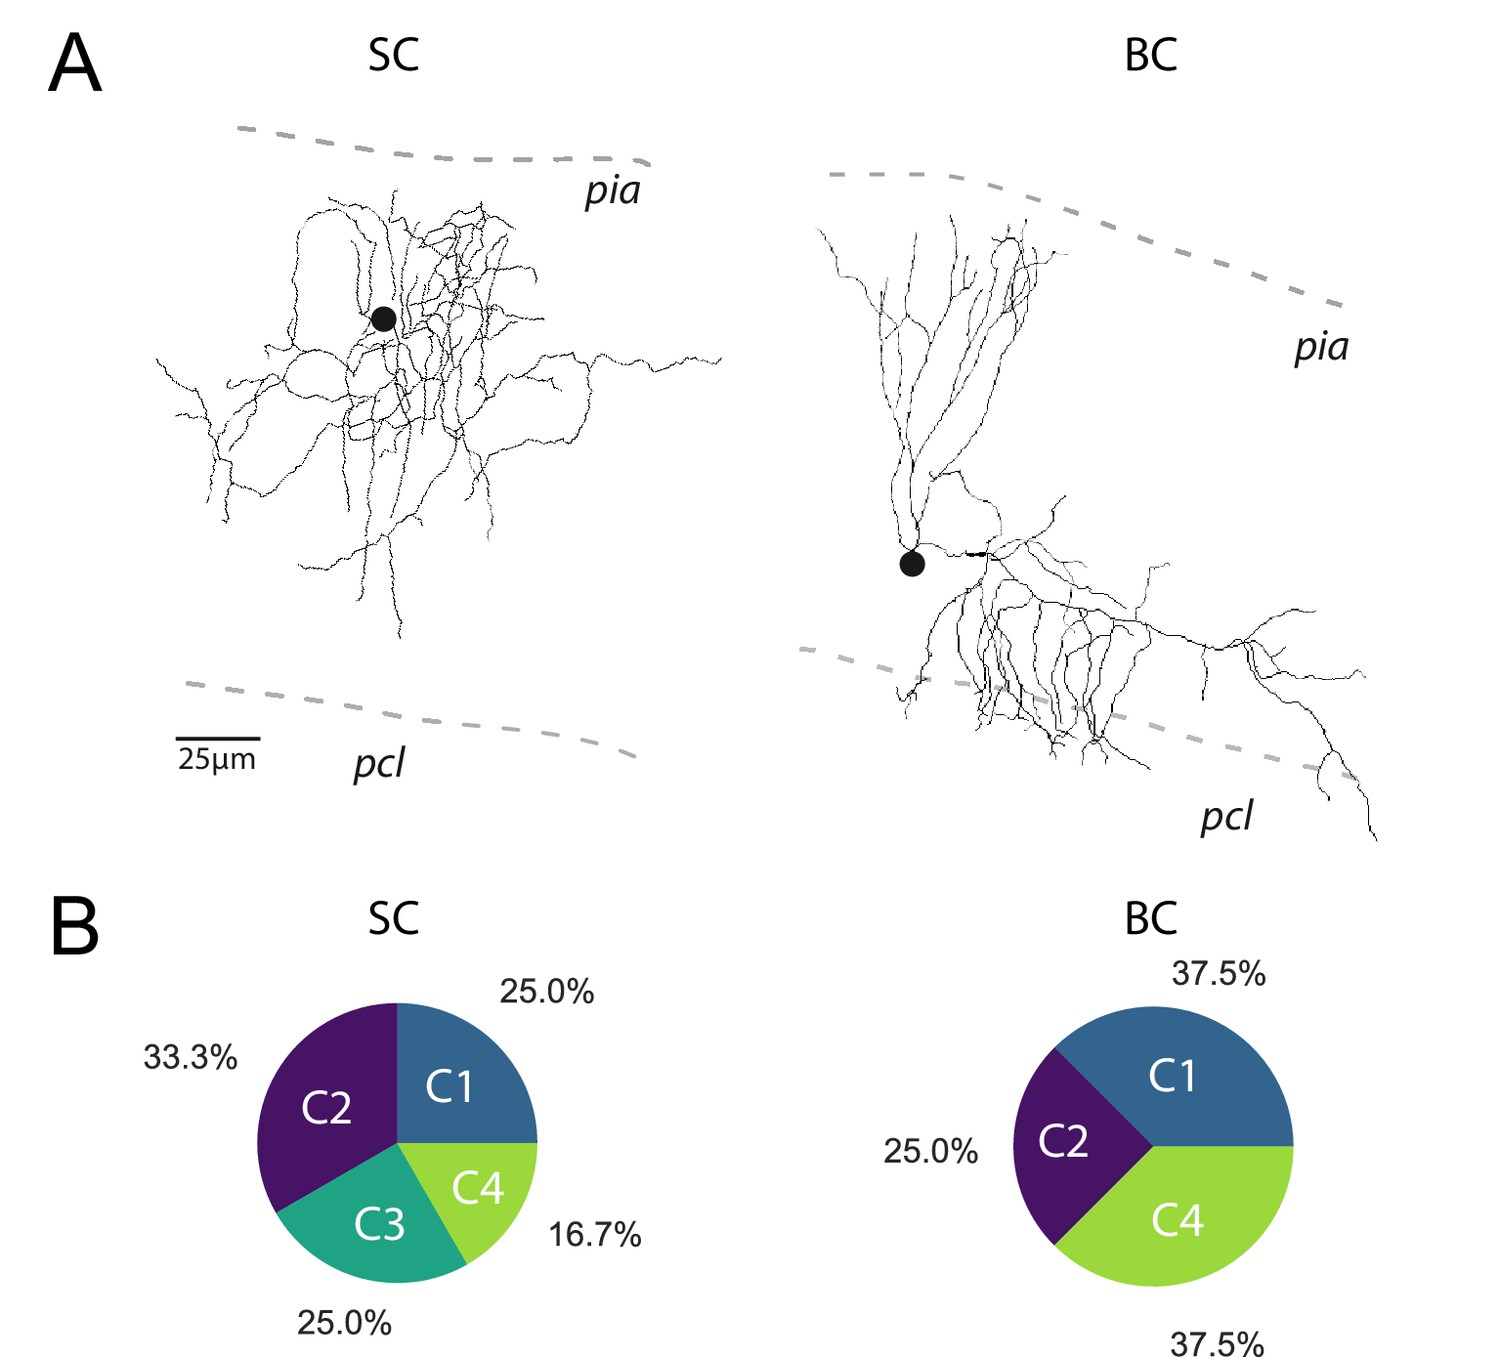
The profile of STP is not determined by the target cell.
(A) Post-hoc reconstruction of 2 recorded MLI using a two-photon microscope. SCs were identified by the absence of neuronal process reaching the PCL (left MLI) and by the absence of cut processes (transection of neuronal processes could be clearly identified by swelling at the tip end portion of processes). At the opposite, BCs were identified by the presence of processes entering in the PCL (right MLI). (B) Circular diagrams of the relative proportion of each category of input (determined by k-means clustering analysis during ten minimal stimulation of GC unitary inputs at 100 Hz) contacting BCs and SCs.
Figure 3—figure supplement 1
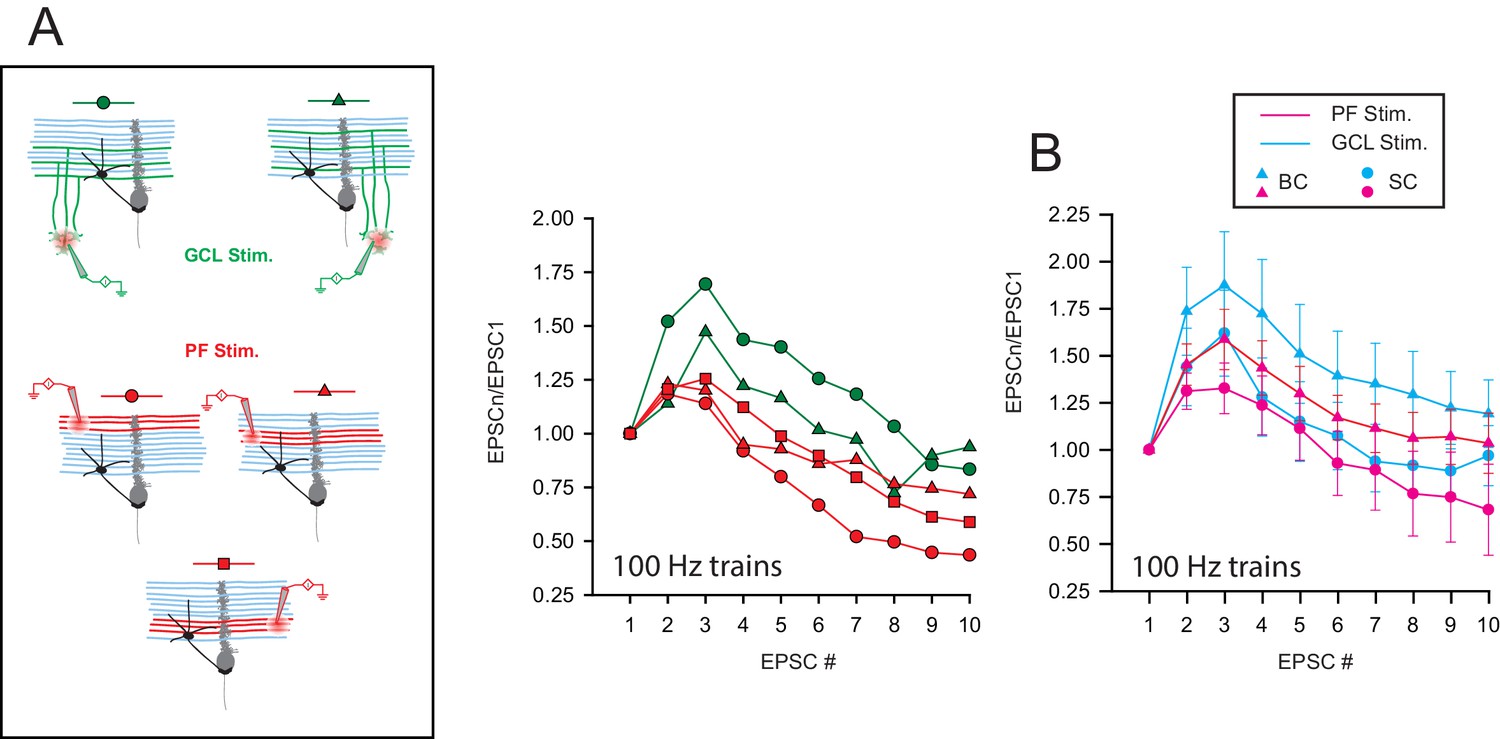
STP profile at compound GC-MLI synapses is not determined by the target cell upon.
(A) Right, schematic of the experimental design used to probe STP profiles on a single MLI following compound stimulations of GC-MLI synapses. In this example, synaptic responses in a BC were recorded upon stimulations (10 pulses at 100 Hz) of three different clusters of GCs (stimulation in GCL, green symbols) and two different beams of PFs (red symbols). Left, Corresponding compound EPSC responses recorded in the BC following stimulations of the five different locations showed on the schematic. Depending of the location of the stimulation pipette, compound EPSC responses either facilitated or depressed. (B) Mean EPSC responses recorded in BC (triangles) or in SC (circles) following compound stimulations of beams of PFs (pink triangle for BCs, n = 9 and pink circles for SCs, n = 6) or clusters of GC soma (blue triangles for BCs, n = 11 and blue circles for SCs, n = 9).
Figure 3—figure supplement 2
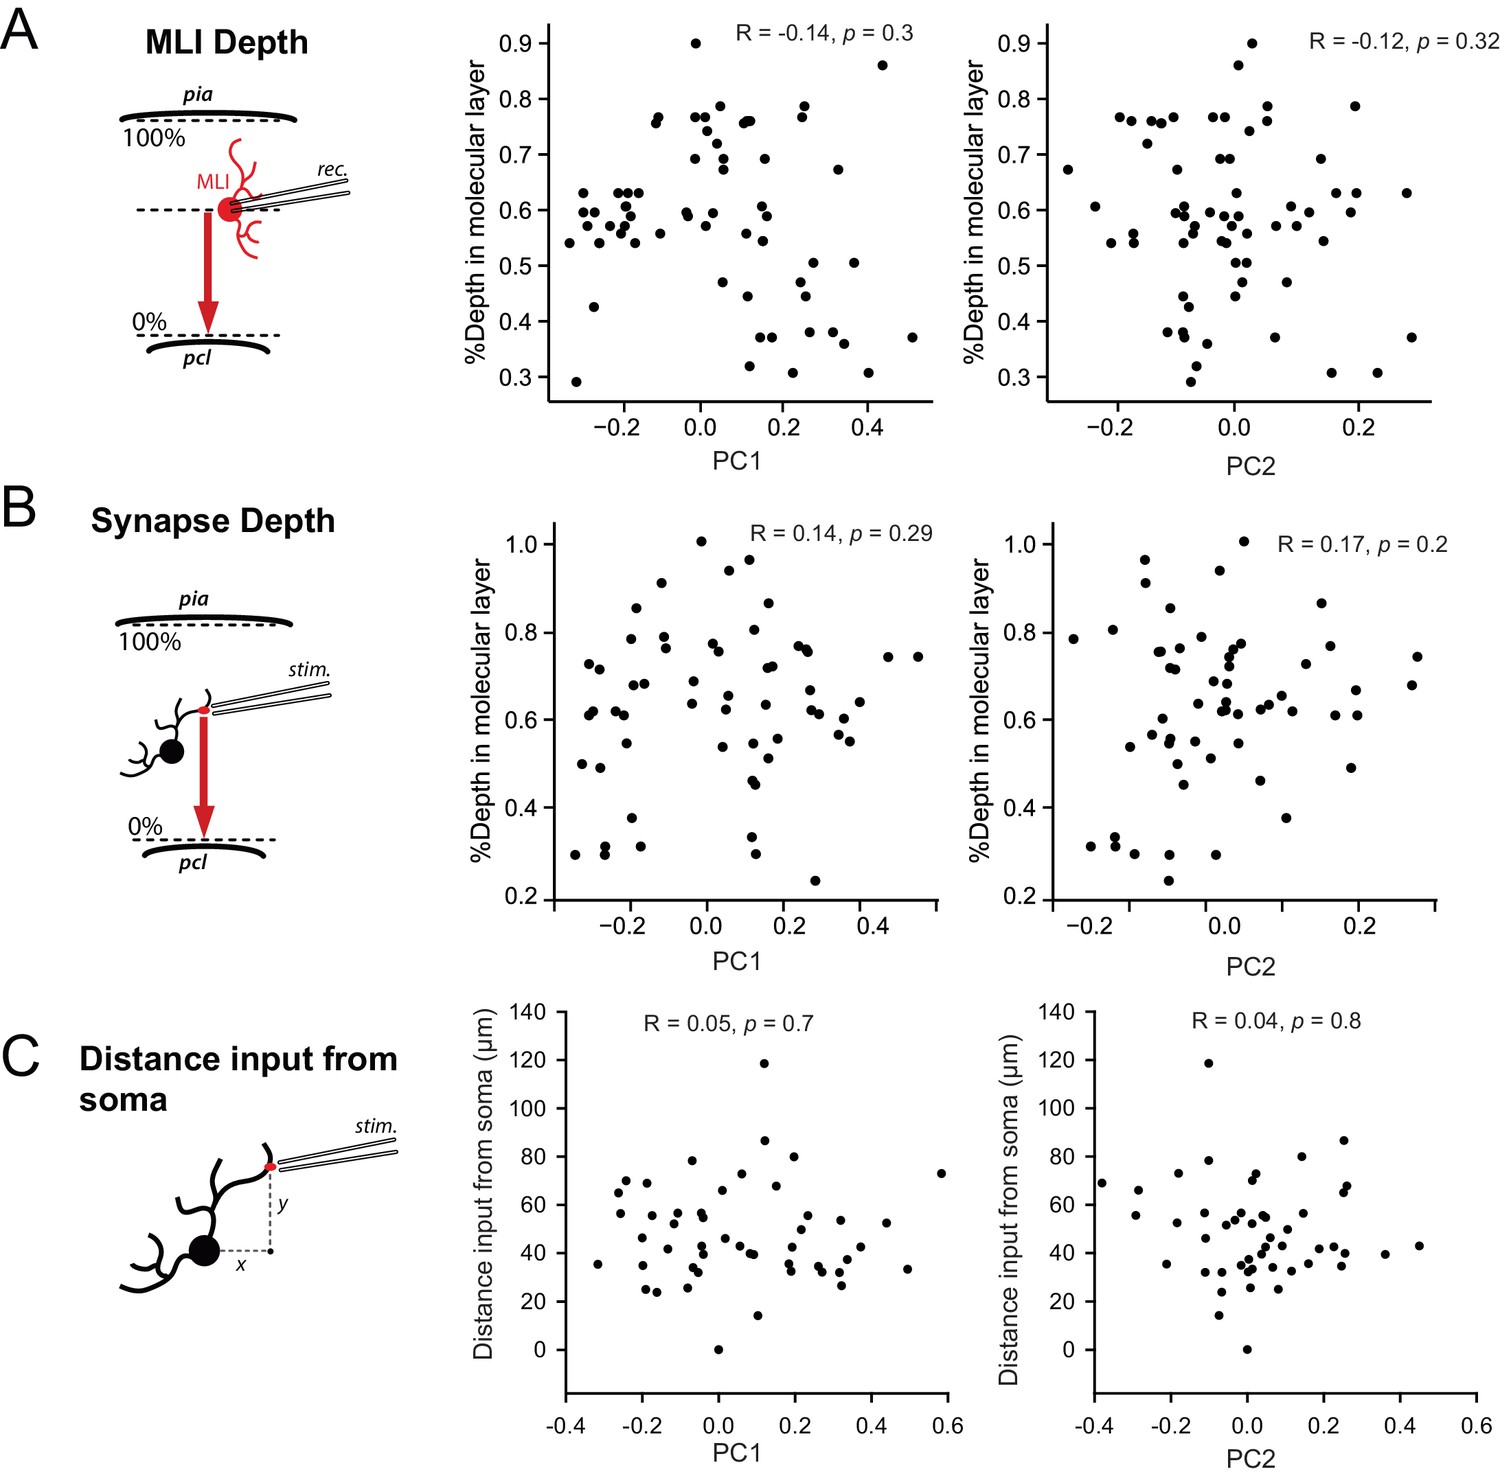
STP is not determined by the position of MLI in the molecular layer or by the position of inputs in MLI dendritic trees.
(A) Left panel, schematic showing how the relative depth of cell’s soma in the molecular layer was measured. Right panels, scatter plots showing the lack of correlation between PC1 or PC2 with the relative depth of cell’s soma for all recorded MLIs. (B) Left panel, schematic showing how the relative depth of stimulated inputs in the molecular layer was measured. Right panels, scatter plots showing the lack of correlation between PC1 or PC2 with the relative depth of inputs. (C) Left panel, schematic showing how the distance of stimulated inputs from MLI soma was measured. Right panels, scatter plots showing the lack of correlation between PC1 with distance of stimulated inputs from the soma.
Figure 4
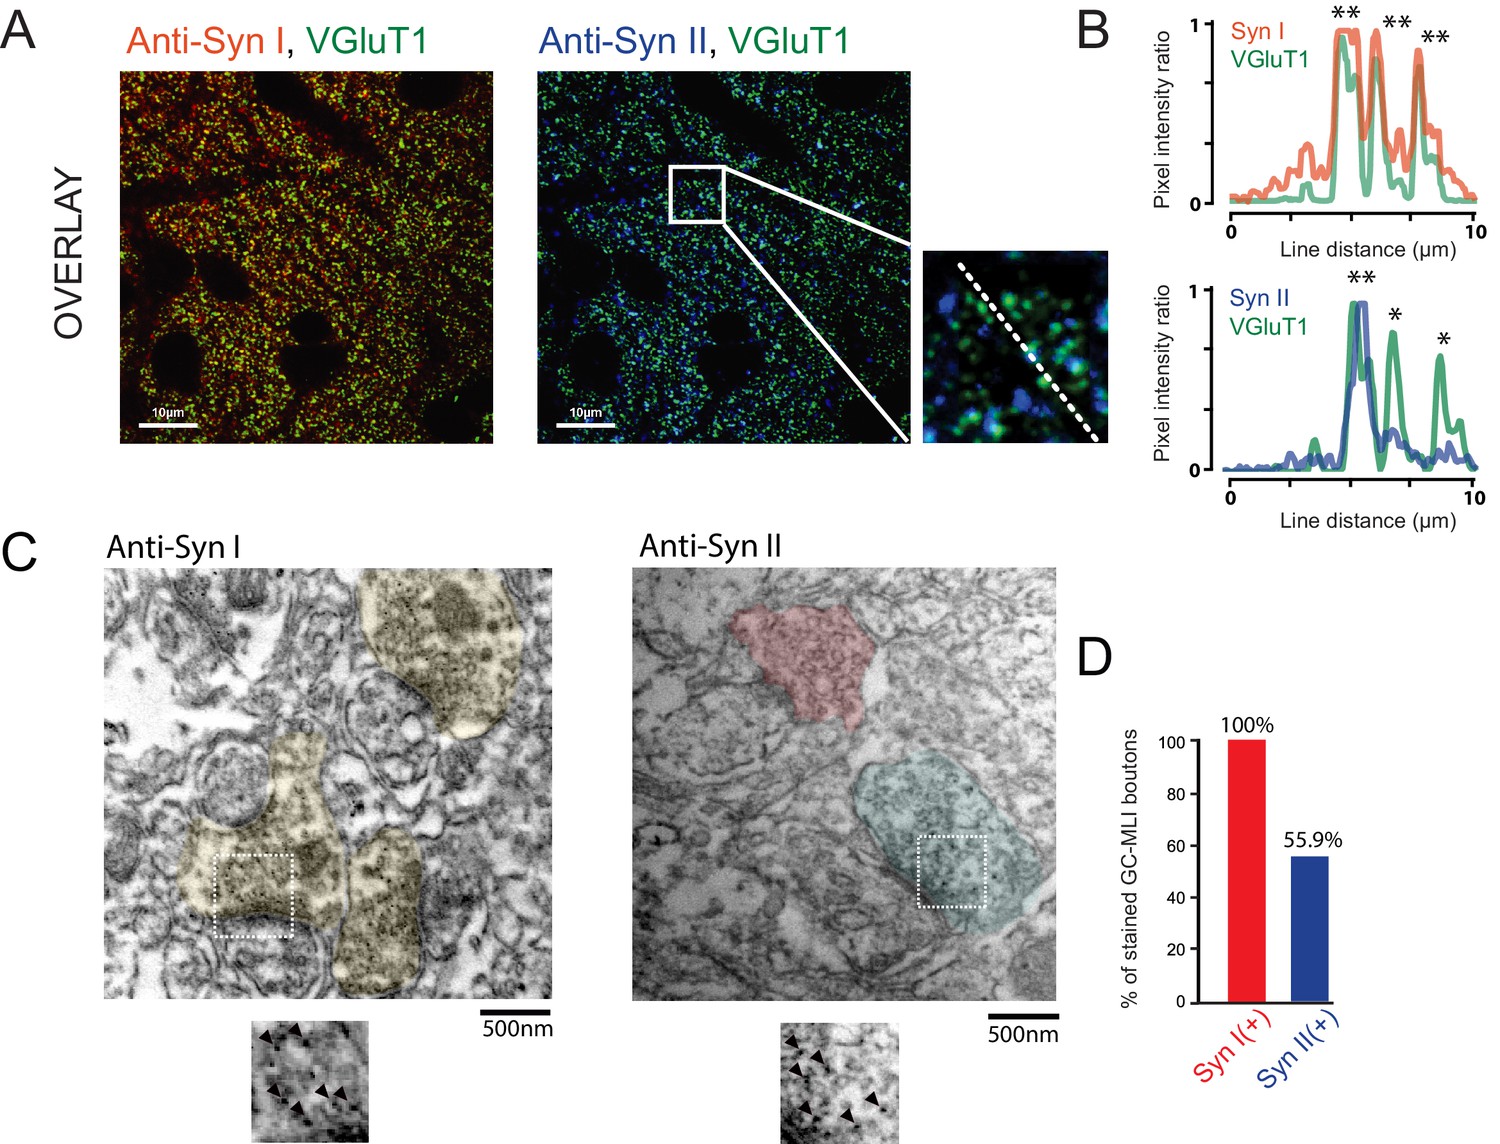
Heterogeneous expression of Syn II at GC-MLI synapses.
(A) Representative merged images of VGluT1/Syn I immunostaining (left image, green and red puncta, respectively) or VGluT1/Syn II immunostaining (right image, green and blue puncta, respectively). The two merged imaged were captured in the molecular layer from the same parasagittal cerebellar section. (B) Profile plot (dashed line in A) showing the colocalization of VGluT1 with Syn I in the majority of VGluT1 puncta while there was only a partial colocalization of VGluT1 with Syn II in VGluT1 puncta. (C) Typical immunogold electron micrographs illustrating the ubiquitous expression of Syn I in GC boutons contacting MLIs (left micrograph) and the heterogeneous expression of Syn II in these boutons (right micrograph). GC boutons contacting MLIs were colorized. Insets corresponding to magnifications of areas delimited by white squares show details of immunogold staining. (D) Histogram of the percentage of GC-MLI synapse positive for Syn I (red bar) and Syn II (blue bar).
Figure 5

Genetic deletion of Syn II induces a partial loss of functional variability at GC-MLI synapses.
(A) Representative traces of EPSCs from 10 successive trains at 100 Hz recorded at unitary GC-MLI synapse from Syn II KO mice (black traces). Averaged trace is in red. Unitary synapses were stimulated using minimal electrical stimulation. (B) left, Mean values of EPSC1, charges elicited by train of stimulation at 100 Hz recorded in WT and Syn II KO mice (grey and red points, respectively). Right, Corresponding traces recorded during these 100 Hz train in WT mice (black trace, mean trace from 102 recordings) and in Syn II KO mice (red trace, averaging from 33 recordings). The mean EPSC charges of the first responses was strongly reduced in Syn II KO mice (mean EPSC1 charge for WT: 128.11 fC ± 10.51 fC, n = 96, mean EPSC1 charge for Syn II KO mice: 60.03 fC ± 5.55 fC, n = 53, p<0.001, MWRST). (C) Box plots showing the values of EPSC charges at the first, second and third stimulus of 100 Hz train (left, middle and right graph respectively) in WT and Syn II KO mice. (D) Box plots showing the number of failures at the first stimulus in WT and Syn II KO mice. The percentage of failures at the first stimuli was increased in Syn II KO mice (mean failure rate EPSC1 in WT: 15.6% ± 1.6, Syn II KO mice: 32.3% ± 3.8). (E) Scatter plot of PCA1 and PCA2 obtained by analyzing EPSC properties during 100 Hz train in WT mice (gray point, same dataset as in Figure 2A) and Syn II KO mice (red points). (F) Pie chart of k-means clustering analysis clusters obtained in WT (same dataset than in Figure 2C) and Syn II KO mice. Note the near complete disappearance of C1 and C2 connections in Syn II KO mice. The profiles of EPSC charges during 100 Hz train for C3 and C4 connections were identical between WT and Syn II KO mice (bottom graphs), indicating that the genetic deletion of Syn II did not impair the functioning of these two classes of GC-MLI synapses.
Figure 6
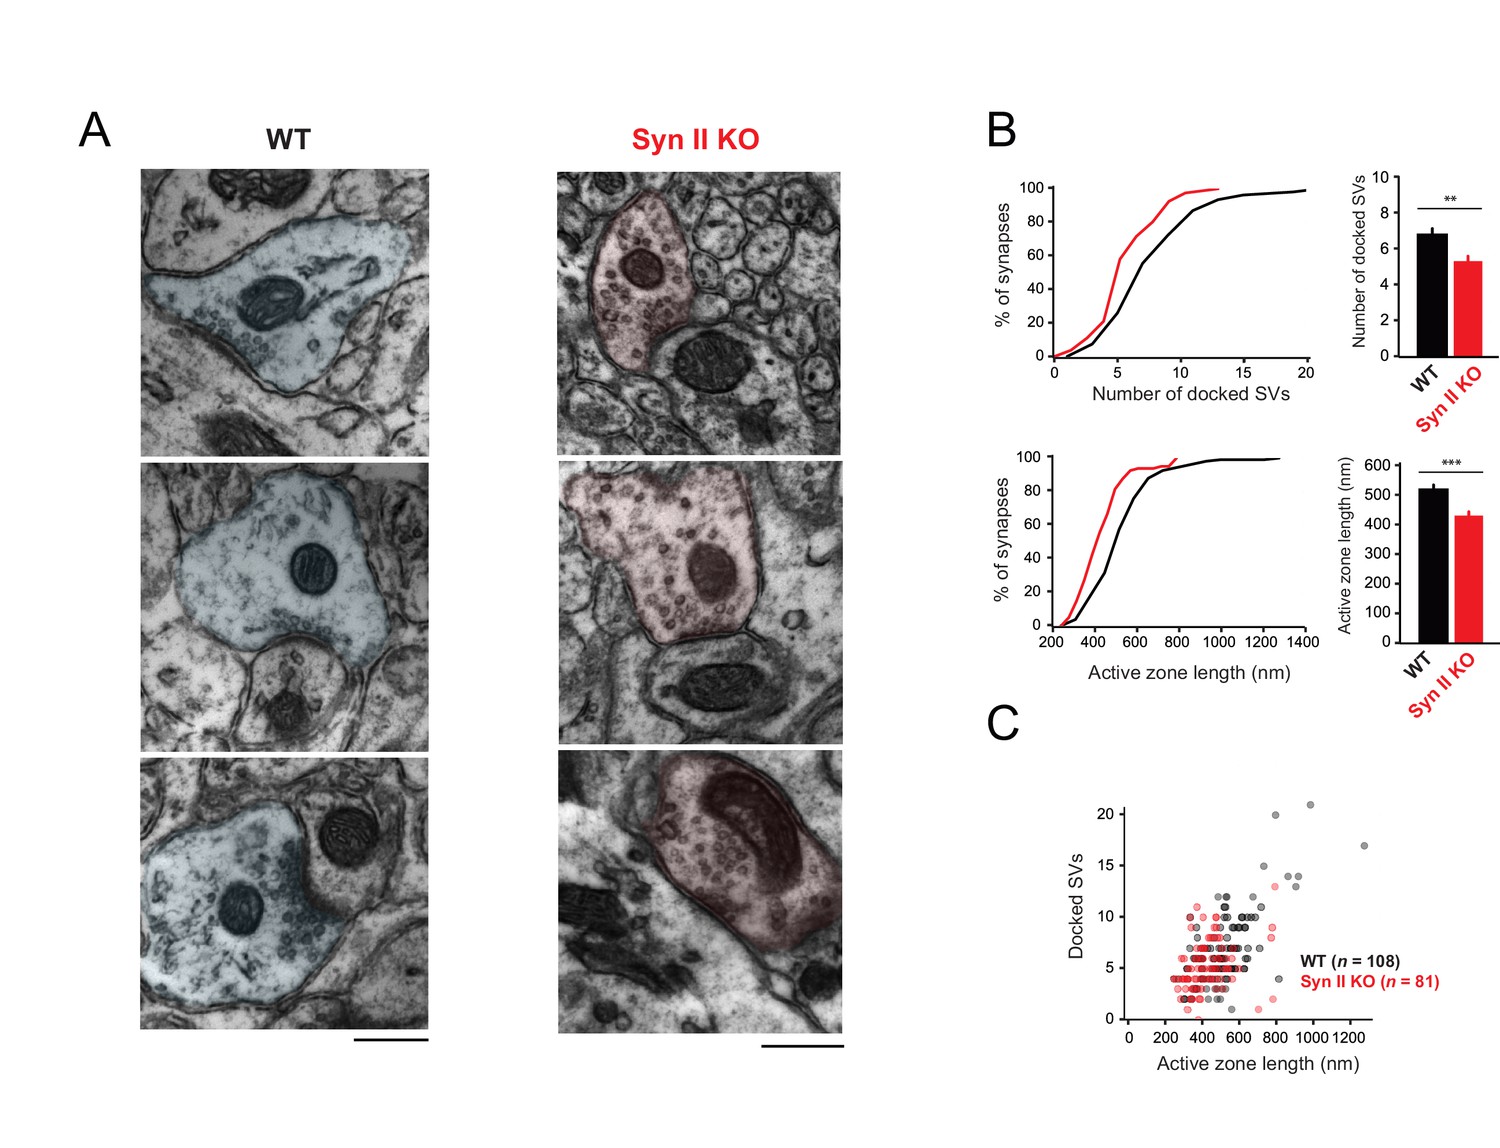
Genetic deletion of Syn II reduces the heterogeneity of ultrastructural profiles of presynaptic terminals at GC-MLI synapses.
(A) Representative micrographs of GC-MLI synapses captured in the upper part of the molecular layer of cerebellar parasagittal sections from WT and Syn II KO mice. (B) Upper panels, Cumulative distribution (left panel) and mean values of the number of docked SVs at GC-MLI synapses from WT and Syn II KO mice (black line/bar and red line/bar respectively). Lower panels, similar representations for the active zone length. Absence of Syn II reduced significantly the number of docked synaptic vesicles and the length of the active zone (mean number of docked synaptic vesicles: WT 6.83 ± 0.35, n = 108; Syn II KO 5.36 ± 0.28, n = 81, mean length of active zone: WT 521.3 nm ± 15.2, n = 108; Syn II KO 432.2 nm ± 13.2, n = 81). (C) Scatter plot of the number of docked synaptic vesicles (SVs) versus the active zone (AZ) length from dataset obtained in B. Genetic deletion of Syn II led to a specific loss of GC bouton endowed with both a long active zone (>800 nm) and high number of docked synaptic vesicles (>15 synaptic vesicles).
Figure 7 with 2 supplements
The diverse profiles of STP of GC boutons differentially shape the spike output pattern in the target MLI.
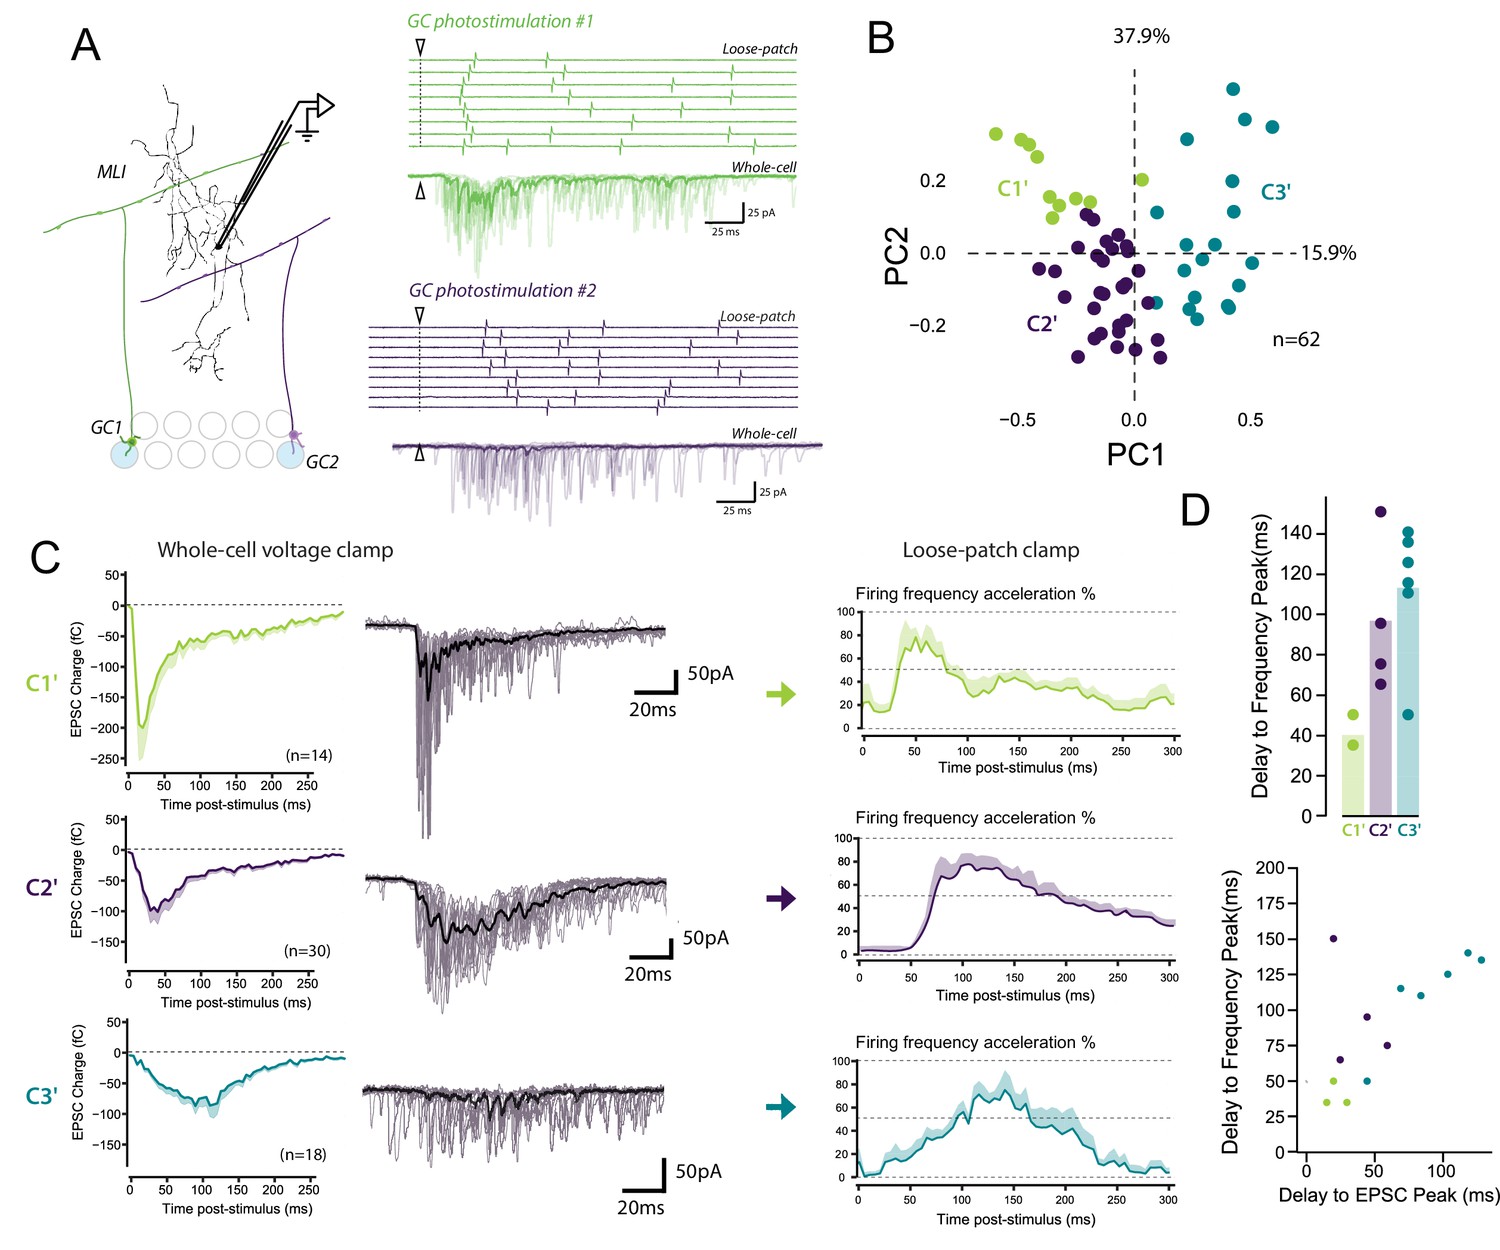
(A) Left panel, schematic representing the design of photostimulation in the granule cell layer. Open circles represent the sites where RuBi-glutamate was uncaged and the blue circles represent the locations where photostimulation elicited responses in the recorded MLI. In this example, 2 GCs localized at distal positions in the granule cell layer contact the recorded MLI. Right panels, representative experiment showing the spike output pattern recorded in loose-patch configuration and EPSCs recording in whole cell configuration in the same MLI following photostimulation of two different locations in the granule cell layer. The white arrowheads and dashed lines represent the onset of photostimulation. Note that the onset of firing is time-locked to the first peak of EPSC charge for photostimulations in location #1 (upper panels) while the onset of firing was more variable for photostimulation in location #2 (lower panels). (B) PCA transformation of the evoked charge time course for 63 unitary contacts (see Materials and methods). The EPSC bursts could be differentiated depending on their tonic or phasic component into three different clusters using k-Means clustering analysis. (C) Representative traces of EPSCs and of the corresponding firing profiles recorded in singles MLI following stimulation of C1’, C2’ and C3’ connections. (D) The delays separating the onset of photostimulation and the time the recorded MLIs were firing at their maximum frequency (referred as delay to frequency peak, recorded in loose-patch configuration) and the delays separating the onset of photostimulation and the time EPSCs are reaching their maximum value (referred as delay to EPSC peak, recorded in voltage-clamp configuration) were measured for 12 GC-MLI synapses for which we were able to correlate the spike output pattern with STP profile (C1’, C2’ or C3’). Upper panel, the bar plot shows that stimulation of C1’ connections led to faster accelerations of MLI firing rate than stimulation of C2’ and C3’ connections. Lower panel, the scatter plot shows a clear correlation between the delay to EPSC peak and the delay to frequency peak recorded. Each experimental point was associated with its STP profile by using the same color code for categories than in the upper graph.
Figure 7—figure supplement 1
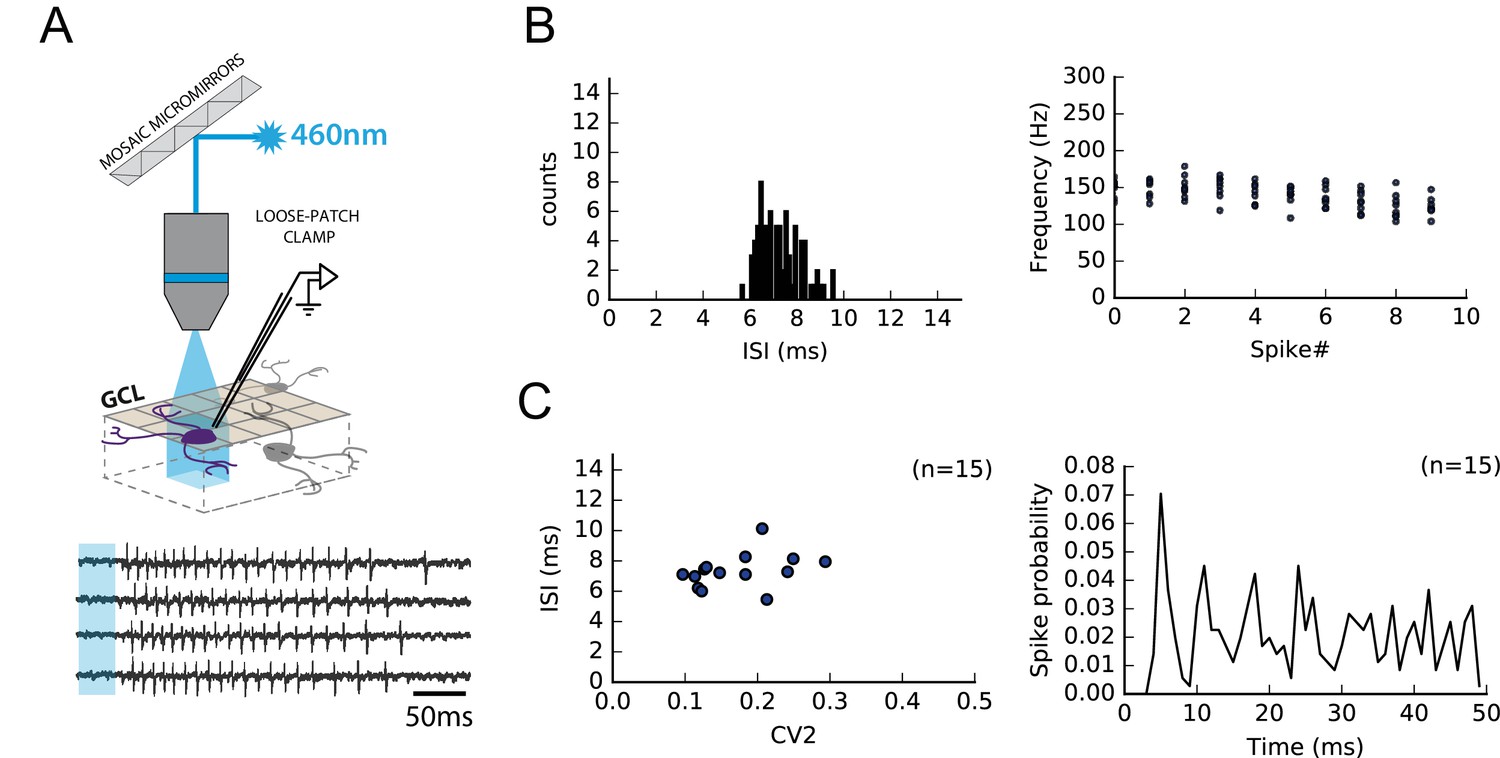
RuBi-glutamate uncaging induced reproducible high-frequency bursts in GCs.
Because the fine adjustment of the stimulation strength required to perform minimal stimulations cannot be achieved during MLI loose-patch recordings, individual GCs were activated by photostimulation of caged-glutamate (RuBi-glutamate, 100 µM; Materials and methods). (A) Schematics showing a GC activated following RubiGlutamate photo-dissociation upon GC layer illumination. Loose-patch clamp recordings from individual GCs show that RubiGlutamate uncaging induces reproducible bursts of APs. (B) Left, GC firing parameters following RubiGlutamate uncaging were very stable from one GC to another; in all recorded GCs, inter-spike intervals (ISIs) were restricted to 5–10 ms. Right, following RubiGlutamate uncaging, the firing frequencies of GC during the 10 first APs were highly conserved. (C) Left, Group data showing a lack of significant differences in the ISI and in firing variability (CV2) between recorded GC (n = 15). Right, Post-stimulus histogram of the different spikes from all trials of 15 different cells aligned on spike#1.Photostimulations induced bursts in GCs with a maximal delay of 34 ms (mean delay 31.8 ms ± 1.92 ms). These bursts were composed of an averaged number of 28 spike ± 4 spikes elicited with a mean frequency of 135 Hz ± 19 Hz.
Figure 7—figure supplement 2
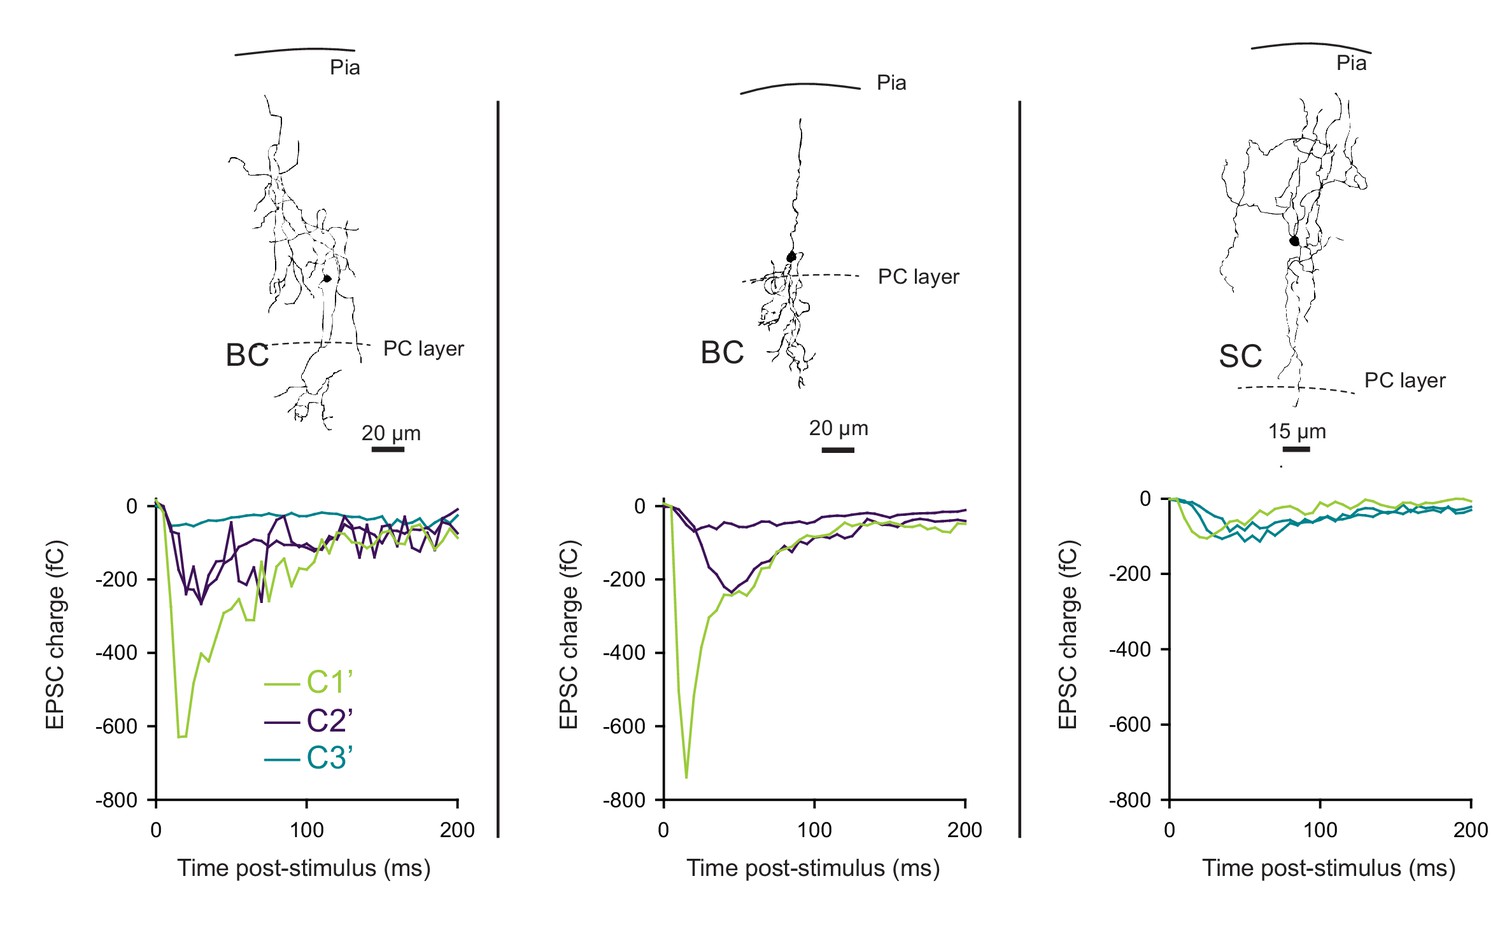
The profile of STP is not determined by the target cell in photostimulation experiments.
Unitary synaptic responses from three different GCs recruited by photostimulation were recorded on 2 BCs (left and middle graphs) and 1 SC (right graph). MLI subtype and position in the molecular layer were determined by post hoc reconstruction. The corresponding STP profile of each synaptic input was classified using PCA transformation of synaptic responses followed by k-mean clustering analysis. Our results show that either BCs or SCs were contacted by connections belonging to different classes. Photostimulation experiments confirm that the behavioral heterogeneity of excitatory synaptic inputs contacting same MLIs.
Figure 8
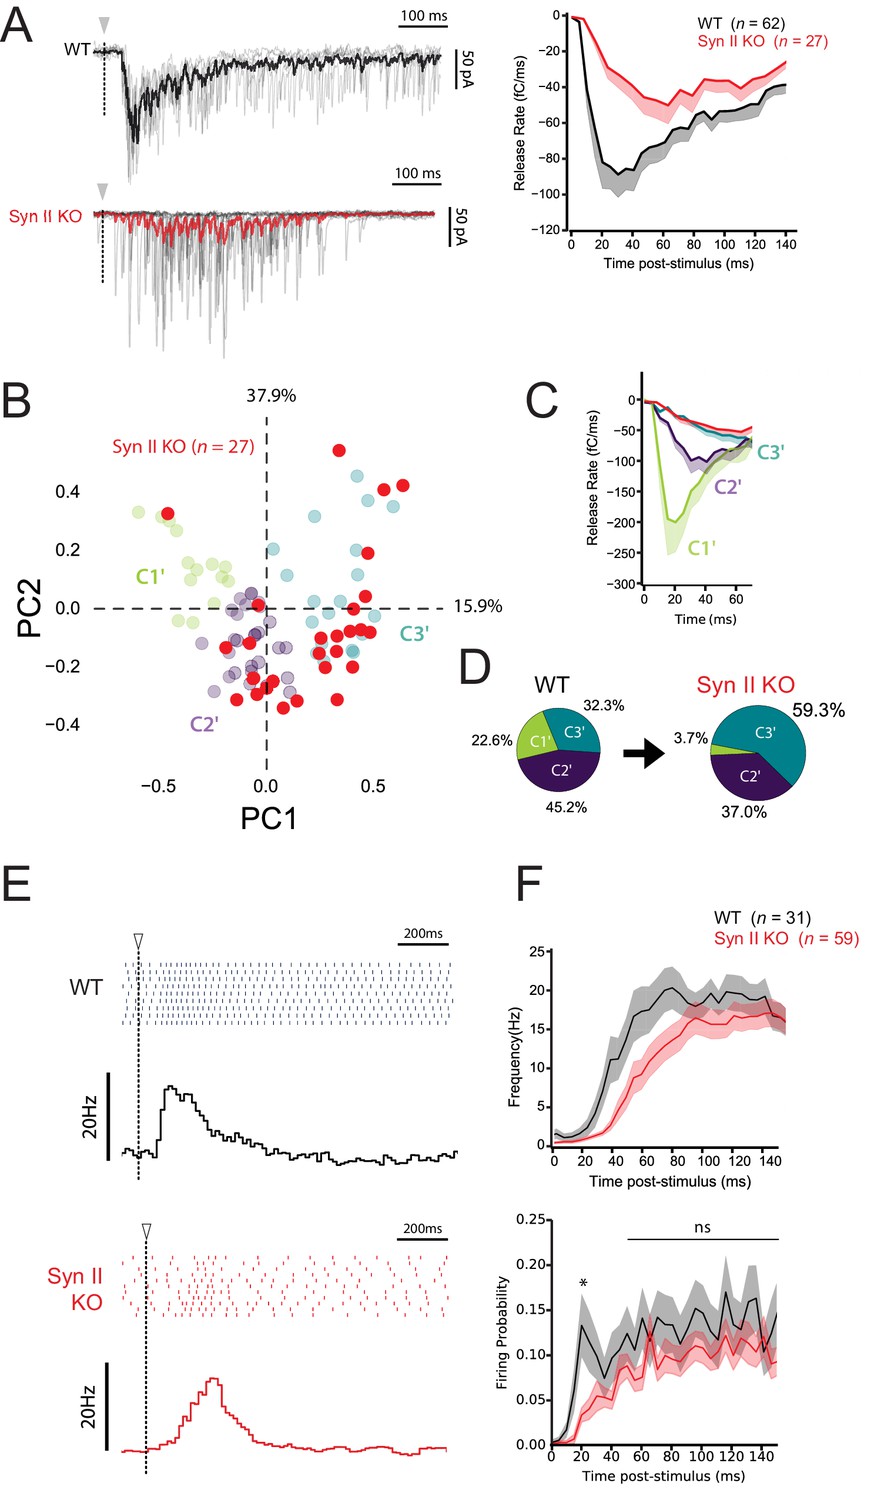
Synapse-specific expression of Syn II diversifies the profile of excitatory drives on MLIs and expands the coding range of MLIs.
(A) Left panels, representative traces of superimposed EPSCs recorded in WT and Syn II KO mice after photostimulations in the GCL (same experimental design than in Figure 7A). Right panel, averaged values of EPSC charges versus the time following photorelease of RuBi-glutamate recorded in WT and Syn II KO mice (black and red traces respectively). Note the strong reduction in the peak of charge in Syn II KO mice. (B) PCA transformation of EPSC properties obtained in WT (green, purple and blue points, same dataset than in Figure 7B) and Syn II KO mice (red points). (C) Line plots display the normalized release time course from GC-MLI synapses belonging to clusters C1’, C2’, C3’ (WT mice, same color code as in B) and GC-MLI synapses from Syn II KO mice (red line). (D) The pie chart shows a partial reduction of STP heterogeneity in Syn II KO condition with a strong reduction of phasic profiles (C1’). (E) Typical raster plots and peristimulus time histogram obtained in WT and Syn II KO mice following photostimulation of unitary GC-MLI synapses. The onsets of photostimulation are represented with white arrowheads and dashed lines. (F) Means values of the firing frequency (upper graph) and the firing probability (lower graph) of MLIs following photostimulation of unitary GC-MLI synapses in WT and Syn II KO mice (black and red lines, respectively).
Author response image 1
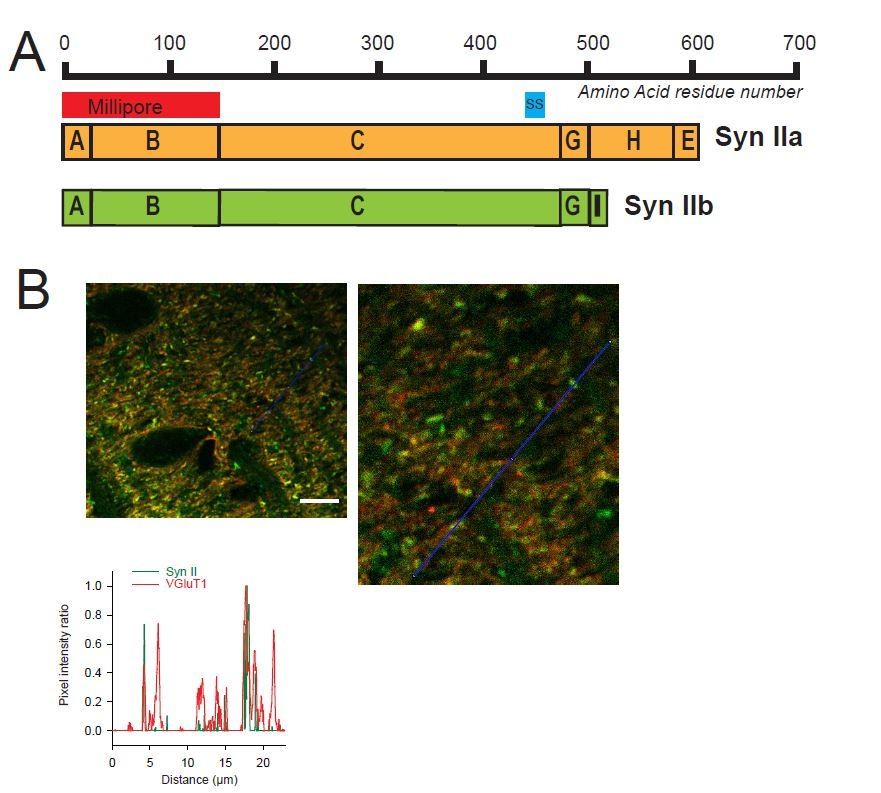
Heterogeneous expression of Syn II at GC-MLI synapses.
(A) Domain structure of mammalian Syn IIa and Syn IIb. The red and blue bar represent the domains used as immunogen to produce Millipore and Synaptic Systems (SS) Anti-Syn II antibodies. (B) Representative merged images of Syn II (Alexa-488, green) /VGluT1 (Alexa-55, red) immunostaining using Millipore anti-Syn II antibodies. Yellow puncta denote a presence of Syn II in GC boutons while red puncta denote an absence of Syn II in these synapses. Green puncta correspond to Syn II+ inhibitory synapses devoid of VGluT1. Images were captured in the molecular layer from a cerebellar section. The profile plot (blue line) confirms the presence of GC boutons devoid of SynII (red peaks not associated with a green peak). Calibration bar (left image): 7.5 μm. Anti-Syn II: Millipore #MABN1573, clone 19.4 Purified mouse monoclonal IgG2aκ antibody Immunogen: Purified recombinant rat Syn II Epitope: Domains A and B used at 1/500. Anti-Syn II: Synaptic Systems #106 211, clone 27E3 Purified mouse monoclonal IgG antibody Immunogen: Synthetic peptide corresponding to AA 440 to 458 from rat Syn II Epitope: AA 440 to 458 from rat Syn II used at 1/500
Tables
Key resources table
| Reagent type (species) or resource | Designation | Source or reference | Identifiers | Additional information |
|---|---|---|---|---|
| Genetic reagent (M. musculus) | Syn II KO mice (CD1 backround) | PMID 7777057 | See Material and methods | |
| Antibody | Rabbit anti-Syn I | Synaptic Systems | Cat# 106 104 | IHC (1:500) |
| Antibody | Monoclonal anti-Syn II Clone 27E3 | Synaptic Systems | Cat# 106 211 | IHC (1:500) |
| Antibody | Monoclonal anti-Syn II Clone 19.4 | Millipore | Cat# MABN 1573 | IHC (1:500) |
| Antibody | Guinea pig anti-VGluT1 | Synaptic Systems | Cat# 135 304 | IHC (1:600) |
| Antibody | Goat anti-Rabbit- Alexa 647 | Molecular Probes | Cat# A-21070 RRID:AB_2535731 | IHC (1:1000) |
| Antibody | Goat anti-Mice Alexa-488 | Molecular Probes | Cat# A-21141, RRID:AB_141626 | IHC (1:1000) |
| Antibody | Goat anti-Guinea Pig Alexa-555 | Molecular Probes | Cat# A-21435, RRID:AB_2535856 | IHC (1:1000) |
| Chemical compound, drug | Picrotoxin - GABAA-R blocker | Abcam | Cat# Ab120315 | 100 µM in ACSF |
| Chemical compound, drug | CGP 52432 GABAB-R blocker | Abcam | Cat# Ab120330 | 10 µM in ACSF |
| Chemical compound, drug | D-AP5 - NMDA-R blocker | Abcam | Cat# Ab120003 | 100 µM in ACSF |
| Chemical compound, drug | AM251 CB1-R blocker | Abcam | Cat# Ab120088 | 1 µM in ACSF |
| Chemical compound, drug | JNJ 16259685 – mGluR1 blocker | Tocris | Cat# 2333 | 2 µM in ACSF |
| Chemical compound, drug | Atto-594 | Sigma-Aldrich | Cat# 08637 | 50 µM in internal solution |
| Software, algorithm | Code used for analyzing MLI firing following photostimulation of single GC | This paper (Dorgans, 2019a) | Python code deposited on GitHub: https://github.com/Dorgans/eLife2018-STP-GC-MLI/blob/master/2017051_GC_photostimulation__MLI_FIRING_ANALYSIS.py | |
| Software, algorithm | Code used for analyzing EPSC charge following photostimulation of single GC | This paper (Dorgans, 2019b) | Python code deposited on GitHub: https://github.com/Dorgans/eLife2018-STP-GC-MLI/blob/master/20170711_GC_photostimulation_GC-MLI_CHARGE_ANALYSIS.py | |
| Software, algorithm | Code used for PCA transformation and k-mean clustering analysis of EPSC charges following photostimulation | This paper (Dorgans, 2019c) | Python code deposited on GitHub: https://github.com/Dorgans/eLife2018-STP-GC-MLI/blob/master/20170718_GC_photostim_MLI_SeqPatch_PCA%2Cclustering.py | |
| Software, algorithm | Code used for PCA transformation and k-mean clustering analysis of EPSC charges during high frequency stimulations | This paper (Dorgans, 2019d) | Python code deposited on GitHub: https://github.com/Dorgans/eLife2018-STP-GC-MLI/blob/master/20170718_GC_photostim_MLI_SeqPatch_PCA%2Cclustering.py |
Additional files
-
Transparent reporting form
- https://doi.org/10.7554/eLife.41586.018
Download links
A two-part list of links to download the article, or parts of the article, in various formats.
Downloads (link to download the article as PDF)
Open citations (links to open the citations from this article in various online reference manager services)
Cite this article (links to download the citations from this article in formats compatible with various reference manager tools)
Short-term plasticity at cerebellar granule cell to molecular layer interneuron synapses expands information processing
eLife 8:e41586.
https://doi.org/10.7554/eLife.41586


