In-depth human plasma proteome analysis captures tissue proteins and transfer of protein variants across the placenta
- Karolinska Institute, Sweden
- Science for Life Laboratory, Sweden
- Royal Institute of Technology, Sweden
Figures
Figure 1 with 7 supplements
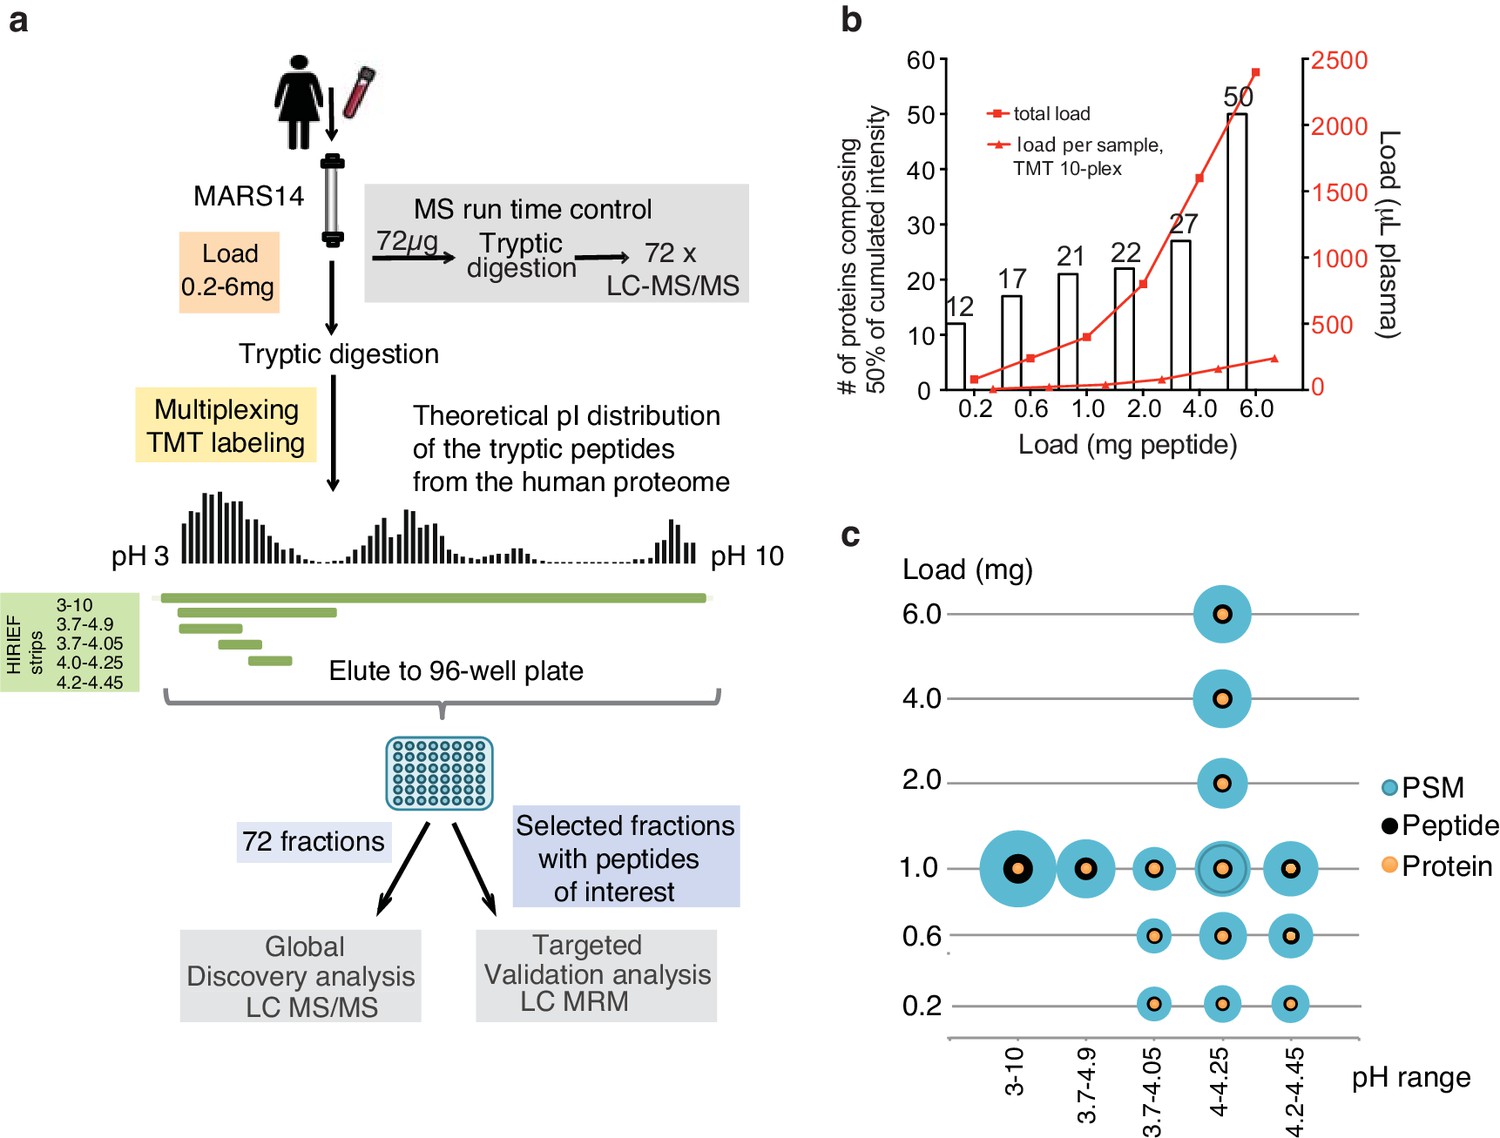
Plasma HiRIEF method optimization and performance assessment.
(a) An overview of the method optimization workflow. Prostate specific antigen was spiked into female plasma at 4 ng/mL. The plasma was depleted and digested and total peptide sample loads between 0.2 and 6 mg were evaluated on five different HiRIEF pH ranges. See Supplementary file 1 for a summary of the evaluated conditions. For multiplexing and reproducibility calculations tandem mass tags (TMT)-labeling was applied. Fractionated samples were evaluated based on the number of protein identifications using LC-MS/MS and analytical depth using LC-MRM analysis of fractions containing PSA peptide. (b) The effect of sample load on analytical depth. The bar chart shows the number (#) of identified proteins making up 50% of total sample intensity (MS1 peak area) as a function of sample loaded onto the HiRIEF pH strips. The corresponding amount of crude plasma used in each condition is shown as read lines (c) Combined load and pH range evaluation. Bubble plots showing the effect of the sample load and the HiRIEF pH range on the number of peptide spectrum matches (PSMs), peptide and protein identifications, respectively. The size of the bubbles is proportional to the number of identifications in each experiment.
Figure 1—figure supplement 1
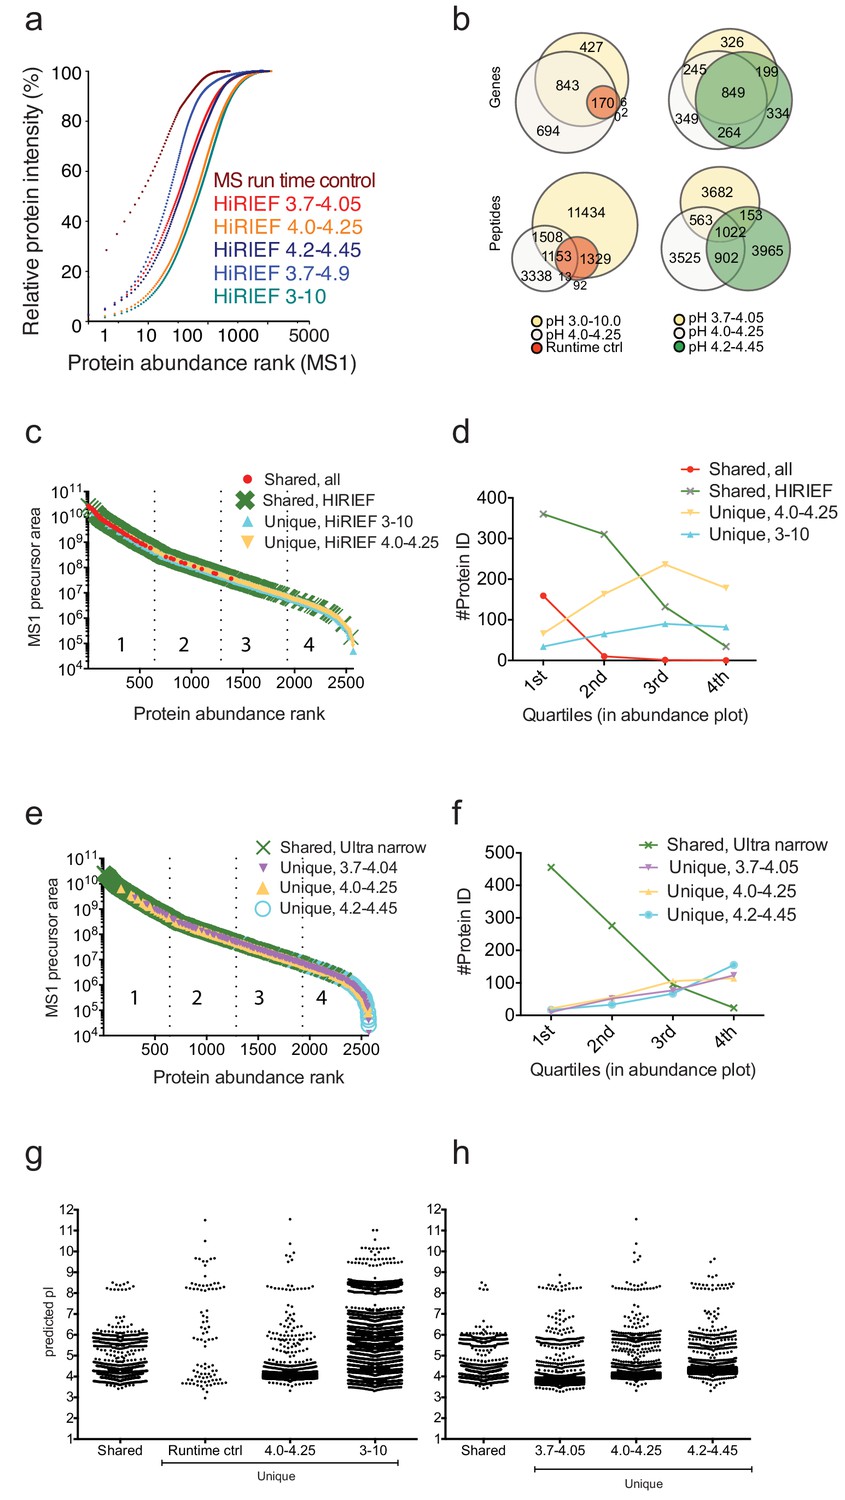
Comparison of overlap and performance between different pI ranges.
(a) The effect of HiRIEF fractionation on analytical depth and proteome coverage. The cumulative plot shows contribution of each protein (x-axis) to the total protein intensity (y-axis) for each of the HiRIEF pH ranges evaluated. Also included is the MS runtime control as an example of unfractionated sample. A comparison of the number of overlapping and uniquely detected proteins and peptides across the different experimental settings are shown in (b). The HiRIEF pH ranges 3–10 and 4.0–4.25 identified the highest number of proteins. The HiRIEF range 4.0–4.25 standing out from the other ultra-narrow ranges likely due to covering the most peptide dense area of the pH range (Figure 1—figure supplement 4a). (b) Venn diagrams showing overlapping and uniquely detected peptides and proteins (gene centric) comparing HiRIEF pH ranges and compared to the unfractionated MS runtime control. In figures (c–h) are shown the continued analysis of the proteins and peptides identified in (b). (c) Proteins ranked according to abundance and colored according to the experimental setting (HiRIEF broad range, ultra narrow ranges, or MS runtime control) they were uniquely detected in or whether they were detected in several conditions. (d) Protein identification numbers per abundance segment (the abundance range was divided into four segments, with the 1st quartile consisting of the top 25% most abundant proteins and so on). The ultra-narrow HiRIEF pH range (4.0–4.25) tends to increase the number of identifications among low abundance range proteins. HiRIEF broad range (3-10) performs equally well across the whole abundance range. Without fractionation (MS runtime control) only high-abundance proteins are identified. A comparative GO enrichment analysis (not shown) revealed enrichment (GO term Molecular Function) of cell adhesion molecule-binding proteins (i.e. membrane proteins) among the broad range HiRIEF unique proteins, an enrichment of calcium-ion-binding proteins (mainly cytosolic proteins) among the ultra-narrow HiRIEF range unique proteins and enriched among the MS runtime control proteins was serine-type endopeptidase activity (proteins central to the complement cascade). (e) Proteins ranked according to abundance and colored according to the experimental setting (HiRIEF ultra narrow pH ranges) they were uniquely detected in or whether they were detected in several conditions. (f) The HiRIEF ultra narrow ranges detect very similar numbers regardless of protein abundance area. Proteins detected across all pH ranges tend to be of higher abundance. A comparative GO analysis showed for the 3.7–4.05 uniquely detected an enrichment (GO term Molecular Function) of cell adhesion molecule binding, for the 4.0–4.25 an enrichment of vacuolar proteins (GO term Cellular part), and for the 4.2–4.45 a enrichment (GO term Molecular Function) of calcium ion binding. We next investigated the predicted pI distribution of the unique and shared peptides comparing (g) MS runtime control, HiRIEF broad- and ultra narrow pH ranges and (h) the ultra-narrow ranges (3.7–4.05, 4.0–4.25 and 4.2–4.45). The unique peptides pI match respective strip-unique pH-range while the shared peptides have predicted pI in the shared pH region.
Figure 1—figure supplement 2
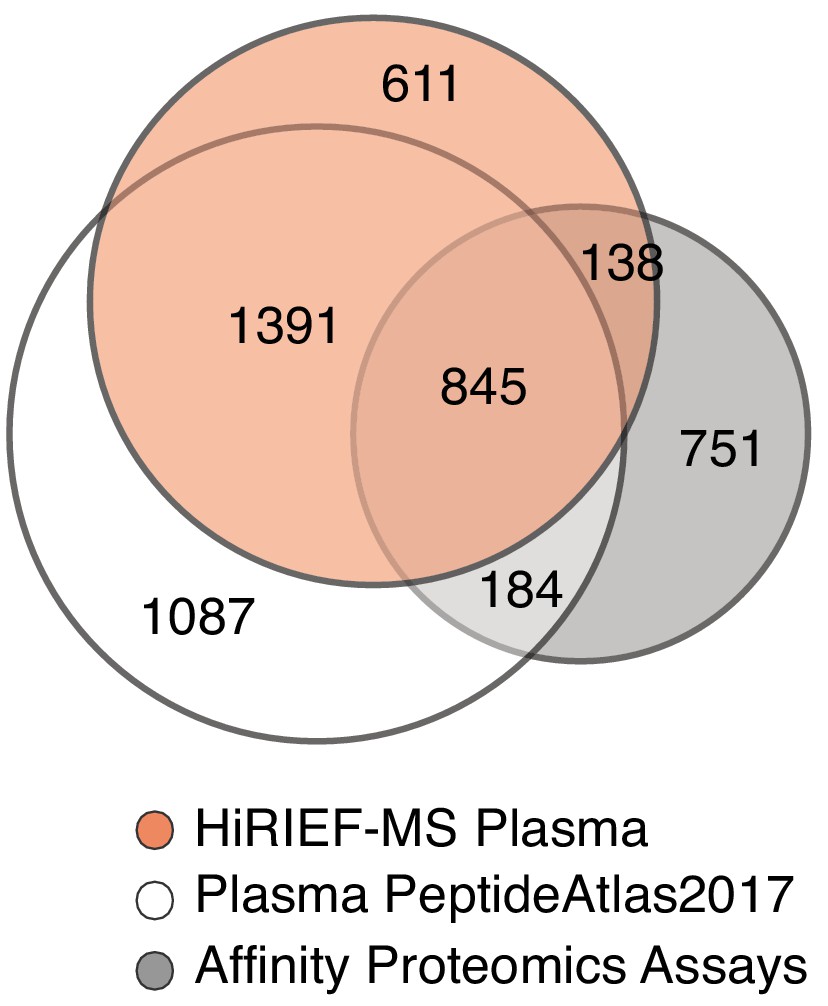
Venn diagram showing protein (gene centric) overlap between plasma HiRIEF data, human plasma PeptideAtlas build 2017 and plasma proteins currently targeted with affinity proteomics assay.
https://doi.org/10.7554/eLife.41608.005
Figure 1—figure supplement 3
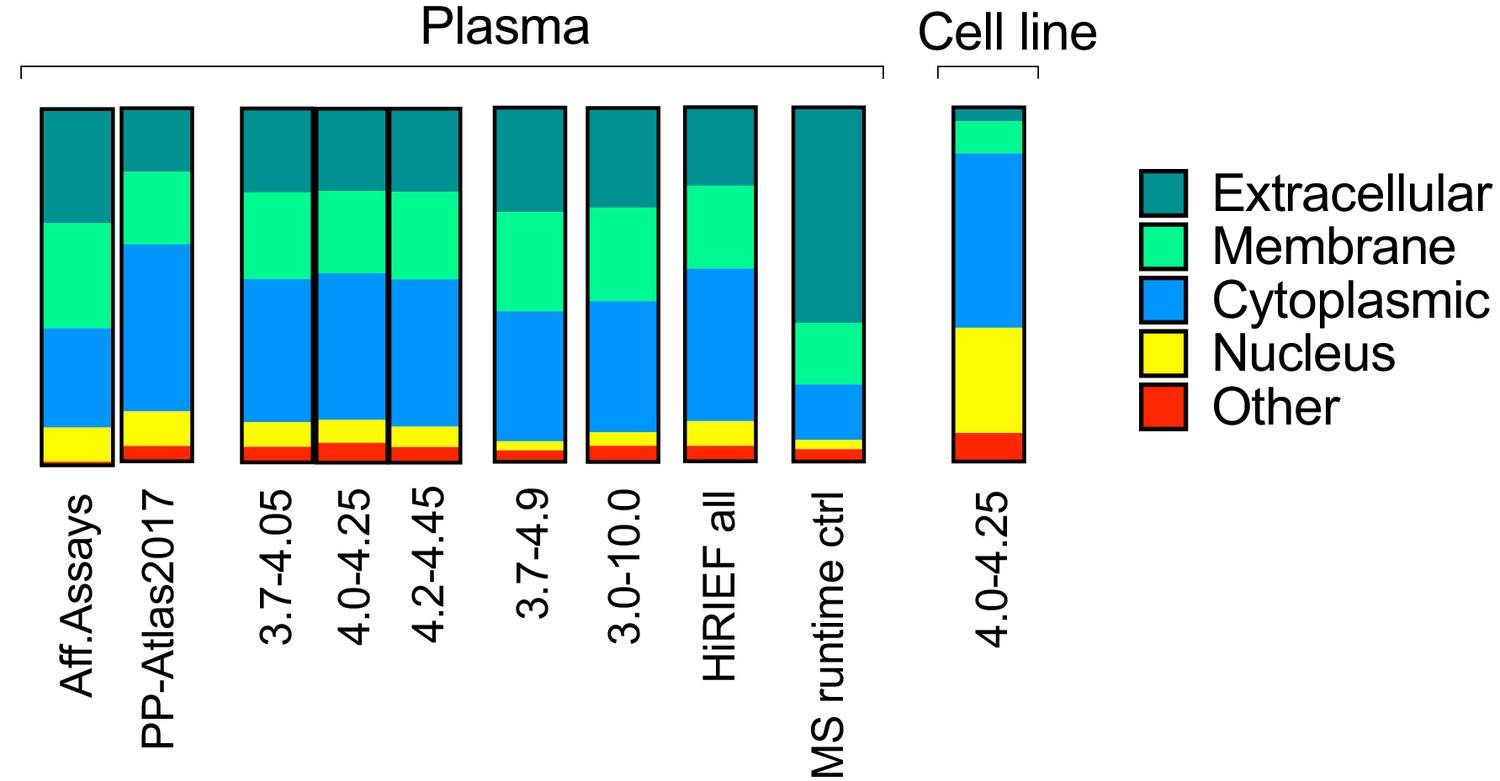
Proportional distribution of extracellular, membrane, cytoplasmic and nuclear proteins detected in plasma using HiRIEF (all pH ranges, alone or summed), no fractionation (MS runtime control) or the compiled data sets in the plasma PeptideAtlas build 2017.
Cell line data analyzed by HiRIEF LC-MS/MS also included as comparison. As shown, the proportion differs when comparing MS runtime control to the plasma HiRIEF data (large proportion of extracellular proteins) and the cell line data (large proportion of nuclear and cytoplasmic proteins), while no major differences is seen when comparing with the Plasma PeptideAtlas data sets.
Figure 1—figure supplement 4
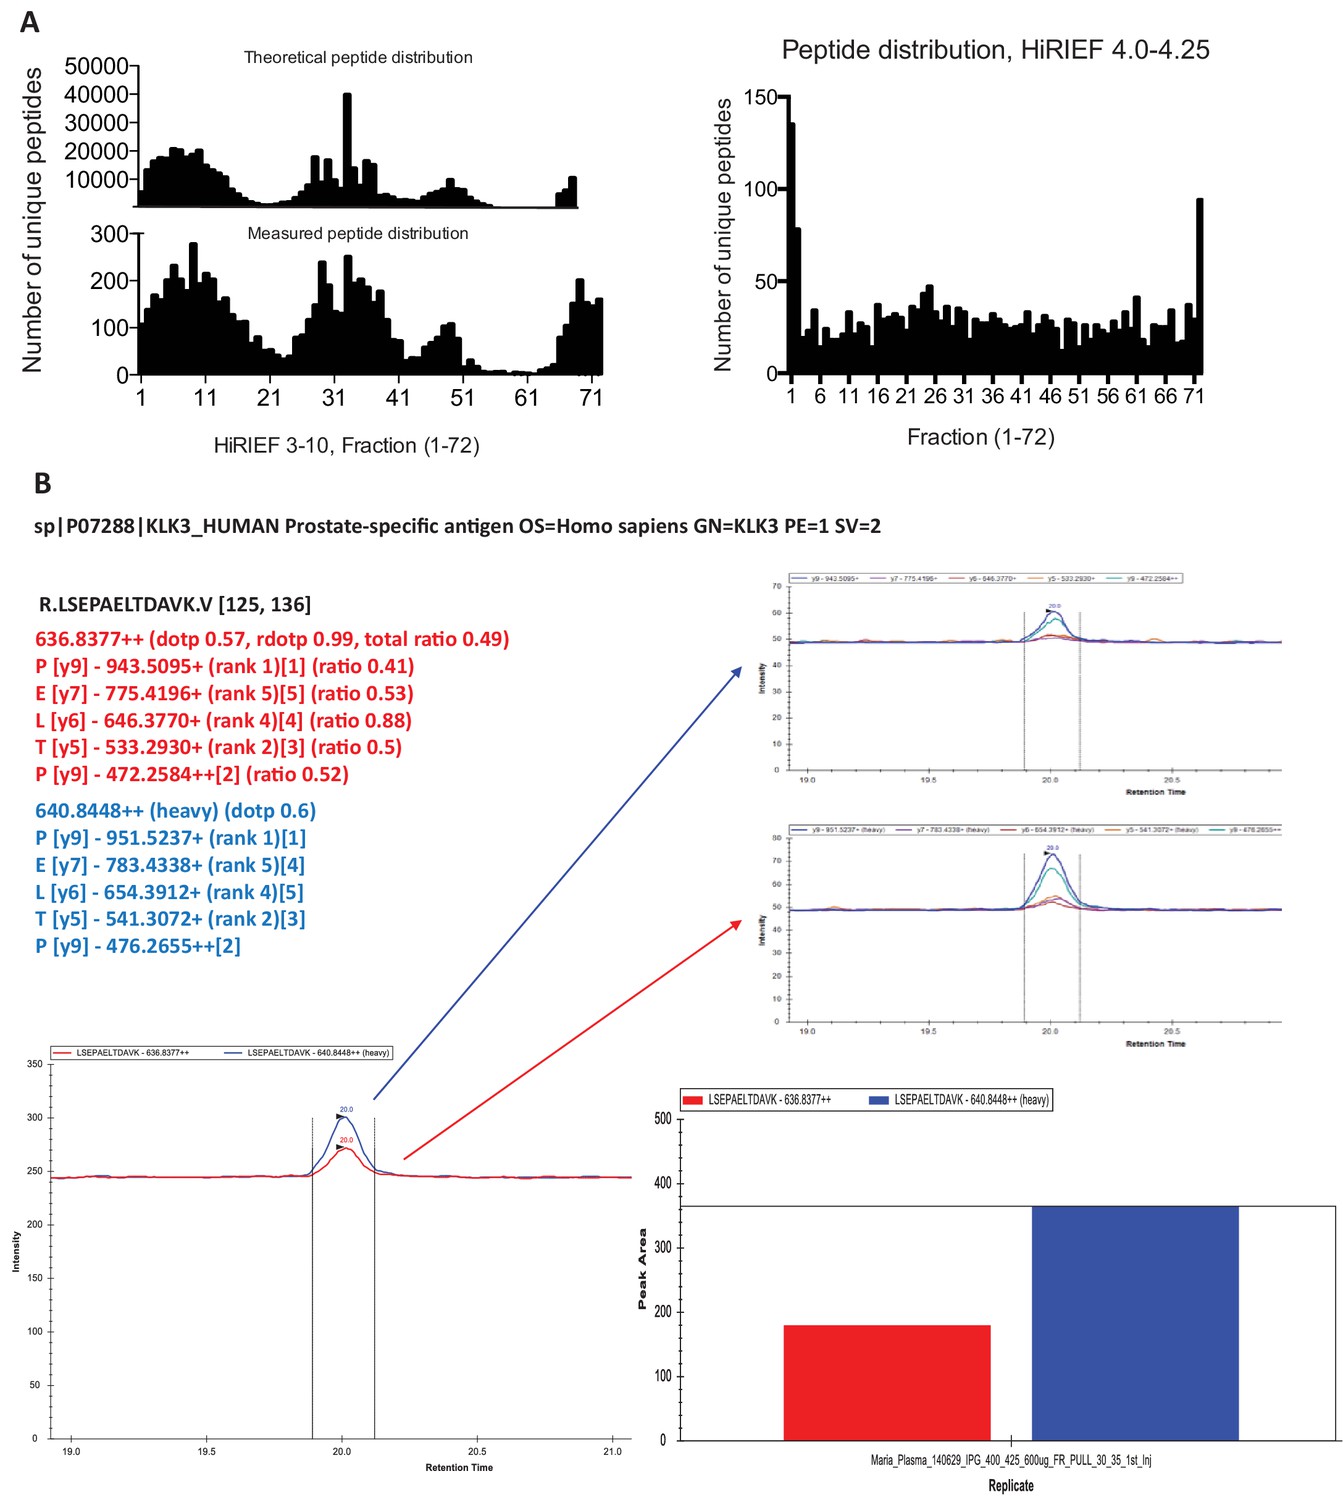
Use of theoretical peptide pI in global and targeted plasma HiRIEF.
(a) Histograms showing the distribution of unique peptides per HiRIEF fraction (in total 72) using broad range (3.0–10.0) HiRIEF compared with the theoretical peptide distribution of the human proteome based on sequence pI. Also shown is the (measured) distribution of the peptides from the peptide-dense area at pH 4.0–4.25. (b) Detection and quantification of PSA using multiple-reaction monitoring (MRM). The analysis was performed on HiRIEF pH range 4.0–4.25, fractions 30–35 using 0.6 mg sample load.
Figure 1—figure supplement 5
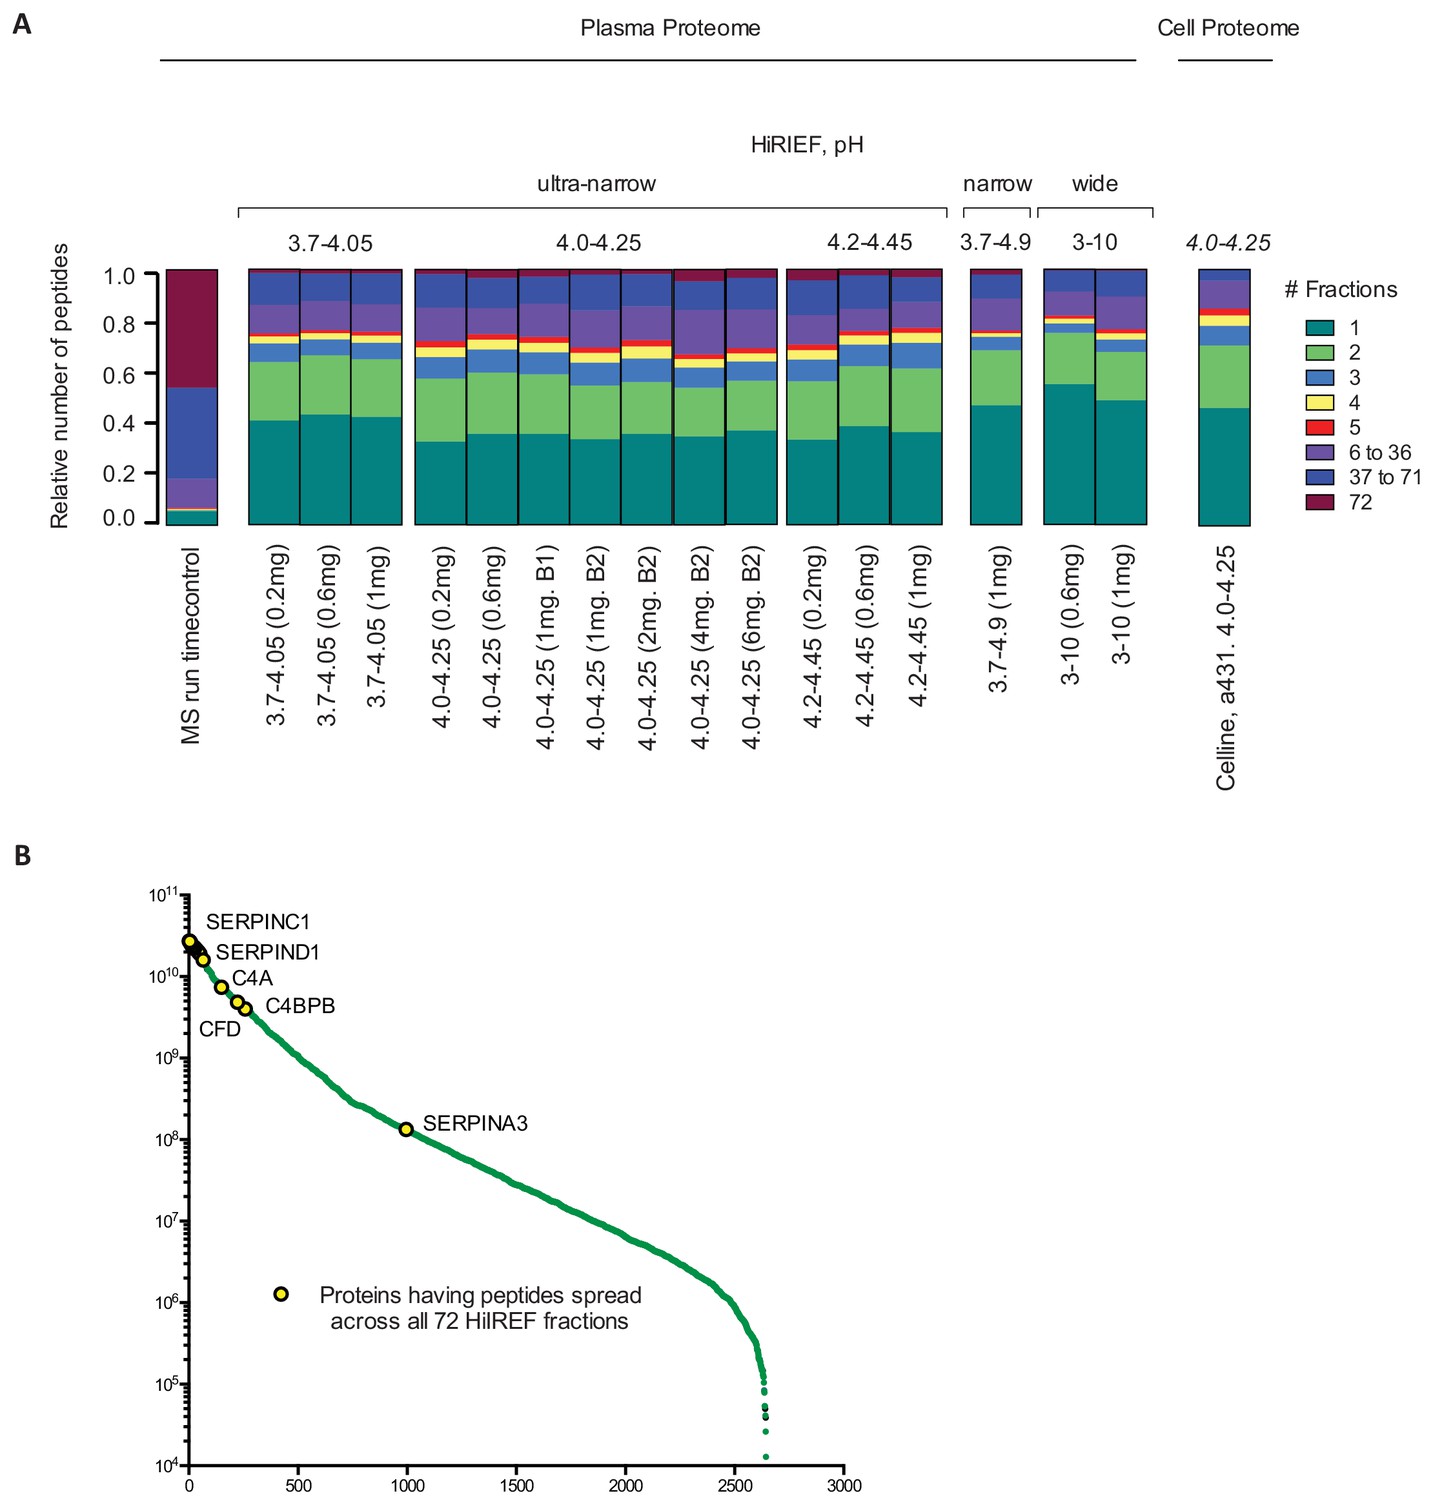
Peptide spread across HiRIEF fractions.
(a) Stacked bar charts showing the relative number of peptides focused in one fraction or spread over 2, 3, 4, 5 and >5 fractions, respectively, for each pI interval and loaded amount. A comparison with cell line data is also included. Overall, increasing the load to <6 mg had no negative effect of the performance of the HiRIEF separation in terms of peptide focusing accuracy; instead, we could detect a similar spread over fractions between all loads with approximately 60% of peptides focusing in one or two fractions. For broad range strips (3-10), each fraction covers a larger pH interval compared to ultra narrow, resulting in a higher proportion of peptides focused in one fraction. (b) Analyzing the peptides with the largest spread, it was evident that these peptides were derived from high-abundance proteins with reported concentrations between 20–720 ug/mL.
Figure 1—figure supplement 6
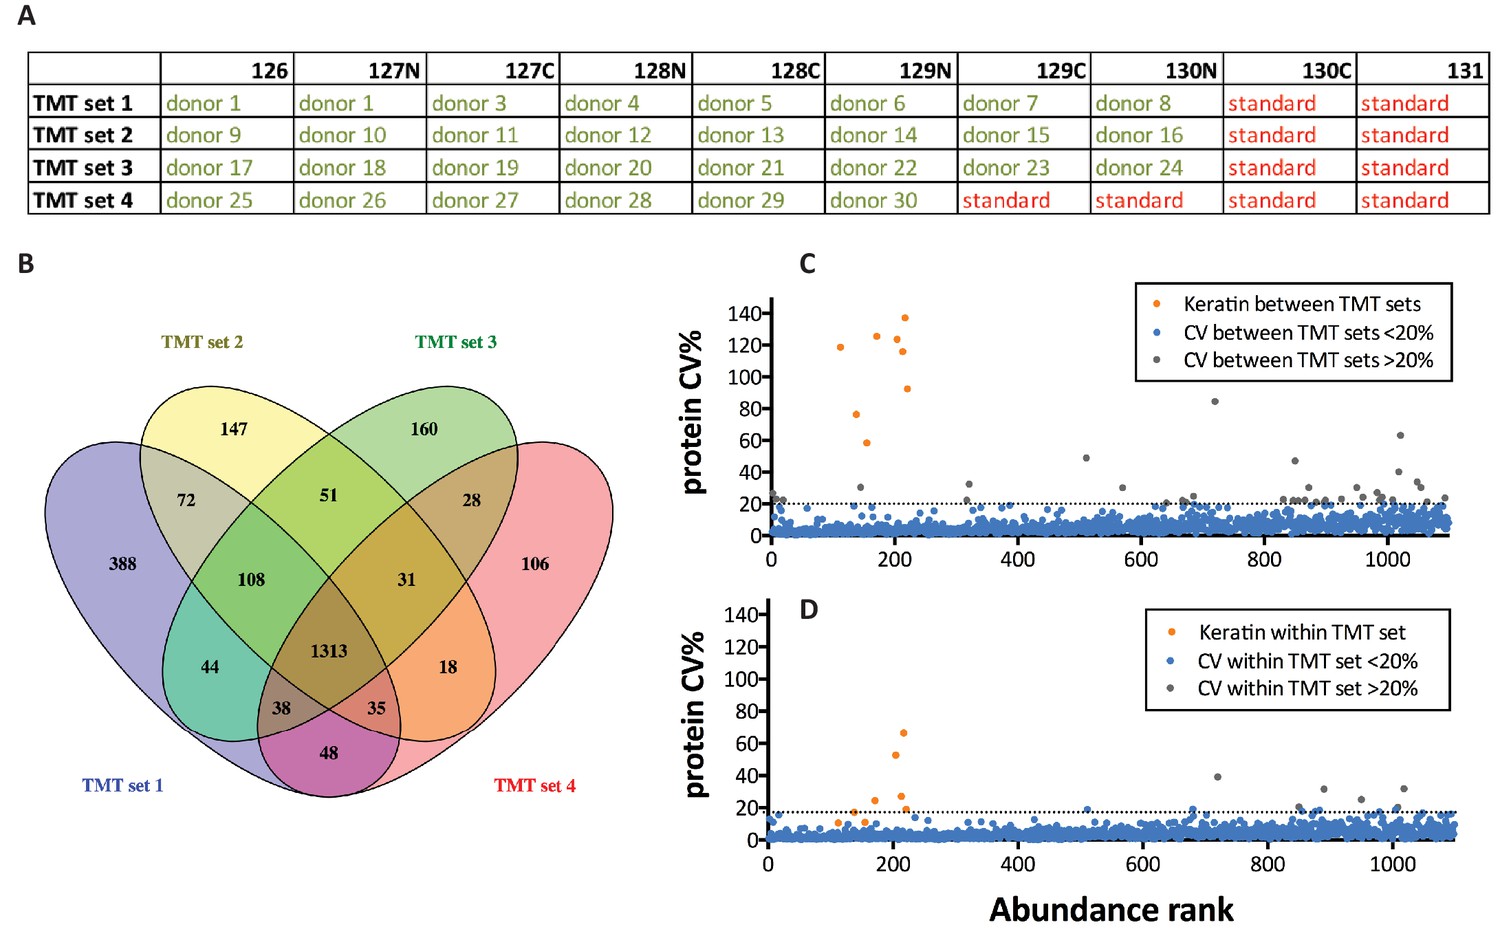
Reproducibility assessment, ‘Healthy donors cohort’.
(A) Overview of the study design used for the TMT-labeling approach. (B) Overlap between 4 TMT sets in terms of number of identified gene symbols. (C) Distribution of CVs between the four sets based on TMT-reporter ion ratios of the replicate of pooled internal standard (N = 4). Abundance rank from high to low abundance on x-axis based on #PSM. (D) CVs within one set based on TMT-reporter ion ratios of replicate pooled internal standards (N = 3). Abundance rank from high to low abundance on x-axis based on #PSM.
Figure 1—figure supplement 7
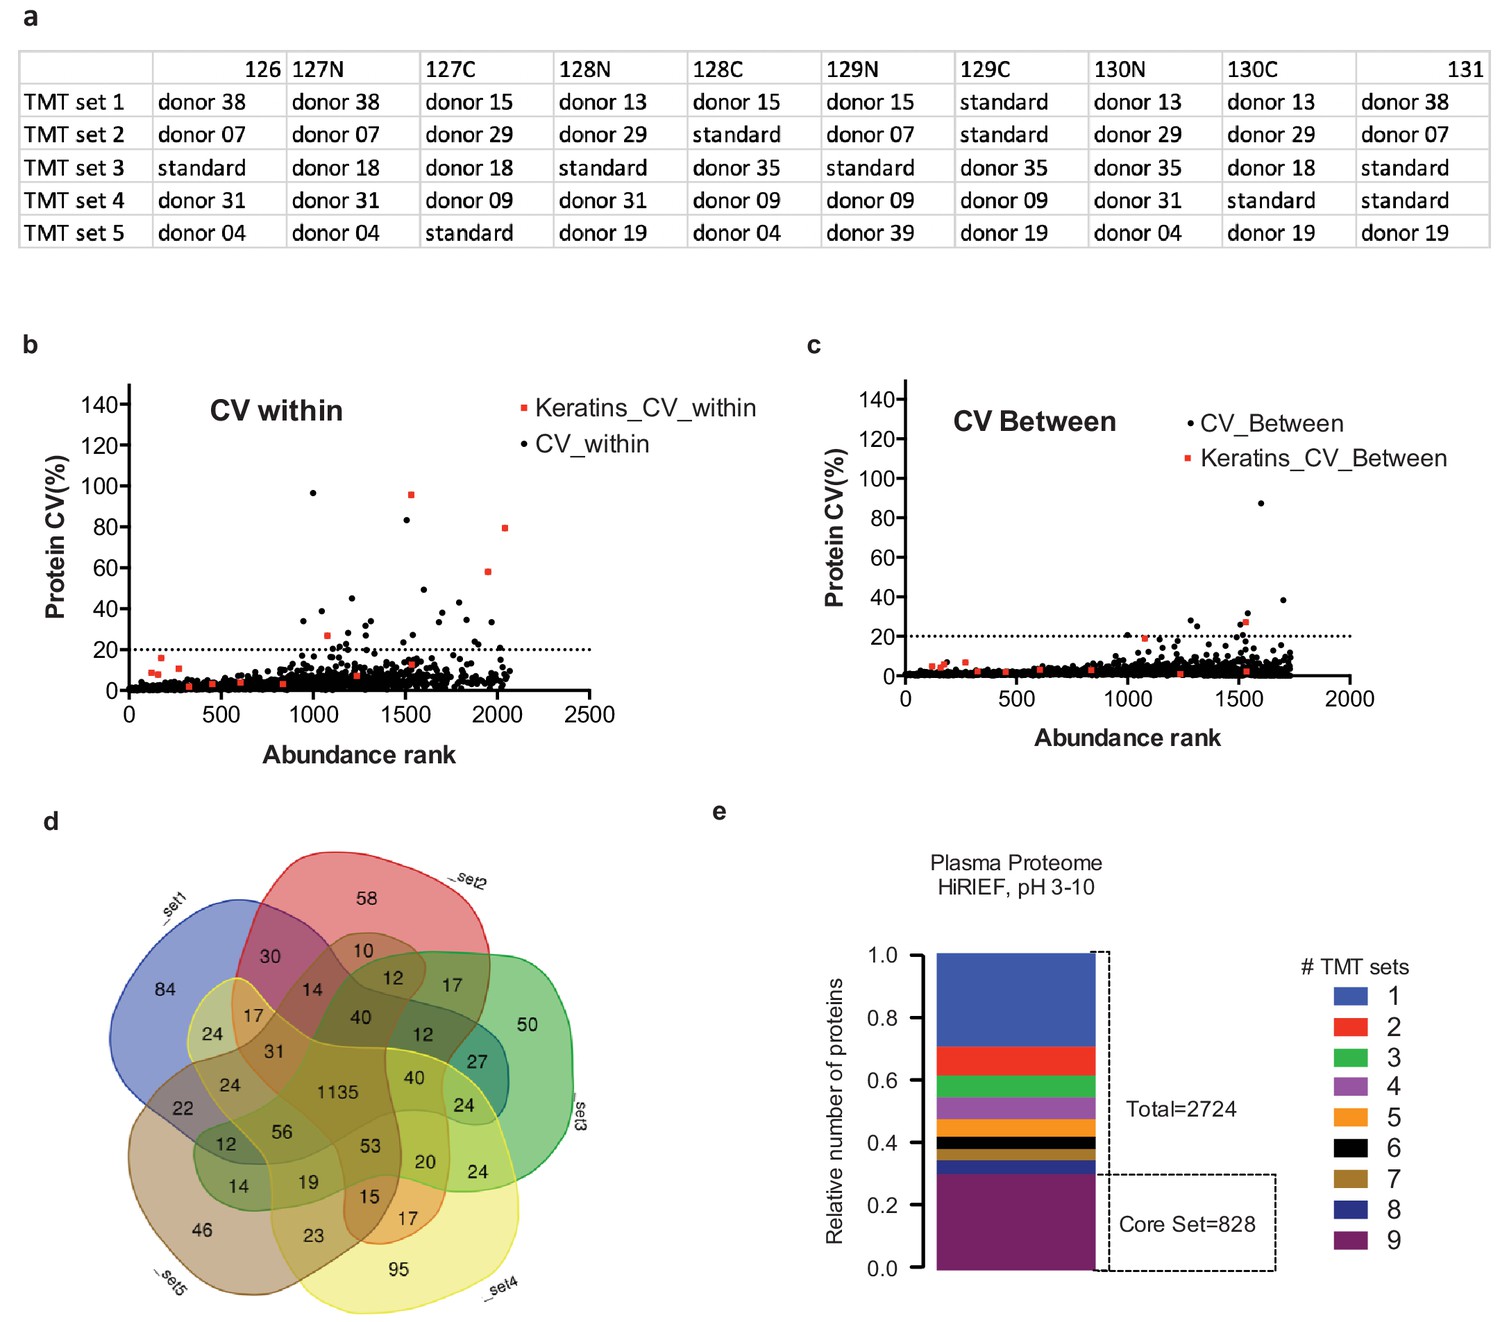
Reproducibility assessment, ‘Female longitudinal cohort’.
(a) Overview of the study design used for the TMT-labeling approach in the second longitudinal cohort. (b) CVs within one set based on TMT-reporter ion ratios of replicate pooled internal, (c) Distribution of CVs between the five sets based on TMT-reporter ion ratios of the replicate of pooled internal standard (N = 4). Abundance rank from high to low abundance on x-axis based on #PSM (d) Overlap between 5 TMT sets in terms of number of identified gene symbols. (e) Protein core set analysis on both cohorts (=9 TMT sets), showing the number of proteins detected in 1–9 TMT-sets.
Figure 2 with 2 supplements
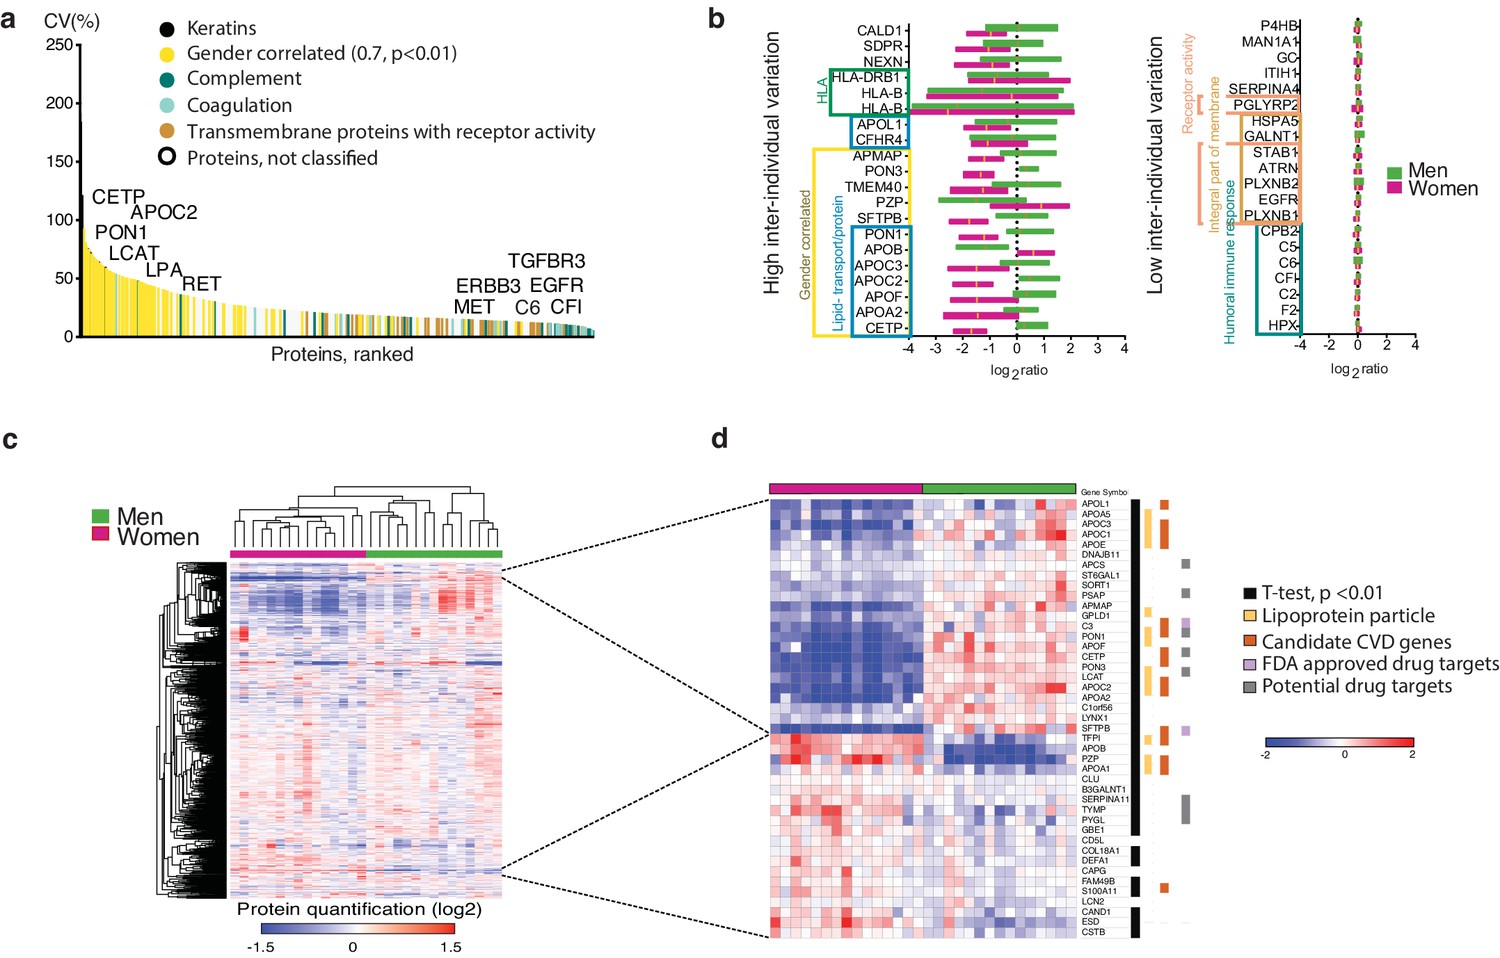
Plasma proteome inter-individual variability.
(a) The plot shows the coefficient of variation (CV%) of 1080 plasma proteins detected across 30 blood donors, arranged from high to low CV(%). The largest variation was observed among keratins (known common contaminants that were excluded from downstream analyses) and gender-correlated proteins, which by gene ontology (GO) enrichment analyses were identified as enriched for lipoproteins. In contrast, complement and coagulation cascade proteins showed low inter-individual variation. Further analysis of proteins with low inter-individual variation showed enrichment of integral membrane proteins (FDR q-value 7E-11) and receptor activity (FDR q-value, 2E-4), for example the transmembrane receptors EGFR and TGFB3R. The variation did not increase with protein abundance level (Figure 2—figure supplement 1). (b) Bar graph showing the 20 proteins with the highest and 20 proteins with the lowest inter-individual variation across all subjects, categorized according to GO annotation and gender-correlated differential expression. All gender-correlated proteins were also statistically-significant when comparing men and women (Student's t-test p<0.01, FDR 1%, not assuming equal variance). (c) Heatmap showing unsupervised clustering of all 1080 proteins with overlapping quantification across the 30 plasma samples. The plasma proteins (log2-transformed ratios relative to a pooled internal standard composed of an aliquot of all 30 samples, rows) and the individual samples (columns) were sorted by hierarchical clustering (Pearson correlation, average linkage), with gender appearing to have the strongest impact on the upcoming clusters. In (d) is shown a zoom-in of the gender-correlated clusters (selection indicated by dashed lines). Indicated are lipoproteins, cardiovascular disease (CVD) genes, and potential- as well as FDA-approved drug targets. Indicated are also proteins with a statistically significant gender-specific differential expression.
Figure 2—figure supplement 1
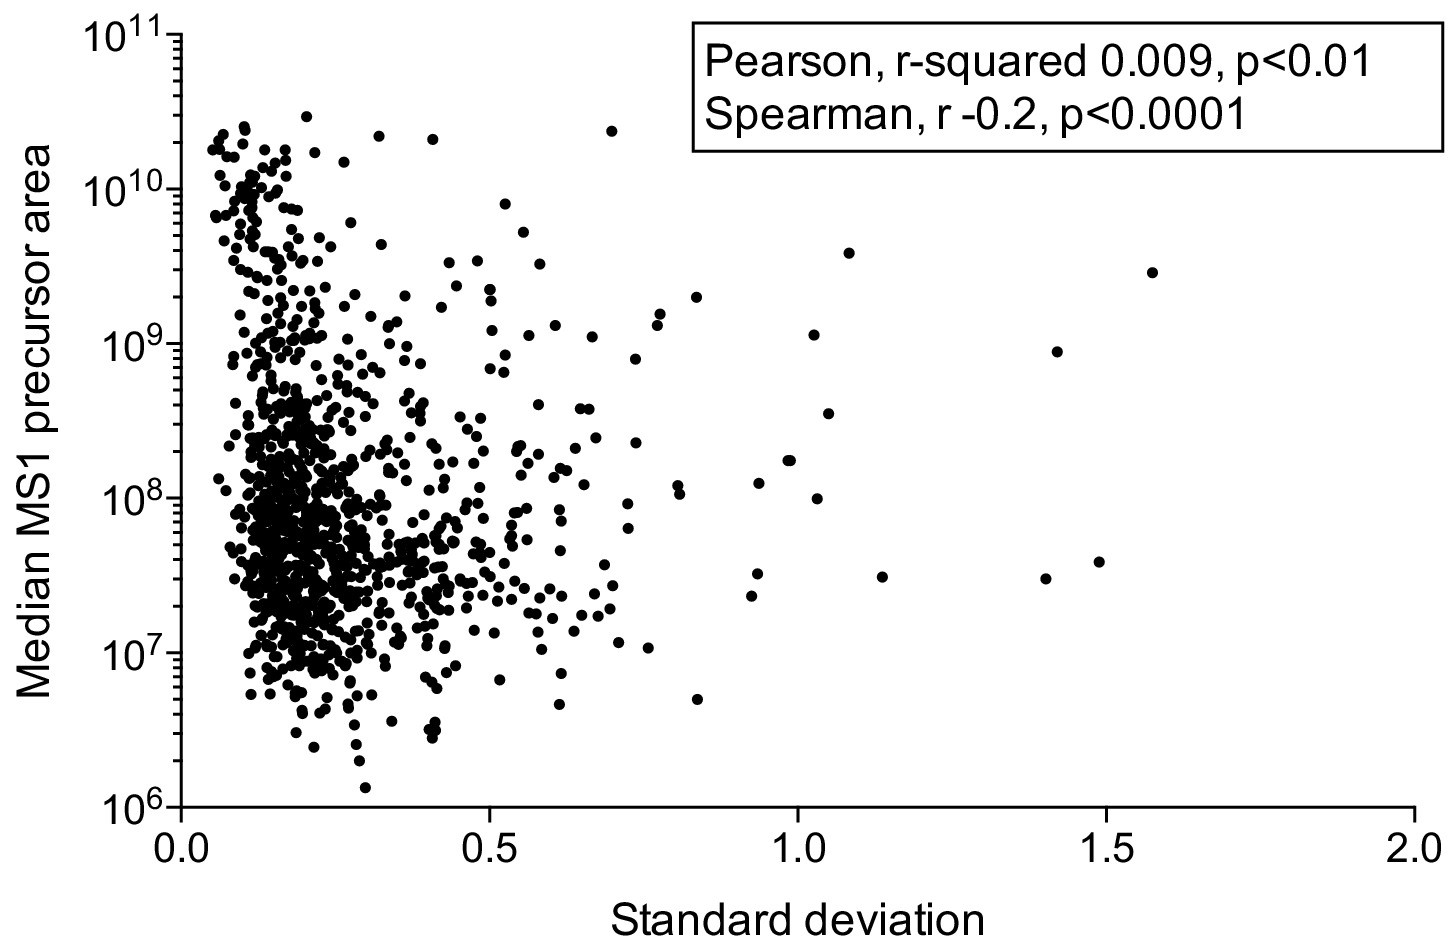
Inter-individual plasma protein abundance variability calculated from plasma samples from 30 donors.
The scatter plot shows protein abundance levels (median MS1 precursor area) versus the standard deviation for each protein quantified. As seen from the figure, the variance is not increasing with high protein abundance.
Figure 2—figure supplement 2
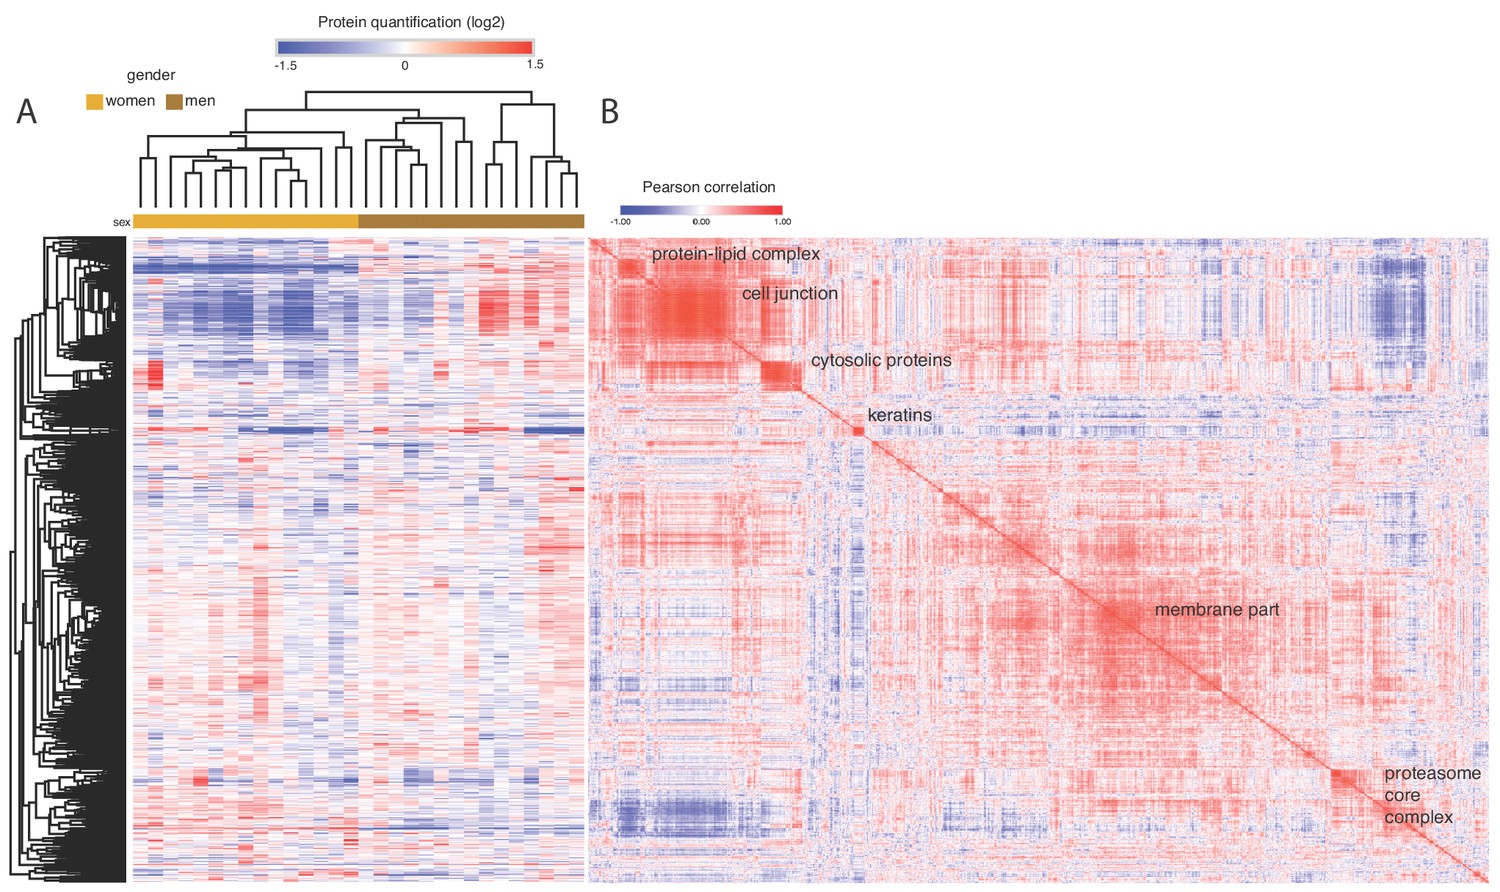
Plasma proteome overview across 30 individuals (15 female and 15 male donors).
The similarity matrix to the right (based on Pearson correlation) indicates correlated protein expression patterns across the plasma samples. GO annotation was systematically performed on the clusters and the significant enrichments are indicated with text. The two highlighted clusters were gender-correlated as described in the main text.
Figure 3 with 1 supplement

Exploring the plasma proteome and detecting tissue leakage proteins in plasma.
(a) Individual protein expression levels (log2(relative ratios)) of the three out of eight proteins of the CancerSEEK test (Cohen et al., 2018) that were detected in a cohort of 30 blood donors. (b) Distribution of protein abundances based on precursor areas. Cancer-related proteins and FDA-approved drug target proteins (HPA classification) highlighted in green and blue, respectively. Classical plasma proteins (Anderson and Anderson, 2002) highlighted in red, proteins included in the CancerSEEK test in yellow. Among these proteins, some are specifically indicated by gene symbol. Spiked PSA (4 ng/mL) is marked with *. (c) Detection of tissue leakage proteins in plasma assessed by mRNA expression levels classified as enriched on particular tissue types. The anatomy image in panel c was adapted from https://commons.wikimedia.org/wiki/File:Female_shadow_anatomy_without_labels.png, which is available in the Public Domain.
Figure 3—figure supplement 1
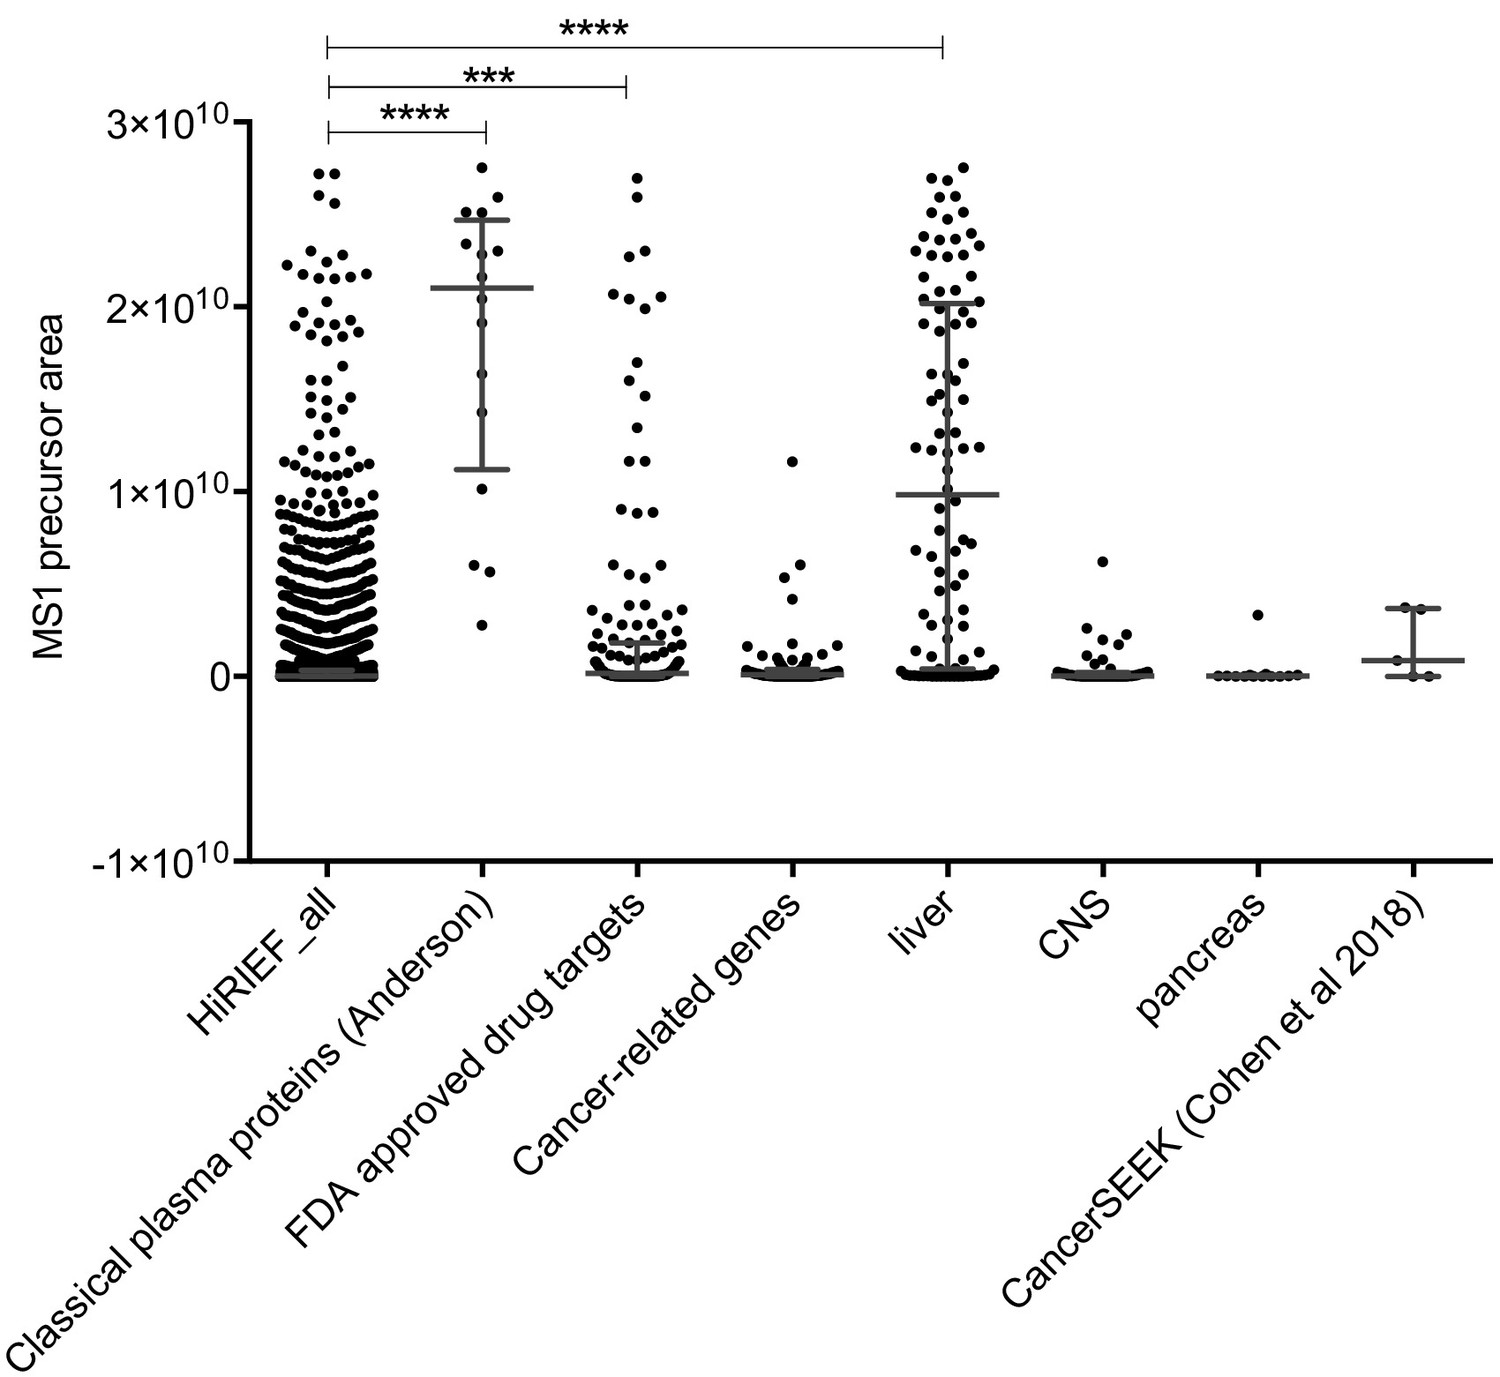
Scatter-dot plot of the merged data from the optimization, with the proteins subdivided into classes: classical plasma proteins (Eden et al., 2007), HPA classification of 1) FDA-approved drug target proteins, 2) cancer-related proteins and 3) tissue leakage proteins in plasma (assessed by mRNA expression levels classified as enriched on particular tissue types: shown is liver, CNS, pancreas) and finally proteins included in the CancerSEEK test (Cohen et al., 2018).
HiRIEF_all denotes all other proteins. The protein abundances are based on precursor areas and presented with median and interquartile range as well as statistical results (Kruskal-Wallis test followed by a Dunn’s post-test), ***p < 0.001, ****p < 0.0001.
Figure 4 with 1 supplement
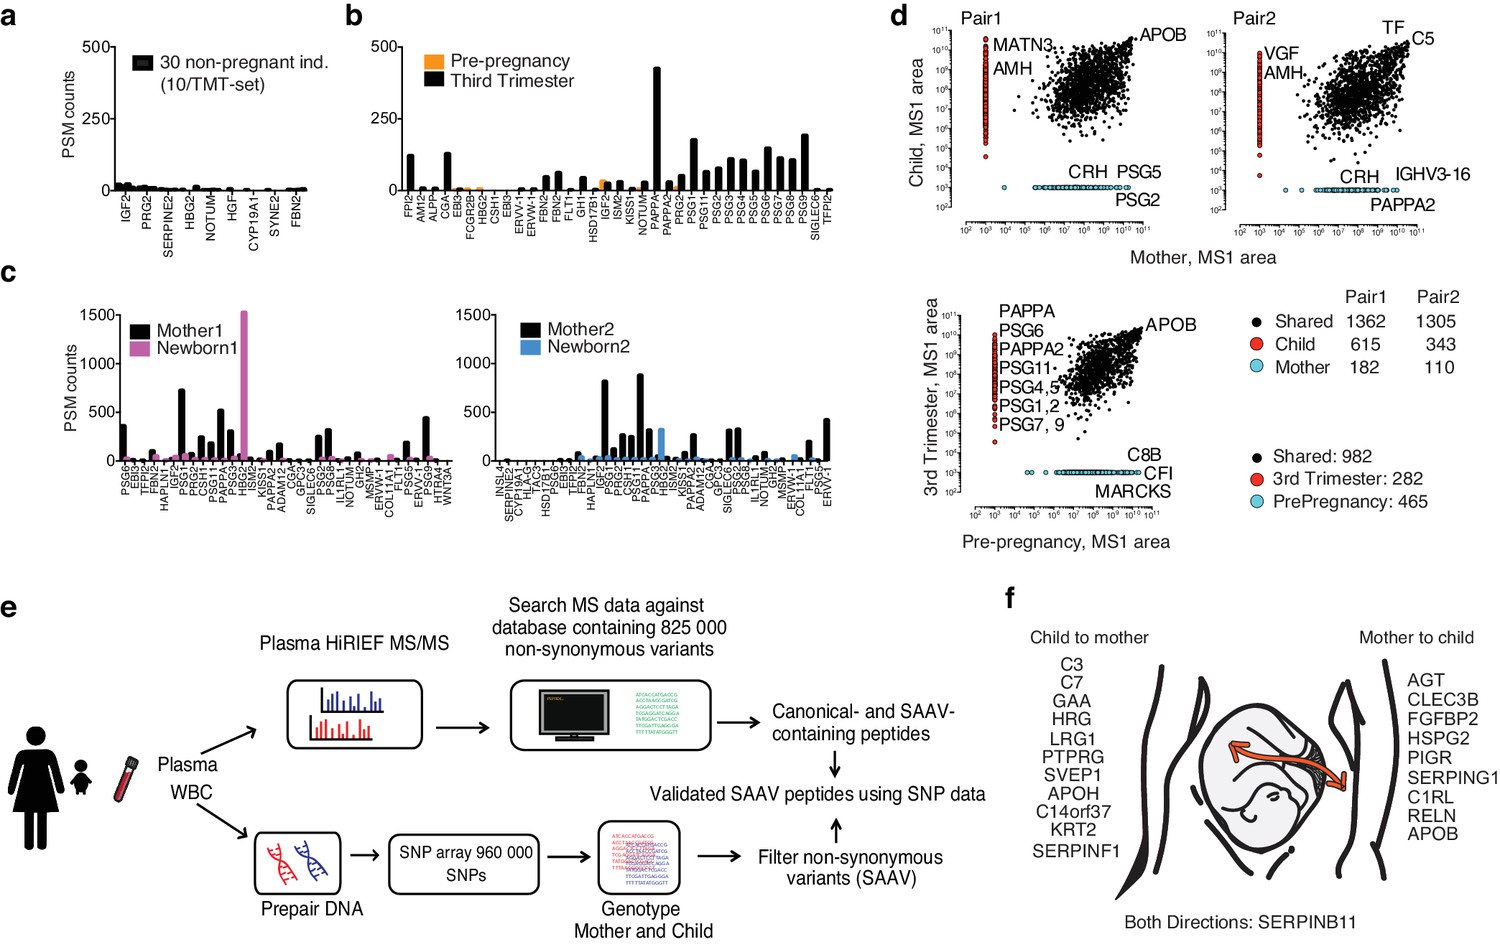
Use of theoretical peptide pI in global and targeted plasma HiRIEF.
(a) Placental proteins detected in 30 non-pregnant blood donors. (b) Placental proteins detected at two different time points in one individual, during third trimester and prior to pregnancy. (c) Placental proteins in two pairs of mother and newborn. (d) A comparison of unique and shared plasma protein levels (MS1 area) in mother versus newborn (two pairs), and in one female individual pre-pregnancy versus third trimester. (e) A brief overview of the proteogenomics workflow (f) An illustration of suggested placental leakage proteins and direction of transfer between mother-and-child.
Figure 4—figure supplement 1

Protein abundance distribution of the 24 proteins possibly transferred across the placenta between mother and child and vice versa.
Transfer proteins were proteins with single-amino acid variant (SAAV) peptides explained by the other individual’s genotype. The transferred proteins were distributed across the entire abundance range.
Tables
Table 1
Summary of the evaluated conditions in the optimization in terms of number of protein identifications (PSM-, peptide- and protein level FDR 1%).
https://doi.org/10.7554/eLife.41608.011| Experiment | HiRIEF pH range | Depleted plasma (mg) | # PSM | # Peptides | # Proteins |
|---|---|---|---|---|---|
| MS runtime control | NA | 0.072 | 148304 | 2588 | 241 |
| 1 | 3.0–10.0 | 1.0 | 123262 | 15424 | 1626 |
| 2 | 0.6 | 118983 | 16372 | 1791 | |
| 3 | 3.7–4.9 | 1.0 | 72287 | 8566 | 1517 |
| 4 | 3.7–4.05 | 0.2 | 25033 | 3230 | 1068 |
| 5 | 0.6 | 25472 | 3871 | 1394 | |
| 6 | 1.0 | 39351 | 5421 | 1774 | |
| 7 | 4.0–4.25 | 0.2 | 29224 | 2916 | 904 |
| 8 | 0.6 | 47470 | 4629 | 1534 | |
| 9 | 1.0 | 64970 | 6012 | 1888 | |
| 10 | 1.0 | 46230 | 4695 | 1360 | |
| 11 | 2.0 | 53323 | 5324 | 1659 | |
| 12 | 4.0 | 71727 | 6339 | 1812 | |
| 13 | 6.0 | 70376 | 6149 | 1608 | |
| 14 | 4.2–4.45 | 0.2 | 30067 | 2992 | 913 |
| 15 | 0.6 | 41619 | 4470 | 1422 | |
| 16 | 1.0 | 63329 | 6042 | 1803 | |
| A549 cell line* | 3.0–10.0 | --- | 367570 | 141071 | 9816 |
| A549 cell line* | 3.7–4.9 | --- | 314305 | 93329 | 9679 |
-
*Cell line data from Zhu et al. (2018).
Additional files
-
Supplementary file 1
Summary of the number of identifications from the optimization experiment.
1% FDR cutoff at PSM, peptide and protein level, MSGF +with Percolator processing. Label-free, protein centric analysis. * Spiked amount was 4 ng/mL prior to depletion. NA indicates that PSA was not spiked into the sample. ** Percentage of proteins identified by a single peptide, *** Percentage of PSMs originating from the highest abundant protein.
- https://doi.org/10.7554/eLife.41608.019
-
Supplementary file 2
Summary of the number of identifications from the optimization experiments, database search allowing for phospho-modifications.
Search engines used were Andromeda (MaxQuant) (FDR 1%, PSM and protein level) and MSGF +and Percolator (PSM, peptide and protein level FDR 1%), Protein centric.
- https://doi.org/10.7554/eLife.41608.020
-
Supplementary file 3
Summary of phosphodata from the different HiRIEF strip ranges in absolute number and percent.
Phosphosite probability calculations were performed within the MaxQuant software. GeLC = gel based (SDS PAGE) separation and digestion.
- https://doi.org/10.7554/eLife.41608.021
-
Supplementary file 4
Summary of the overlap analysis between the 3053 proteins identified in the HiRIEF optimization experiments (protein, peptide and PSM data) and the proteins reported in the 2017 version of the PeptideAtlas database.
In total 611 genes were uniquely detected by plasma HiRIEF compared to the PeptideAtlas 2017 build and proteins currently targeted with affinity proteomics assays. Comparative gene ontology enrichment analysis of the HiRIEF unique proteins showed that there was an enrichment of Golgi membrane proteins and MHC complex proteins (provided as an excel file).
- https://doi.org/10.7554/eLife.41608.022
-
Supplementary file 5
Gene ontology (GO) enrichment analysis of plasma proteins with low inter-individual variability.
The proteins were ranked from smallest to largest inter-individual variation based on their coefficient of variation. The top of the list (least varying) was enriched for proteins linked to humoral activation proteins and receptor activity.
- https://doi.org/10.7554/eLife.41608.023
-
Supplementary file 6
Gene ontology (GO) enrichment analysis of plasma proteins with high inter-individual variability.
The proteins were ranked from highest to smallest inter-individual variation based on their coefficient of variation. The top of the list (most varying) was enriched for lipid transport proteins.
- https://doi.org/10.7554/eLife.41608.024
-
Supplementary file 7
Summary of the detection of proteins from the CancerSEEK panel (provided as an excel file).
- https://doi.org/10.7554/eLife.41608.025
-
Supplementary file 8
Summary of protein classes used for the analyses in Figures 3b–c and 4a–d.
Plasma from the same individual ‘not pregnant’: six entries, plasma ‘third trimester’: 30 entries (four entries overlapping between not pregnant and third trimester), in total HPA db placenta enriched: 83 entries).
- https://doi.org/10.7554/eLife.41608.026
-
Supplementary file 9
Proteogenomics approach combining SNP analysis and plasma HiRIEF to detect proteins containing SAAV in plasma from two mother-child pairs.
Table showing 229 unique variant peptides derived from 161 proteins with DNA support from SNP analysis (provided as an excel file).
- https://doi.org/10.7554/eLife.41608.027
-
Supplementary file 10
Brief summary of transfer protein properties in terms of hydrophilicity/hydrophobicity (as evaluated by Gravy score), protein size or pI.
- https://doi.org/10.7554/eLife.41608.028
-
Supplementary file 11
Summary of the proteins transferred across the placenta (provided as an excel file).
- https://doi.org/10.7554/eLife.41608.029
-
Supplementary file 12
Pooling strategy for the condensed HiRIEF LC-MS/MS analysis used in the longitudinal female cohort.
- https://doi.org/10.7554/eLife.41608.030
-
Supplementary file 13
Mirrorplots.
- https://doi.org/10.7554/eLife.41608.031
-
Transparent reporting form
- https://doi.org/10.7554/eLife.41608.032
Download links
A two-part list of links to download the article, or parts of the article, in various formats.
Downloads (link to download the article as PDF)
Open citations (links to open the citations from this article in various online reference manager services)
Cite this article (links to download the citations from this article in formats compatible with various reference manager tools)
In-depth human plasma proteome analysis captures tissue proteins and transfer of protein variants across the placenta
eLife 8:e41608.
https://doi.org/10.7554/eLife.41608


