Correct setup of the substantia nigra requires Reelin-mediated fast, laterally-directed migration of dopaminergic neurons
- University of Bonn School of Medicine & University Hospital Bonn, Germany
- German Center for Neurodegenerative Diseases, Germany
Figures
Figure 1 with 4 supplements
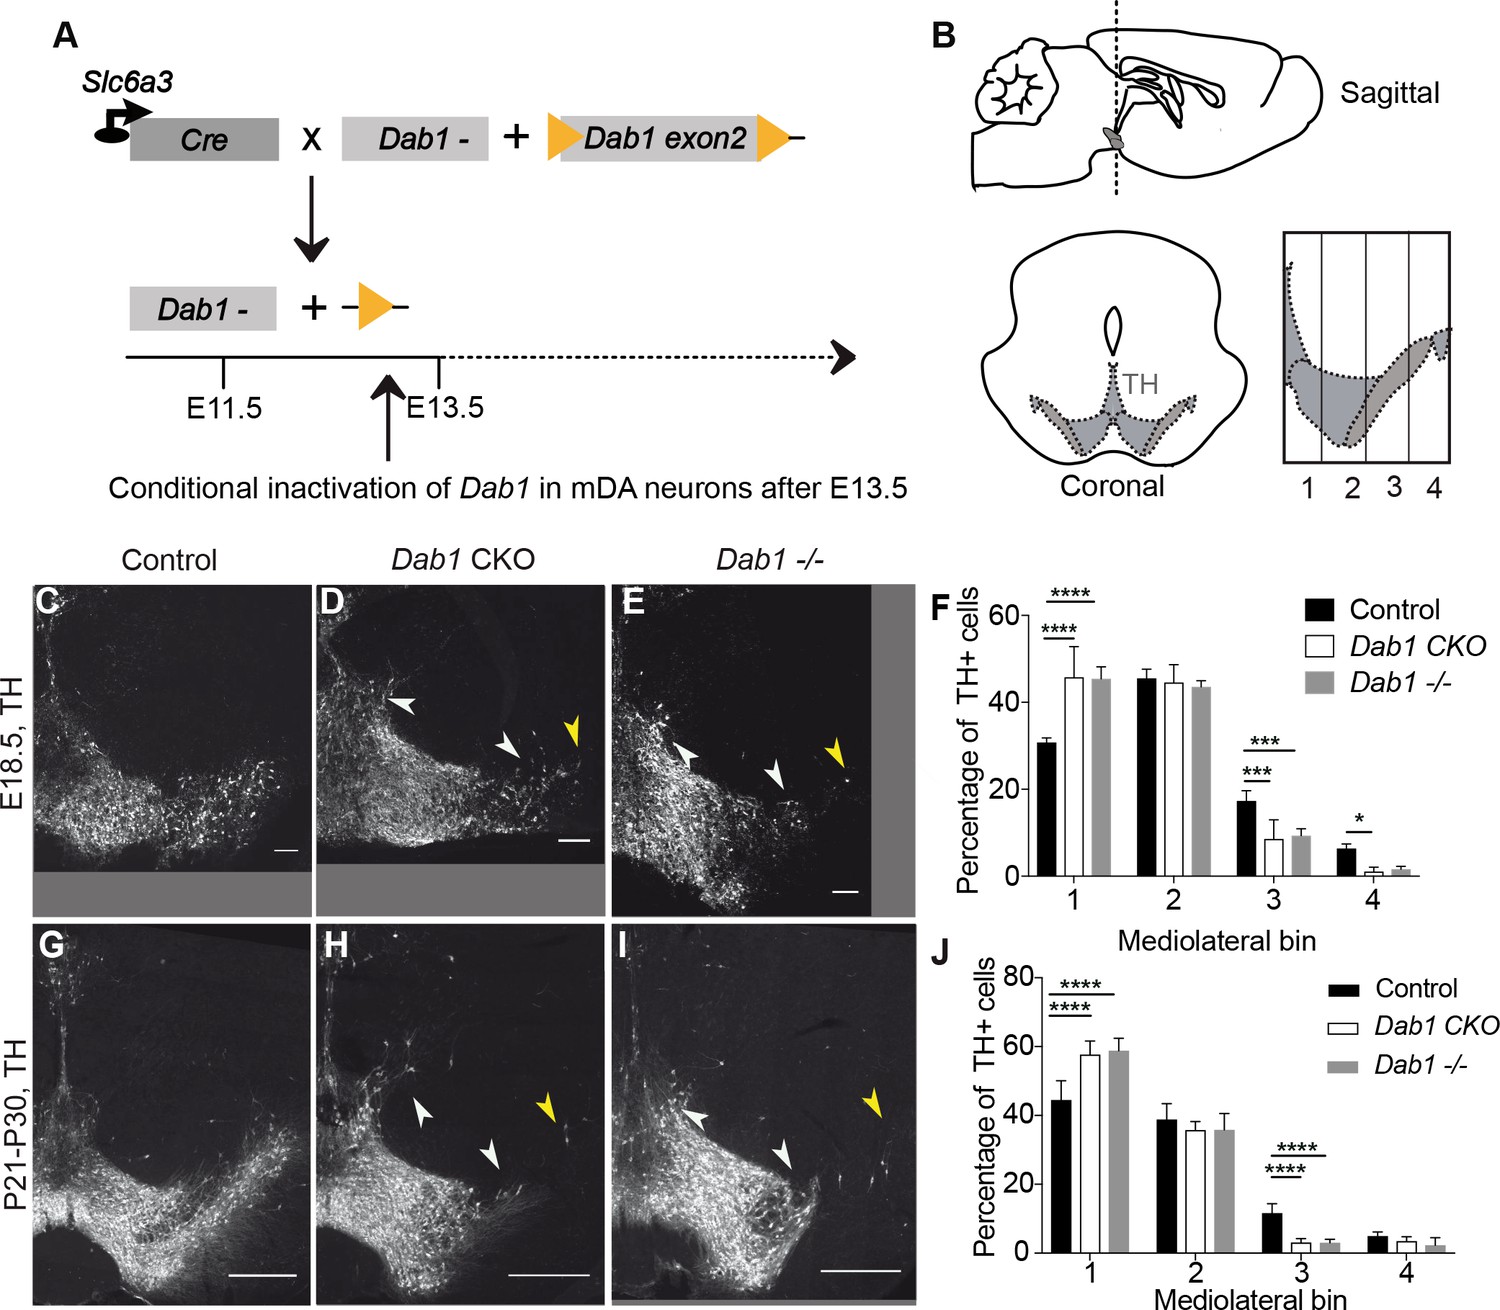
Direct role of Reelin signalling in tangential migration of mDA neurons.
(A) Schematic showing Cre-mediated inactivation of Dab1 in mDA neurons. (B) Schematic representing the anteroposterior level of coronal sections used for the analysis, and the mediolateral grid used to quantify distribution of TH+ (Tyrosine Hydroxylase) neurons. (C–J) Immunostaining for TH and quantification of cell distribution for control, Dab1 CKO, and Dab1-/- midbrain regions at E18.5 (C–F) and at P21-P30 (G–J). White arrowheads indicate differences in the mediolateral distribution of TH+ cells. Yellow arrowheads point to cells in the substantia nigra pars lateralis used as a landmark for the most lateral position in the mediolateral grids. (F,J) Quantification of mediolateral distribution of TH+ cells for control, Dab1 CKO and Dab1-/- brains at E18.5 (F, n = 4 for each genotype) and at P21-P30 (J, n = 6 for each genotype). Data is represented as mean + s.e.m. **** indicates significant difference p<0.0001, *** indicates significant difference p<0.001, * indicates significant difference p<0.05 as assessed by two-way ANOVA with Tukey’s multiple comparison correction. Scale bars: (C–E) 100 μm, (G–I) 500 μm.
Figure 1—figure supplement 1

Scl6a3Cre mediated recombination pattern.
(A–C) Analysis of Cre-mediated recombination in Scl6a3Cre/+,Rosa26lox-stop-lox-EYFP/+ mice. Immunostaining for TH and YFP at E13.5 shows Cre-mediated recombination in the lateral mDA regions (arrowhead). (D–F) Immunostaining for TH and YFP at E14.5 shows almost complete recombination (YFP expression) in mDA neurons of the SN (arrowhead). (G–I) By E15.5, TH+ mDA neurons of the SN and lateral VTA are YFP+ (arrowhead). Scale bar: 50 μm.
Figure 1—figure supplement 2
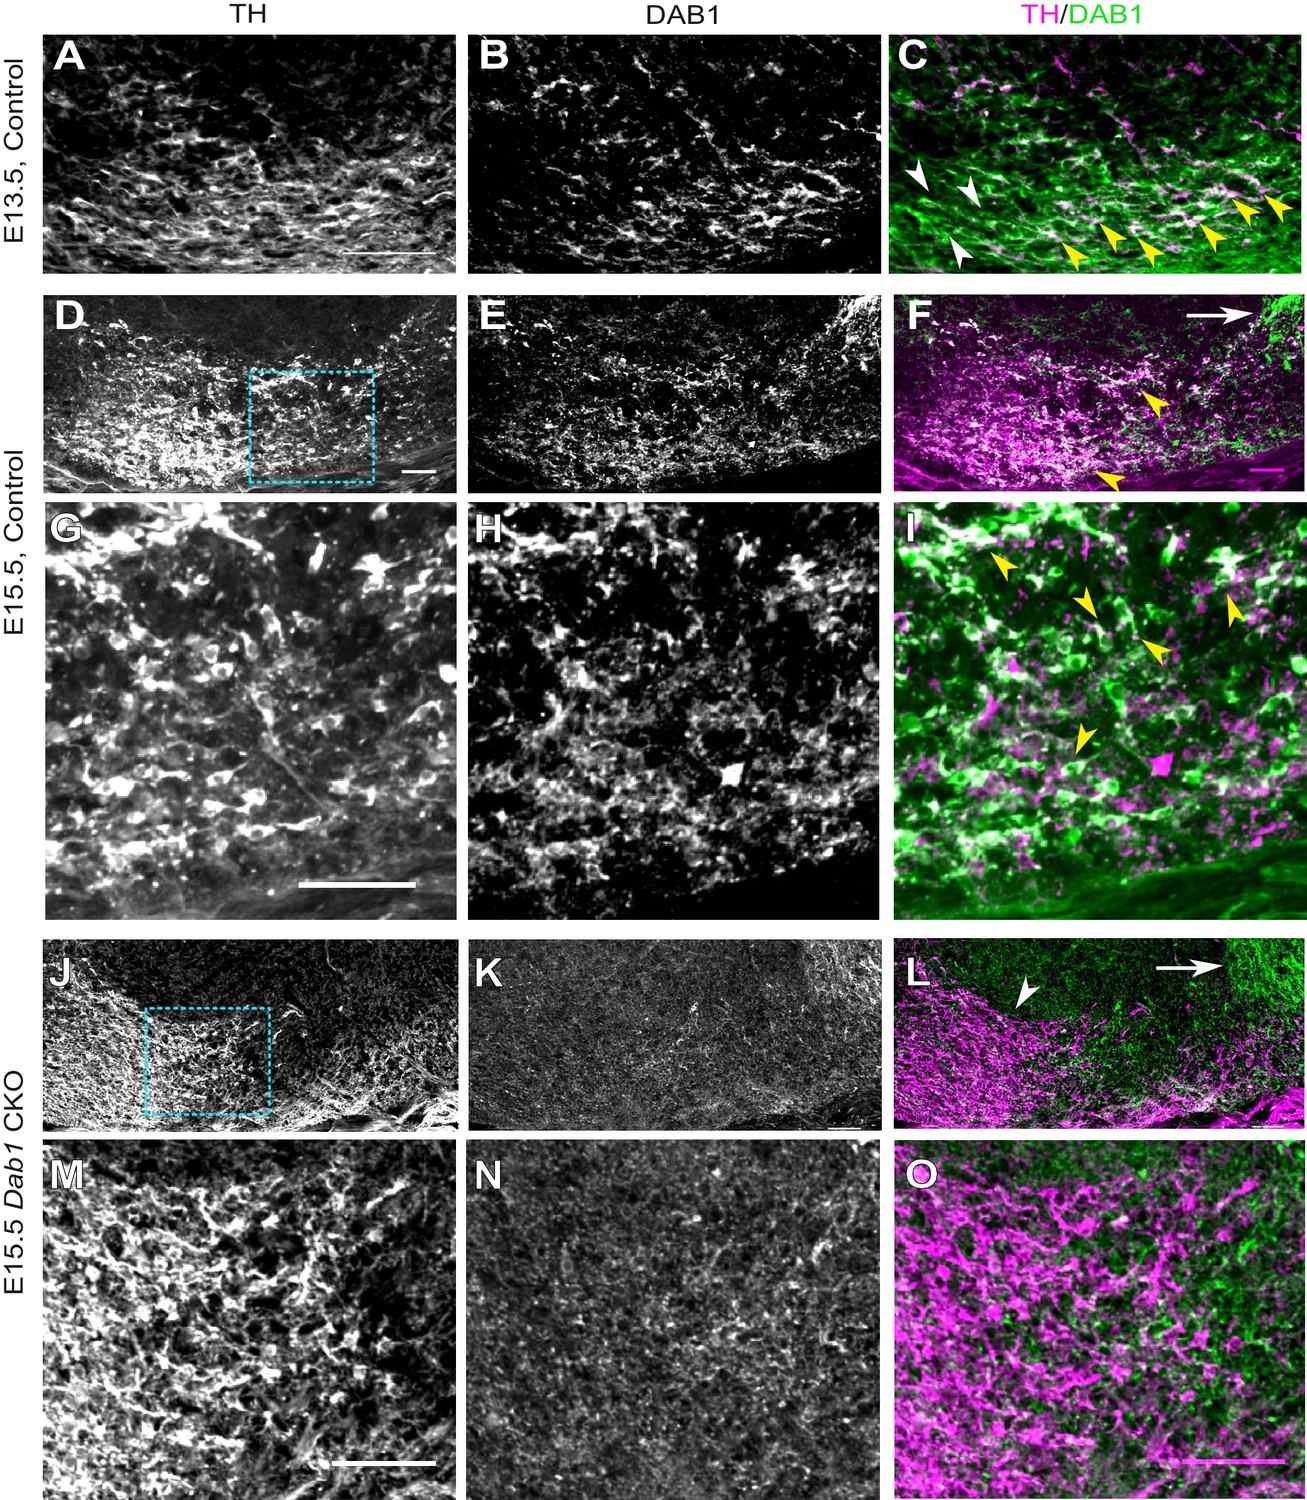
DAB1 expression in the embryonic midbrain and specific loss of DAB1 protein in mDA neurons of Dab1 CKO brains.
(A–C) Analysis of DAB1 protein expression in control embryos at E13.5. DAB1 expression (B) is colocalized with TH (A) in lateral mDA neurons (yellow arrowheads in C) but not in medially located mDA neurons (white arrowheads). (D–F) Immunostaining for TH and DAB1 at E15.5 in control brains reveals DAB1 expression in the region of the SN and lateral VTA (yellow arrowheads in F) and in non-dopaminergic regions lateral to mDA neurons (white arrow). (G–I) Higher zoom of region indicated by dashed square in (D) shows colocalization (indicated by yellow arrowheads in F) of TH and DAB1 in SN-mDA neurons. (J–L) DAB1 expression is absent in Dab1 CKO mice at E15.5 in mDA neurons in the SN and lateral VTA (white arrowhead in L), while DAB1 expression persists in lateral non-dopaminergic regions (white arrow). (M–O) Higher zoom of region indicated by dashed square in (J) shows that DAB1 is not expressed in TH-positive mDA neurons in Dab1 CKO mice. Scale bars: 50 μm.
Figure 1—figure supplement 3
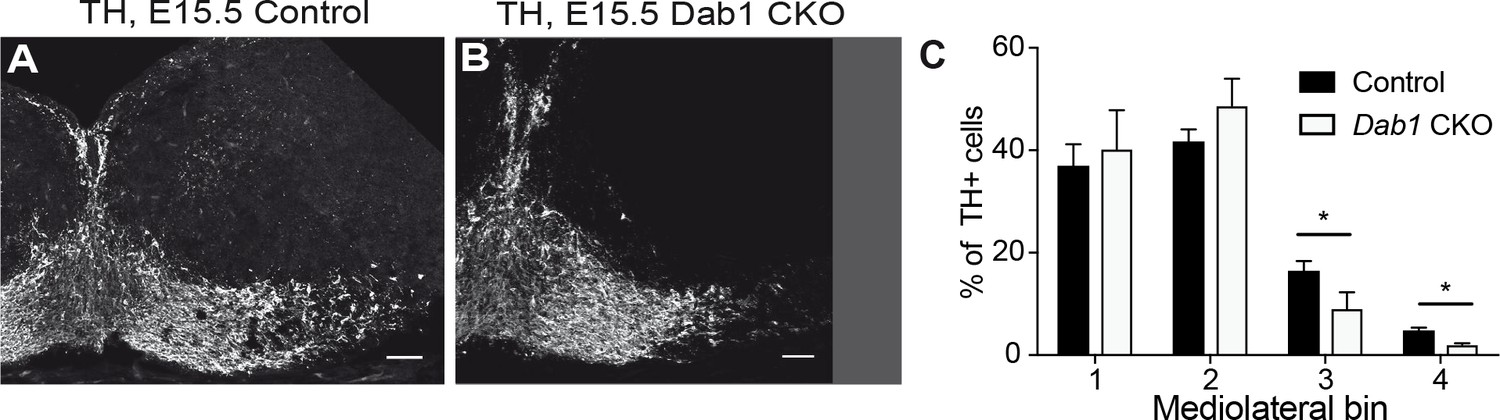
Mediolateral distribution of mDA neurons at E15.5 in absence of Reelin signaling.
Analysis of mediolateral distribution of TH+ cells in control (A) and Dab1 CKO mice (B) at E15.5 shows a medial accumulation of cells in Dab1 CKO mice (C). Data are represented as mean + s.e.m for n = 3 brains. * indicates p<0.05 by Student’s t-test corrected for multiple comparisons (Holm-Sidak method). Scale bars: 50 μm.
Figure 1—figure supplement 4
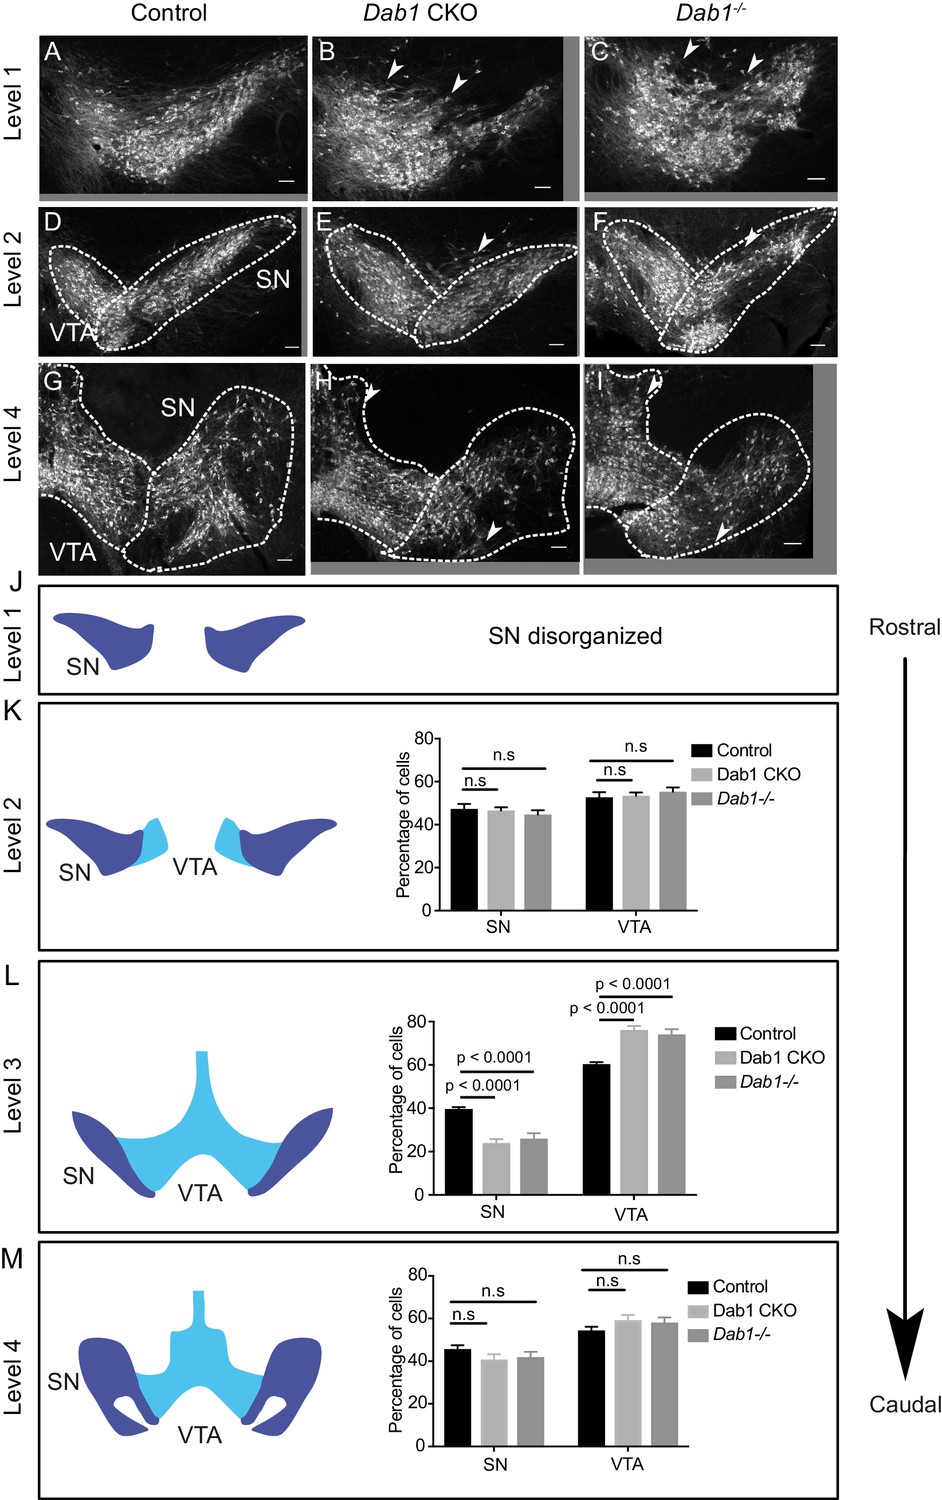
Characterization of mDA distribution at different rostrocaudal levels in Dab1 CKO and Dab1-/- brains.
(A–C) SN-mDA neurons are disorganized at rostral levels (level 1) in Dab1 CKO and Dab1-/- postnatal brains (P21-P30). Arrowheads: disorganized areas. (D–I, K,M) Rostral sections (Level 2) or caudal sections (level 4) containing SN and VTA-mDA neurons were analyzed in control (D, G), Dab1 CKO (E, H) and Dab1-/- (F, I) postnatal brains. The SN was disorganized, (arrowheads), but no significant difference was observed in the relative fractions of mDA neurons located in the SN or the VTA (K, M) (Student’s t-test). (L) Quantification of the relative fractions of mDA neurons located in the SN or the VTA at intermediate rostrocaudal levels (TH immunostaining shown in Figure 1) revealed a significant decrease in mDA neurons in the SN and a corresponding increase in the region of the VTA (p<0.0001, Student’s t-test) in both Dab1 CKO and Dab1-/- brains compared to controls. Student’s t-test, n = 5 animals/genotype for all levels. Scale bars: 100 μm.
Figure 2
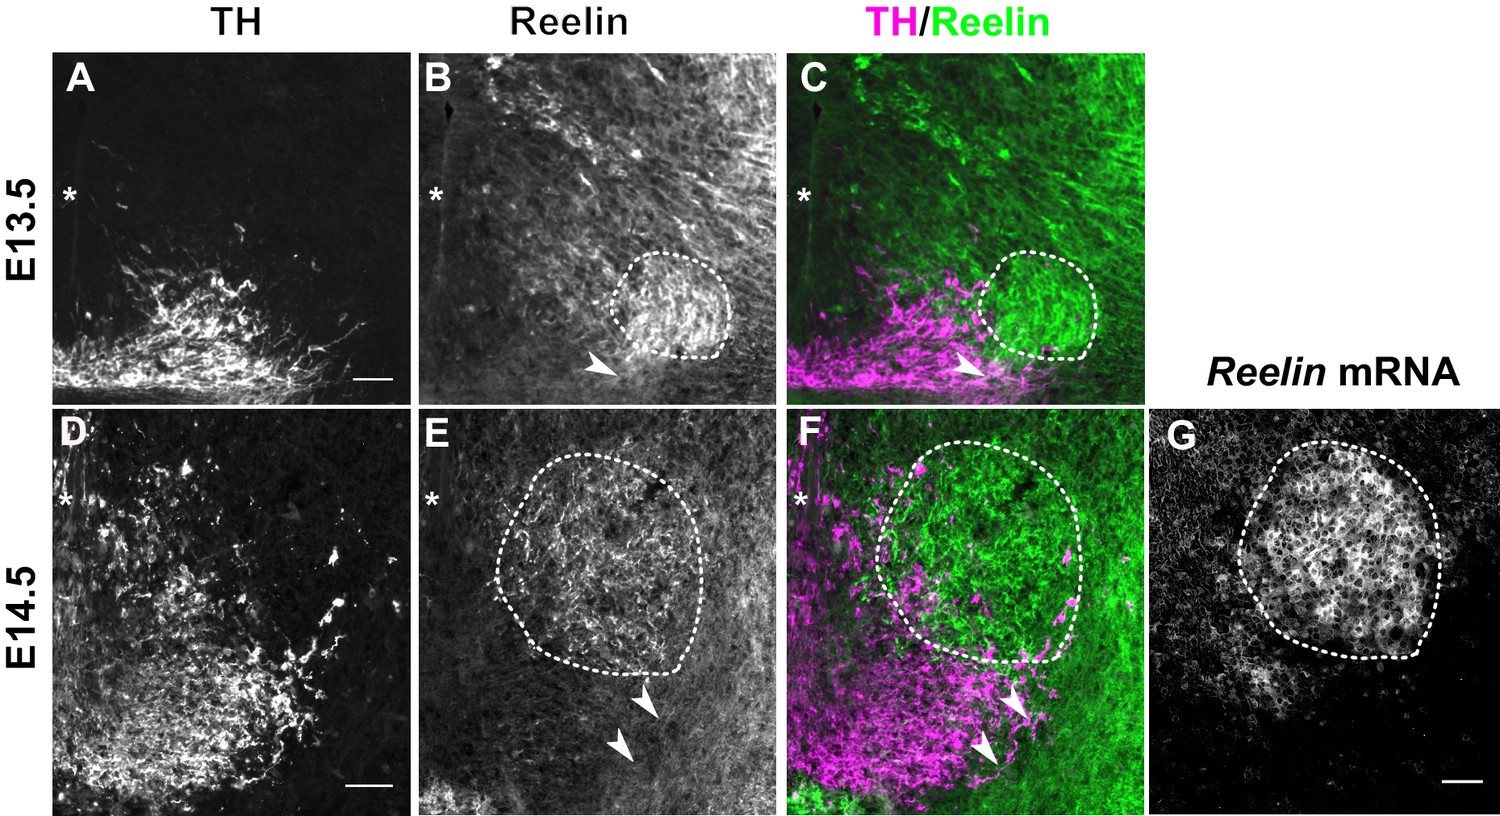
Reelin protein in the ventral midbrain at E13.5 and E14.5.
(A–C) Double immunolabeling for TH and Reelin shows Reelin protein in the region of the red nucleus (RN, dashed outline) and in the lateral TH+ mDA domain (arrowhead) at E13.5. (D–G) Double immunolabeling for TH and Reelin (D–F) and RNA in situ hybridization for Reelin mRNA (G) at E14.5. Reelin mRNA and Reelin protein are strongly expressed in the RN. Reelin protein is also localized ventral and lateral to the RN, overlapping with the lateral mDA domain (arrowheads). Note that a brightfield image was acquired for the in situ hybridization signal of Reelin. The brightfield image was inverted to obtain the image shown in (G). Asterisks indicate ventral midline. Scale bar: 50 μm.
Figure 3 with 1 supplement
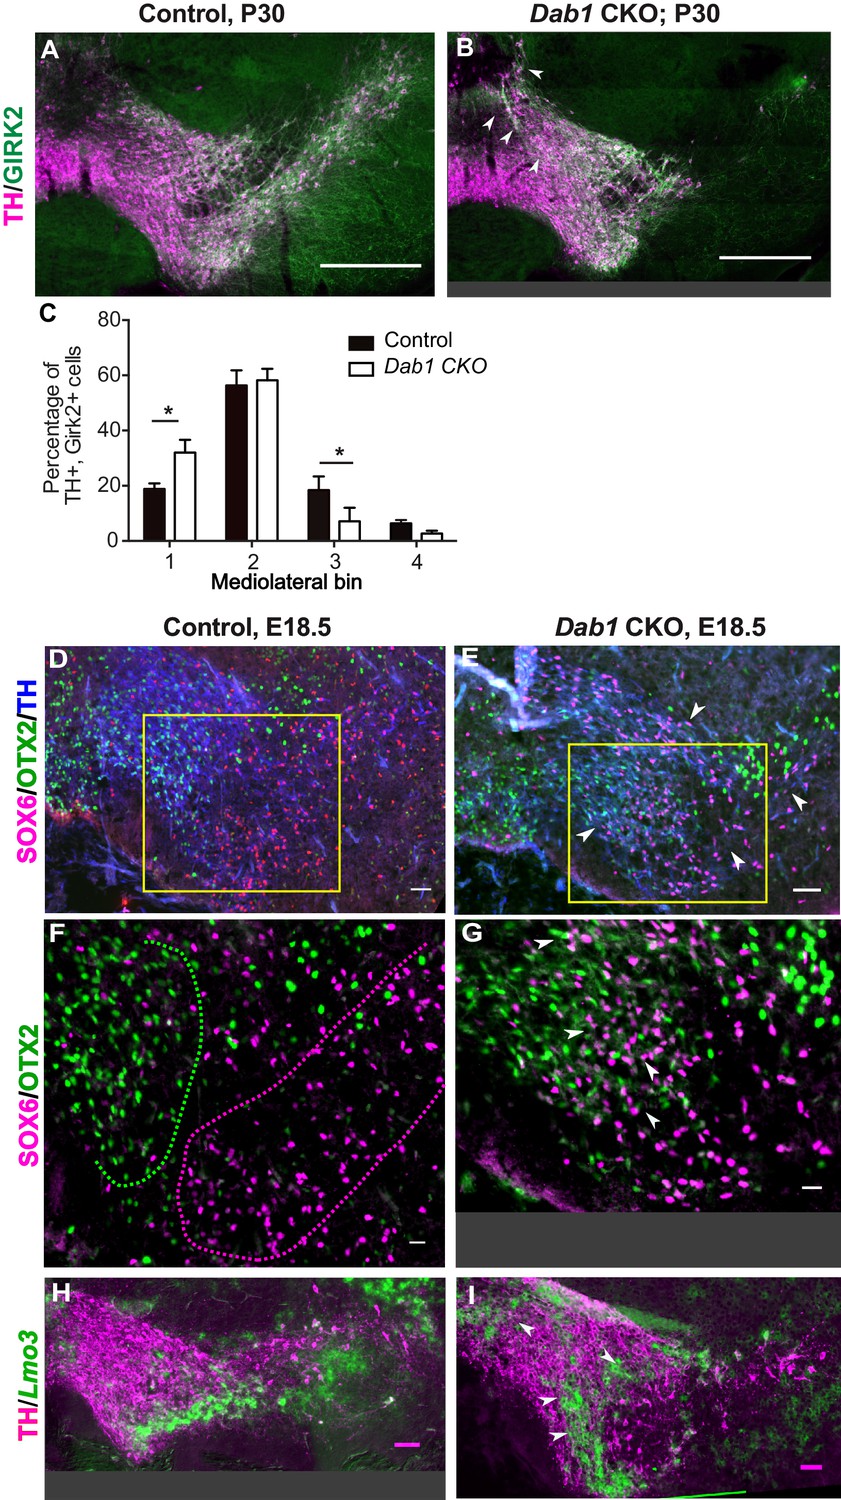
SN-mDA neurons do not completely segregate from VTA-mDA neurons at the SN-lateral VTA border in the absence of Reelin signaling.
(A–C) Immunostaining for TH and GIRK2 in P30 Dab1 CKO mice. Arrowheads: medial accumulation of TH+, GIRK2+ cells in Dab1 CKO (B) compared to control littermates (A). TH+, GIRK2+ cells are shifted medially in Dab1 CKO brains compared to controls (C). * indicates p<0.05 as assessed by Student’s t-test corrected for multiple comparisons (Holm-Sidak method) for n = 3 brains/genotype. (D,E) Triple immunostaining for SOX6 (magenta), OTX2 (green) and TH (blue) on E18.5 control and Dab1 CKO brains. Arrowheads indicate altered distribution of TH+, SOX6+ cells in Dab1 CKO mice. Boxed areas indicate regions presented in F and G. (F,G) Higher zoom of TH+ lateral VTA region shown in D and E. In controls, SOX6+ cells (dashed magenta line) and OTX2+ cells (dashed green line) are largely localized to separate regions (F). In Dab1 CKO mice, SOX6+ cells accumulate medially and are partially intermingled with OTX2+ cells at the SN-lateral VTA border (arrowheads) (G). (H,I) Immunostaining for TH and RNA in situ hybridyzation for Lmo3 shows ectopic localization of TH+, Lmo3+ cells in Dab1 CKO mice (arrowheads in I). Note that the signal for Lmo3 expression was inverted and then false-colored in green. Cells, in which Lmo3 was detected, show weak TH immunostaining, since the strong RNA in situ hybridization signal interferes with antibody binding. Scale bars: (A,B) 200 μm, (D,E,H,I) 50 μm, (F,G) 25 μm.
Figure 3—figure supplement 1
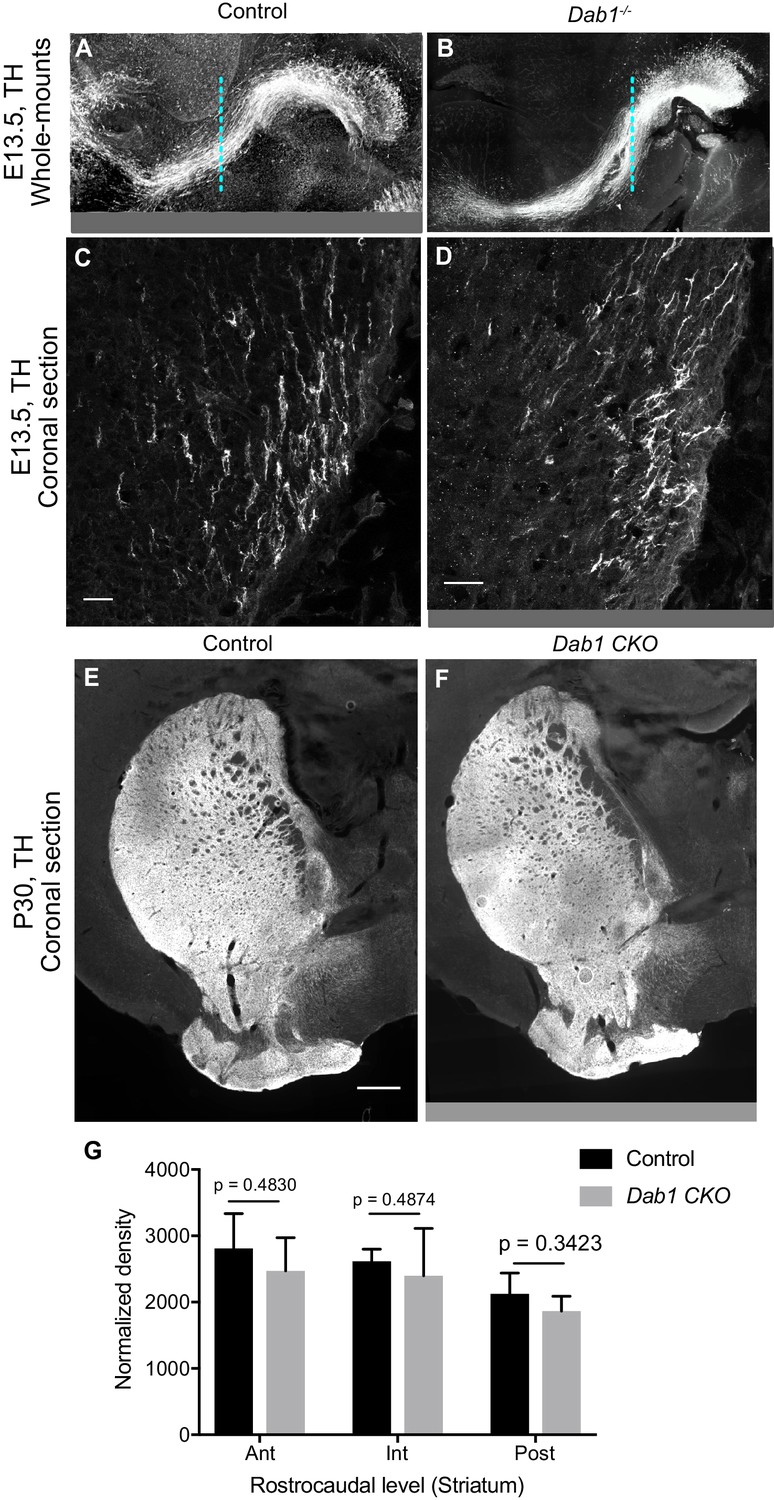
Characterization of mDA projections in the absence of Reelin signaling.
(A,B) No gross morphological difference are observed in the axonal paths of TH+ projections in Dab1-/- E13.5 whole-mount brains (B) compared to controls (A). (C,D) Higher magnification images of TH+ projections at the level indicated by the dashed line in (A,B) do not reveal significant differences in their number or density in Dab1-/- brains (D) compared to control brains (C). (E–G) Normalized density of TH+ innervation to the striatum is similar in postnatal brains of controls and Dab1-/- mice as assessed by Student’s t-test. n = 6 animals/genotype. Scale bars: (C, D) 25 μm; (E, F) 500 μm.
Figure 4 with 1 supplement
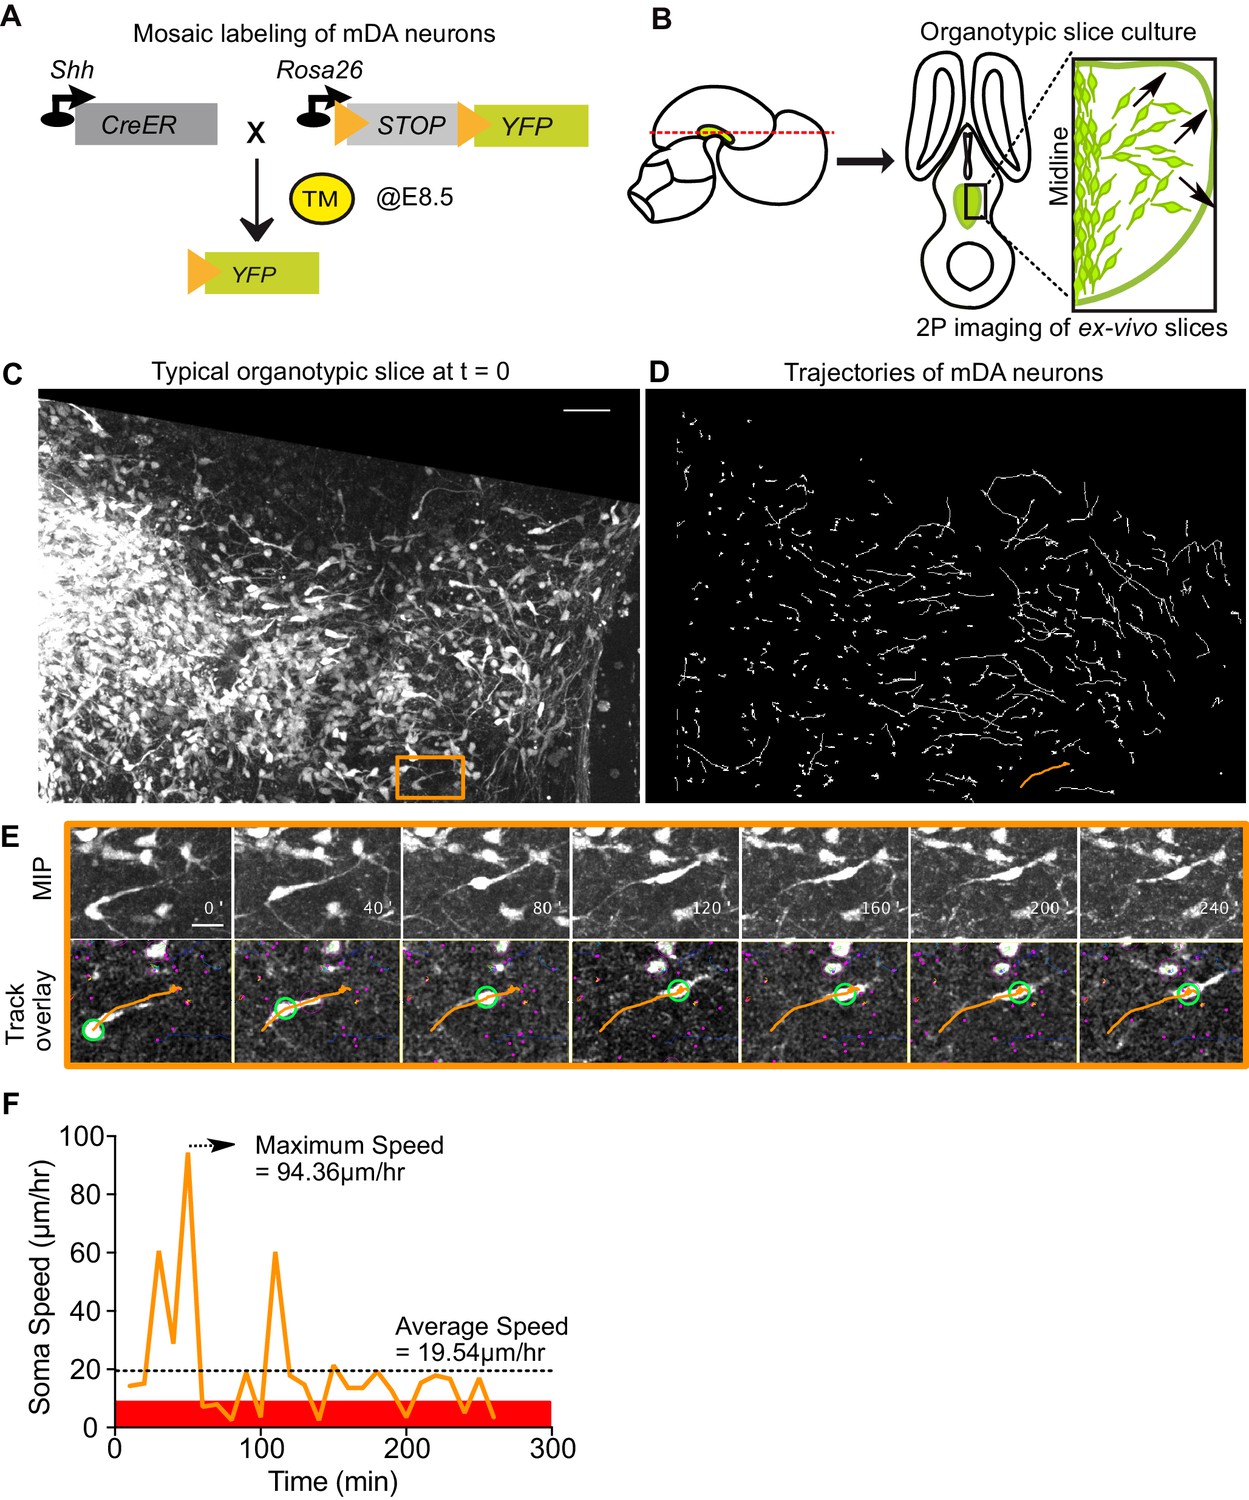
Visualizing mDA tangential migration with 2-photon excitation microscopy.
(A) Schematic of the inducible genetic fate mapping system used to mosaically label mDA neurons by administering tamoxifen (TM) at E8.5. Shh: Sonic Hedgehog; YFP: yellow fluorescent protein. CreER: gene encoding a CRE-Estrogen Receptor fusion protein. (B) Schematic of horizontal organotypic slice culture preparations. Green regions represent location of mDA neurons in the embryonic brains (left) and in horizontal slices (right). Red dashed line indicates dorsoventral level of slices. Black arrows indicate direction of tangential mDA migration. (C) Maximum intensity projection of an image of a control slice at t = 0. Orange rectangle indicates location of cell shown in E. (D) Trajectories of tracked neurons in slice shown in (C) after imaging for 270 min. Trajectory in orange represents trajectory of neuron in (E). (E) Maximum intensity projection frames of time-lapse imaging show soma and processes of a tangentially migrating cell. Track overlay frames show the position of the soma (green circle) and trajectory of the cell (orange line) analyzed with the semi-automated tracking plugin TrackMate in Fiji. Magenta dots and circles represent tracked soma of close-by cells at different z-levels. (F) Speed profile of cell in (E) shows large variations in speed over time, with a maximum speed (dashed arrow) that is much higher than the average speed (dashed horizontal line). Rest phase (soma speed less than 10 μm/hr) is indicated in red. Scale bars: (C,D) 50 μm, (E) 20 μm.
Figure 4—figure supplement 1
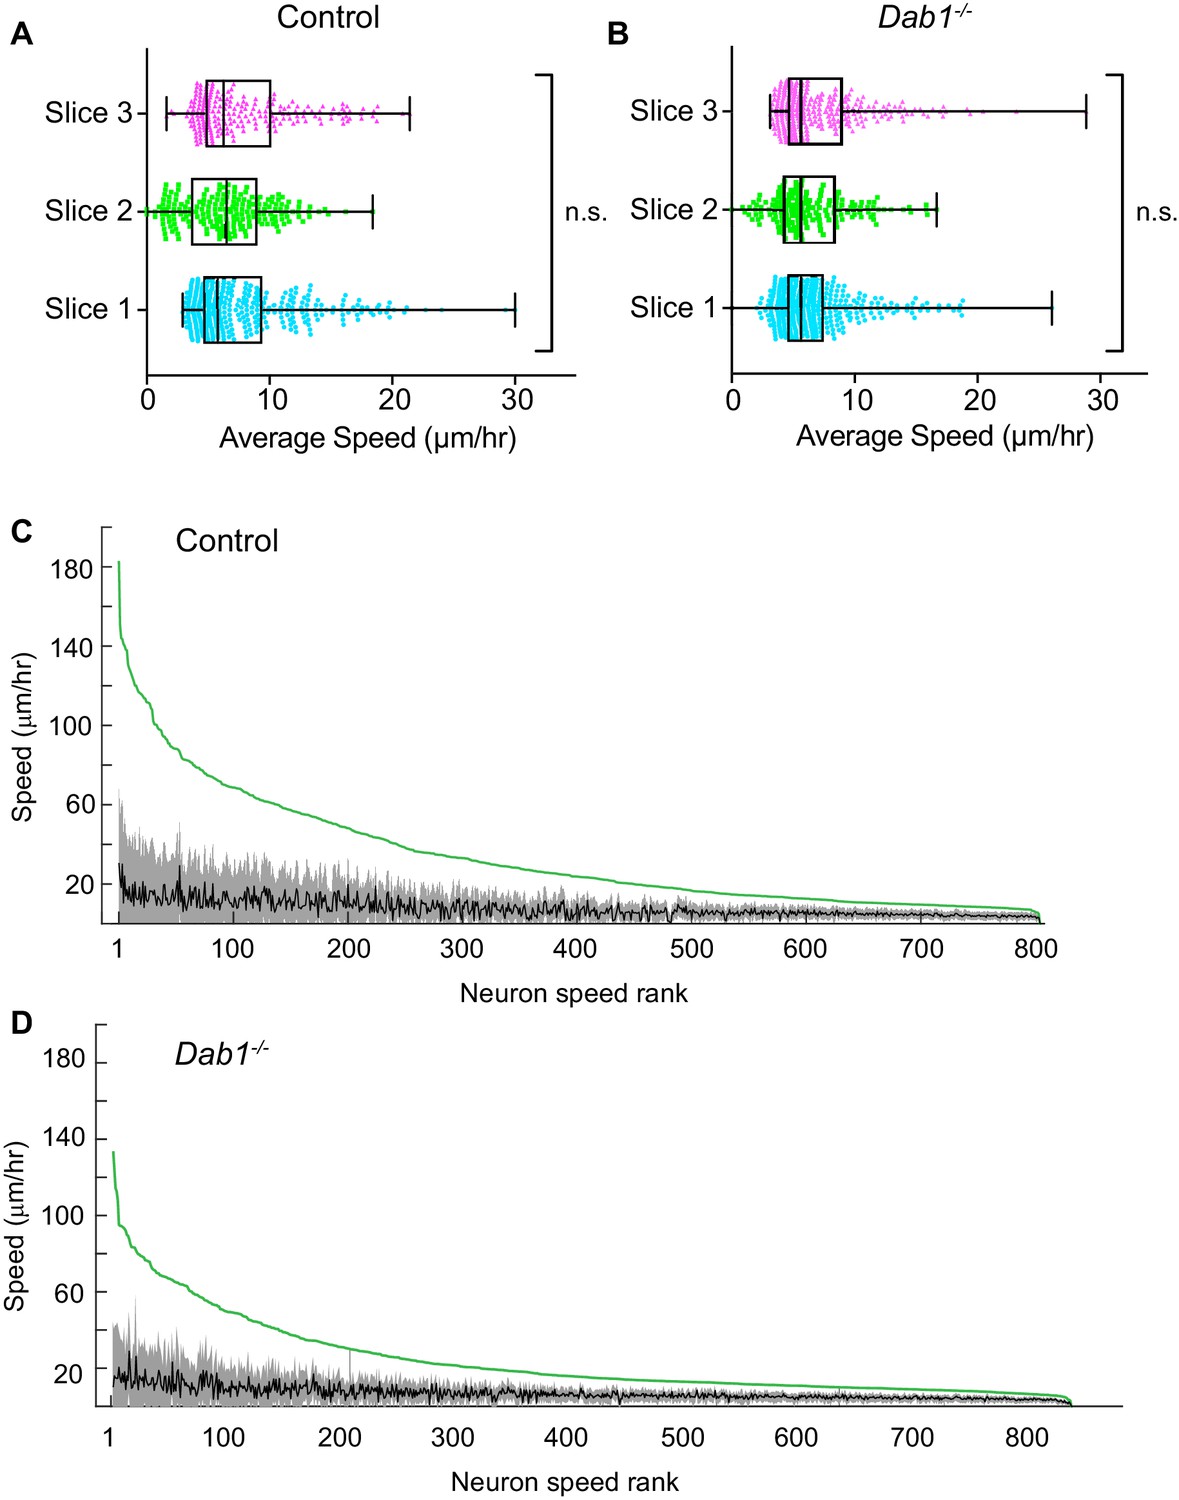
Average speed distributions and speed profiles of SN-mDA neurons.
(A) Average speed distributions across three control slices are not significantly different (p=0.1065, Kruskal-Wallis test for non-parametric distributions). (C) Average speed distributions across 3 Dab1-/- slices are not significantly different (p=0.2279, Kruskal-Wallis test for non-parametric distributions). (C,D) To demonstrate the extent of max-speed variation in control and Dab1-/- mDA neurons from their mean speeds, each neuron in the dataset was ranked by its max-speed (green curve for the population). For each neuron, the mean and standard deviation around the mean were also plotted: grey and black curves represent variation of soma speed (grey) around average speed (black) for all mDA neurons in the dataset.
Figure 5 with 2 supplements
Reelin promotes infrequent, fast movements in mDA neurons.
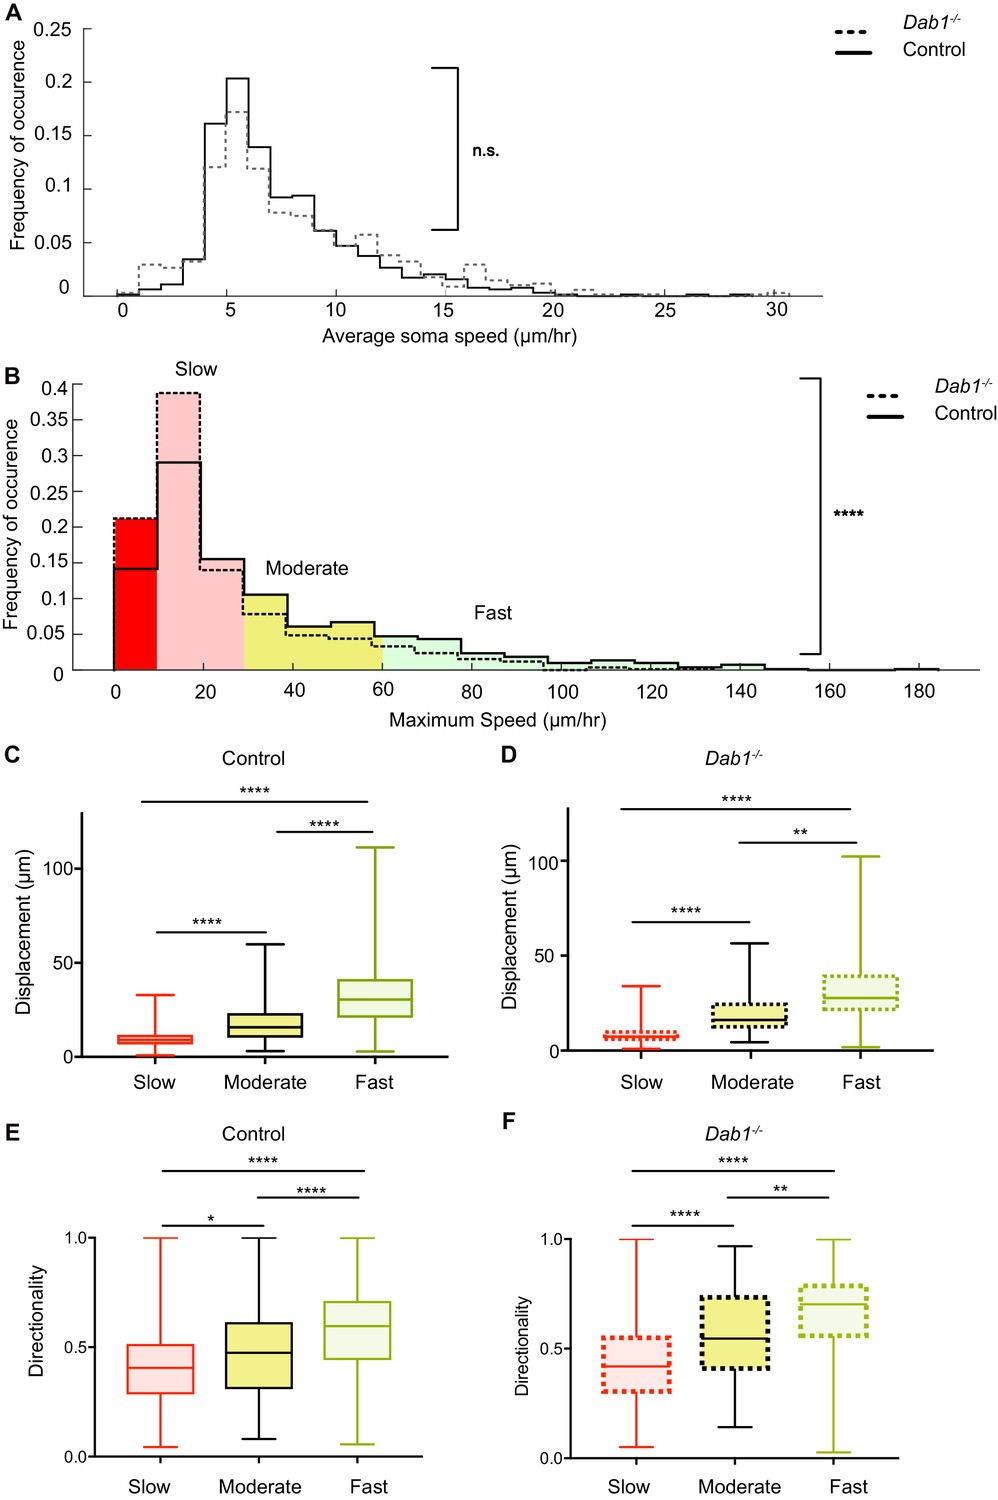
(A) The distribution of average speeds for the entire population of tracked control and Dab1-/- mDA neurons. Overall distribution of average soma speeds of mDA neurons is not significantly altered in Dab1-/- slices compared to controls. Note that entire distribution of control (solid black line) and Dab1-/- mDA neurons (dashed black line) were compared (p=0.0657, Mann-Whitney’s test, n = 806 control, 844 Dab1-/- mDA neurons). (B) The same analysis as shown in (A) was carried out for the distributions of maximum (max) speed. At the population level (distributions were compared), max-speeds of Dab1-/- mDA neurons were shifted significantly towards slower speeds compared to controls (p<0.0001, Mann-Whitney’s test, n = 806 control, 844 Dab1-/- mDA neurons). Non-migratory (max-speed 0–10 μm/hr), slow (30–10 μm/hr), moderate (60–30 μm/hr) and fast cells (>60 μm/hr) are indicated by dark red, light red, yellow and light green background colors, respectively. (C,D) Total displacement (3D) of mDA neurons is significantly higher in moderate compared to slow mDA neurons, and higher in fast mDA neurons compared to moderate neurons in both control (C) and Dab1-/- (D) brains (****p<0.0001, **p<0.01, Kruskal-Wallis test; n = 680 control; n = 639 Dab1-/- cells, three slices/genotype). (E,F) Directionality (defined as ratio of total displacement to path length) in control and Dab1-/- slices is the least in slow mDA neurons, higher in moderate mDA neurons and the highest in fast mDA neurons (*p<0.05, **p<0.01, ****p<0.0001, Kruskal-Wallis test; n = 680 control; n = 639 Dab1-/- cells, three slices/genotype).
Figure 5—figure supplement 1
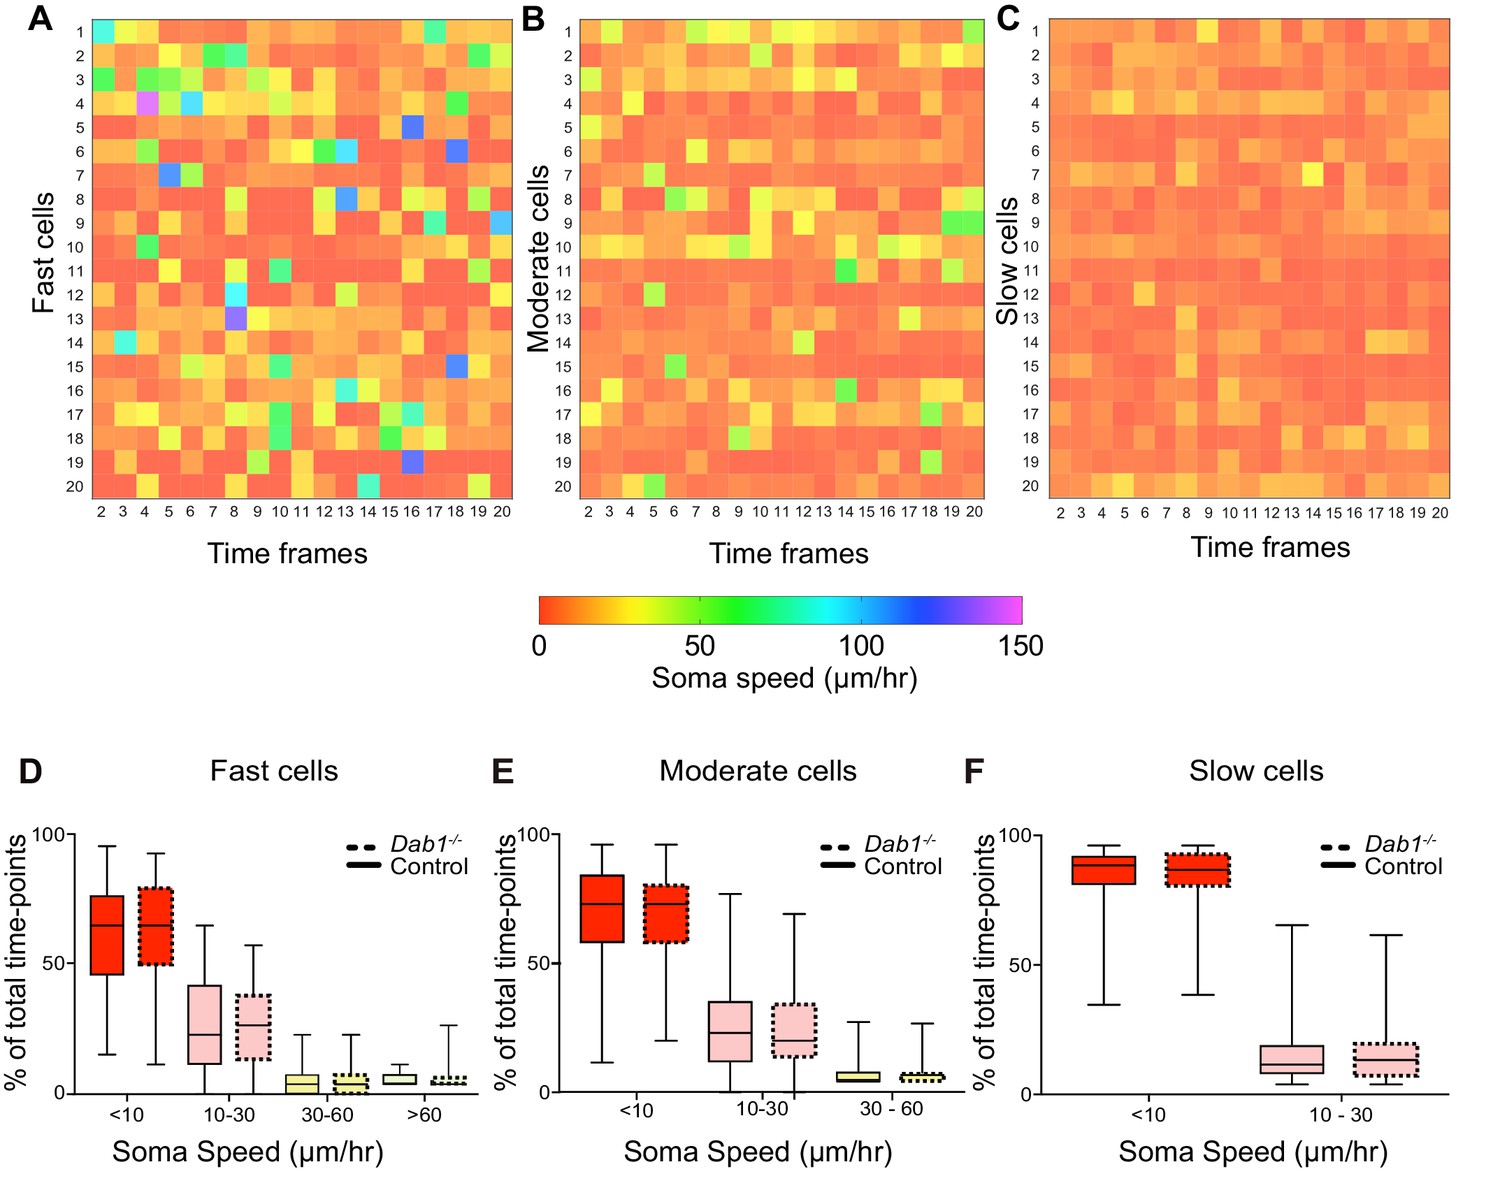
Variation in instantaneous soma speed of mDA neurons.
(A–C) Instantaneous soma speeds of 20 fast, moderate or slow cells in control slices as a heat map across 20 consecutive time frames. Each cell is one row in the heat-map, each column is a time frame. Soma speeds range from 0 to 150 μm/hr. (D–F) Individual fast, moderate and slow cells spend comparable periods of time in fast (light green), moderate (yellow), slow (light red) and rest phases (red) of migration in Dab1-/- slices compared to control slices. Slow cells: 355/806 (control), 430/844 (Dab1-/-); moderate cells: 186/806 (control), 139/844 (Dab1-/-); fast cells : 139/806 (control), 70/844 (Dab1-/-).
Figure 5—figure supplement 2
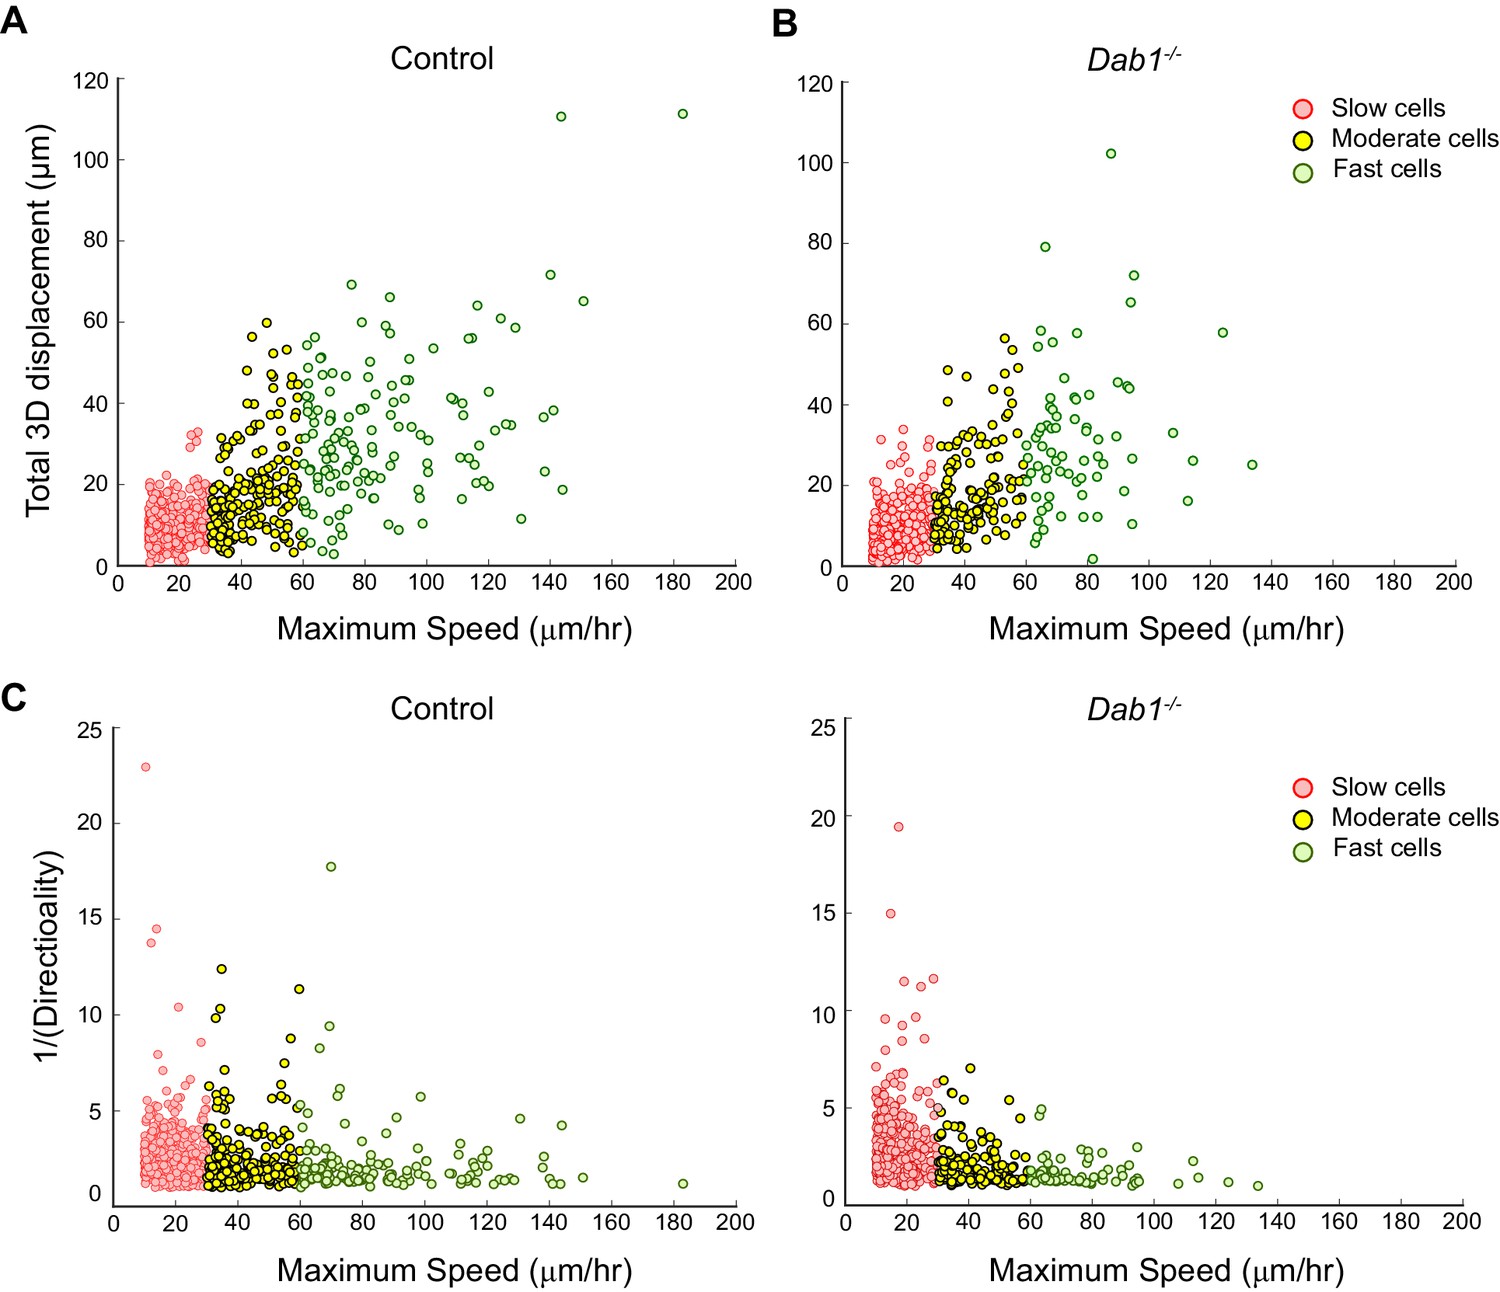
Individual fast, moderate and slow mDA neurons from Dab1-/- slices have similar directionality and displacement profiles as mDA neurons in control slices.
(A,B) Total displacement (3D) increases with increasing max-speed of mDA neurons in control and Dab1-/- slices. (C,D) Directionality of mDA neurons increases with increasing max-speed in control and Dab1-/- slices. Note that inverse values of directionality are plotted against the max-speeds of migratory mDA neurons. Slow cells: 355/806 (control), 430/844 (Dab1-/-); moderate cells: 186/806 (control), 139/844 (Dab1-/-); fast cells : 139/806 (control),70/844 (Dab1-/-).
Figure 6
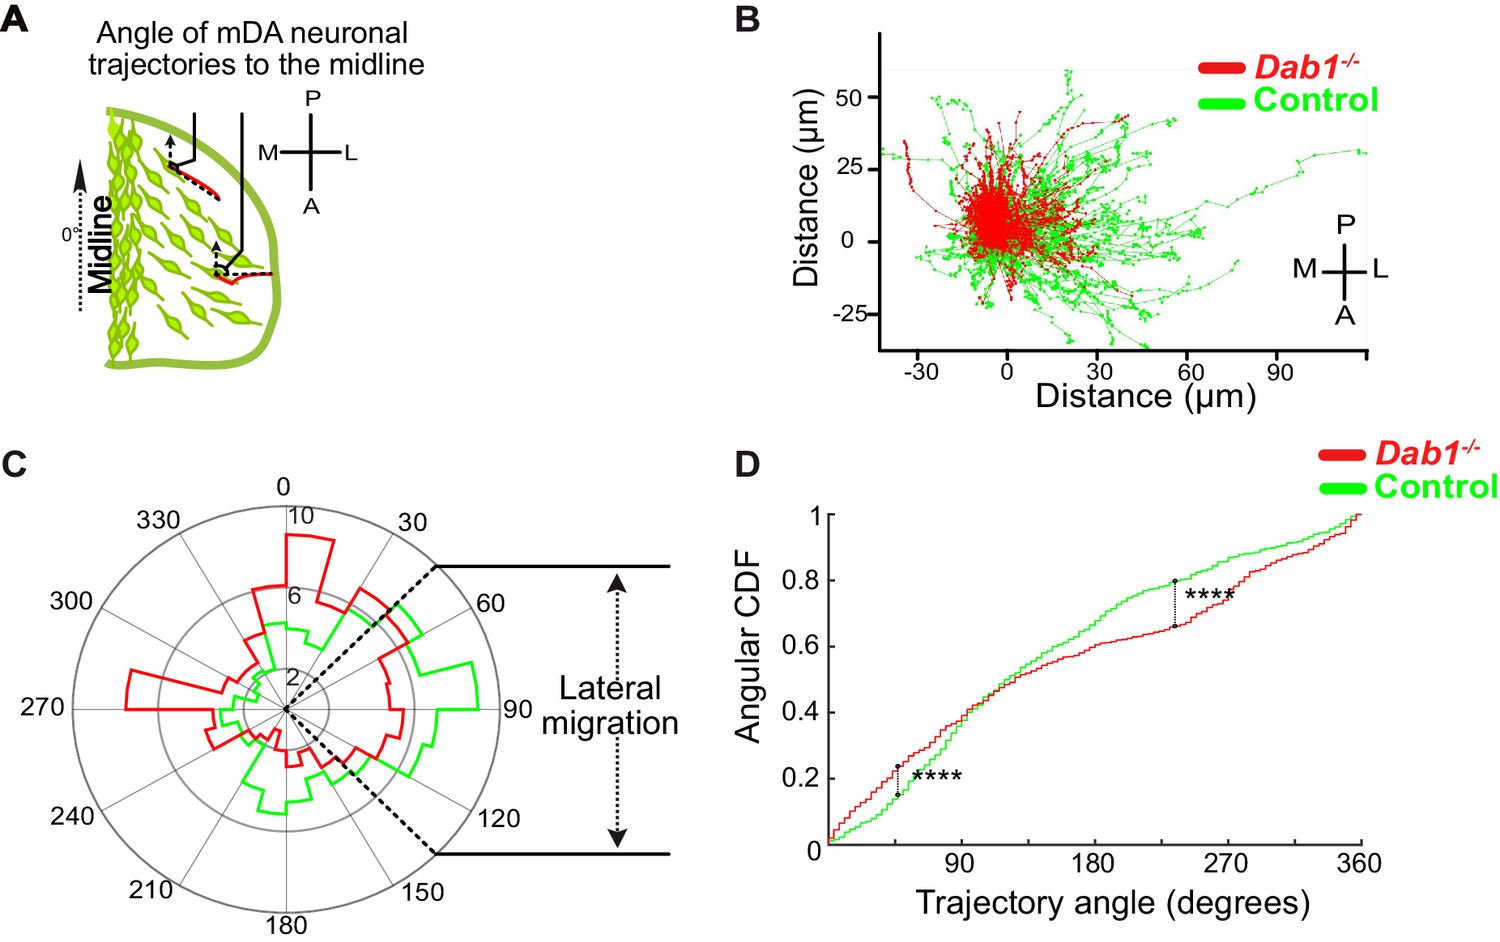
Lateral migration of mDA neurons is reduced in the absence of Reelin signaling.
(A) Schematic showing trajectory angle measurement. (B) Trajectories of control (green) and Dab1-/- (red) mDA neurons (from 1 control and 1 Dab1-/- slice imaged over the same duration), plotted relative to their starting point show loss of lateral directionality in Dab1-/- mDA neuron trajectories. (C) Polar histogram for angle of the mDA trajectories to the midline (0°) for all control (green) and Dab1-/- (red) mDA neurons analyzed. (D) Circular statistical analysis for angular distributions in (C) of control (green) and Dab1-/- (red) mDA neurons shows significant decrease in lateral anisotropy for Dab1-/- slices (****p<0.0001, Kuiper’s test for circular variables; n = 680 control, n = 639 Dab1-/- mDA neurons). CDF: cumulative distribution function.
Figure 7 with 1 supplement
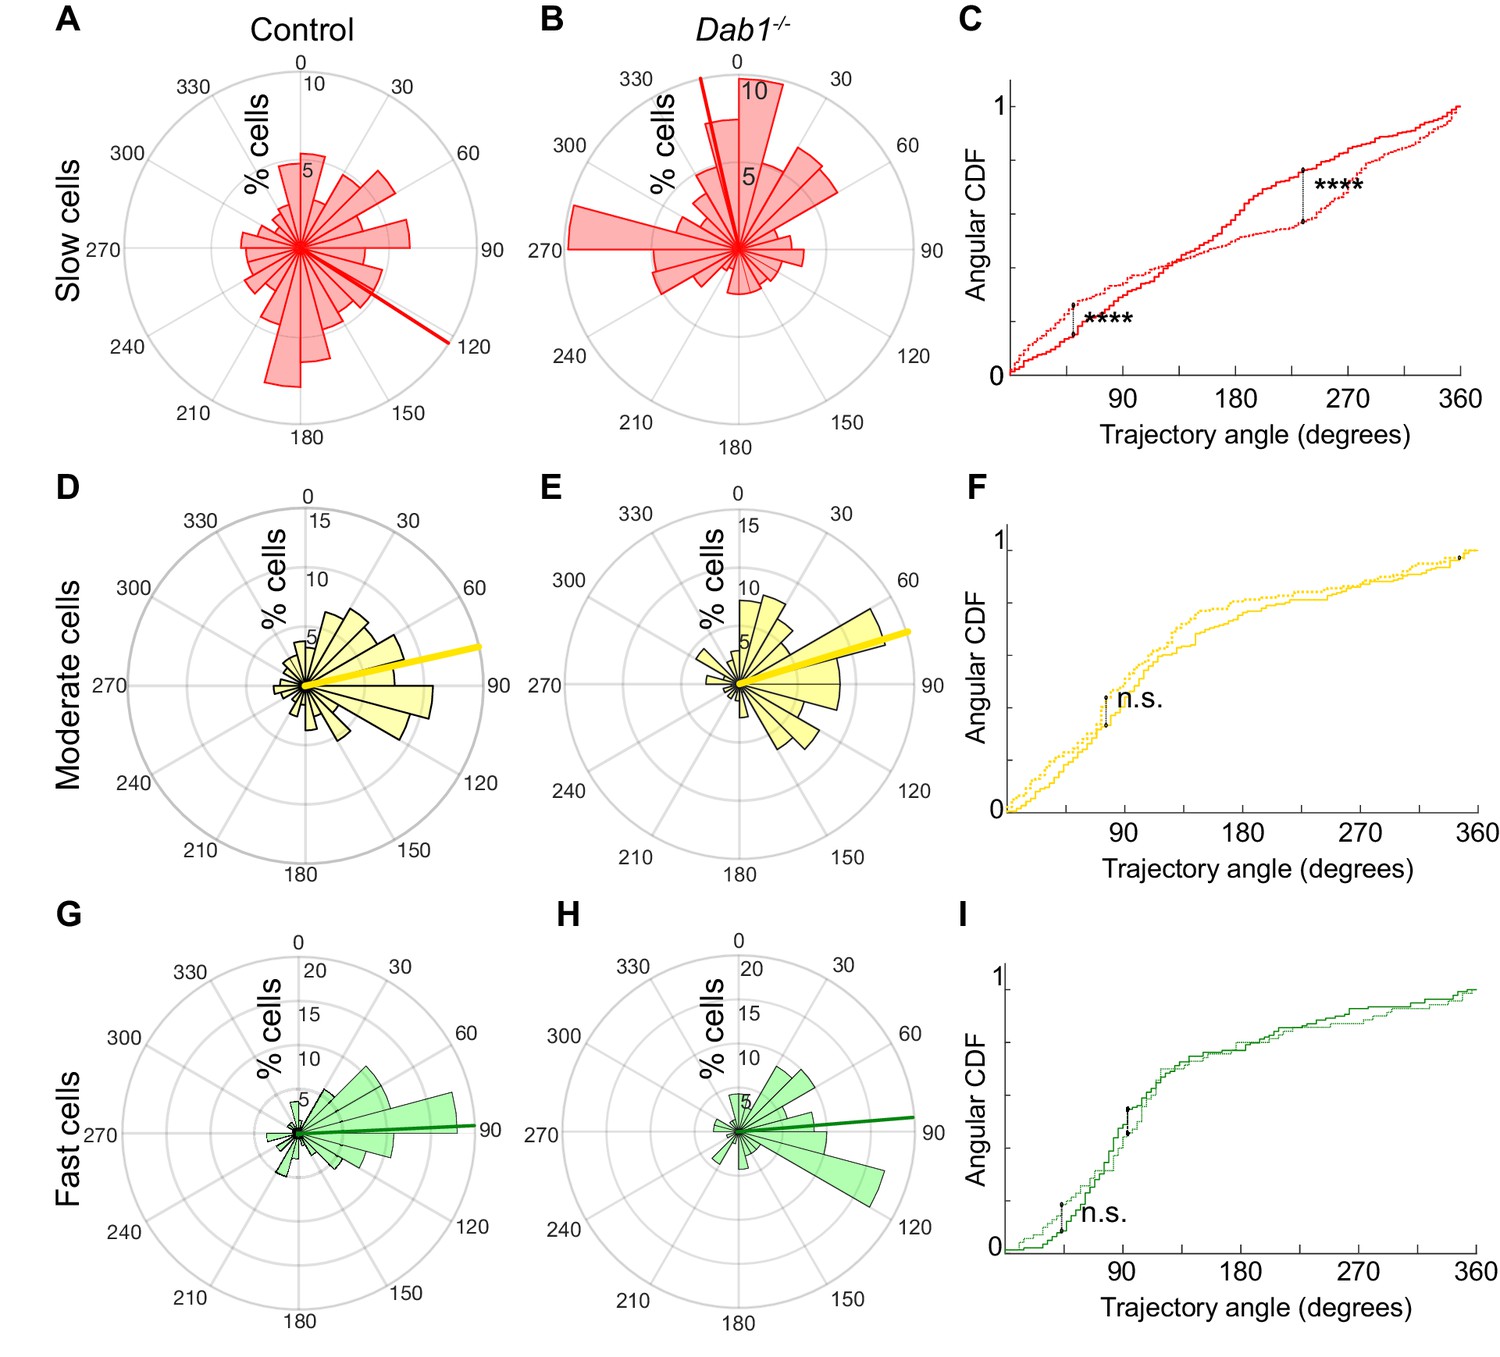
Reelin promotes preference for lateral migration in slow mDA neurons.
Polar histogram for the angle of mDA trajectories to the midline. Radial axes represent the percentage of cells that migrate with various angles to the midline. (A,B) shows that slow cells have the least preference for lateral migratory direction in both control (A) and Dab1-/- (B) slices. (C) Circular statistical analysis for angular distributions of slow mDA neurons shows significant loss of preference for lateral migration in slow Dab1-/- mDA neurons compared to controls (****p<0.0001, Kuiper’s test for circular variables; n = 355 control, 480 Dab1-/- mDA neurons). (D–I) Moderate (D,E) and fast mDA neurons (G,H) show high preference for lateral migration. Moderate (; n = 186 control, n = 139 Dab1-/- mDA neurons) and fast mDA neurons (; n = 139 control, n = 70 Dab1/- mDA neurons) are laterally directed and their angular cumulative distribution functions (CDF) are comparable in control and Dab1-/- slices. Red (A,B), yellow (D,E) and green (G,H) lines represent mean angular direction for slow, moderate and fast populations, respectively.
Figure 7—figure supplement 1
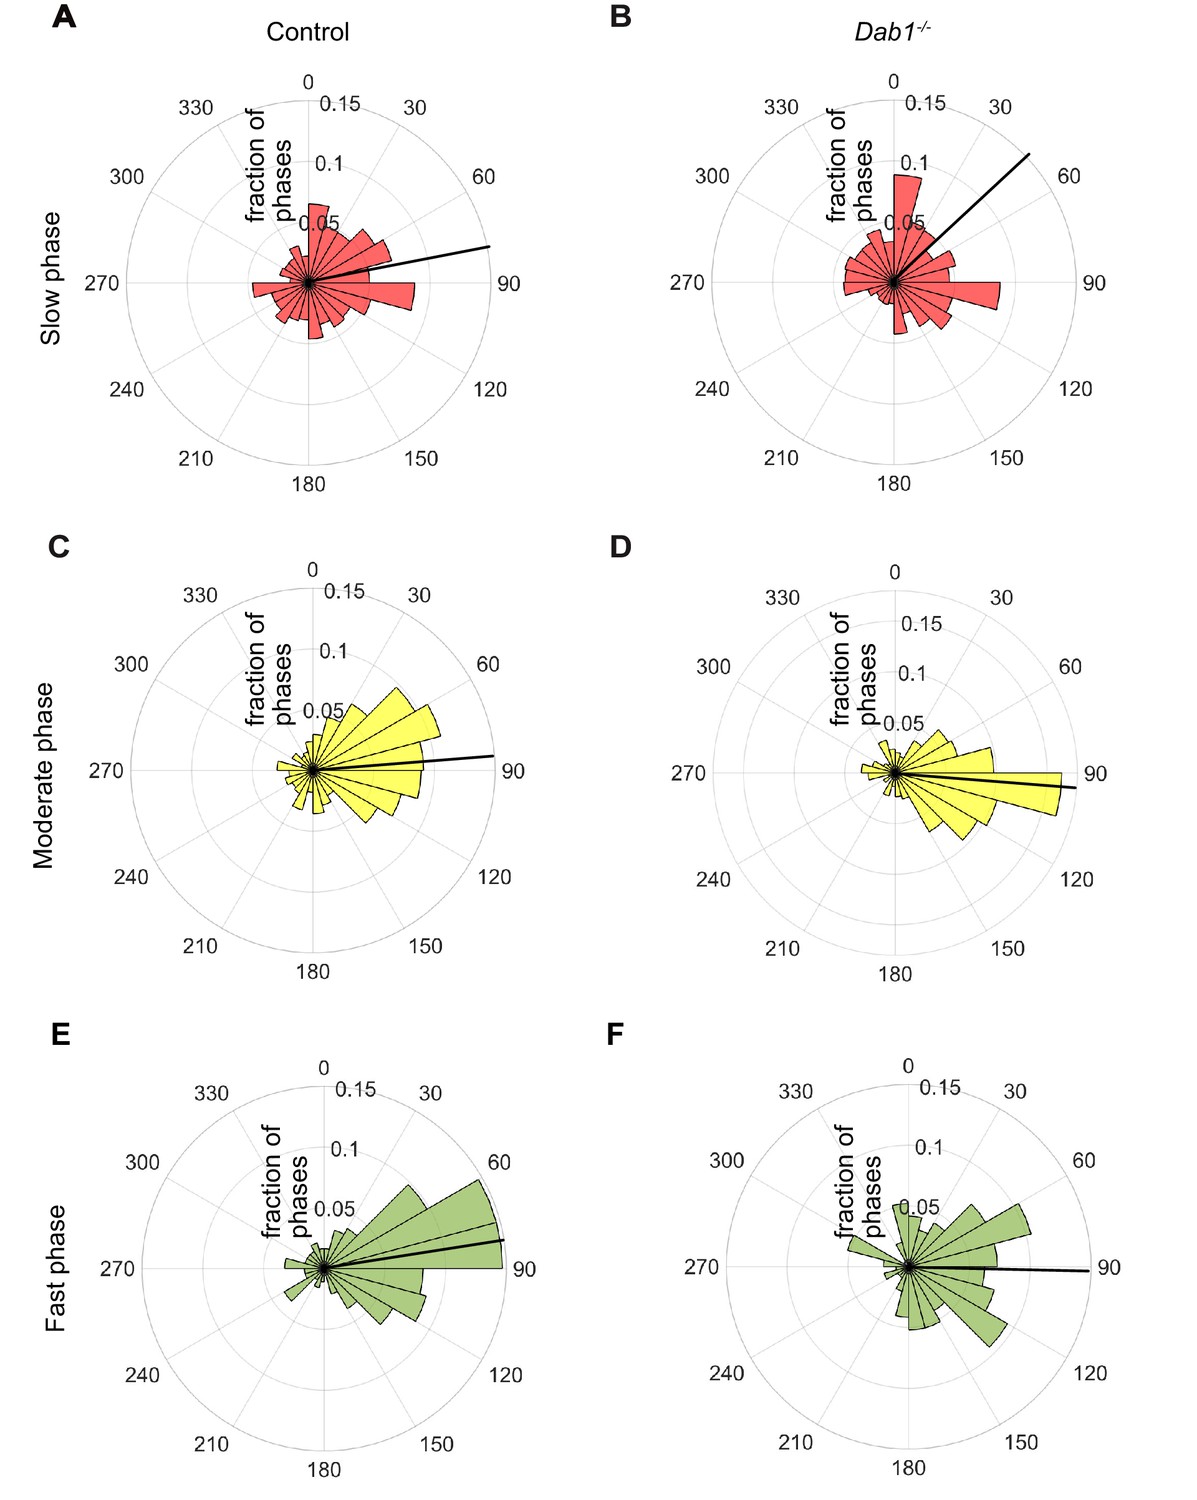
Lateral migration occurs predominantly during moderate and fast migratory phases of mDA neurons.
Polar histogram for the angle of individual mDA phases to the midline. Radial axes represent the fraction of mDA slow, moderate and fast phases that have various angles to the midline. (A,B) Polar histogram for angle of slow mDA trajectories to the midline shows that slow migratory movements have the least preference for lateral migratory direction in both control (A) and Dab1-/- (B) slices (n = 3506 movements in control, n = 2622 movements in Dab1-/- mDA neurons). (C–F) Moderate (C,D; n = 506 movements in control, n = 298 movements in Dab1-/- mDA neurons) and fast movements (E,F; n = 184 movements in control, n = 96 movements in Dab1/- mDA neurons) are laterally directed and comparable in control and Dab1-/- slices. Thick black line represents mean angular direction for slow, moderate and fast populations, respectively.
Figure 8 with 4 supplements

Reelin promotes stable morphology of migrating SN-mDA neurons.
(A) Control mDA neuron displaying a ‘bipolar-unbranched’ morphology at all analyzed time-points. (B) Soma speed profile of mDA neuron shown in (A). (C) Control mDA neuron transitioning between bipolar and multipolar morphology. At t = 0 min, the cell has a branched leading process (LP), the cell soma moves along the LP to reach the branch-point and takes up a multipolar morphology (t = 20 min). The cell remains multipolar until t = 90 min, after which one process is retracted (t = 120 min) and the cell resumes a bipolar morphology (t = 150 min). Bipolar phase: one or two processes arise directly from the soma. Multipolar phase: more than two processes arise directly from the soma. (A,C) Colored circles: soma as defined by the tracking process. Scale bar: 25 μm. (D) Soma speed for the neuron in (C) is higher during its bipolar phase. (E) Relative proportion of constantly bipolar mDA neurons are decreased, while transitionary mDA neurons are increased in Dab1-/- slices. (F) Frequency of transitions from multipolar to bipolar phase (and vice versa) are not significantly altered in the absence of Reelin signalling (p=0.6922; Mann-Whitney’s test). (G) Bipolar and multipolar phase of a Dab1-/- transitionary mDA neuron. In this example, the bipolar phase lasts from t = 0 min to t = 60 min. In the multipolar phase (starting at t = 80 min) many unstable protrusions form. Scale bar: 25 μm. See Figure 8—figure supplement 3 for more detail. (H) Quantification of appearance and disappearance of branches (defined as branch transitions per hour) in control and Dab1-/- mDA transitionary neurons shows a significant increase in branch transitions in mDA neurons in Dab1-/- slices (****p<0.0001; Mann-Whitney’s test).
Figure 8—figure supplement 1

Morphological characterization of mDA neurons in control slices.
(A) Control bipolar mDA neuron displaying bipolar-unbranched morphology at all analyzed time-points. (B) Bipolar mDA neuron that switches between a branched and unbranched leading process. (C) Transitionary mDA neuron that switches between bipolar and multipolar phases twice in the duration of analysis. (D) mDA neuron that remains multipolar during the entire duration of analysis.
Figure 8—figure supplement 2
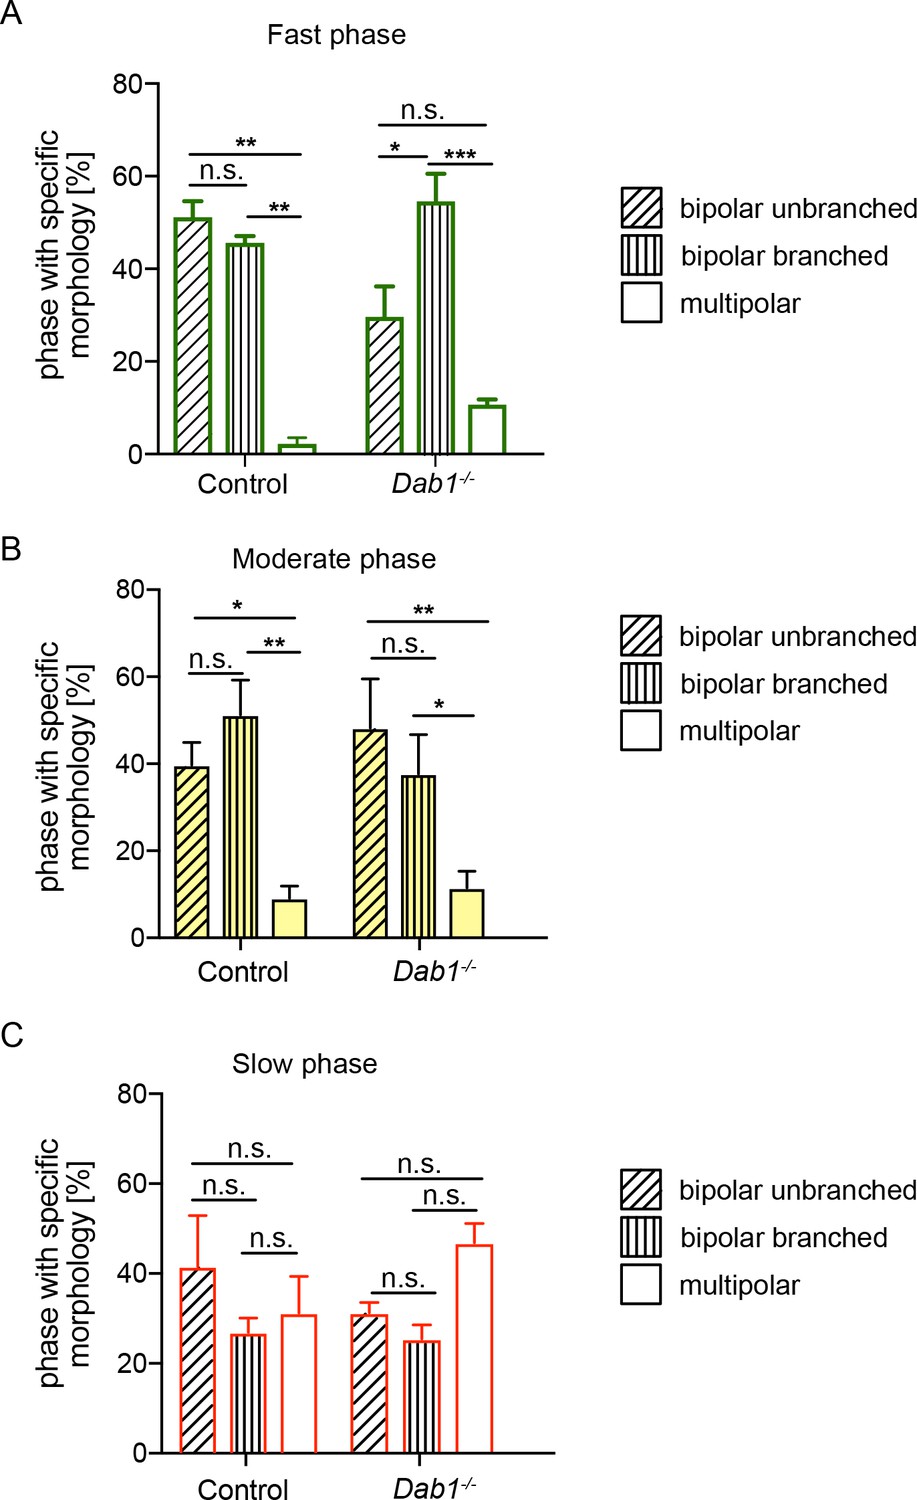
mDA neurons are predominantly associated with bipolar morphology during moderate-to-fast phases of migration.
Bipolar unbranched and bipolar branched morphologies are the predominant morphologies of mDA neurons during fast and moderate phases of migration (A,B). mDA neurons during their slow migration phase show a higher proportion of multipolar morphologies in both control and Dab1-/- mDA neurons (C) (*p<0.05, **p<0.005, ***p<0.001; two-way ANOVA). Total number of data points in fast phase (A): Control: 126, Dab1-/-: 81; in moderate phase (B): Control: 156, Dab1-/-: 99; in slow phase (C): Control: 408, Dab1-/-: 626.
Figure 8—figure supplement 3
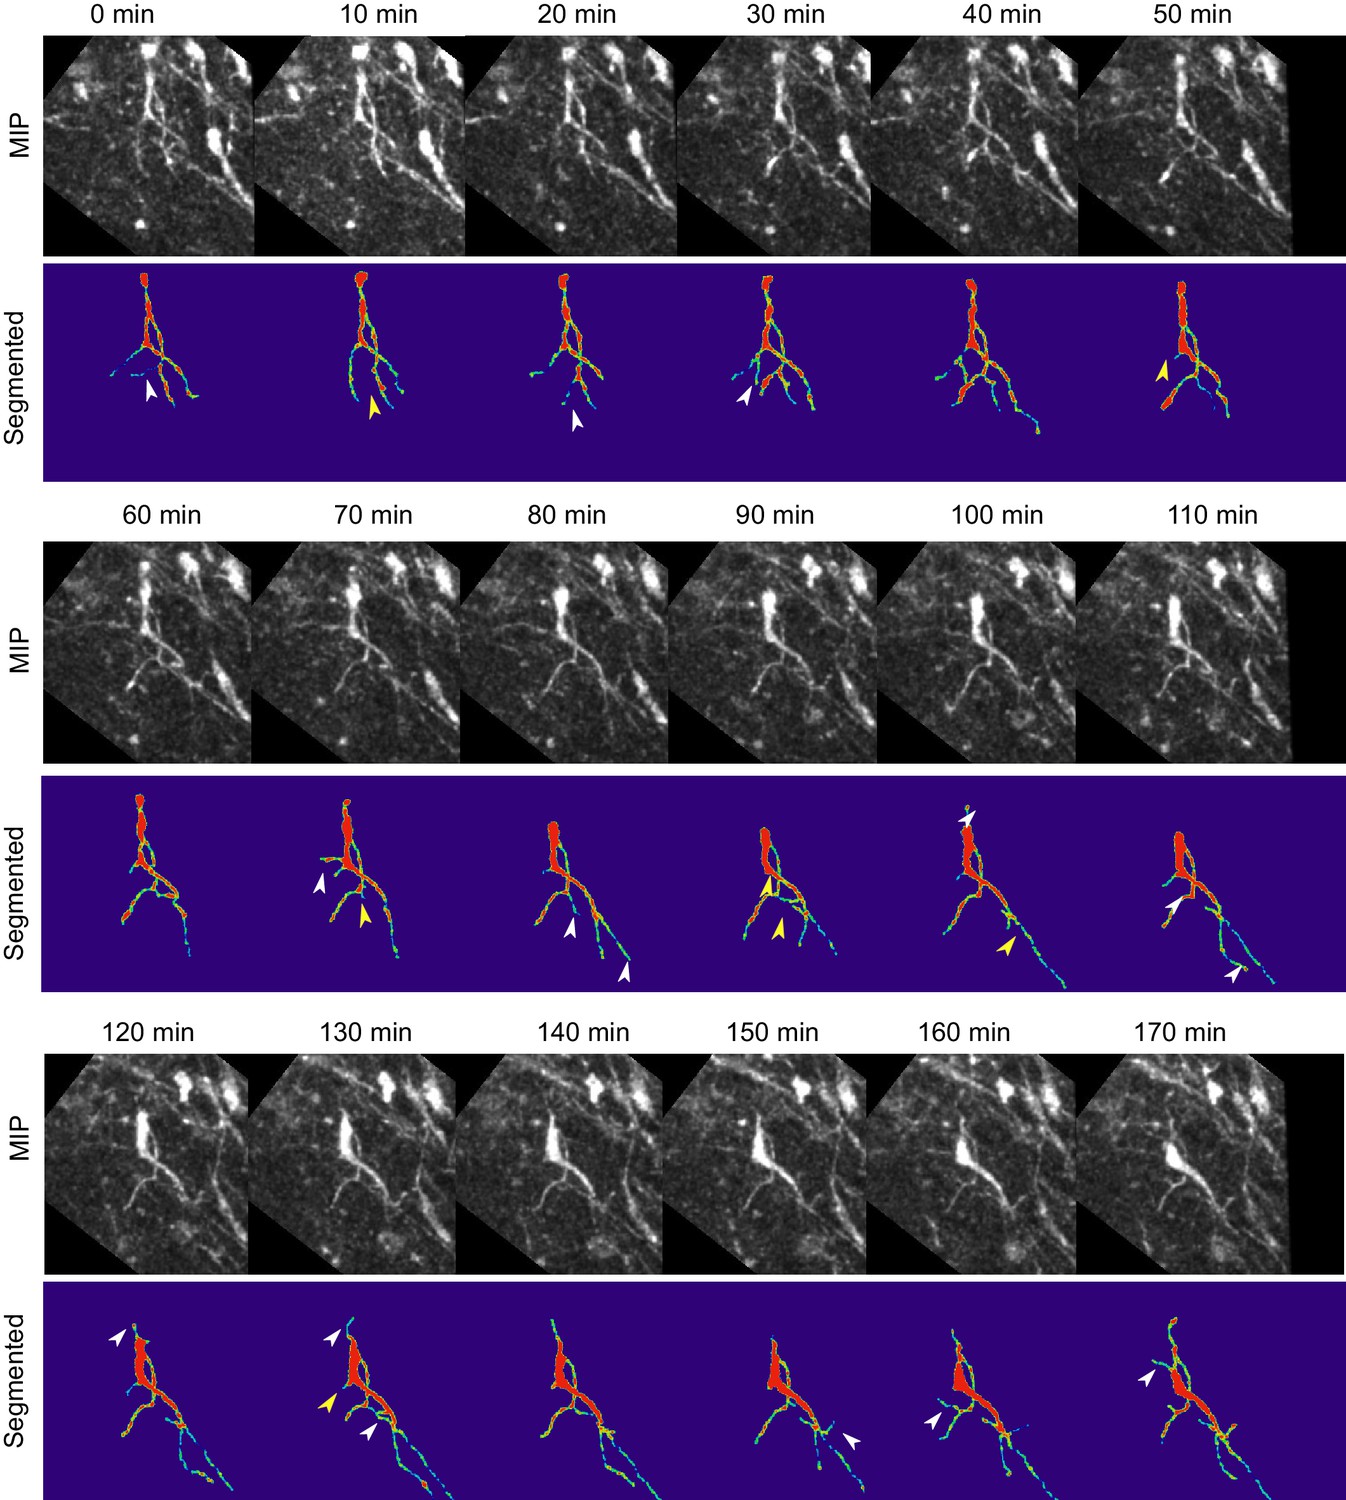
Absence of Reelin signaling results in the formation of unstable protrusions on the soma and leading process of mDA neurons.
Maximum intensity projections of cell shown in Figure 8 for each time point of the analysis. Cell in (A–C) is color-coded for the intensity of YFP in images (Physics LUT in Fiji). Red represents bright structures, green-blue represents weakly labelled structures. White arrowheads indicate appearance of a branch/protrusion, yellow arrowheads indicate disappearance. Scale bar: 25 μm.
Figure 8—figure supplement 4
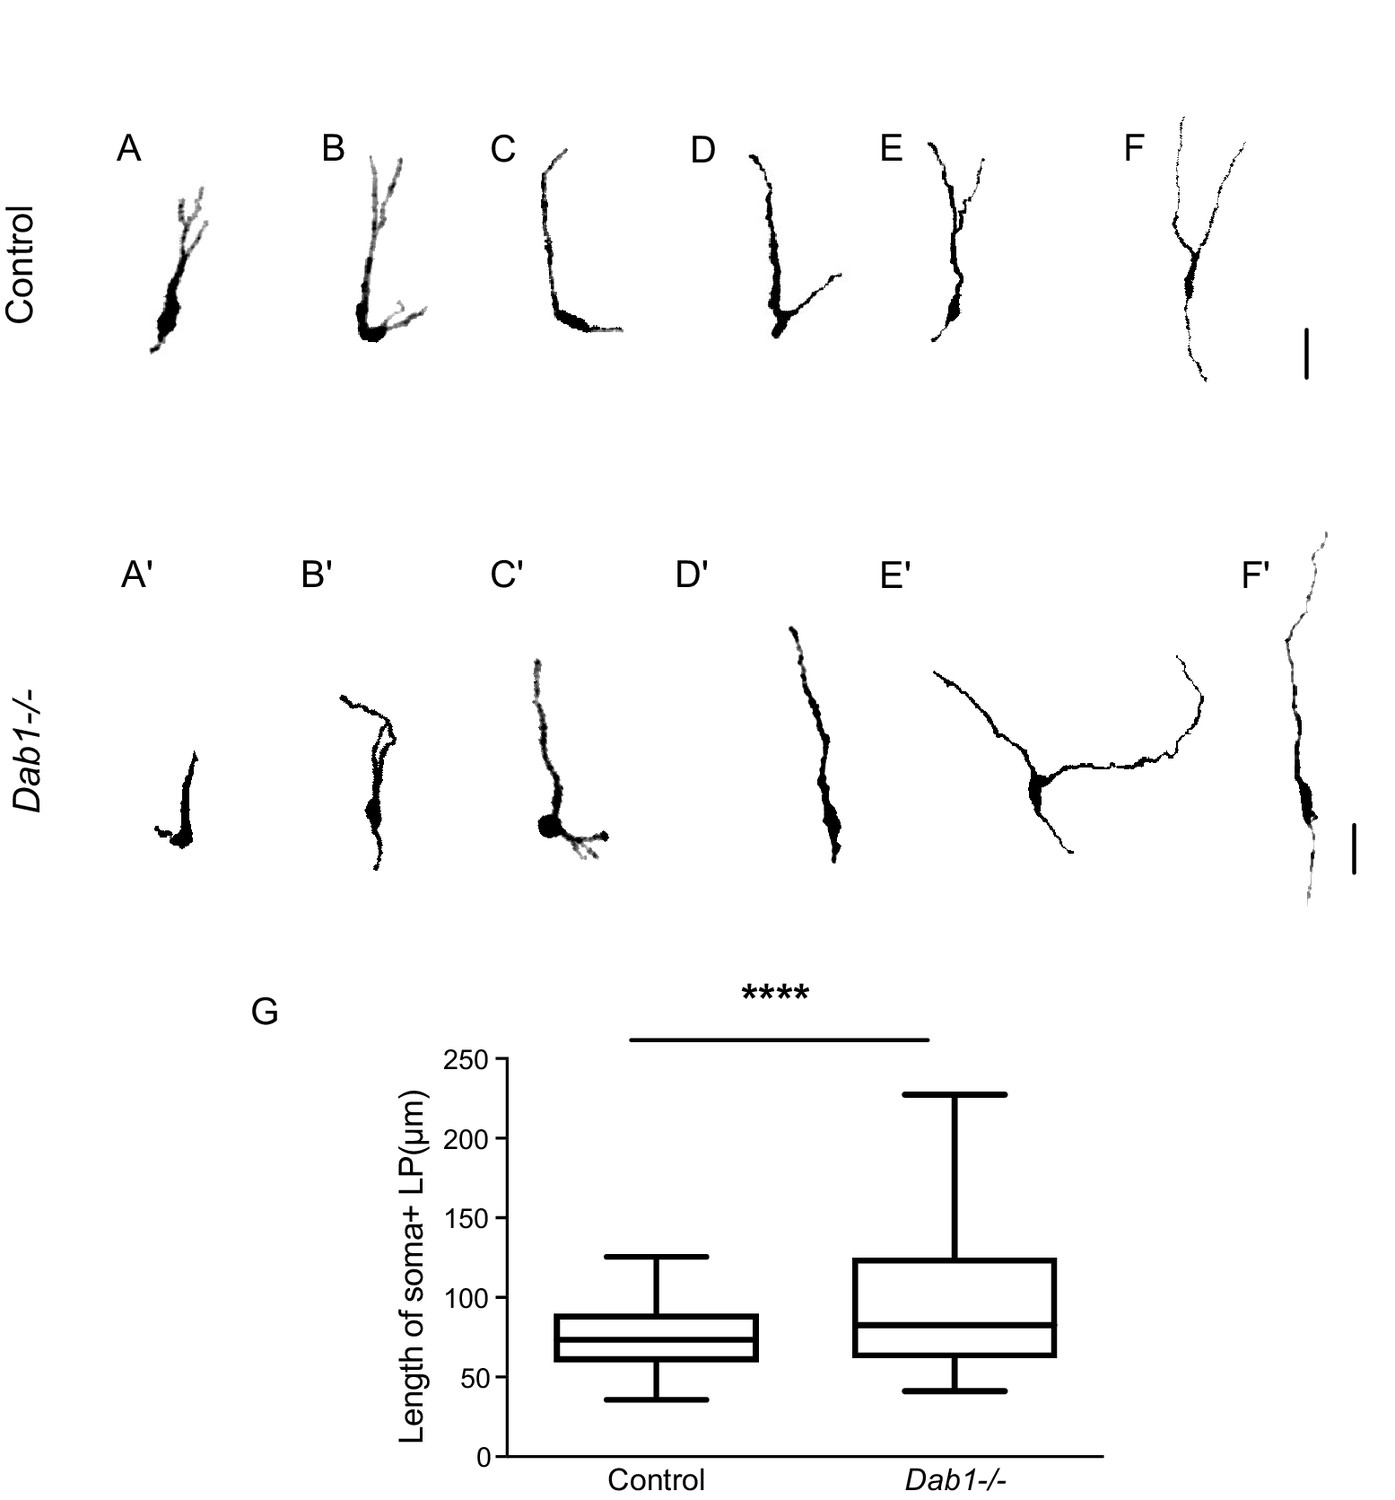
Greater spread in length of leading process in Dab1-/- mDA neurons.
(A–F) 6 of 20 manually segmented control mDA neurons. (A’–F’) 6 of 20 manually segmented Dab1-/- mDA neurons. (G) Length of cell soma and leading process shows a wider spread in the absence of Reelin signalling. ****p<0.001 as assessed by Mann-Whitney’s test.
Figure 9 with 2 supplements
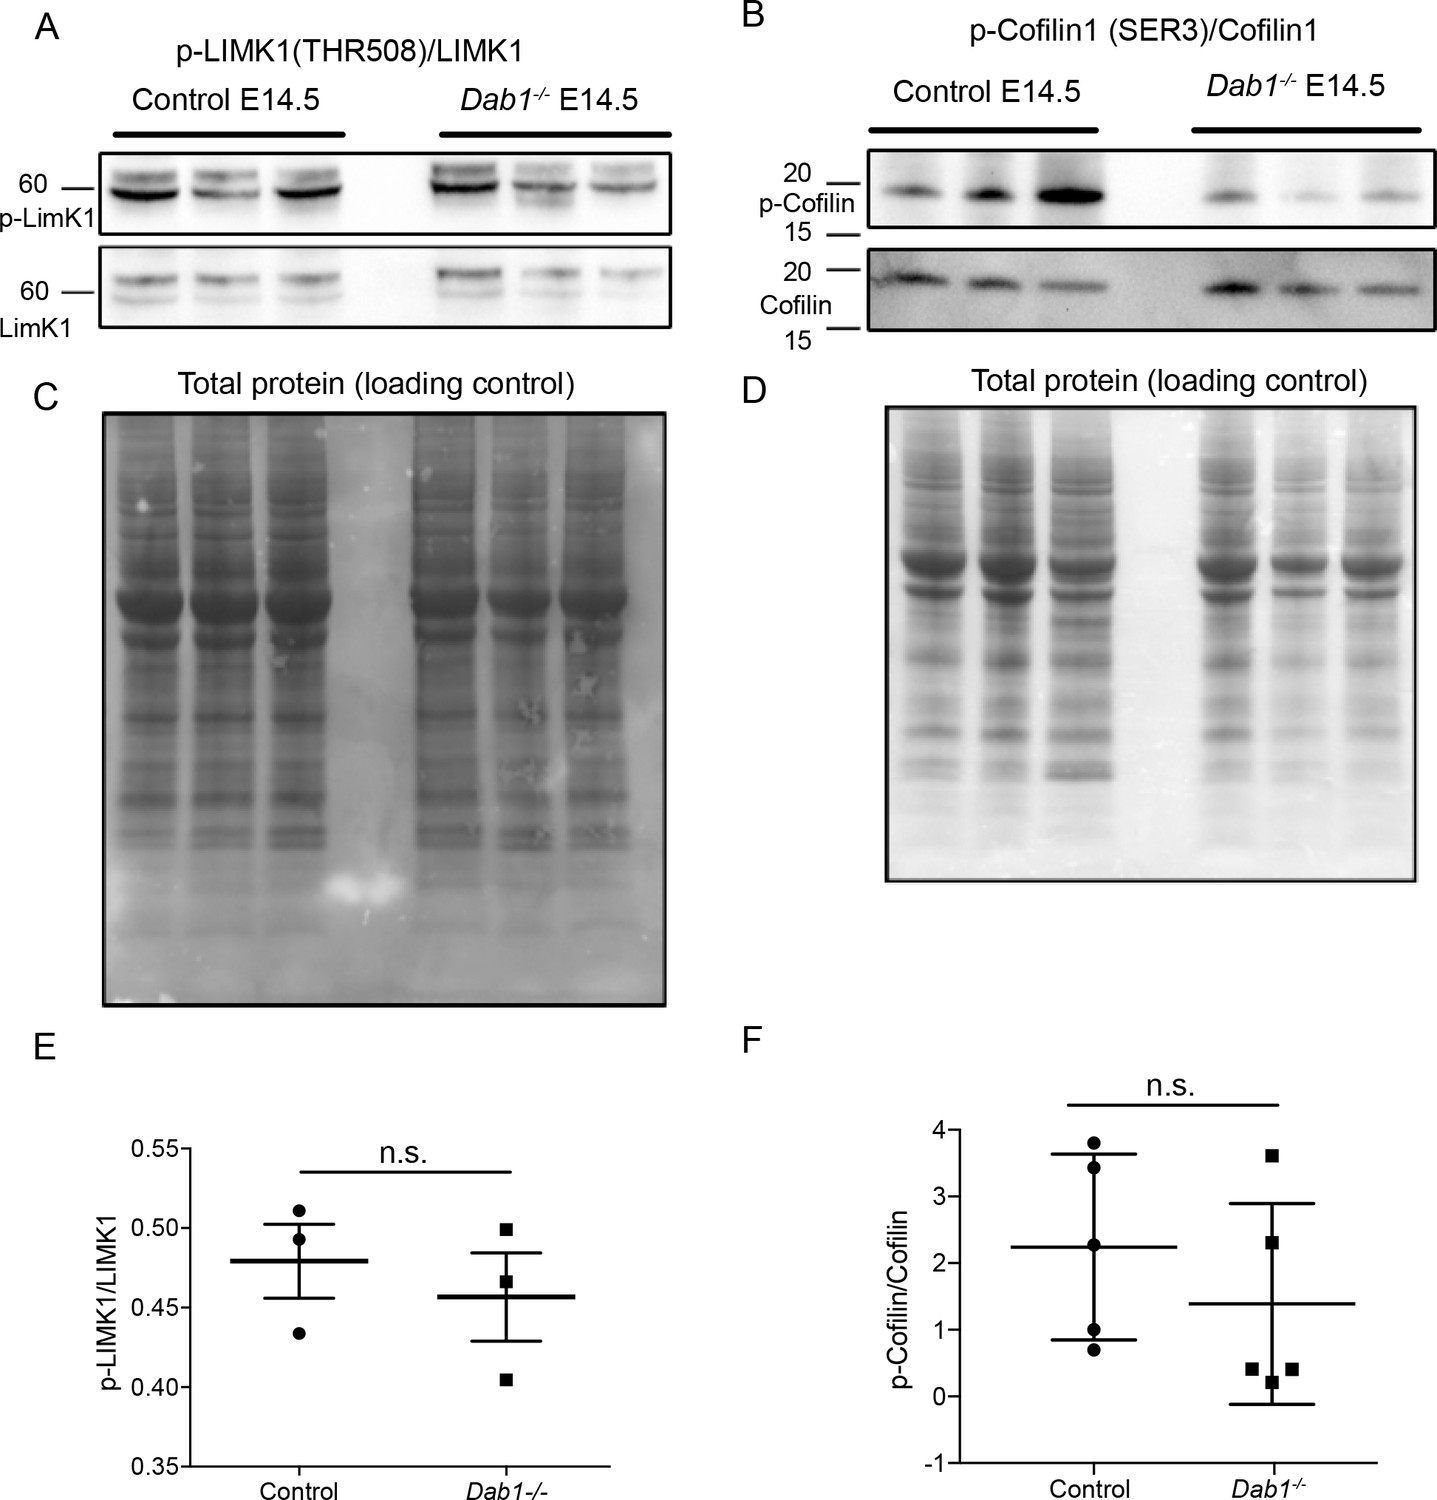
Phosphorylation levels of proteins in the canonical Reelin signaling pathway are not altered in Dab1-/- ventral midbrain at E14.5.
(A,E) Relative phosphorylation levels of LIMK1 are not significantly altered in Dab1-/- ventral midbrains. p-value=0.5682, Student’s t-test (n = 5 brains/genotype). (B,F) Relative phosphorylation levels of Cofilin1 are not significantly changed in Dab1-/- ventral midbrains. p-value=0.854, Student’s t-test (n = 5 brains/genotype). (C,D) Total protein in the membrane, stained with Amido black, was used as loading control.
Figure 9—figure supplement 1
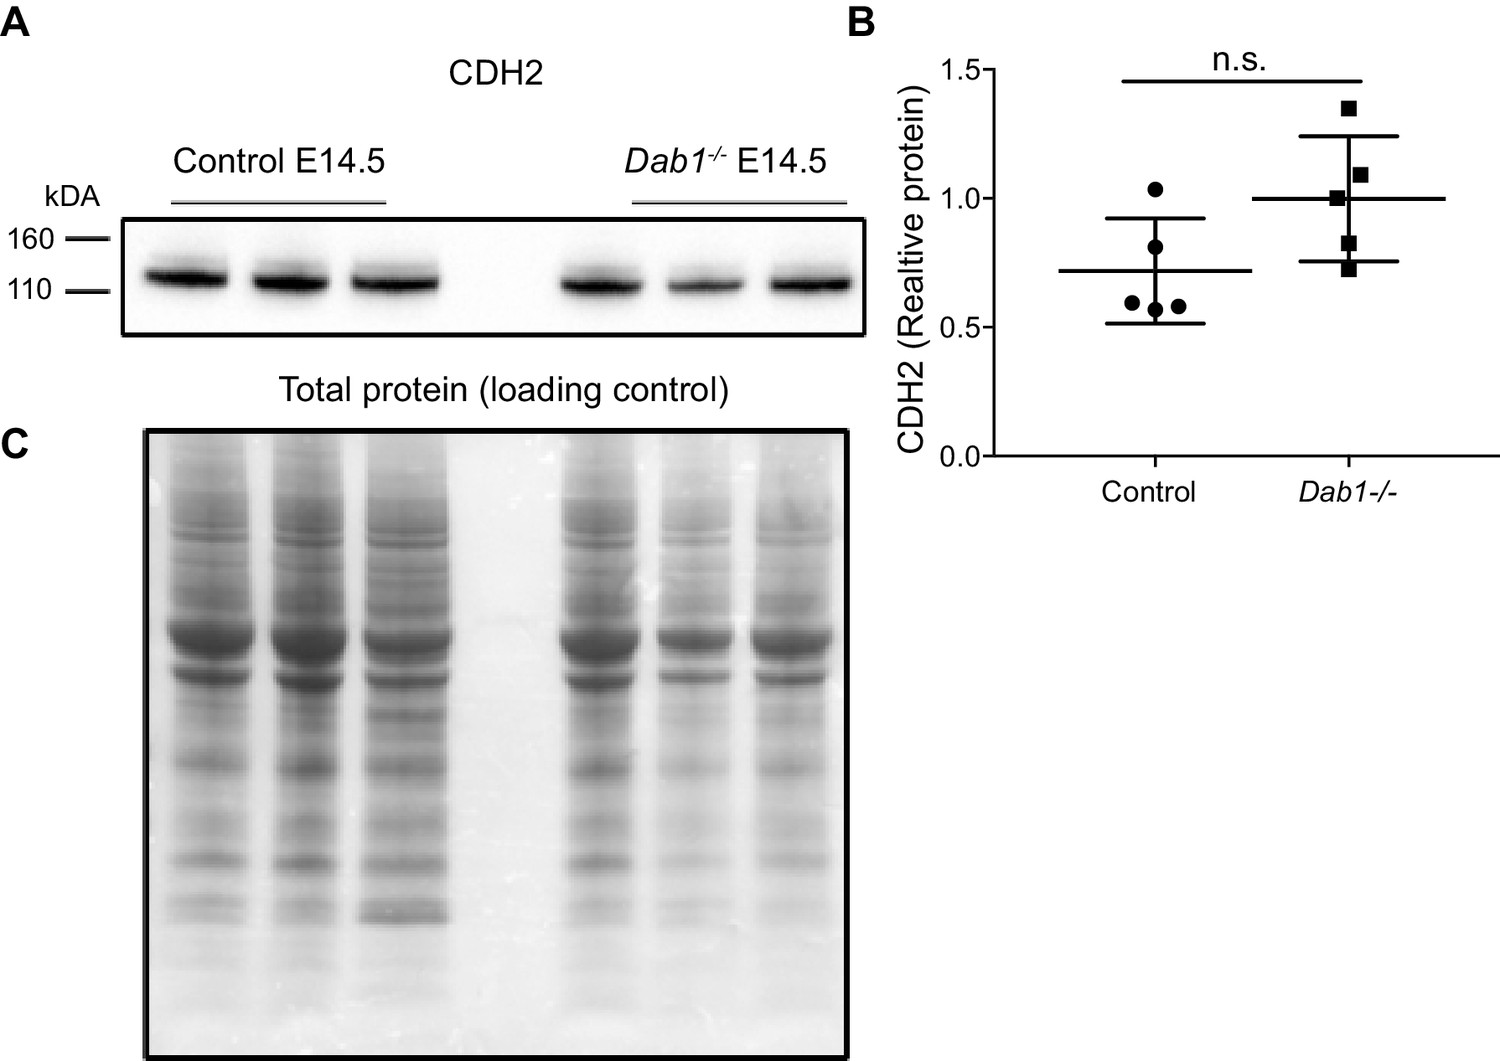
CDH2 expression levels in the ventral midbrain of control and Dab1-/- brains at E14.5.
(A, B) Immuno blot for ventral midbrain tissue from control and Dab1-/- brains (A) shows no changes in relative protein levels of CDH2 in Dab1-/- tissue compared to controls (B). p-value 0.08 as assessed by Student’s t-test (n = 5 brains/genotype). (C) Total protein in the membrane, stained with Amido black, was used as loading control.
Figure 9—figure supplement 2
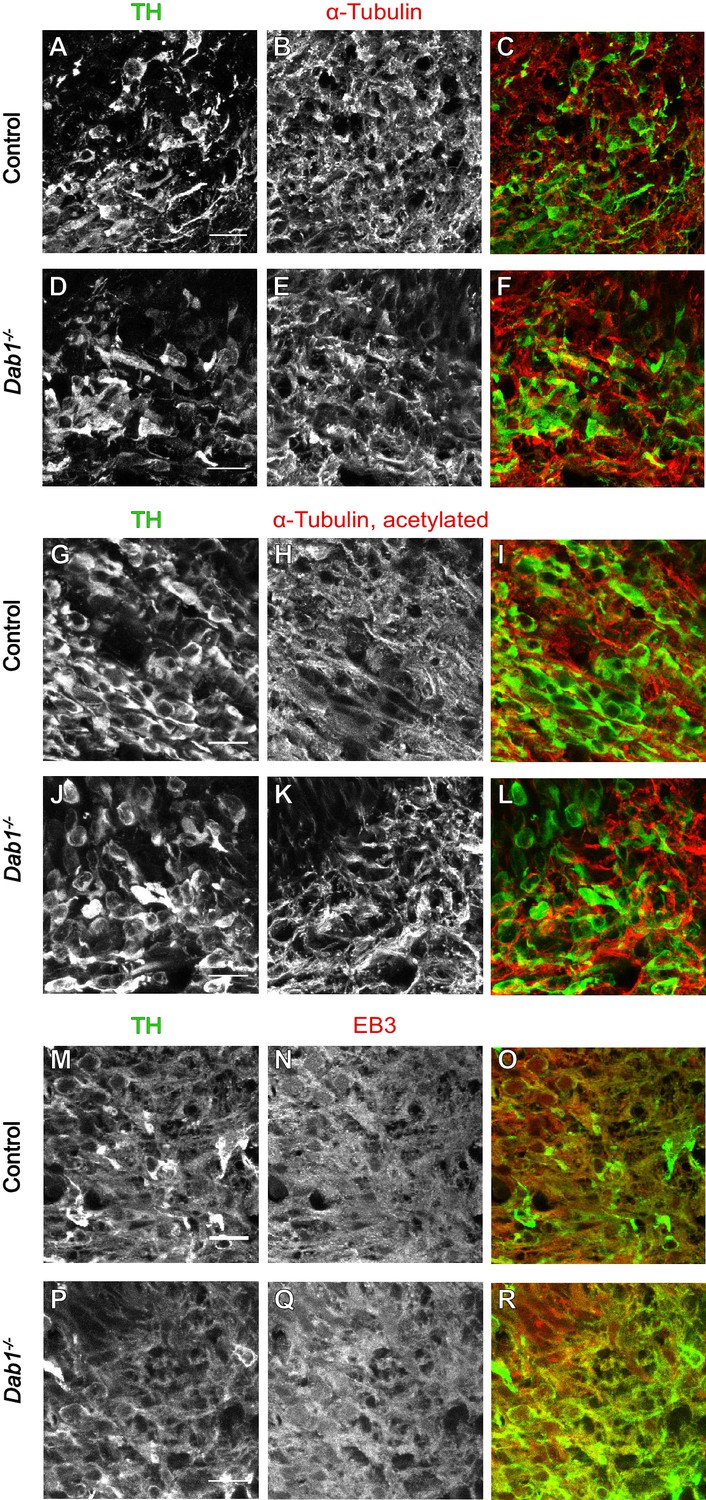
Organization of microtubules is not altered in mDA neurons in the absence of Reelin signaling.
Immunostaining for α-tubulin (A–F), acetylated α-tubulin (G–L) and EB3 (M–R) in coronal sections of E13.5 ventral midbrain reveals no differences in expression levels of these markers or the organization of microtubules in TH+ mDA neurons between controls and Dab1-/- embryos at E13.5.
Figure 10
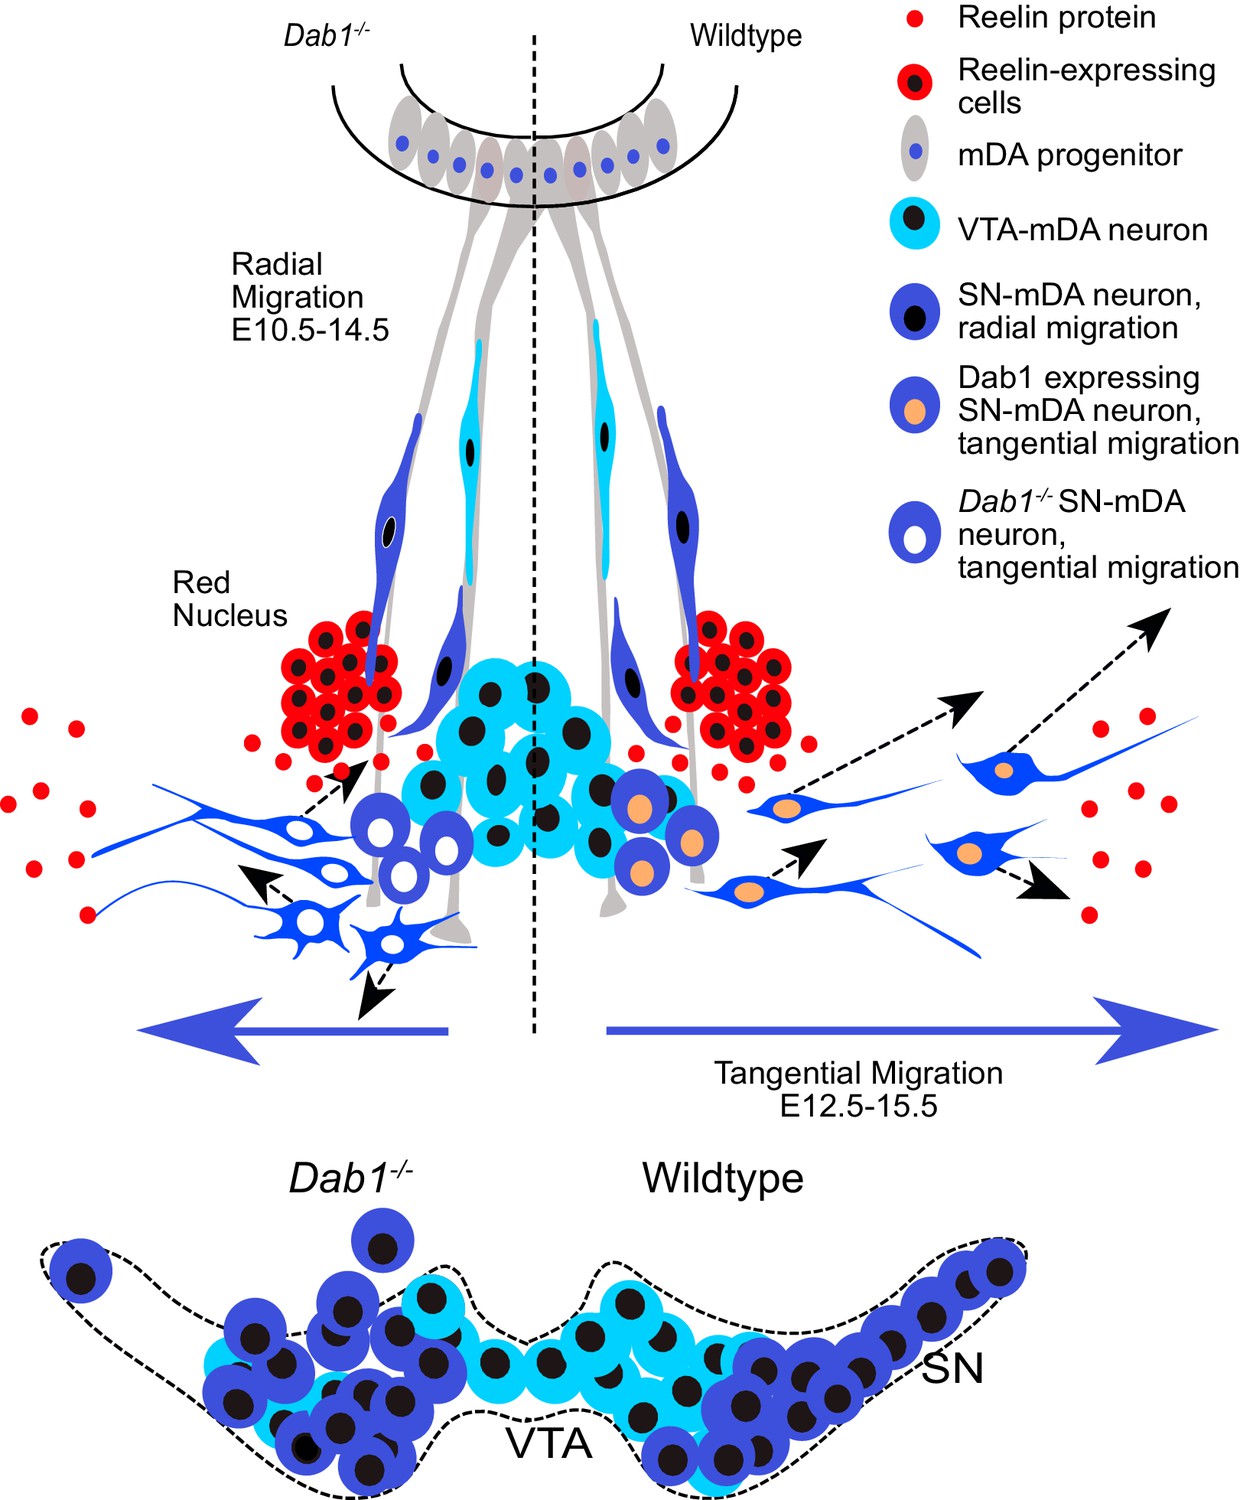
Schematic representation of Reelin regulation in mDA tangential migration.
Reelin directly regulates lateral, tangential migration of mDA neurons and promotes fast, laterally directed mode of migration by regulating small lateral movements and stabilizing morphology of mDA neurons. In absence of Reelin signaling, slow movements in mDA neurons lose their lateral anisotropy, morphologies are less stable during migration and the fraction of neurons undergoing fast, laterally directed migration is reduced. This results in a medial clustering of SN-mDA neurons at late embryonic and postnatal stages.
Author response image 1
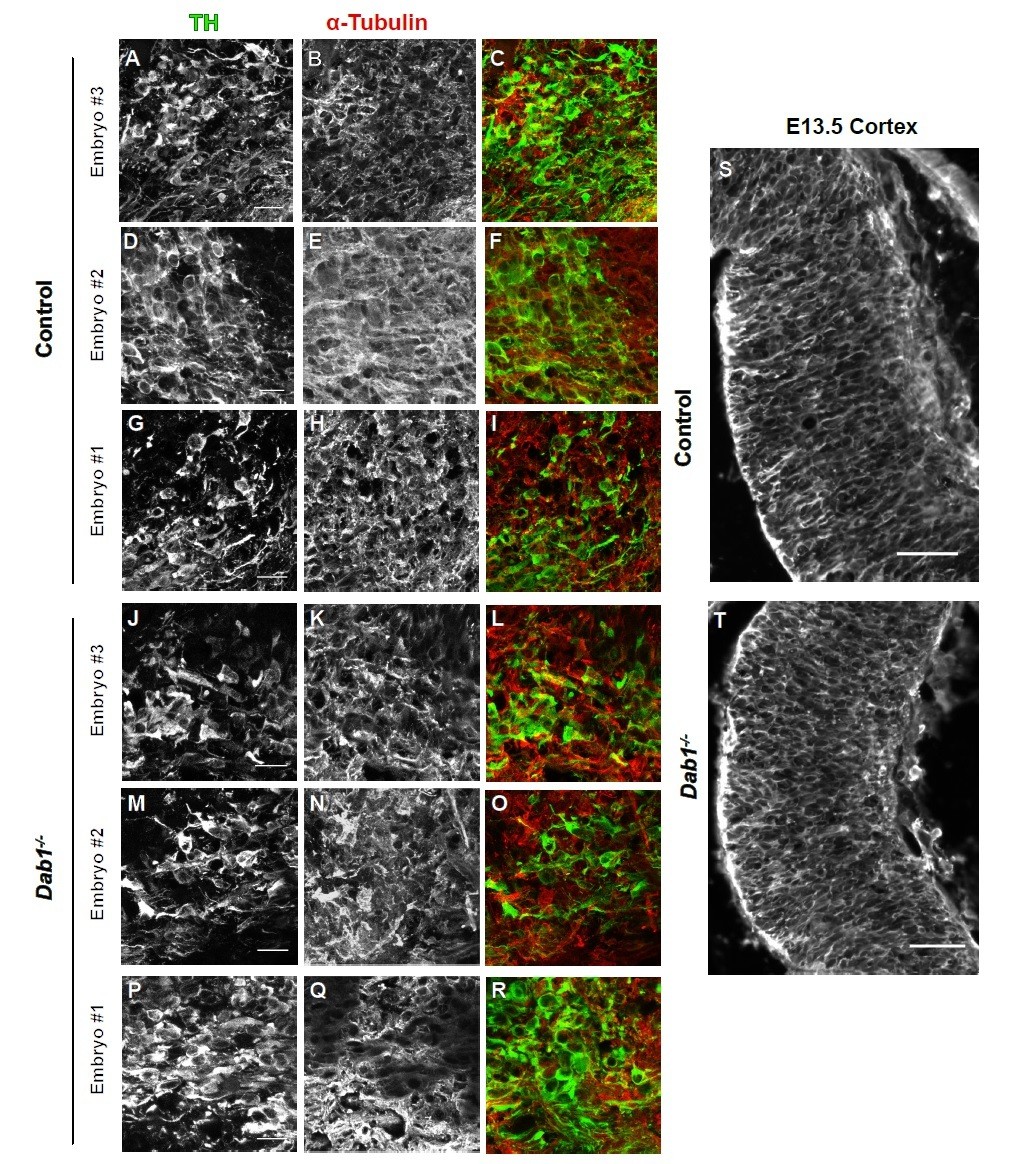
α-tubulin in control and Dab1-/- E13.5 brains.
(A-I) TH (A,D,G) α-tubulin (B,E,H) and overlap (C,F,I) in the developing mDA domain of control embryos (n = 3, from 2 litters). (C,F,I) Overlap of TH and α-tubulin in controls. (JR) TH (J,M,P), tubulin (K,N,Q) and overlap panels (L,O,R) in in Dab1-/- midbrains. Selected region is comparable to the one shown in controls (n = 3, across 2 litters). Control Embryo #1, Dab1-/- Embryo #3 is also shown in Figure 9—figure supplement 2. No obvious phenotype could be identified based on this analysis. (S,T) α-tubulin in the cortex for comparison.
Author response image 2
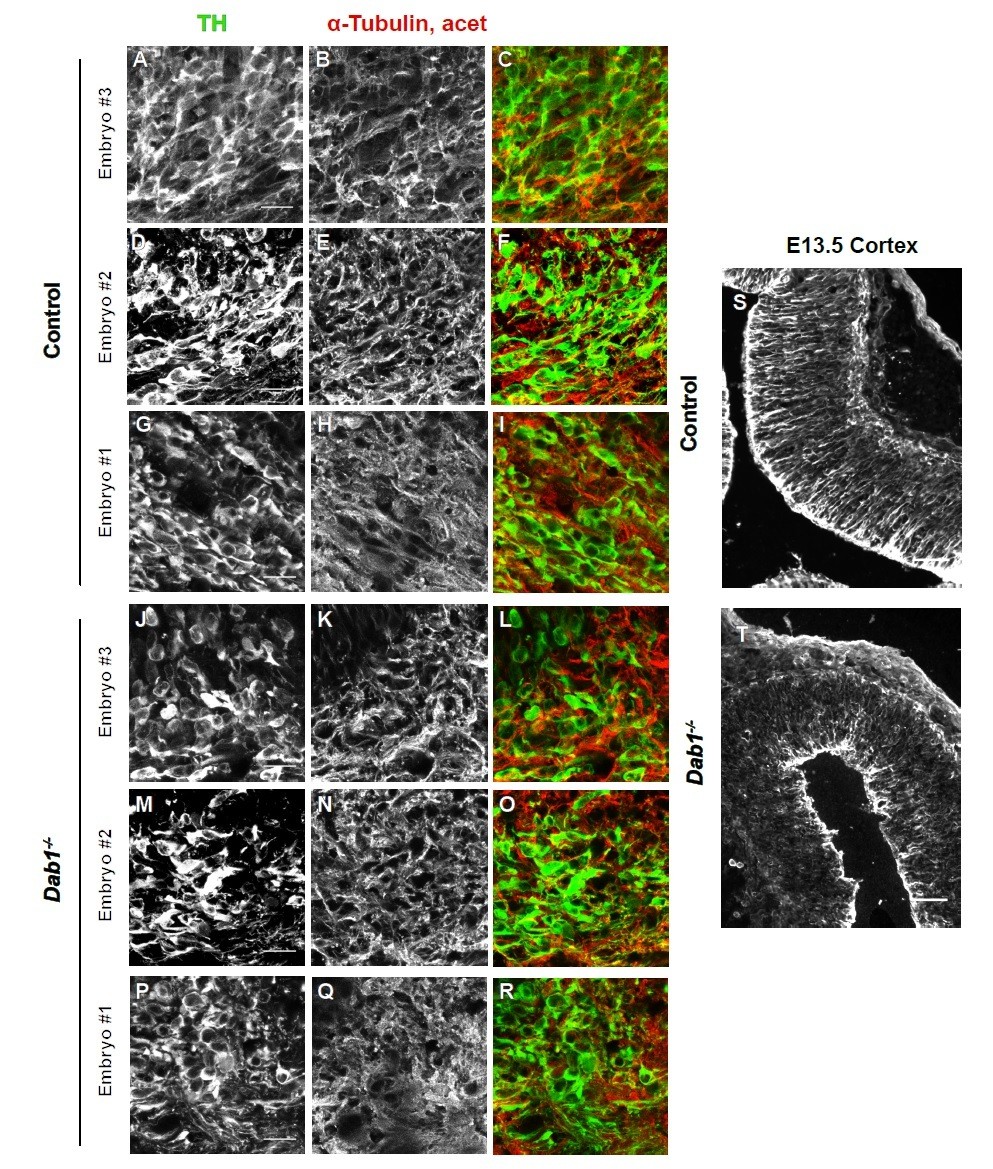
Acetylated α-tubulin in control and Dab1-/- E13.5 brains.
(A-I) TH (A,D,G) and acetylated α-tubulin (B,E,H) in the developing mDA domain of control embryos (n = 3, from 2 litters). (C,F,I) overlap of TH and acetylated α-tubulin in controls. (J-R) TH (J,M,P), acetylated α-tubulin (K,N,Q) and overlap panels (L,O,R) in Dab1-/- midbrains. Selected region is comparable to the one shown in controls (n = 3, across 2 litters). Control Embryo #1, Dab1-/- Embryo #3 is also shown in Figure 9—figure supplement 2. No obvious phenotype could be identified based on this analysis. (S,T) Acetylated α-tubulin in the cortex for comparison.
Author response image 3

EB3 in control and Dab1-/- E13.5 brains.
(A-I) TH (A,D,G) EB3 (B,E,H) and overlap (C,F,I) in the developing mDA domain of control embryos (n = 3, from 2 litters). (C,F,I) Overlap of TH and EB3 in controls. (J-R) TH (J,M,P), EB3 (K,N,Q) and overlap panels (L,O,R) in Dab1-/- midbrains. Selected region is comparable to the one shown in controls (n = 3, across 2 litters). Control Embryo #1, Dab1-/- Embryo #3 is also shown in Figure 9—figure supplement 2. No obvious phenotype could be identified based on this analysis. (S,T) EB3 in the cortex for comparison.
Videos
Video 1
Time lapse imaging with two photon excitation of ex vivo embryonic slices of the ventral midbrain.
Time-lapse imaging of control (left) and Dab1-/- (right) organotypic slices with mosaic labelling of SN-mDA neurons reveals aberrant orientation and slower migration of Dab1-/- mDA neurons.
Video 2
SN-mDA neurons display dynamic cell morphology.
3D projection of a transitionary mDA neurons at t = 0 min (360° rotation) followed by MIP frames of the same neuron at subsequent time-points. Migratory spurts only occur in bipolar morphology while cell remains stationary or displays slow migration during multipolar phase.
Video 3
Morphology as detected by YFP mosaic labelling is similar to morphology detected by TH antibody.
Example SN-mDA neuron from fixed, cleared whole-mount embryonic brain of the same age as used in time-lapse experiments (E14.5) shows similar morphology with YFP (green) and TH (magenta) immunostaining.
Tables
Table 1
Morphology of mDA neurons in control and Dab1-/- slices.
| Control | Dab1-/- | ||||||
|---|---|---|---|---|---|---|---|
| Cell type | Morphology | Slice 1 | Slice 2 | Slice 3 | Slice 1 | Slice 2 | Slice 3 |
| Bipolar | 15/27 | 12/26 | 7/17 | 5/16 | 6/15 | 5/18 | |
| Fast | Transitionary | 12/27 | 13/26 | 10/17 | 9/16 | 8/15 | 12/18 |
| Multipolar | 0/27 | 1/26 | 0/17 | 2/16 | 1/15 | 1/18 | |
| Bipolar | 8/16 | 4/10 | 4/14 | 4/13 | 5/19 | 5/8 | |
| Moderate | Transitionary | 7/16 | 6/10 | 10/14 | 9/13 | 14/19 | 3/8 |
| Multipolar | 1/16 | 0/10 | 0/14 | 0/13 | 0/19 | 0/8 | |
| Bipolar | 3/11 | 7/12 | 7/17 | 5/14 | 5/15 | 2/11 | |
| Slow | Transitionary | 2/11 | 1/12 | 3/17 | 5/14 | 5/15 | 5/11 |
| Multipolar | 6/11 | 4/12 | 7/17 | 4/14 | 5/15 | 4/11 |
Key resources table
| Reagent type (species) or resource | Designation | Source or reference | Identifiers | Additional information |
|---|---|---|---|---|
| Genetic reagent (M. musculus) | ShhCreER | PMID: 15315763 | RRID: MGI:J:92504 | Clifford Tabin, Harvard University |
| Genetic reagent (M. musculus) | Slc6a3Cre | PMID: 17227870 | RRID: MGI:3702746 | Nils-Görran Larsson, Max Planck Institute for Biology of Aging, Cologne, Germany |
| Genetic reagent (M. musculus) | Dab1flox | PMID: 21315259 | RRID: MGI:5141401 | generated by Ulrich Müller, Johns Hopkins University, Baltimore, USA; obtained from Amparo Acker-Palmer, University of Frankfurt |
| Genetic reagent (M. musculus) | Dab1-/- | PMID: 21315259, recombined flox allele | RRID: MGI:5141401, recombined flox allele | generated by Ulrich Müller, Johns Hopkins University, Baltimore, USA; obtained from Amparo Acker-Palmer, University of Frankfurt |
| Genetic reagent (M. musculus) | ROSAloxP-STOP-loxP-EYFP | PMID: 11299042 | RRID: MGI:J:80963 | Frank Constantini, Columbia University |
| Antibody | sheep anti-DIG-AP Fab fragments | Roche | RRID:AB_514497 | ISH: 1:5000 |
| Antibody | Goat anti-OTX2 | Neuromics | RRID:AB_2157174 | IHC: 1:5000 |
| Antibody | goat anti-Reelin | R and D systems | RRID:AB_2253745 | IHC: 1:50 |
| Antibody | mouse anti-α-Tubulin | Merck | RRID:AB_477579 | IHC: 1:500 |
| Antibody | mouse anti-α-Tubulin, acetylated | Merck | RRID:AB_477585 | IHC: 1:500 |
| Antibody | mouse anti-TH | Merck | RRID:AB_2201528 | IHC: 1:500 |
| Antibody | rabbit anti-Calbindin | Swant | RRID:AB_2314067 | IHC: 1:5000 |
| Antibody | rabbit anti-CDH2 | Abcam | RRID:AB_444317 | WB: 1:500 |
| Antibody | rabbit anti-DAB1 | Dr. Brian Howell | Howell et al., 1997 | IHC: 1:5000 (used with TSA kit) |
| Antibody | rabbit anti-EB3 | Abcam | RRID:AB_880026 | IHC: 1:250 |
| Antibody | rabbit anti-GIRK2 | Alamone Labs | RRID:AB_2040115 | IHC: 1:400 |
| Antibody | rabbit anti-GFP | Thermo Fischer | RRID:AB_221569 | IHC:1:400 |
| Antibody | rabbit anti-SOX6 | Abcam | RRID:AB_1143033 | IHC: 1:500 |
| Antibody | rabbit anti-TH | Merck | RRID:AB_390204 | IHC: 1:500 |
| Antibody | rat anti-GFP | Nalacai | RRID:AB_10013361 | IHC: 1:1500 |
| Antibody | rabbit anti-Cofilin1 | Kindly provided by Prof. Dr. Walter Wittke | WB: 1:5000 | |
| Antibody | rabbit anti-p-Cofilin1 (ser3) (77G2) | Cell signaling | RRID:AB_2080597 | WB: 1:1000 |
| Antibody | rabbit anti-p-LIMK1 (Thr508)/LIMK2 (thr505) | Cell signaling | RRID:AB_2136943 | WB: 1:500 |
| Antibody | rabbit anti-LIMK1 | Cell signaling | RRID:AB_2281332 | WB: 1:100 |
| Antibody | anti rabbit-HRP-linked | Cell signaling | RRID:AB_2099233 | WB: 1:1000 |
| Antibody | donkey anti- rabbit Alexa 488 | Thermo Fischer | RRID:AB_2535792 | IHC: 1:500 |
| Antibody | donkey anti- rabbit Alexa 350 | Thermo Fischer | RRID:AB_2534015 | IHC: 1:500 |
| Antibody | donkey anti-mouse Alexa 488 | Thermo Fischer | RRID:AB_141607 | IHC: 1:500 |
| Antibody | donkey anti-rat Alexa 488 | Thermo Fischer | RRID:AB_2535794 | IHC: 1:500 |
| Antibody | donkey anti-goat Alexa 488 | Jackson ImmunoResearch | RRID:AB_2336933 | IHC: 1:500 |
| Antibody | donkey anti-rabbit Cy3 | Jackson ImmunoResearch | RRID:AB_2307443 | IHC: 1:200 |
| Antibody | donkey anti-mouse Cy3 | Jackson ImmunoResearch | RRID:AB_2340813 | IHC: 1:200 |
| Antibody | donkey anti- goat Cy3 | Jackson ImmunoResearch | RRID:AB_2307351 | IHC: 1:200 |
| Antibody | donkey anti-rabbit Biotin | Jackson ImmunoResearch | RRID:AB_2340593 | IHC: 1:200 |
| Recombinant DNA reagent | in situ mRNA probe: Reln | pCRII-Topo vector, 0.64 kb(cDNA) RELN inserted fragment | Joachim Herz, UT Southwestern, Dallas, USA | |
| Recombinant DNA reagent | in situ mRNA probe: Lmo3 | pCMV-SPORT6 vector,3 kb(partial cDNA) inserted fragment | Image clone: 4913098; accession #BC034128 | Source Bioscience, Berlin, DE |
| Commercial assay or kit | TSA Plus fluorescence kit | Perkin Elmer | NEL744001KT | |
| Chemical compound, drug | Tamoxifen | Merck | T5648 | |
| Software, algorithm | Quantity One | BioRAD | Gel documentation | |
| Software, algorithm | Zen Blue 2012 | Carl Zeiss | Image acquisition | |
| Software, algorithm | Zen Black 2012 | Carl Zeiss | Image acquisition | |
| Software, algorithm | Leica Application Suite X 4.13 | Leica microsystems | Image acquisition | |
| Software, algorithm | Fiji/ImageJ 1.51 n | Wayne Rasband. National Institutes of Health | Image processing | |
| Software, algorithm | Adobe Photoshop CS3 | Adobe Systems | Image processing | |
| Software, algorithm | Imaris 8.3.1 | Bitplane | Image processing | |
| Software, algorithm | MatLab R2017b | MathWorks | Image processing and data analysis | |
| Software, algorithm | Affinity Designer 1.5.5 | Serif | Image editing | |
| Software, algorithm | Image Lab 6.0 | BioRAD | Immunoblot quantification and analysis | |
| Software, algorithm | GraphPad Prism 7.0 | GraphPad Software | Statistical analysis |
Additional files
-
Source code 1
Tracking_data_analysis.
- https://cdn.elifesciences.org/articles/41623/elife-41623-code1-v2.zip
-
Transparent reporting form
- https://cdn.elifesciences.org/articles/41623/elife-41623-transrepform-v2.docx
Download links
A two-part list of links to download the article, or parts of the article, in various formats.
Downloads (link to download the article as PDF)
Open citations (links to open the citations from this article in various online reference manager services)
Cite this article (links to download the citations from this article in formats compatible with various reference manager tools)
Correct setup of the substantia nigra requires Reelin-mediated fast, laterally-directed migration of dopaminergic neurons
eLife 8:e41623.
https://doi.org/10.7554/eLife.41623


