IFNγ induces epigenetic programming of human T-bethi B cells and promotes TLR7/8 and IL-21 induced differentiation
- The University of Alabama at Birmingham, United States
- Emory University, United States
- University of Rochester School of Medicine and Dentistry, United States
Figures
Figure 1 with 2 supplements
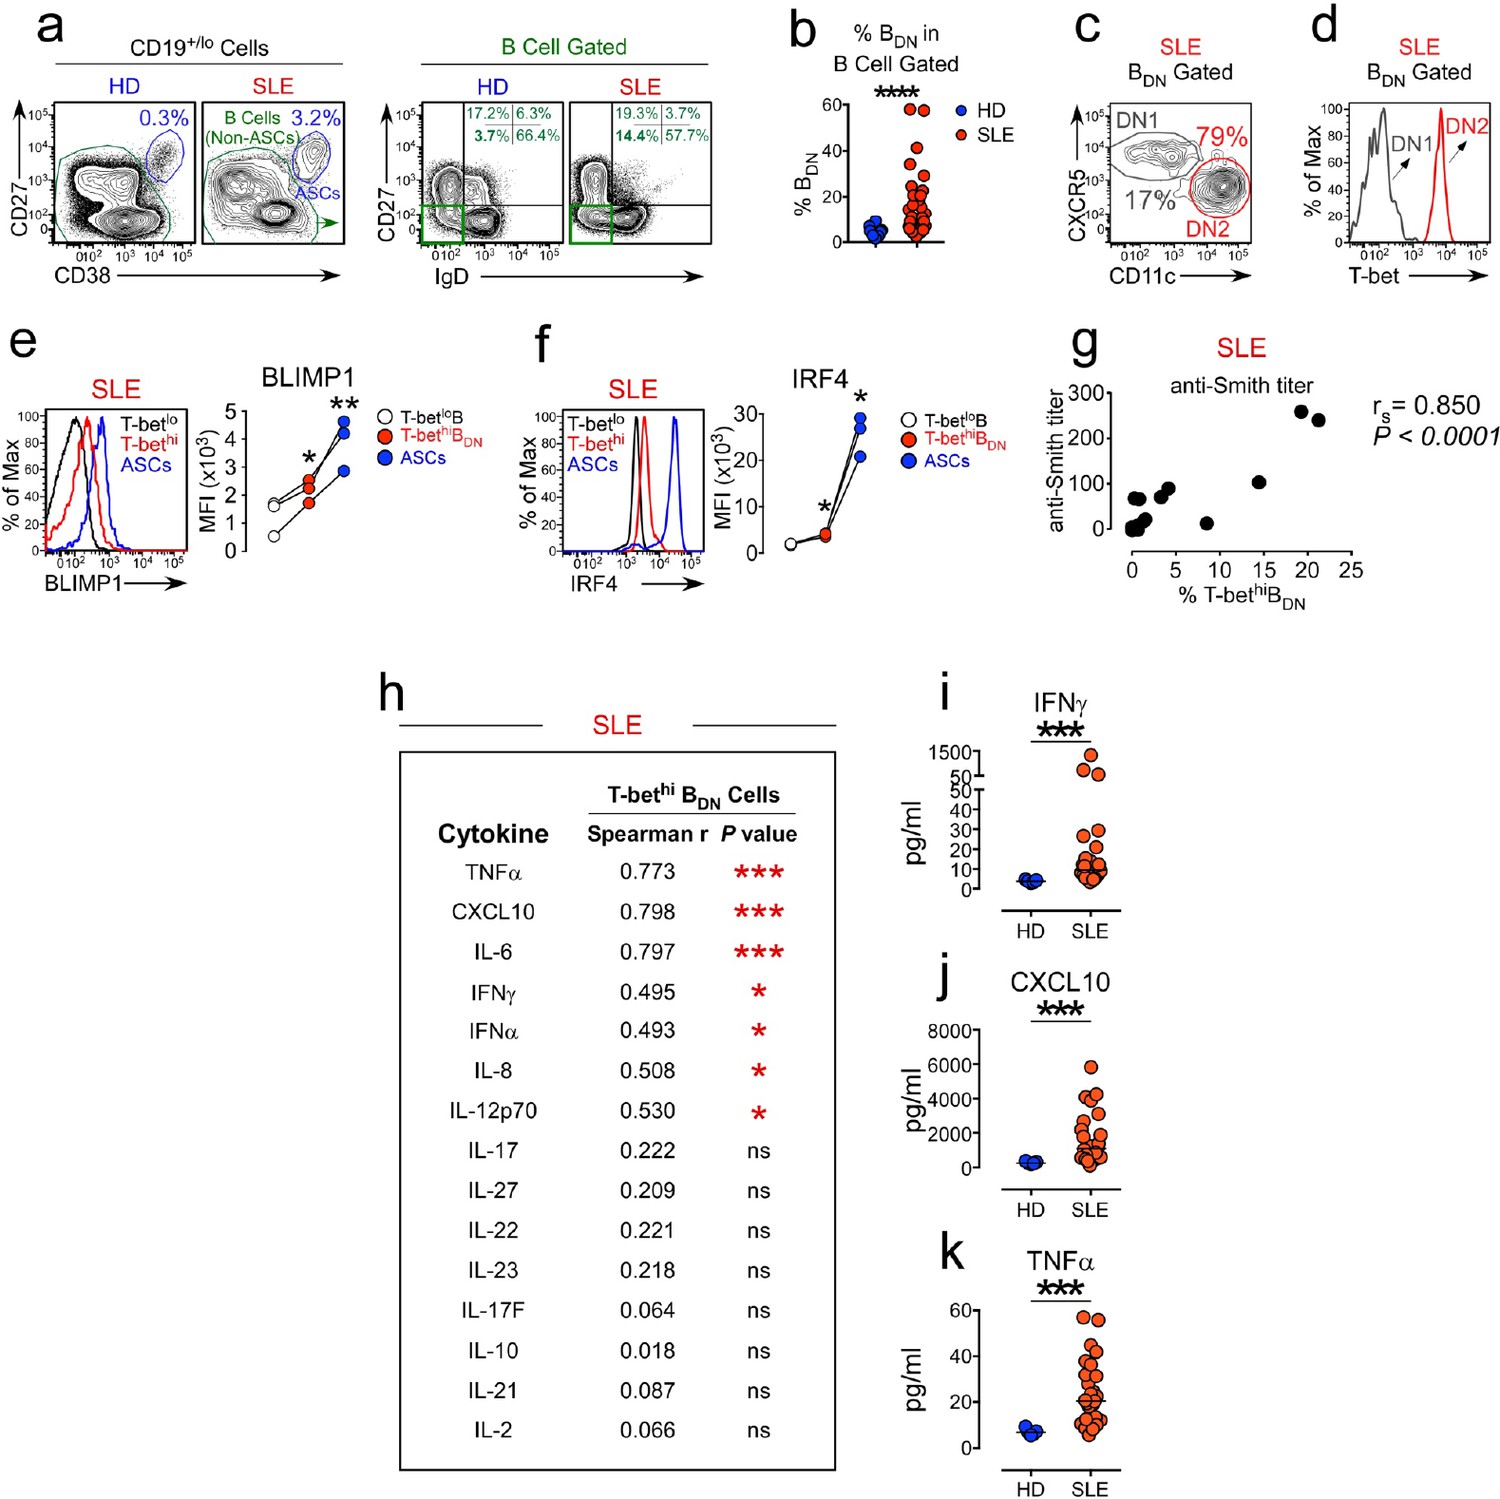
Expansion of the T-bethi DN2 subset in SLE patients correlates with systemic inflammatory cytokine levels.
(a–f) Characterization of T-bethi B cells in peripheral blood B cell subsets from healthy donor (HD) and SLE patients. Gating strategy to identify CD38hiCD27+ ASCs, B cells (non-ASCs) (a, left) and double negative IgDnegCD27neg (BDN) cells (a, right) from the peripheral blood of HD and SLE patients. Frequency of BDN cells (b) within the total B cells. Subdivision of the SLE BDN population into CXCR5+CD11clo DN1 and T-bethi CXCR5negCD11chi DN2 populations (c) with T-bet expression levels (d) in each subset shown as a histogram. Expression of BLIMP1 (e) and IRF4 (f) by ASCs, T-bethi BDN cells and T-betlo B cells from SLE patients. Representative flow plots and mean fluorescence intensity (MFI) expression of BLIMP1 and IRF4 in each population are shown. (g) Correlation analysis between frequency of circulating T-bethi BDN cells and anti-Smith autoAb titers in SLE patients. (h–k) Correlation (h) between plasma cytokine levels and frequency of T-bethi BDN cells in SLE patient peripheral blood. Plasma concentration of IFNγ (i), CXCL10 (j) and TNFα (k) in HD (blue symbols) and SLE patients (red symbols). See Figure 1—figure supplement 1 for analysis of T-bet expressing B cells in the Yaa.Fcgr2b-/- SLE mouse model. See Figure 1—figure supplement 2a for additional phenotypic characterization of T-bethi B cells in SLE patients. See Figure 1—figure supplement 2b for gating strategy to identify T-bethi BDN cells (DN2 cells) in SLE patients. Individual human subjects in each analysis are represented by a symbol. Horizontal black lines represent the median (b,i–k) within the group. Data shown from n = 20 HD and 40 SLE patients (b), representative flow plots from 16 SLE patients (c–d), 3 SLE patients (e–f), 16–18 SLE patients (g–h) or 5 HD and 26 SLE patients (i–k). Statistical analyses were performed using a non-parametric Mann-Whitney test (b,i–k), a one-way paired T test (e–f) or Spearman Correlation test (g–h). Correlation P and r values listed in the figure. P values *≤0.05, **<0.01, ***<0.001.
Figure 1—figure supplement 1
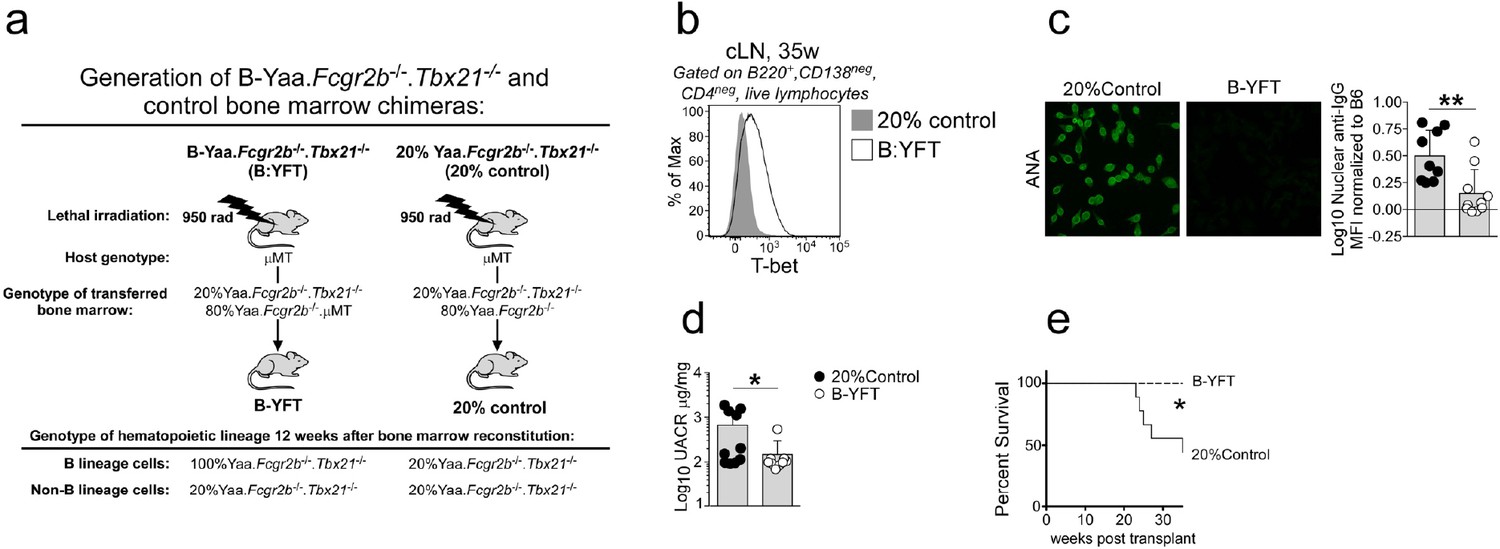
Development of SLE in TLR7-overexpressing mice requires T-bet+ B cells.
Cartoon (a) depicting generation of SLE-prone bone marrow (BM) Yaa.Fcgr2b-/- chimeras lacking T-bet in all B lineage cells or in 20% of all hematopoietic cells. To generate Yaa.Fcgr2b-/- mice with selective deletion of T-bet in B cells (B-YFT chimeras), we reconstituted lethally irradiated B cell deficient μMT mice with a mixture of 80% B cell deficient Yaa.Fcgr2b-/-.μMT BM +20% Yaa.Fcgr2b-/-.Tbx21-/- BM. In these chimeras all hematopoietic cells, including B cells, carry the autoimmune loci (Yaa.Fcgr2b-/-). Furthermore, all B cells (100%) and ~20% of cells in all other hematopoietic cells in these animals will be T-bet deficient (Tbx21-/-). For controls (20%Control chimeras), we reconstituted irradiated μMT hosts with 80% Yaa.Fcgr2b-/- BM +20% Yaa.Fcgr2b-/-.Tbx21-/- BM. In these chimeras all hematopoietic cells, including B cells, will carry the autoimmune loci (Yaa.Fcgr2b-/-). In addition, 20% of all hematopoietic cells, including B cells, will be T-bet deficient. Flow cytometry analysis (b) showing T-bet expression by B cells isolated from the cervical lymph node (cLN) of a representative B-YFT and 20%Control mouse at 35 weeks post-BM reconstitution. (c) Representative images and quantification of anti-nuclear antibodies (ANAs) in serum from chimeras at 24 weeks post-transplant. (d) Kidney function reported as the urinary albumin:creatinine ratio (UACR) in individual chimeras at 24 weeks post-transplant. (e) Mantel-Cox survival curve of chimeras up to 35 weeks post-transplant. Representative data shown as mean ±SD from 1 of 2 independent experiments with 7–10 mice per group. Statistical analyses were performed using a Student’s t test (c–d) and Mantel-Cox survival test (e).
Figure 1—figure supplement 2
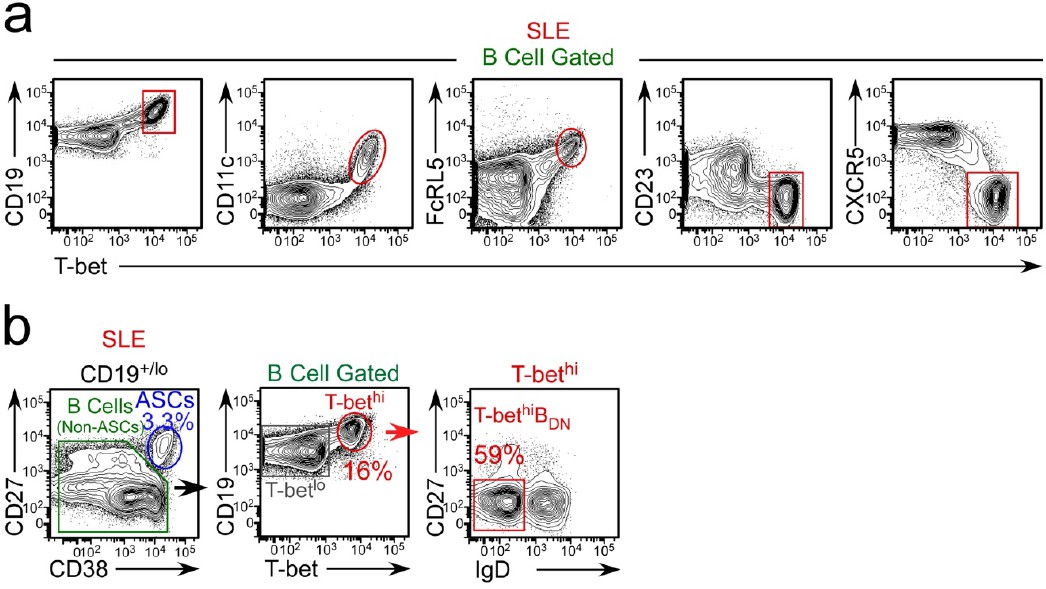
Phenotypic characterization of T-bethi B cells from SLE patients.
(a) Expression of CD19, CD11c, FcRL5, CD23 and CXCR5 by T-bethi B cells from a representative SLE patient. (b) Gating strategy to identify CD38hiCD27+ ASCs, T-bethi BDN cells and T-betlo B cells in a representative SLE patient.
Figure 2 with 3 supplements
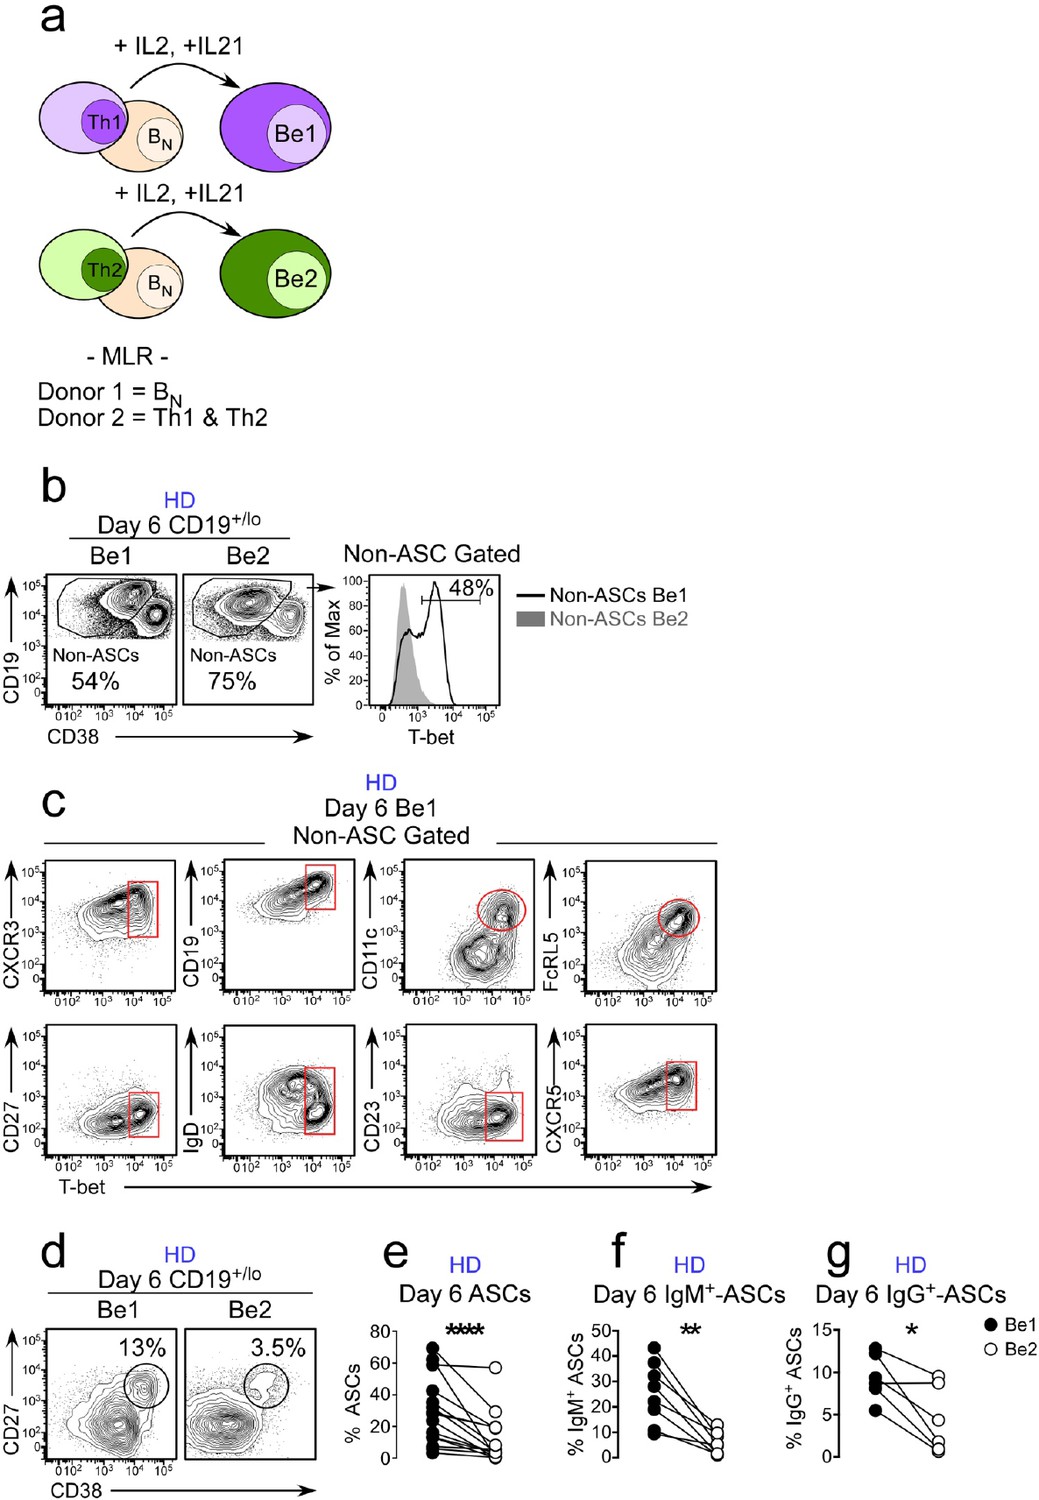
ASC development from BN precursors is enhanced in Th1 containing co-cultures.
Cartoon (a) depicting day 6 paired co-cultures containing Th1 (Be1 co-cultures) or Th2 (Be2 co-cultures) effectors generated from the same HD, BN cells from a second allogeneic HD and exogenous IL-21 and IL-2. Flow cytometric analysis showing T-bet expression (b) on gated HD B cells (non-ASCs) from Be1 and Be2 co-cultures. Phenotyping (c) of day 6 B cell-gated Be1 cells showing T-bet expression in combination with other surface markers. (d–g) ASC development in HD day 6 paired Be1 and Be2 co-cultures showing representative flow plots (d) and frequencies (e) of CD38hiCD27+ ASCs in CD19+/lo-gated B lineage cells. Frequencies of IgM+ (f) or IgG+ (g) ASCs in day 6 paired Be1 and Be2 co-cultures. See Figure 2—figure supplement 1 for BN isolation strategy and characterization of polarized Th1 and Th2 effectors. See Figure 2—figure supplement 2 for gating strategy to identify IgG+ and IgM+ ASCs. See Figure 2—figure supplement 3 for proliferation analysis of B cells in paired day 6 HD Be1 and Be2 co-cultures. Analyses in (b–c) are from representative co-cultures (n > 30). Experiments (e–g) performed on 15 (e), 8 (f) or 6 (g) independent paired Be1 and Be2 co-cultures. Statistical analyses were performed using a non-parametric Wilcoxon paired t test (e) or paired Student’s t test (f–g). P values *<0.05, **<0.01, ****<0.0001.
Figure 2—figure supplement 1
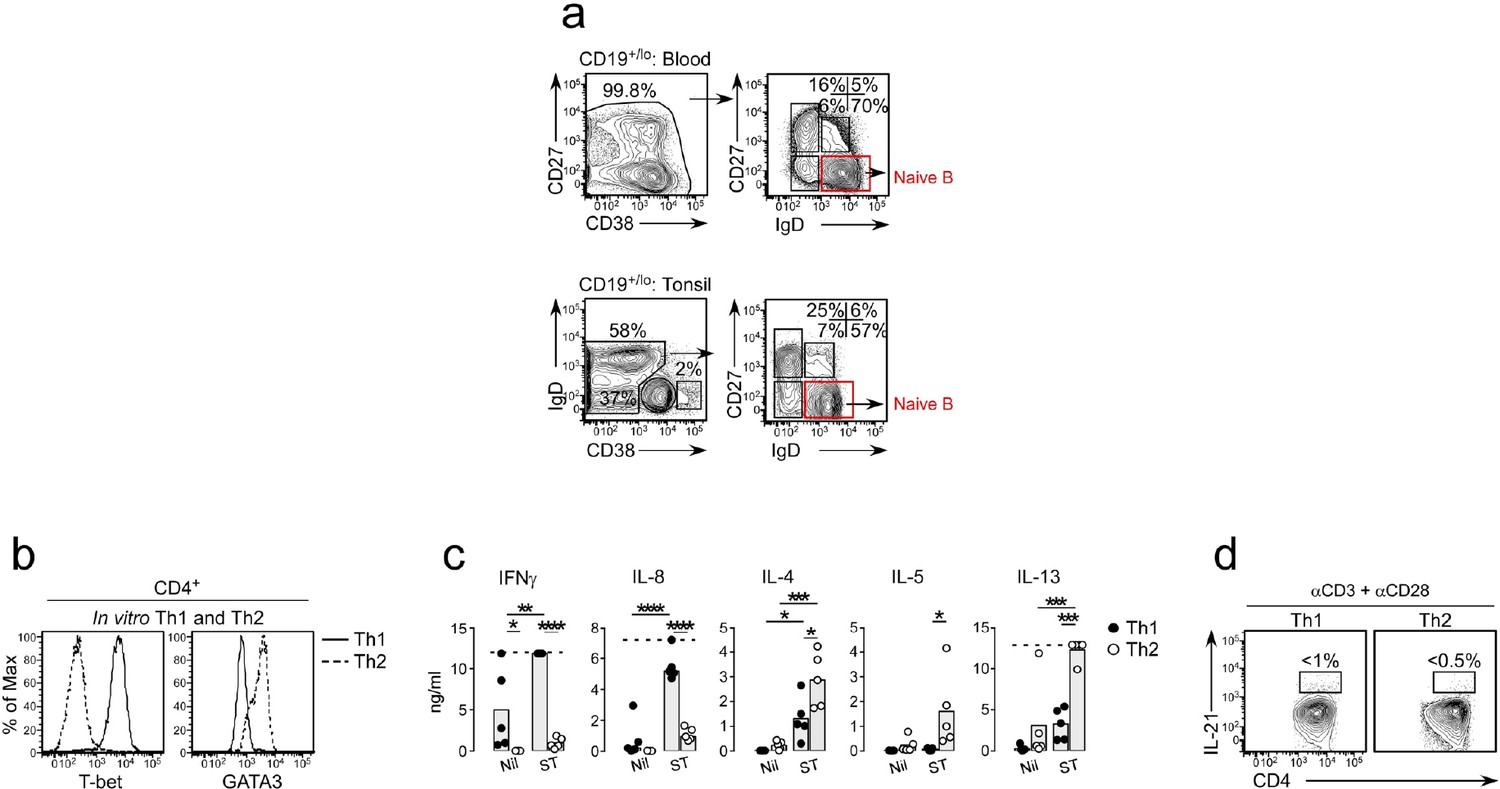
Identification of BN cells and characterization of in vitro generated Th1 and Th2 effectors.
(a) Purification strategy for BN cells (red gate) from tonsil and blood used in cultures. (b–d) Characterization of in vitro polarized Th1 and Th2 cells showing T-bet and GATA-3 expression (b) in Th1 (solid line) and Th2 (dotted line) cells restimulated for 6 hr with plate-bound anti-CD3 and anti-CD28. Cytokine levels (c) in supernatants from restimulated (ST) or non-restimulated (nil) Th1 (black circles) and Th2 cells (open circles) from 5 independent experiments with the gray bars representing the mean of all experiments. Dotted line indicates maximal measurable levels of the cytokine in the assay. IL-21 production (d) by restimulated Th1 and Th2 cells. Statistical analyses (c) were performed using one-way ANOVA with Tukey’s multiple comparison test. P values *<0.05, **<0.01, ***, <0.001 and ****<0.0001.
Figure 2—figure supplement 2
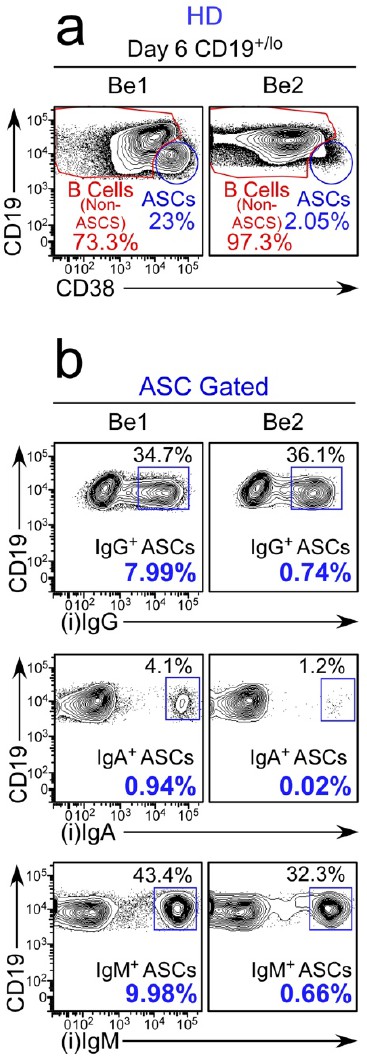
Characterization of ASCs generated in Be1 and Be2 co-cultures.
Gating strategy to identify unswitched and isotype switched ASCs in Be1 and Be2 co-cultures. Representative flow plots showing intracellular IgM, IgA and IgG staining (b) on ASC-gated cells (from panel a) in paired Be1 and Be2 co-cultures. Data are reported as the frequency of intracellular IgM, IgG or IgA expressing CD19loCD38hi ASCs within either the total CD19+/lo B lineage compartment (black font) or within the total ASCs (bold blue font).
Figure 2—figure supplement 3
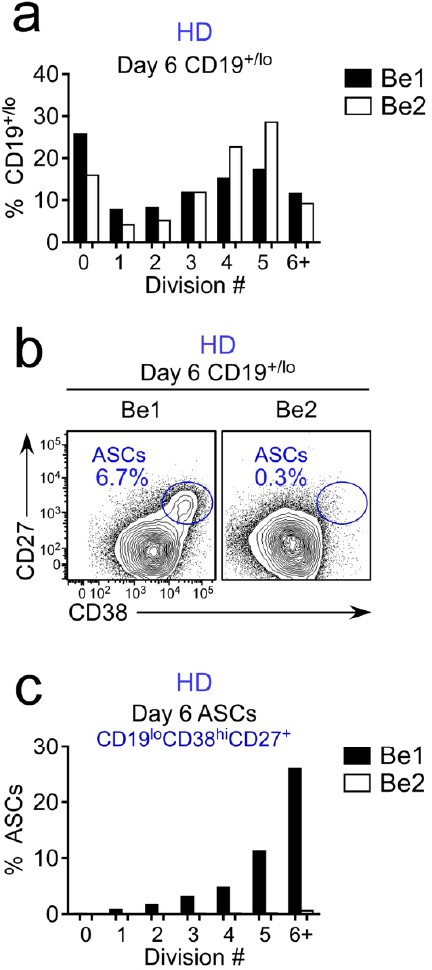
Proliferation analysis of B cells in paired day 6 HD Be1 and Be2 co-cultures.
Co-cultures generated with purified Cell Trace Violet (CTV)-labeled HD BN cells and allogeneic Th1 or Th2 cells + IL-21 and IL-2. B lineage cells in day 6 gated as CD19+/lo (includes both ASCs and non-ASC B cells). Data reported as the proportion of total CD19+/lo B lineage cells (a) in each cell division or the fraction of cells within each cell division that are identified as CD38hiCD27+ ASCs (b–c). Data are representative of >5 experiments using independent co-cultures.
Figure 3 with 1 supplement
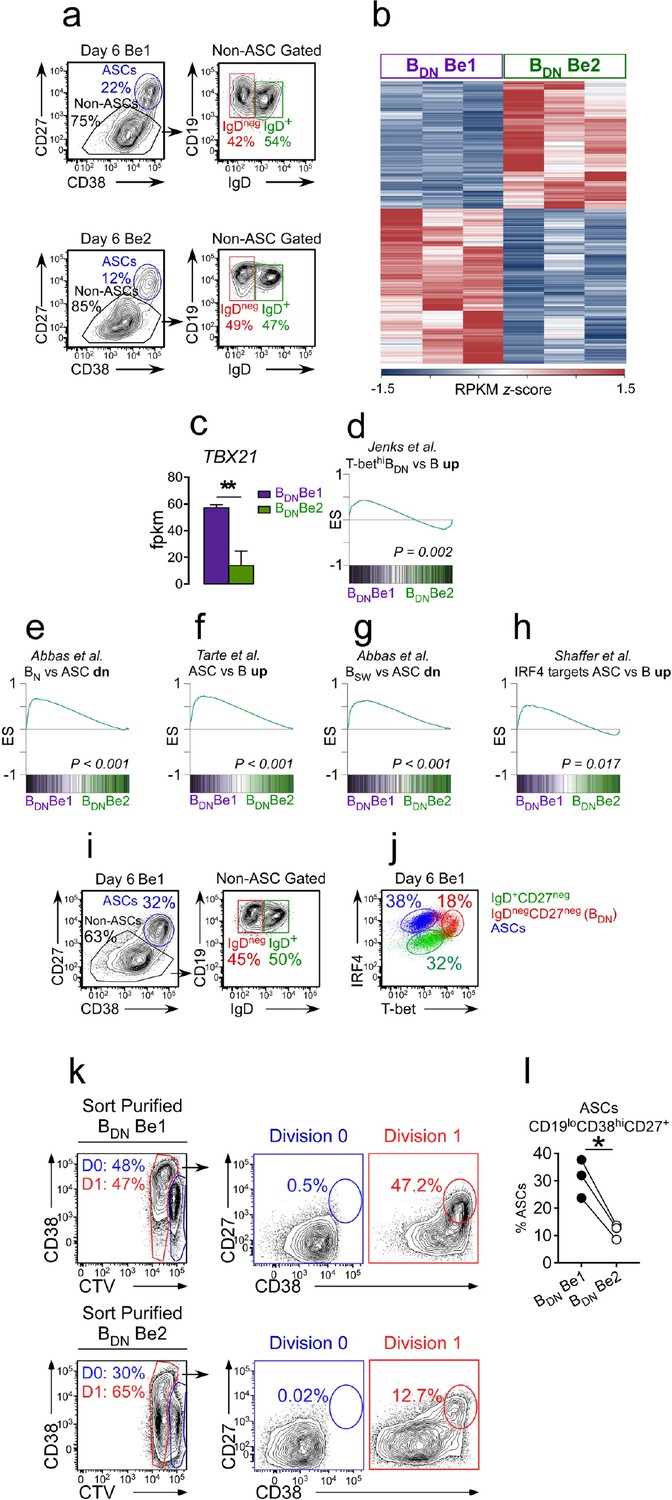
Th1-induced T-bethi BDN cells are pre-ASCs.
(a–h) Transcriptome analysis of in vitro generated IgDnegCD27neg BDN cells from Be1 and Be2 co-cultures. RNA-seq analysis performed on IgDnegCD27neg BDN cells (gating in panel a) that were sort-purified from day 6 HD Be1 and Be2 co-cultures. Heat map (b), showing 427 differentially expressed genes (DEGs) based on FDR < 0.05. T-bet mRNA expression levels (c) in BDN cells from day 6 Be1 and Be2 co-cultures. Gene Set Enrichment Analysis (GSEA, panels d-h) comparing transcriptome profile of in vitro generated BDN cells from Be1 and Be2 co-cultures with published DEGs identified in different B cell subsets. Data are reported as Enrichment Score (ES) plotted against the ranked BDN Be1 and Be2 gene list (n = 11598). DEG lists used for GSEA include: DEGs that are upregulated in sort-purified SLE patient-derived T-bethi DN2 cells (CD19hiIgDnegCD27negCXCR5negIgG+) compared to other SLE patient-derived mature B cell subsets (d, Jenks et al., 2018); DEGs that are upregulated in human plasma cells (ASCs) relative to: BN cells (e, Abbas et al., 2005), total B cells (f, Tarte et al., 2003) or switched memory (BSW) B cells (g, Abbas et al., 2005); and IRF4-dependent upregulated target genes in ASCs (h, Shaffer et al., 2008). (i–j) IgDnegCD27neg T-bethi BDN cells express intermediate levels of IRF4. Gating strategy (i) to identify CD38hiCD27+ ASCs, IgD+CD27neg B cells and IgDnegCD27neg BDN cells in day 6 Be1 co-cultures generated from HD BN cells. Expression of T-bet and IRF4 (j) by ASCs (blue), IgD+CD27neg B cells (green) and IgDnegCD27neg BDN cells (red) from day 6 Be1 co-cultures. (k–l) BDN Be1 cells rapidly differentiate into ASCs. BDN cells from day 6 HD Be1 and Be2 cultures were sort-purified, Cell-Trace Violet (CTV) labeled and incubated 18 hr in conditioned medium. Enumeration of ASCs (CD19loCD38hiCD27+) in the undivided cells (D0, ) and the cells that divided one time (D1, ). Representative flow plots (k) showing the frequency of cells in D0 or D1 in each culture and the frequency of CD19loCD38hiCD27+ ASCs present in the D0 or D1 fraction. Panel (l) reports frequency of ASCs within the cultures from 3 independent experiments. See Supplementary file 1 for BDN Be1 and Be2 RNA-seq data set and Supplementary file 2 for SLE patient-derived T-bethi BDN DEG list. See Figure 3—figure supplement 1 for proliferation profile of the T-bethiIRF4int BDN subset in Be1 cells. RNA-seq performed with 3 samples/subset derived from 3 independent paired co-culture experiments. Statistical analysis performed with unpaired (c) or paired (l) Students t test. Nominal P values (d–h) for GSEA are shown. P values *<0.05, **<0.01.
Figure 3—figure supplement 1
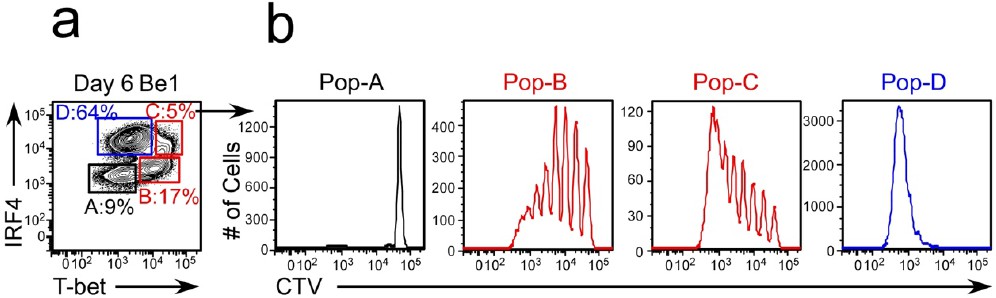
Comparison of the proliferative profile of T-bethiIRF4int pre-ASCs and T-betloIRF4hi ASCs.
Proliferation profile of B cell subsets from day 6 co-cultures generated with purified CTV-labeled HD BN cells and allogeneic Th1 or Th2 cells + IL-21 and IL-2. T-betloIRF4neg (Pop-A, IgD+CD27neg, BN cells), T-bethiIRF4lo/int (Pop-B, IgDnegCD27neg BDN cells), T-bethiIRF4int/hi (Pop-C, IgDnegCD27neg BDN cells) and T-betloIRF4hi (Pop-D, IgDnegCD27hi ASCs) subsets are shown.
Figure 4 with 1 supplement
IFNγ is required for development of T-bethi BDN cells and regulates ASC formation and recovery.
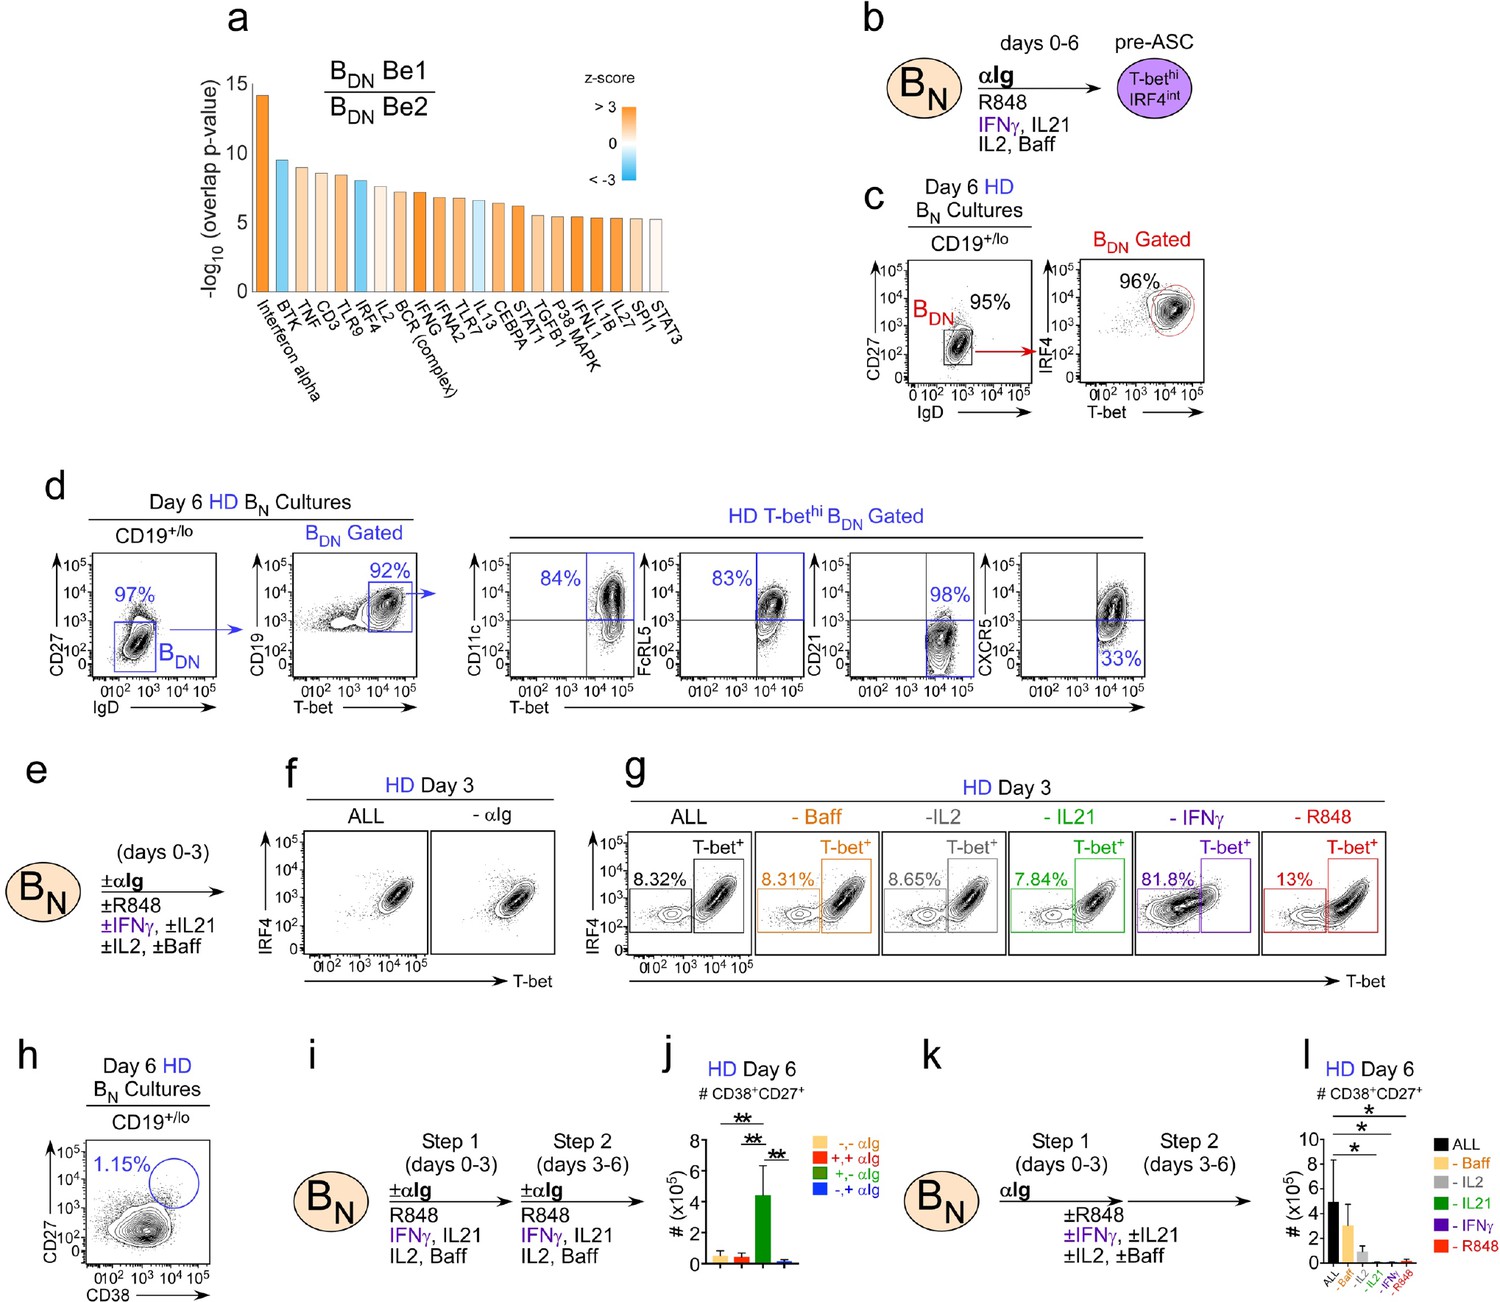
(a) Ingenuity Pathway Analysis (IPA) to identify predicted upstream direct and indirect regulators of the HD BDN Be1 transcriptome. IPA performed using the 427 DEG (BDN Be1 over BDN Be2; FDR < 0.05) identified in the RNA-seq analysis described in Figure 3b. The predicted activation state (z-score of BDN Be1 over BDN Be2) of each regulator/signaling pathway is shown as bar color (orange, activated; blue, inhibited) with predicted upstream regulators sorted in order of significance (overlap P value). Regulators with an overlap P-value<0.00001 are shown. (b–d) IPA-identified stimuli induce development of T-bethiIRF4int BDN pre-ASC-like cells from HD BN cells. Cartoon (b) depicting in vitro stimulation conditions to activate purified HD BN cells with cytokines (IL-2, BAFF, IL-21, IFNγ), anti-Ig and R848 for 6 days. Phenotypic characterization of day 6 activated cells showing expression of IRF4 and T-bet (c) and other markers (d) on the IgDnegCD27neg BDN subset. (e–h) Cartoon (e) depicting HD BN cells activated with anti-Ig +cytokine cocktail (IFNγ, IL-2, IL-21, BAFF) and R848 (ALL) or activated with individual stimuli (as indicated) removed from the cultures. Representative flow plots showing T-bet and IRF4 expression (f–g) by day 3 B cells in each culture. Enumeration of CD38hiCD27+ ASCs (h) in day 6 ‘ALL’ cultures. (i–j) Transient BCR activation is required for ASC development. Cartoon (i) depicting activation of HD BN cells for 3 days with R848, cytokines (IFNγ, IL-2, IL-21, BAFF) ±anti-Ig (Step 1). Cells were then washed and recultured for an additional 3 days with the same stimuli ± anti-Ig (Step 2). Enumeration of CD38hiCD27+ ASCs (j) on day 6 in cultures that were not exposed to anti-Ig during Steps 1 and 2 (-,-); were exposed to anti-Ig throughout Steps 1 and 2 (+,+); were exposed to anti-Ig only in Step 1 (+,-); or were exposed to anti-Ig only in Step 2 (-,+). (k–l) IFNγ, R848 and IL-21 are required for ASC development. Cartoon (k) showing HD BN cells activated with anti-Ig + cytokine cocktail (IFNγ, IL-2, IL-21, BAFF) and R848 for 3 days (Step 1) and then cultured for an additional 3 days (Step 2) with cytokine cocktail and R848. Alternatively, individual stimuli (as indicated) were excluded from the cultures for all 6 days. Enumeration of day 6 CD38hiCD27+ ASCs (l). See Figure 4—figure supplement 1 for % ASCs and number of total cells recovered in cultures lacking individual stimuli. RNA-seq IPA analysis was performed on n = 3 samples/subset derived from 3 independent paired co-culture experiments. Data in (c–l) are representative of ≥3 experiments. The recovery of ASCs in (j, l) are shown as the mean ±SD of cultures containing purified BN cells from 3 independent healthy donors. Statistical analyses (j, l) were performed using one-way ANOVA with Tukey’s multiple comparison test. P values *<0.05, **<0.01.
Figure 4—figure supplement 1

IFNγ, R848 and IL-21 play distinct roles in facilitating the development and recovery of ASCs in in vitro cultures.
HD BN cells were activated as described in Figure 4 and analyzed on day 6. Data shown include representative flow panels depicting % CD38hiCD27+ ASCs recovered (a) quantitation of % ASCs recovered across multiple cultures (b) and total cells recovered in the cultures (c). The frequency of ASCs (b) and cell recovery (c) are shown as the mean ±SD of cultures containing purified BN cells from 3 independent healthy donors. Statistical analyses were performed using one-way ANOVA with Tukey’s multiple comparison test. P values *<0.05, **<0.01, ***<0.001, ****<0.0001. The number of total ASCs recovered is shown in Figure 4l.
Figure 5 with 1 supplement

Temporally distinct regulation of T-bethiIRF4int pre-ASC and ASC development by IFNγ, R848 and IL-21.
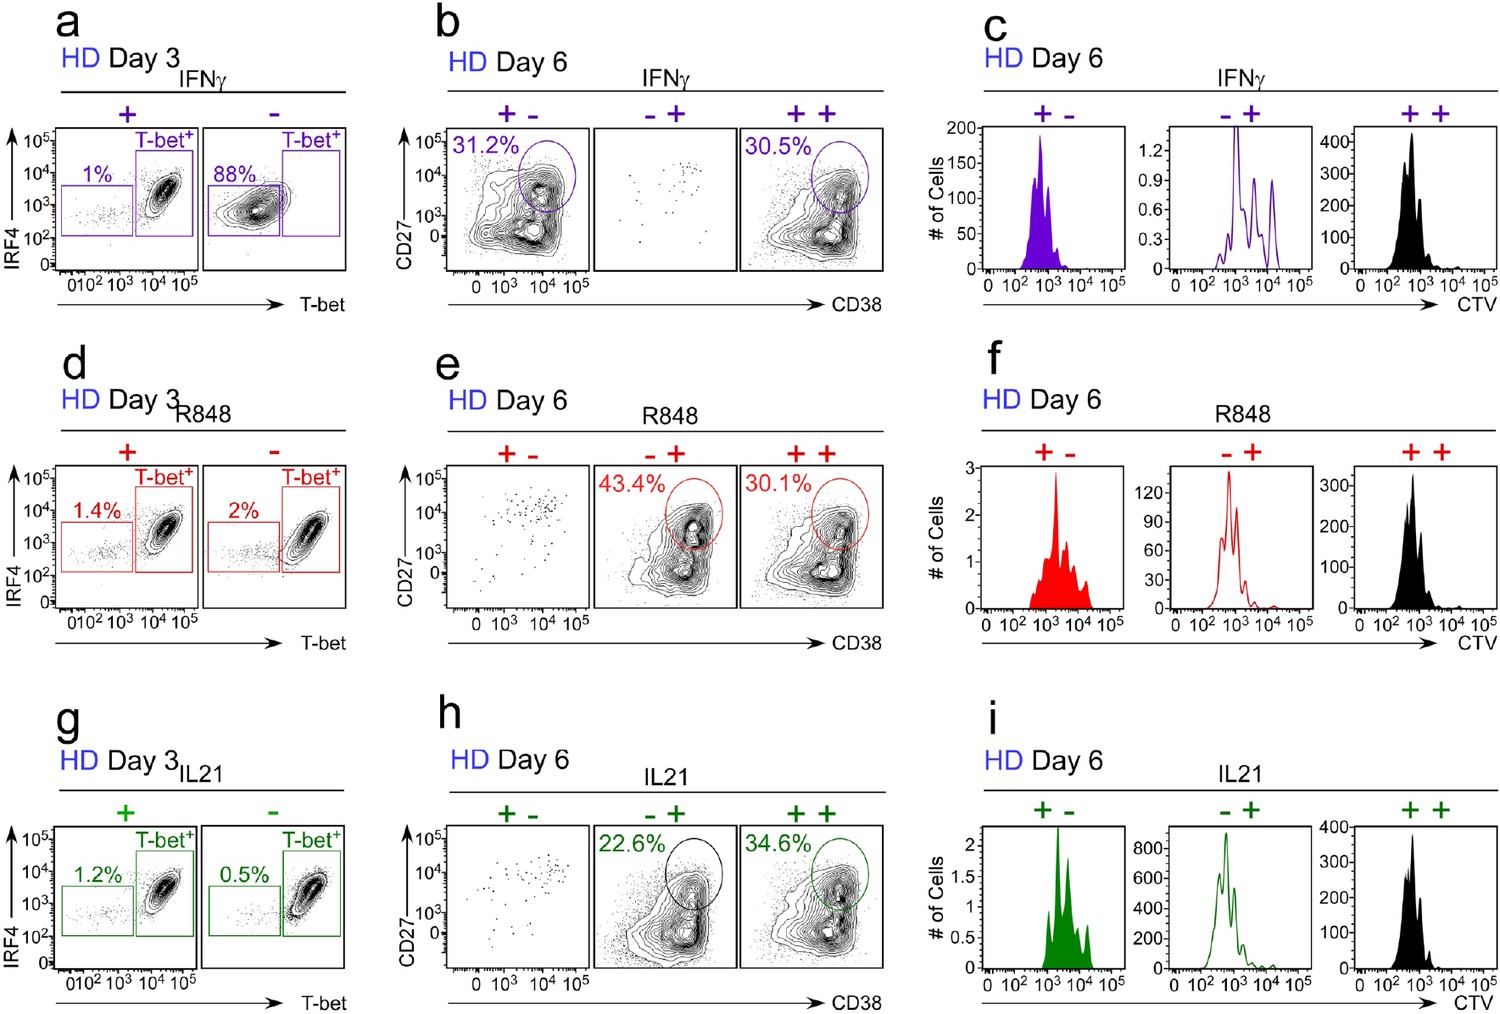
Cartoon (a) depicting stimulation of CTV-labeled HD BN cells for 3 days with anti-Ig, R848, IL-21 and IFNγ (Step 1). Cells were washed and re-cultured for 3 days with R848, IFNγ, and IL-21 (Step 2, +,+ condition) or individual stimuli were included in Step 1 only (+,- condition) or in Step 2 only (-,+ condition). Cells from day 6 cultures containing IFNγ (b–e), R848 (f–i) or IL-21 (j–m) in Step 1, Step 2 or both steps were analyzed to determine ASC frequencies (b, f, j), ASC recovery (c, g, k), cell division (d, h, l) and total cell recovery (e, i, m). Summary of data (n) showing that ASC development and recovery from T-bethiIRF4int BDN pre-ASCs requires early IFNγ, R848 and BCR ‘priming’ signals and late R848 and IL-21 proliferation and differentiation signals. See Figure 5—figure supplement 1 for representative flow cytometry plots from each culture showing T-bethiIRF4int BDN cells on day 3, CD38hiCD27+ ASCs on day 6 and CTV dilution on day 6. Data are representative of ≥3 experiments. The percentage of cells in each division, the frequency of ASCs and cell recovery (total and ASCs) are shown as the mean ±SD of cultures containing purified BN cells from 3 independent healthy donors. All statistical analyses were performed using one-way ANOVA with Tukey’s multiple comparison test. P values *<0.05, **<0.01, ***<0.001, ****<0.0001.
Figure 5—figure supplement 1
Flow cytometric analysis of B cells activated during the early priming or late differentiation phase with IFNγ, R848 or IL-21.
HD BN cells were activated as described in Figure 5a. Representative flow cytometry plots from cultures containing IFNγ (a–c), R848 (d–f) or IL-21 (g–i) are provided and indicate the frequencies of T-bethiIRF4int B cells on day 3 (a, d, g), CD38hiCD27+ ASCs on day 6 (b, e, h) and CTV dilution on day 6 (c, f, i). Quantitation across multiple experiments (n ≥ 3 with independent donors) shown in Figure 5.
Figure 6 with 3 supplements
IFNγ cooperates with R848, IL-2 and IL-21 to promote development and recovery of ASCs.
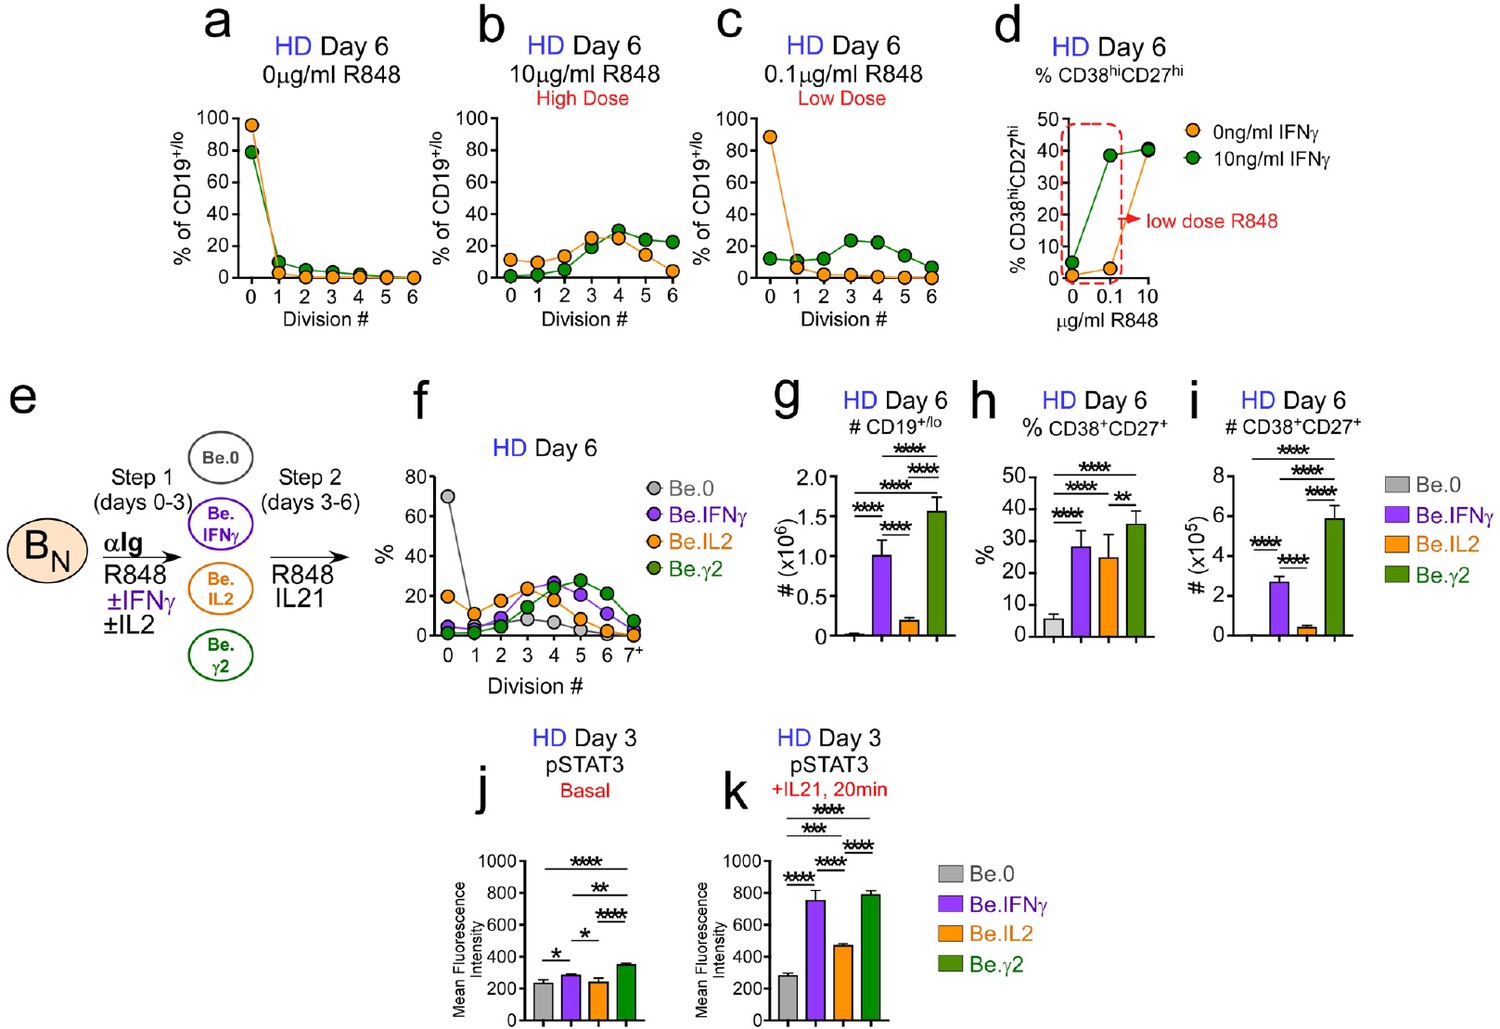
(a–d) IFNγ synergizes with subthreshold amounts of TLR7/8 ligand to induce proliferation and differentiation of BN cells. CTV-labeled HD BN cells were activated for 3 days (Step 1) with anti-Ig, IL-2, and increasing concentrations of R848 (as indicated) in the presence or absence of IFNγ (10 ng/ml). Cells were washed and re-cultured for 3 additional days (Step 2) with IL-21 and the same concentration of R848 that was used in Step 1. B cell division was measured on day 6 in cultures that were activated with IFNγ (green circles) or without IFNγ (orange circles) in the presence of no R848 (0 μg/ml, (a), high dose R848 (10 μg/ml, (b) or low dose R848 (0.1 μg/ml, (c). The frequency of CD38hiCD27+ ASCs (d) on day 6 is shown. (e–i) IFNγ cooperates with IL-2 to promote ASC development and recovery. Cartoon (e) depicting CTV-labeled HD BN cells activated for 3 days (Step 1) with anti-Ig and R848 alone (Be.0); with anti-Ig +R848+IFNγ (Be.IFNγ); with anti-Ig +R848+IL-2 (Be.IL2); or with anti-Ig +R848+IFNγ+IL-2 (Be.γ2). Cells were then washed and recultured for an additional 3 days (Step 2) with R848 and IL-21. The percentage of cells that have undergone cell division (f), the total cell recovery (g), the ASC frequencies (h) and total ASCs recovered (i) from each day 6 culture are shown. (j–k) Early IFNγ signals regulate IL-21R signaling. Phospho-STAT3 (pSTAT3) expression levels (reported as Mean Fluorescence Intensity (MFI)) in day 3 HD Be.0, Be.IFNγ, Be.IL2 and Be.γ2 cells under basal conditions (j) or following 20 min IL-21 stimulation (k). See Figure 6—figure supplement 1 for measurements of ASC formation in cultures containing cross-titrated IFNγ and R848. See Figure 6—figure supplement 2 for representative flow cytometry plots from Be.0, Be.IFNγ, Be.IL2 and Be.γ2 cells showing CD38hiCD27+ ASCs and CTV dilution on day 6. See Figure 6—figure supplement 3 for representative flow cytometry plots showing pSTAT3 expression. Data are representative of ≥3 experiments and are shown as the mean ±SD of cultures containing purified BN cells from 2 to 3 independent healthy donors. All statistical analyses were performed using one-way ANOVA with Tukey’s multiple comparison test. P values *<0.05, **<0.01, ***<0.001, ****<0.0001.
Figure 6—figure supplement 1
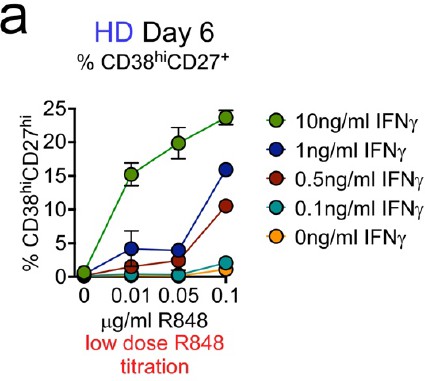
IFNγ signals promote B cell differentiation in response to subthreshold concentrations of R848.
CTV-labeled BN cells were activated for 3 days with anti-Ig, IL-2 and normally non-stimulatory doses of R848 (0–0.1 μg/ml) in combination with different concentrations of IFNγ (0–10 ng/ml). Cells were washed and re-cultured for 3 additional days with IL-21 and the same concentration of R848 used in Step 1. The frequency of ASCs in the indicated cultures on day 6 is reported.
Figure 6—figure supplement 2
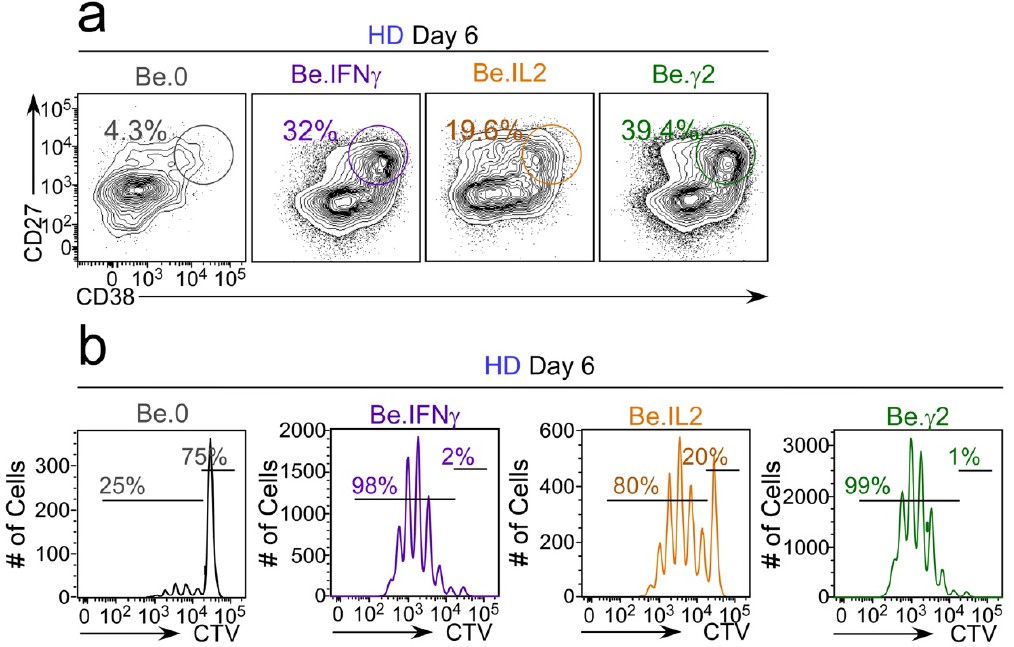
Flow cytometric characterization of B cells activated during the early priming phase in the presence or absence of IFNγ and IL-2.
Day 6 Be.0, Be.IL2, Be.IFNγ and Be.γ2 cells were generated as described in Figure 6e. Representative flow cytometry plots from day 6 Be.0, Be.IFNγ, Be.IL2 and Be.γ2 cultures showing CD38hiCD27+ ASCs (a) and CTV dilution (b).
Figure 6—figure supplement 3
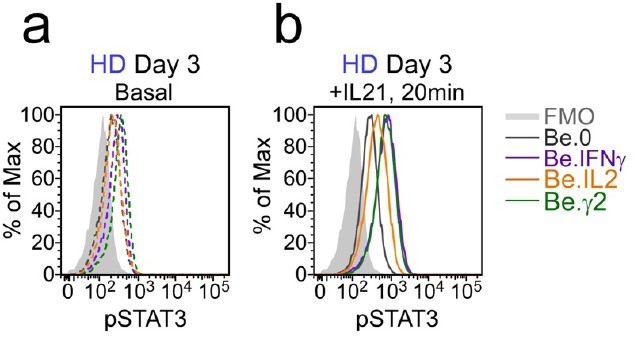
Flow cytometric analysis of phospho-STAT3 levels in day 3 Be.0, Be.IFNγ, Be.IL2 and Be.γ2 cells.
Day 3 Be.0, Be.IL2, Be.IFNγ and Be.γ2 cells were generated as described in Figure 6e. Cells were analyzed directly (basal), (a) or 20 min following exogenous IL-21 exposure (+IL-21), (b) and phospho-STAT3 (pSTAT3) levels were assessed by flow cytometry. Representative flow histograms showing pSTAT3 levels.
Figure 7 with 1 supplement
IFNγ signaling promotes chromatin accessibility and poises B cells to undergo IL-21 dependent differentiation.
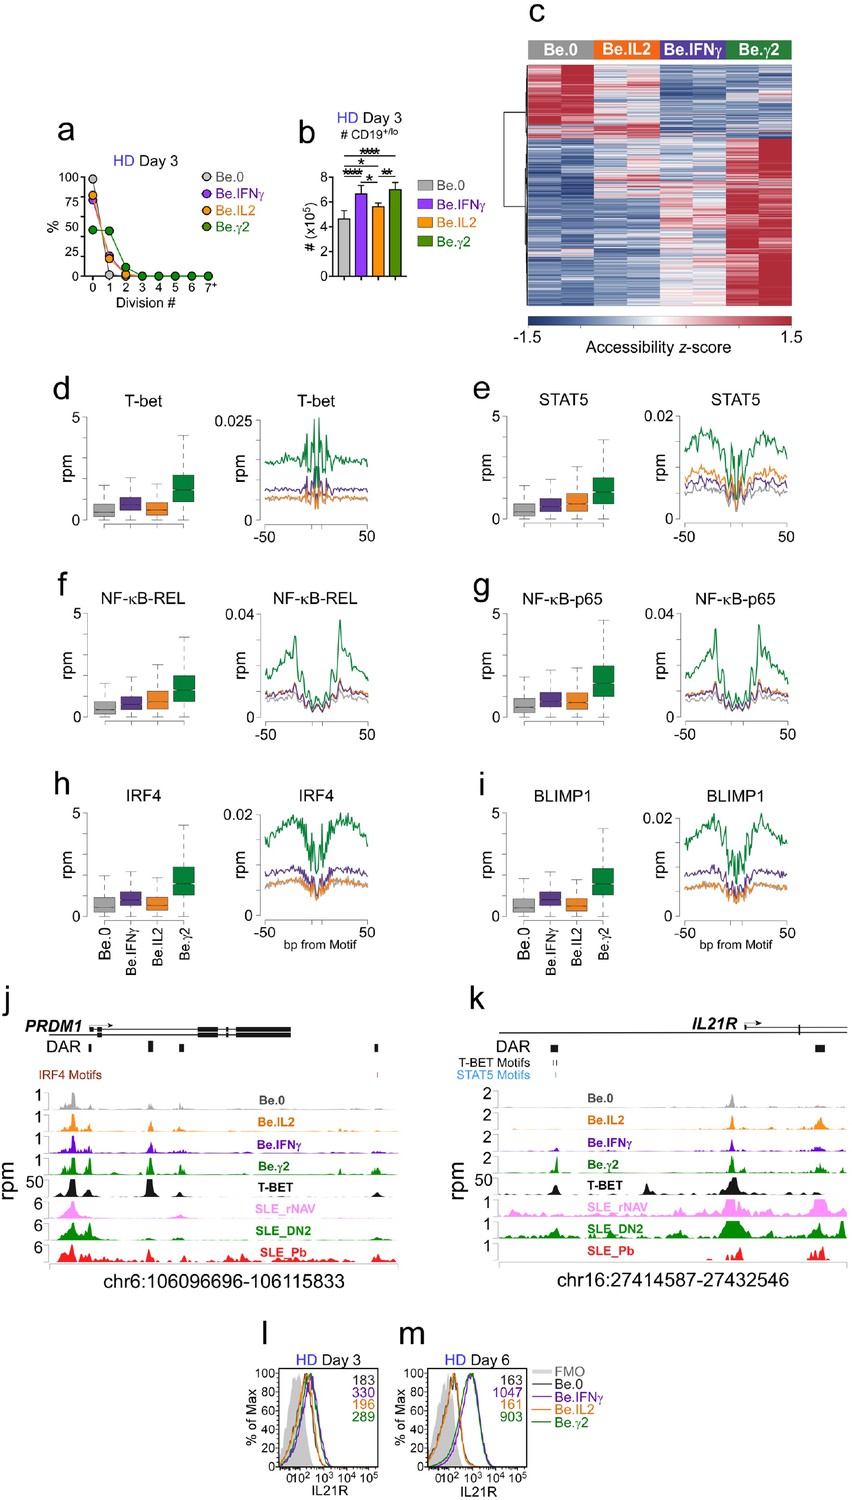
(a–b) Cell division and total cell recovery in day 3 Be.0, Be.IFNγ, Be.IL2 and Be.γ2 cultures generated with HD BN cells. (c–k) Chromatin accessibility analysis using ATAC-seq data from day 3 Be.0, Be.IFNγ, Be.IL2 and Be.γ2 cell. Heatmap (c) showing 15,917 differentially accessible regions (DAR) based on FDR < 0.05. Chromatin accessibility plots and histograms for T-bet (d), STAT5 (e), NF-κB p65 (f), NF-κB REL (g), IRF4 (h) and BLIMP1 (i). Plots report reads per million (rpm) in the 100 bp surrounding the transcription factor binding motifs and histograms show accessibility at the indicated motif and for the indicated surrounding sequence. Genome plots showing chromatin accessibility for the PRMD1 (j) and IL21R (k) loci. DAR are shown and consensus T-bet, IRF4 and STAT5 binding motifs within DAR are indicated. DAR are aligned with previously reported T-bet binding sites in GM12878 cells (assessed by ChIP, ENCODE Project Consortium, 2012) and with ATAC-seq data derived from B cell subsets purified from SLE patients (Jenks et al., 2018). Data reported in rpm. (l–m) Early IFNγ signals control IL-21R expression levels. Representative flow plots showing IL-21R expression in day 3 (l) and day 6 (m) Be.0, Be.IFNγ, Be.IL2 and Be.γ2 cells. See Figure 7—figure supplement 1 for representative flow plots showing cell division profile. See Supplementary file 3 for ATAC-seq data. See Supplementary file 4 for enrichment of TF binding motifs P values. ATAC-seq analysis was performed on 3 independent experimental samples/group over 2 experiments. Flow cytometry plots depicting IL-21R expression are representative of ≥2 experiments. Box plots (d–i) show 1st and 3rd quartile range (box) and upper and lower range (whisker) of 2 samples/group.
Figure 7—figure supplement 1

Flow cytometric analysis of cell division in day 3 Be.0, Be.IFNγ, Be.IL2 and Be.γ2 cells.
Day 3 Be.0, Be.IL2, Be.IFNγ and Be.γ2 cells were generated as described in Figure 6e. Representative flow cytometry plots from day 3 Be.0, Be.IFNγ, Be.IL2 and Be.γ2 cultures showing CTV dilution. Quantitation across multiple experiments (n ≥ 3 with independent donors) shown in Figure 7a-b.
Figure 8 with 1 supplement
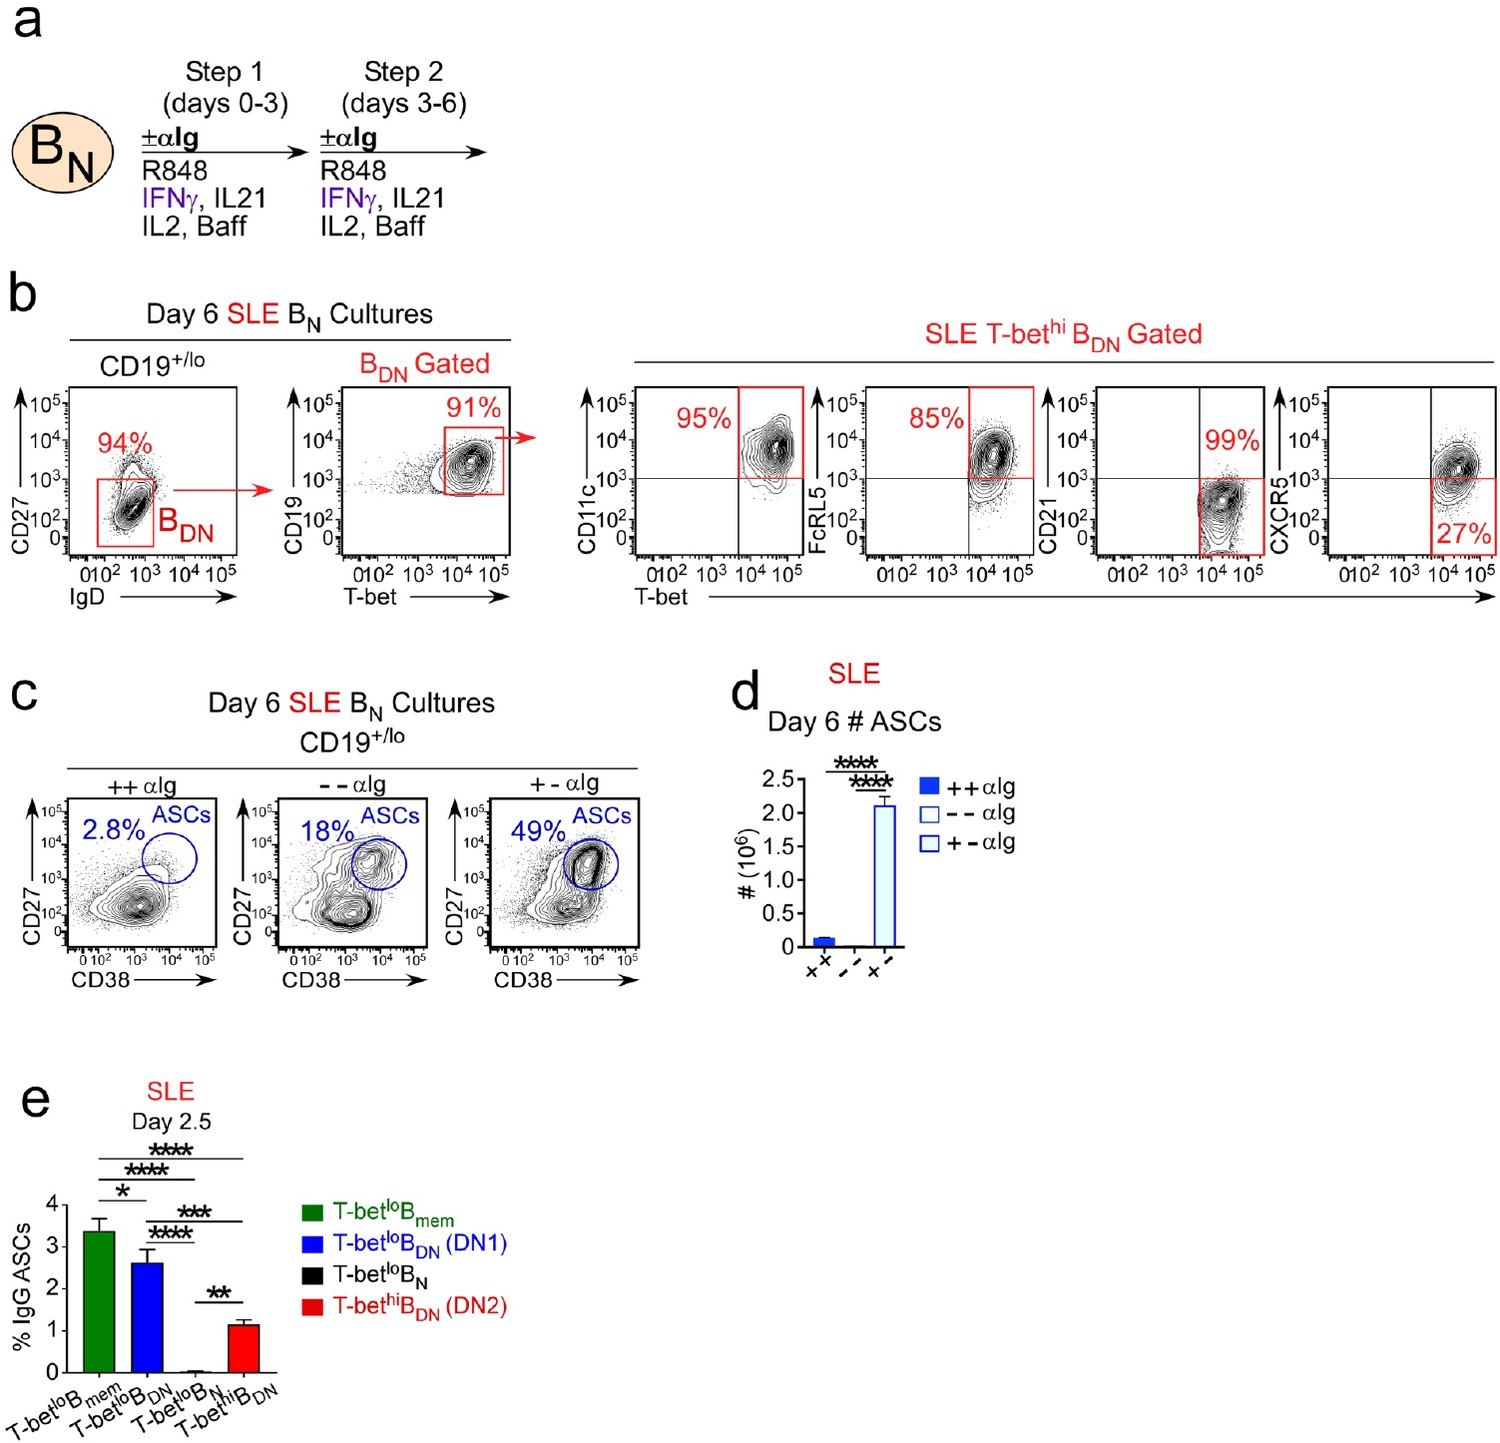
SLE patient T-bethi BDN cells rapidly differentiate in ASCs in the absence of BCR stimulation.
(a–d) ASC generation from SLE BN cells requires early but transient BCR activation. Cartoon (a) depicting in vitro stimulation conditions to activate sort-purified T-betlo BN cells from SLE patients. BN cells were stimulated for 3 days with R848, cytokines (IFNγ, IL-2, IL-21, BAFF) ± anti-Ig (Step 1) and then washed and recultured for an additional 3 days with the same stimuli ± anti-Ig (Step 2). Cells were analyzed by flow cytometry on day 6 (b–d). Phenotypic characterization (b) of IgDnegCD27neg BDN cells in cultures containing anti-Ig for all 6 days showing expression of T-bet, CD11c, FcRL5, CD21 and CXCR5 by the T-bethi BDN subset. The frequency (c) and number (d) of CD38hiCD27+ ASCs in cultures lacking anti-Ig (-,-), containing anti-Ig for all 6 days (+,+) or exposed to anti-Ig for the first 3 days only (+,-). (e) SLE patient T-bethi BDN cells rapidly differentiate in ASCs. Purified SLE B cell subsets (T-betlo BN, T-betlo CD11cnegCXCR5+ CD27negIgDneg DN1 memory cells, T-betlo CD27+ memory B cells (Bmem) and T-bethi CD11c+CXCR5neg DN2 cells) were stimulated with cytokines (IFNγ, IL-21, IL-2, BAFF) and R848 for 2.5 days then counted and transferred to anti-IgG ELISPOT plates for 6 hr. The frequency of IgG ASCs derived from each B cell subset is shown. See Figure 8—figure supplement 1 for gating strategy to purify B cell subsets from SLE patients. Data shown in (c–d) are from a single SLE individual and are representative of 2 independent experiments. Data reported in (e) are representative of 3 independent experiments using B cells sorted from 3 different SLE donors. Statistical analyses were performed using one-way ANOVA with Tukey’s multiple comparison test (d–e). P values *<0.05, **<0.01, ***<0.001, ****<0.0001.
Figure 8—figure supplement 1
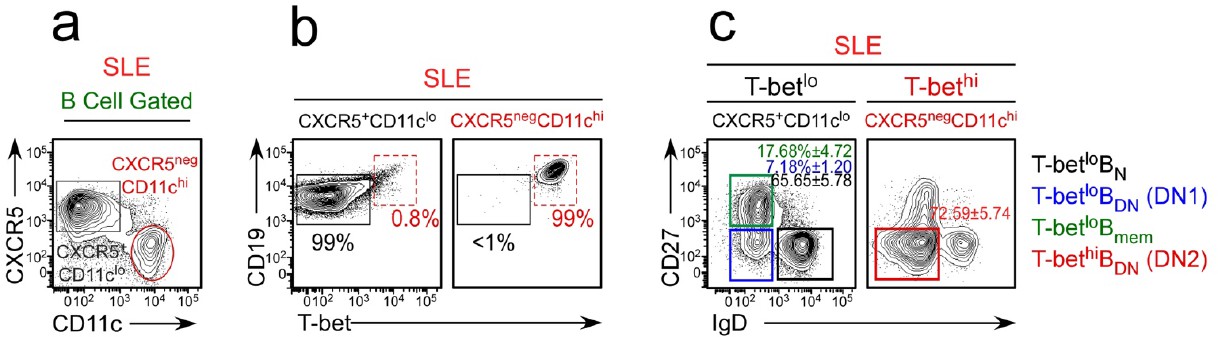
Gating strategy to sort-purify B cell subsets from SLE patients.
Peripheral blood CD19+/lo B lineage cells from SLE patients were subdivided into CD38hiCD27+ ASCs and non-ASC B cells (see Figure 1a). The non-ASC B cells were subdivided (a) into CD11chiCXCR5neg cells (that were highly enriched (99%) in T-bethi B cells (b)) and CD11cloCXCR5+ cells (that were highly enriched in T-betlo/neg cells (b)). The CD11chiCXCR5lo (T-bethi) and CD11cnegCXCR5+ (T-betlo) B cells were then subdivided based on expression of IgD and CD27 (c) and sort-purified as T-betlo BN cells (black gate, CD11cloCXCR5+IgD+CD27neg), T-betlo BDN memory B cells (blue gate, CD11cloCXCR5+IgDnegCD27neg, also referred to as DN1 cells [Jenks et al., 2018]), T-betlo conventional memory B cells (green gate, CD11cloCXCR5+IgDnegCD27+, also referred to as Bmem) and T-bethi BDN cells (red gate, CD11chiCXCR5negIgDnegCD27neg, also referred to as DN2 cells; Jenks et al., 2018).
Author response image 1
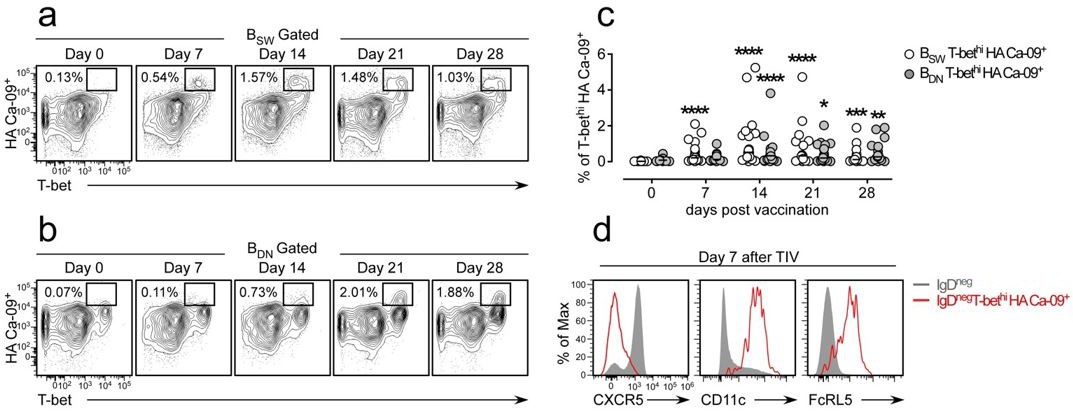
Influenza vaccination induces formation of hemagglutinin (HA)-specific T-bethi B cells.
(a-c) Identification and enumeration of HA-specific T-bethi lgDnegCD27+ (BSW) cells (a) and HA-specific T-bethi lgDnegcD27neg (BDN) cells (b) between 0-28 days following vaccination with 2015-16 Fluzone. Representative flow plots (a-b) from a single individual and quantitation (c) of B cell subsets in 19 vaccinated healthy donors. Data in (c) reported as the frequency of T-bethi HA+ B cells within each subset. Individual subjects are represented by a symbol. Horizontal lines represent the median value for each group. (d) Flow cytometric analysis of HA-specific T-bethi B cells reveal that the cells are phenotypically similar to SLE DN2 cells and are CD11c+FcRL5+CXCR5neg. Statistical analysis in (c) was performed using a non-parametric Mann-Whitney test. P values.
Author response image 2
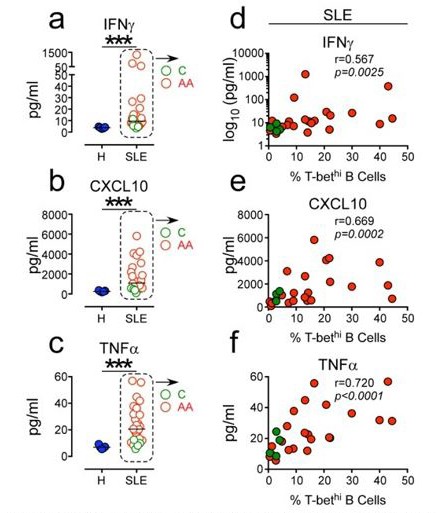
Positive correlation between high systemic levels Of inflammatory cytokines and frequency Of circu- lating T-bethi B cells in SLE patients.
(a-c) Plasma concen- tration of IFN7 (a) CXCLIO (b) and TNFa (c) in 5 healthy donors (blue symbols) and 25 SLE patients (red and green symbols). (d-f). Correlation between IFN7 (d), CXCLIO (e) and TNFa (f) plasma cytokine levels and frequency of T-bethi B cells in SLE patient peripheral blood. Red and green symbols identify 21 African Americans and 4 Caucasian patients respectively. Statistical analyses were performed using non- parametric Mann-Whitney test (a-c) and Spearman Correla- tion test (d-f).
Author response image 3
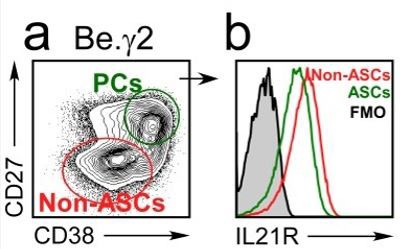
IL21R expression levels decline as B cells differentiate into ASCs.
BN cells were activated for 3 days with anti-lg, R848, IFNY and IL-2, then washed and cultured for an additional 3 days with IL-21 and R848 (Be.Y2 cells). ASCs (CD27hiCD38hi and non-ASCs were identified in the Be.Y2 cultures (a) and IL21R expression levels were evaluated in each subset and are reported as histograms (b).
Author response image 4
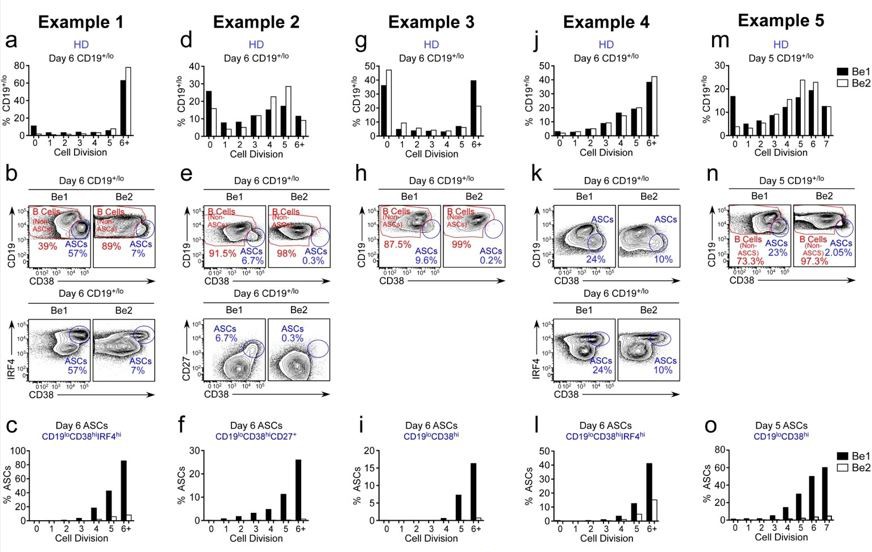
ASC formation is augmented and accelerated in Bel co-cultures.
(a-o) Proliferation and ASC formation were measured in 5 independent (Examples 1-5) day 5-6 paired Bel and 3e2 Go-cultures that contained purified CTV-IabeIed BN cells and allogenic Thl or Th2 cells plus IL-2 and IL-21 , proliferation analysis (a, d, g, j, m) Of B lineage cells in the day 5-6 co-cultures showing the frequency Of CD19•n0 cells in each cell division. Analysis Of ASC formation in day 5-6 Go-cultures (b, e, h, k, n) showing the frequency of ASCs within the CD19•'1a gated cells. ASCs defined as CD1910CD3BhilRF4hi (b, k), CD19ZCD3BhiCD27• (e) or CD1910CD38hi (h, n). proliferation analysis (c, f, i, l, o) the ASCs and non-ASCs in each cell division. Data are shown as the proportion of cells within each division that are ASCs.
Tables
Key resources table
| Reagent type (species) or resource | Designation | Source or reference | Identifiers | Additional information |
|---|---|---|---|---|
| Commercial Assays or Kits | ||||
| Commercial assay or kit | Human Anti-SM IgG ELISA Kit | Alpha Diagnostic International | 3300–100-SMG | |
| Commercial assay or kit | Milliplex MAP Human Cytokine/Chemokine Magnetic Bead Panel | Millipore | HCYTOMAG-60K | |
| Commercial assay or kit | Milliplex MAP Human Th17 Magnetic Bead Panel | Millipore | HTH17MAG-14K | |
| Commercial assay or kit | Fixable Aqua Dead Cell Stain Kit | Life Technologies | 34966 | |
| Commercial assay or kit | CellTrace Violet | Invitrogen by Thermo Fisher Scientific | C34557 | |
| Commercial assay or kit | Transcription Factor PhosphoPlus Buffer Set | BD Pharmingen | 565575 | |
| Commercial assay or kit | Foxp3/Transcription Factor Staining Buffer Set | eBioscience | 00-5523-00 | |
| Commercial assay or kit | EasySep Human Naïve B Cell Enrichment Set | STEMCELL Technologies | 19254 | |
| Commercial assay or kit | EasySep Human Naïve CD4 + T Cell Isolation Kit | STEMCELL Technologies | 19155 | |
| Commercial assay or kit | Anti-IgD Microbeads human | Miltenyi Biotec | 130-103-775 | |
| Commercial assay or kit | HA, Sterile Clear Plates 0.45microm Surfactant-Free, Mixed Cellulose Ester Membrane | Millipore | MAHAS4510 | |
| Cytokines For Culture | ||||
| Peptide, recombinant protein | Recombinant Human IFN-gamma | R&D | 285-IF | 20 ng/ml |
| Peptide, recombinant protein | Recombinant Human IL4 | R&D | 204-IL | 20 ng/ml |
| Peptide, recombinant protein | Recombinant Human IL12 | R&D | 219-IL | 1 ng/ml |
| Peptide, recombinant protein | Recombinant Human IL21 | Peprotech | 200–21 | 10 ng/ml |
| Peptide, recombinant protein | Recombinant Human BAFF | Peprotech | 310–13 | 10 ng/ml |
| Peptide, recombinant protein | Recombinant Human IL2 | Peprotech | 200–02 | 50 U/ml |
| Chemical Compounds/Drugs For Culture or Flow | ||||
| Chemical compound, drug | R848 | InvivoGen | tlrl-r848 | 5 microgram/ml |
| Chemical compound, drug | Iscove's DMEM, 1X | Corning Mediatech | 10–016-CV | |
| Chemical compound, drug | RPMI-1640 | Lonza | 12–702F | |
| Chemical compound, drug | MEM Nonessential Amino Acids | Corning Mediatech | 25–025 Cl | |
| Chemical compound, drug | Sodium Pyruvate100 mM Solution | GE Life sciences | SH30239.01 | |
| Chemical compound, drug | Penicillin Streptomycin Solution | Corning | 30–002 Cl | |
| Chemical compound, drug | Gentamicin | Gibco | 15750–060 | |
| Chemical compound, drug | 7-amino-AMD | Calbiochem | 129935 | |
| Chemical compound, drug | Fluoresbrite Carboxylate YG 10 micron Microspheres | Polysciences | 18142 | |
| Chemical compound, drug | DPBS, 1X | Corning Mediatech | 21–031-CV | |
| Chemical compound, drug | EDTA | Thermo Fisher Scientific | 15575–038 | |
| Chemical compound, drug | HEPES Buffer1M Solution | Corning Mediatech | 25–060 Cl | |
| Chemical Compounds/Drugs For ELISPOT | ||||
| Chemical compound, drug | BCIP/NBT Alkaline Phosphatase Substrate/membrane | Moss, Inc | NBTM-1000 | |
| Antibodies For Culture | ||||
| Antibody | Purified anti-human CD3 (mouse IgG1) | Biolegend | 300414 | 5 microgram/ml |
| Antibody | Purified anti-human CD28 (mouse IgG1) | Biolegend | 302914 | 5 microgram/ml |
| Antibody | Human IL-12 Antibody (goat IgG) | R&D | AB-219-NA | 10 microgram/ml |
| Antibody | Human IFN-gamma Antibody (goat IgG) | R&D | AB-285-NA | 10 microgram/ml |
| Antibody | Human IL-4 Antibody (goat IgG) | R&D | AB-204-NA | 10 microgram/ml |
| Antibody | AffiniPure F(ab')₂ Fragment Goat Anti-Human IgM, Fcμ fragment specific | Jackson ImmunoResearch | 109-006-129 | 5 microgram/ml |
| Antibody | AffiniPure F(ab')₂ Fragment Goat Anti-Human IgG, F(ab')₂ fragment specific | Jackson ImmunoResearch | 109-006-097 | 5 microgram/ml |
| Antibody | AffiniPure F(ab')₂ Fragment Goat Anti-Human Serum IgA, α chain specific | Jackson ImmunoResearch | 109-006-011 | 5 microgram/ml |
| Antibodies For ELISPOT | ||||
| Antibody | AffiniPure Goat Anti-Human IgG (H + L) | Jackson ImmunoResearch | 109-005-088 | 2 microgram/ml |
| Antibody | Alkaline Phosphatase AffinitiPure F(ab')2 Fragment Goat, Anti-Human IgG, Fc-gamma Fragment Specific | Jackson ImmunoResearch | 109-056-098 | (1:1000) |
| Others For Culture | ||||
| Other | Human Serum AB | GemCell | 100–512 | |
| Other | Fetal Bovine Serum | Biowest | S1690 | |
| Antibodies For Flow | ||||
| Antibody | Fitc Mouse Anti-Human CD3 (clone HIT3a) | BD Biosciences | 555339 | (1:200) |
| Antibody | PercP/Cy5.5 Mouse Anti-Human CD3 (clone OKT3) | eBioscience | 45-0037-71 | (1:200) |
| Antibody | Fitc Mouse Anti-Human CD4 (clone OKT4) | eBioscience | 11-0048-80 | (1:400) |
| Antibody | PE Mouse Anti-Human CD4 (clone OKT4) | Biolegend | 317410 | (1:200) |
| Antibody | PercP/Cy5.5 Mouse Anti-HumanCD4 (clone OKT4) | eBioscience | 45-0048-42 | (1:200) |
| Antibody | BV510 Mouse Anti-Human CD4 (clone OKT4) | Biolegend | 317444 | (1:100) |
| Antibody | Fitc Mouse Anti-HumanCD11c (clone Bu15) | Biolegend | 337214 | (1:200) |
| Antibody | PE Mouse Anti-Human CD11c (clone Bu15) | Biolegend | 337205 | (1:400) |
| Antibody | PercP/Cy5.5 Mouse Anti-Human CD14 (clone HCD14) | Biolegend | 325621 | (1:200) |
| Antibody | Fitc Mouse Anti-Human CD19 (clone LT19) | Miltenyi | 302256 | (1:100) |
| Antibody | PE Mouse Anti-Human CD19 (clone HIB19) | Biolegend | 302208 | (1:200) |
| Antibody | PercP/Cy5.5 Mouse Anti-Human CD19 (clone HIB19) | Biolegend | 302230 | (1:100) |
| Antibody | APC Mouse Anti-Human CD19 (clone HIB19) | BD Pharmingen | 555415 | (1:200) |
| Antibody | APC-H7 Mouse Anti-Human CD19 (clone HIB19) | BD Pharmingen | 560727 | (1:100) |
| Antibody | BV421 Mouse Anti-Human CD19 (clone HIB19) | Biolegend | 302234 | (1:200) |
| Antibody | V500 Mouse Anti-Human CD19 (clone HIB19) | BD Horizon | 561121 | (1:100) |
| Antibody | PercP/Cy5.5 Mouse Anti-Human CD21 (clone Bu32) | Biolegend | 354908 | (1:100) |
| Antibody | Fitc Mouse Anti-Human CD23 (clone M-L23.4) | Miltenyi | 130-099-365 | (1:100) |
| Antibody | PE Mouse Anti-Human CD23 (clone EBVCS-5) | Biolegend | 338507 | (1:200) |
| Antibody | APC Mouse Anti-Human CD23 (clone M-L233) | BD Pharmingen | 558690 | (1:200) |
| Antibody | Fitc Mouse Anti-Human CD27 (clone M-T271) | Biolegend | 356404 | (1:100) |
| Antibody | PercP/Cy5.5 Mouse Anti-Human CD27 (clone M-T271) | Biolegend | 356408 | (1:100) |
| Antibody | APC Mouse Anti-Human CD27 (clone M-T271) | Biolegend | 356410 | (1:200) |
| Antibody | APC-H7 Mouse Anti-Human CD27 (clone M-T271) | eBioscience | 560222 | (1:100) |
| Antibody | BV421 Mouse Anti-Human CD27 (clone M-T271) | Biolegend | 356418 | (1:200) |
| Antibody | PE/Cy7 Mouse Anti-HumanCD38 (clone HIT2) | eBioscience | 25-0389-42 | (1:1200) |
| Antibody | PercP/Cy5.5 Mouse Anti-HumanCD56 (clone 5.IH11) | Biolegend | 362505 | (1:100) |
| Antibody | PE Mouse Anti-Human FcRL5 (clone 509 F6) | Biolegend | 340304 | (1:200) |
| Antibody | eFluor660 Mouse Anti-Human FcRL5 (clone 509 F6) | eBioscience | 50-3078-42 | (1:200) |
| Antibody | APC Mouse Anti-HumanFcRL5 (clone 509 F6) | Biolegend | 340306 | (1:200) |
| Antibody | PE Mouse Anti-HumanCXCR3 (clone CEW33D) | eBioscience | 12-1839-42 | (1:200) |
| Antibody | PE Mouse Anti-HumanCXCR3 (clone 49801) | R&D | FAB160P | (1:200) |
| Antibody | Fitc Mouse Anti-HumanCXCR5 (clone J252D4) | Biolegend | 356914 | (1:100) |
| Antibody | PE Mouse Anti-Human CXCR5 (clone J252D4) | Biolegend | 356904 | (1:200) |
| Antibody | PercP-Cy5.5 Mouse Anti-Human CXCR5 (clone J252D4) | Biolegend | 356910 | (1:100) |
| Antibody | APC Mouse Anti-Human CXCR5 (clone J252D4) | Biolegend | 356907 | (1:200) |
| Antibody | BV421 Mouse Anti-HumanCXCR5 (clone J252D4) | Biolegend | 356920 | (1:200) |
| Antibody | Fitc Mouse Anti-HumanIgD (clone IgD26) | Miltenyi | 130-099-633 | (1:100) |
| Antibody | Fitc Mouse Anti-Human IgD (clone IA6-2) | BD Pharmingen | 555778 | (1:100) |
| Antibody | BV421 Mouse Anti-Human IgD (clone IA6-2) | Biolegend | 348226 | (1:200) |
| Antibody | BV510 Mouse Anti-HumanIgD (clone IA6-2) | BD Horizon | 561490 | (1:100) |
| Antibody | APC Mouse Anti-HumanIgM (clone MHM-88) | Biolegend | 314509 | (1:200) |
| Antibody | Fitc Mouse Anti-Human IgG (clone IS11-3B2.2.3) | Miltenyi | 130-099-229 | (1:200) |
| Antibody | PE Mouse Anti-HumanIgG (clone IS11-3B2.2.3) | Miltenyi | 130-099-201 | (1:200) |
| Antibody | PE Mouse Anti-HumanIgA(1) (clone IS11-8E10) | Miltenyi | 130-099-108 | (1:200) |
| Antibody | PE Mouse Anti-HumanIgA(2) (clone IS11-21E11) | Miltenyi | 130-100-316 | (1:200) |
| Antibody | Fitc Mouse Anti-Human/MouseT-bet (clone 4B10) | Biolegend | 644812 | (1:100) |
| Antibody | APC Mouse Anti-Human/MouseT-bet (clone 4B10) | Biolegend | 644814 | (1:100) |
| Antibody | AF488 Mouse Anti-Human/Mouse GATA (clone L50-823) | BD Pharmingen | 560163 | (1:100) |
| Antibody | PE Rat Anti-Human/MouseBlimp-1 (clone 6D3) | BD Pharmingen | 564702 | (1:200) |
| Antibody | PE Rat Anti-Human/Mouse IRF4 (clone IRF4.3E4) | Biolegend | 646403 | (1:600) |
| Antibody | APC Mouse Anti-Human IL21 (clone 3A3-N2) | Biolegend | 513007 | (1:100) |
| Antibody | APC Mouse Anti-HumanIL21R (clone 2 G1-K12) | Biolegend | 347807 | (1:50) |
| Antibody | BV421 Mouse Anti-Human/MousepSTAT3 (clone 13A3-1) | Biolegend | 651009 | (1:100) |
Additional files
-
Supplementary file 1
RNA-seq analysis of in vitro generated IgDnegCD27neg BDN Be1 and Be2 cells.
RNA-seq analysis of sorted IgDnegCD27neg BDN Be1 and Be2 cells isolated from Th1/BN and Th2/BN co-cultures. Data are shown as rpkm values from 3 independent Be1 and Be2 co-cultures that were set up with donor-matched sets of allogeneic BN cells and in vitro polarized Th1 or Th2 cells. Log2 fold change (Be1/Be2), P and FDR values reported.
- https://doi.org/10.7554/eLife.41641.023
-
Supplementary file 2
Up DEG list from T-bet expressing BDN cells from SLE patients.
RNA-seq analysis was previously performed (Jenks et al., 2018) on sort-purified T-bethi-expressing IgDnegCD27negIgG+CXCR5neg B cells from HD and SLE patients (DN2 cells). The DN2 Up DEG list is defined as genes that are significantly upregulated in SLE and HD DN2 cells relative to at least one other B cell subset (BN, switched memory or CXCR5-expressing (T-betlo) DN1 memory = cells).
- https://doi.org/10.7554/eLife.41641.024
-
Supplementary file 3
ATAC-seq data set from day 3 Be.0, Be.IFNγ, Be.IL2 and Be.γ2 B cell subsets.
HD BN cells were activated for 3 days with anti-Ig and R848 alone (Be.0) or in combination with: IFNγ (Be.IFNγ), IL-2 (Be.IL2) or both IFNγ+IL-2 (Be.γ2). ATAC-seq analysis was performed on DNA isolated from each B cell subset. Table includes all identified differentially accessible regions (DAR) with fold change and FDR q values for each comparison. N = 2 independent samples/group.
- https://doi.org/10.7554/eLife.41641.025
-
Supplementary file 4
P values for ATAC-seq motif enrichment comparisons.
P values for chromatin accessibility at transcription factor consensus DNA binding motifs (T-bet, IRF4, BLIMP1, NF-kB p65 and NF-kB REL) in ATAC-seq data. Comparisons include two-sided Student’s t-test comparisons with data from day 3 Be.0, Be.IFNγ, Be.IL2 and Be.γ2 cells.
- https://doi.org/10.7554/eLife.41641.026
-
Supplementary file 5
Complete statistical information for all data presented in this manuscript.
- https://doi.org/10.7554/eLife.41641.027
-
Transparent reporting form
- https://doi.org/10.7554/eLife.41641.028
Download links
A two-part list of links to download the article, or parts of the article, in various formats.
Downloads (link to download the article as PDF)
Open citations (links to open the citations from this article in various online reference manager services)
Cite this article (links to download the citations from this article in formats compatible with various reference manager tools)
IFNγ induces epigenetic programming of human T-bethi B cells and promotes TLR7/8 and IL-21 induced differentiation
eLife 8:e41641.
https://doi.org/10.7554/eLife.41641


