The hydrophobic nature of a novel membrane interface regulates the enzyme activity of a voltage-sensing phosphatase
- Osaka University, Japan
- Teikyo University, Japan
- Osaka Medical College, Japan
Figures
Figure 1

Voltage-sensing phosphatase.
(A) Domain architecture of VSP and PTEN. The VSP consists of a voltage sensor domain (VSD, dark blue), VSD-PD linker (light yellow), and a cytoplasmic catalytic region [CCR, cyan (phosphatase domain) and green (C2 domain)]. The CCR of the VSP shows high sequence similarity to that of PTEN, except that a C-terminal tail is absent (C-tail, dark gray). (B) The VSD is activated by membrane depolarization, and the motion induces conformational changes in the CCR through the VSD-PD linker. The black sticks with two red spheres show a substrate, PI(4,5)P2.
Figure 2 with 6 supplements
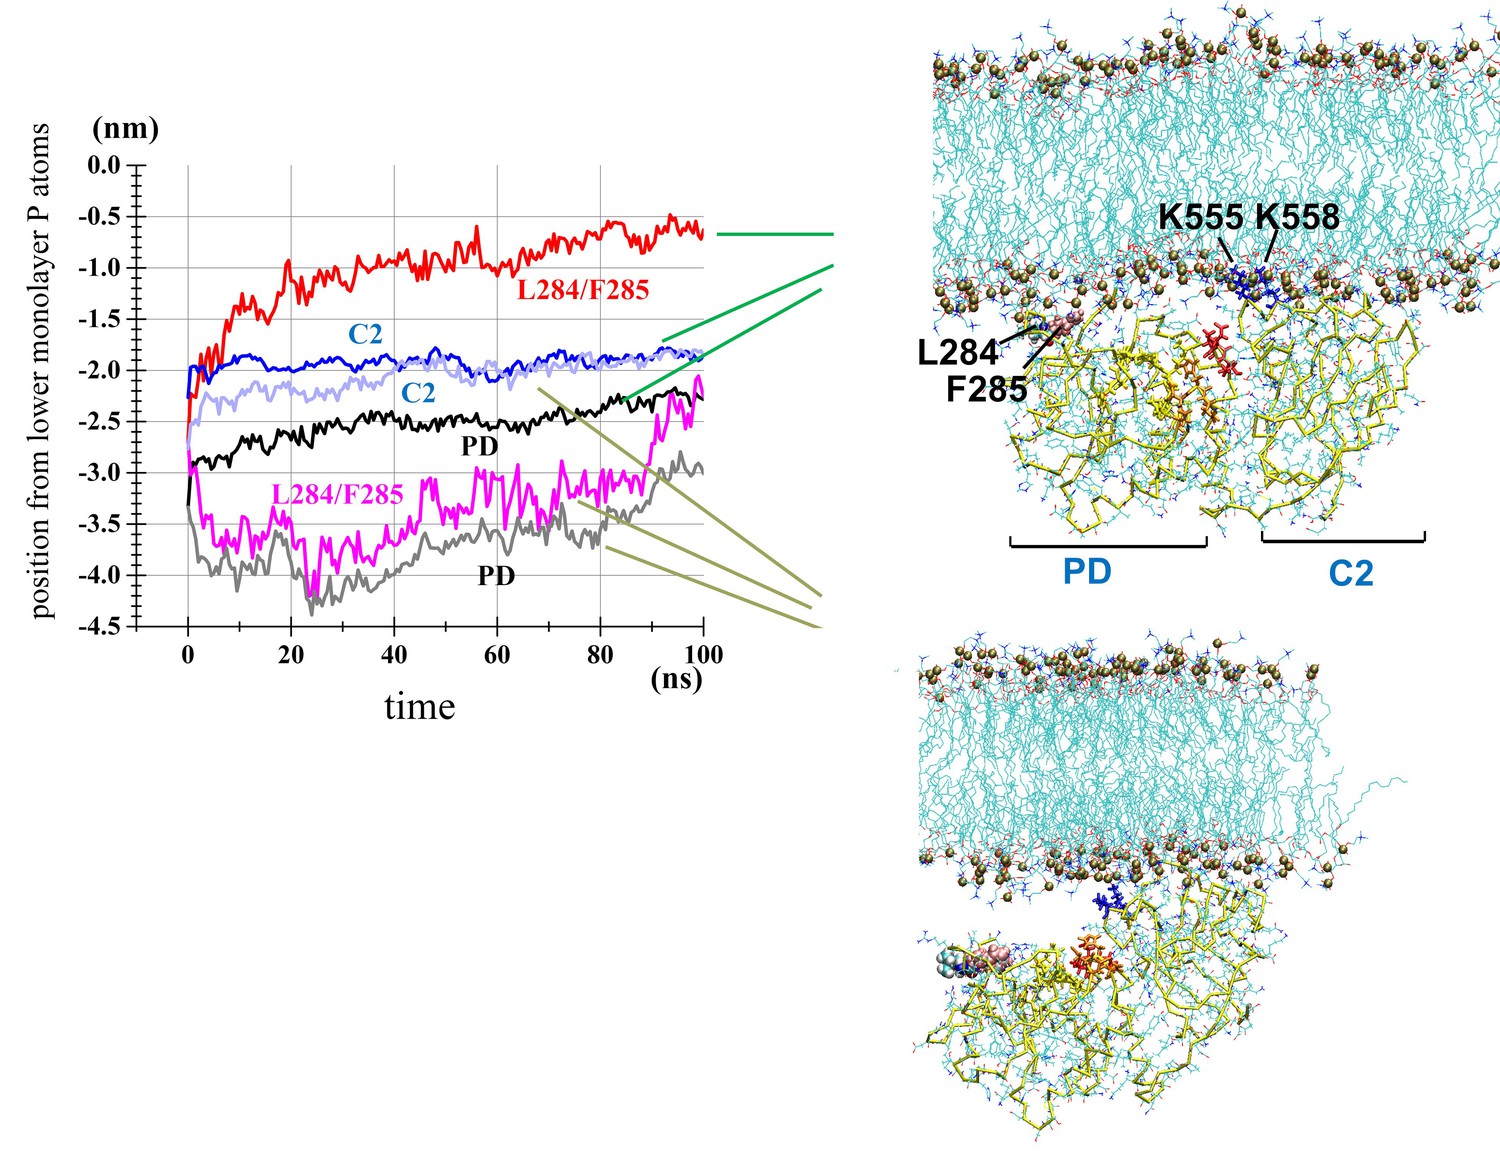
MD simulation of the cytoplasmic catalytic region.
Two selected AT runs. Left: Time courses of the z-positions of the centers of mass of the C2 domain, PD, and hydrophobic spine (Leu-284 and Phe-285) for the run at_po_4, which showed rapid membrane binding of both domains (blue, black, and red lines show the C2 domain, PD, and hydrophobic spine, respectively) and at_po_5, which exhibited rapid C2 domain and slow PD binding (light blue, grey, and pink lines show the C2 domain, PD, and hydrophobic spine, respectively). Of note, ‘po’ of the simulation IDs stands for the POPC bilayer. Right top: a snapshot of the time frame at 80 ns on the trajectory of at_po_4. Leu-284 and Phe-285 are shown with van der Waals forces represented and Phe-285 shown in pink. The following residues of the catalytic center are colored: His-330 to Asn-333 are shown in orange, and Val-410 to Thr-412 are shown in red. Right bottom: snapshot at 80 ns on the trajectory of at_po_5.
Figure 2—figure supplement 1
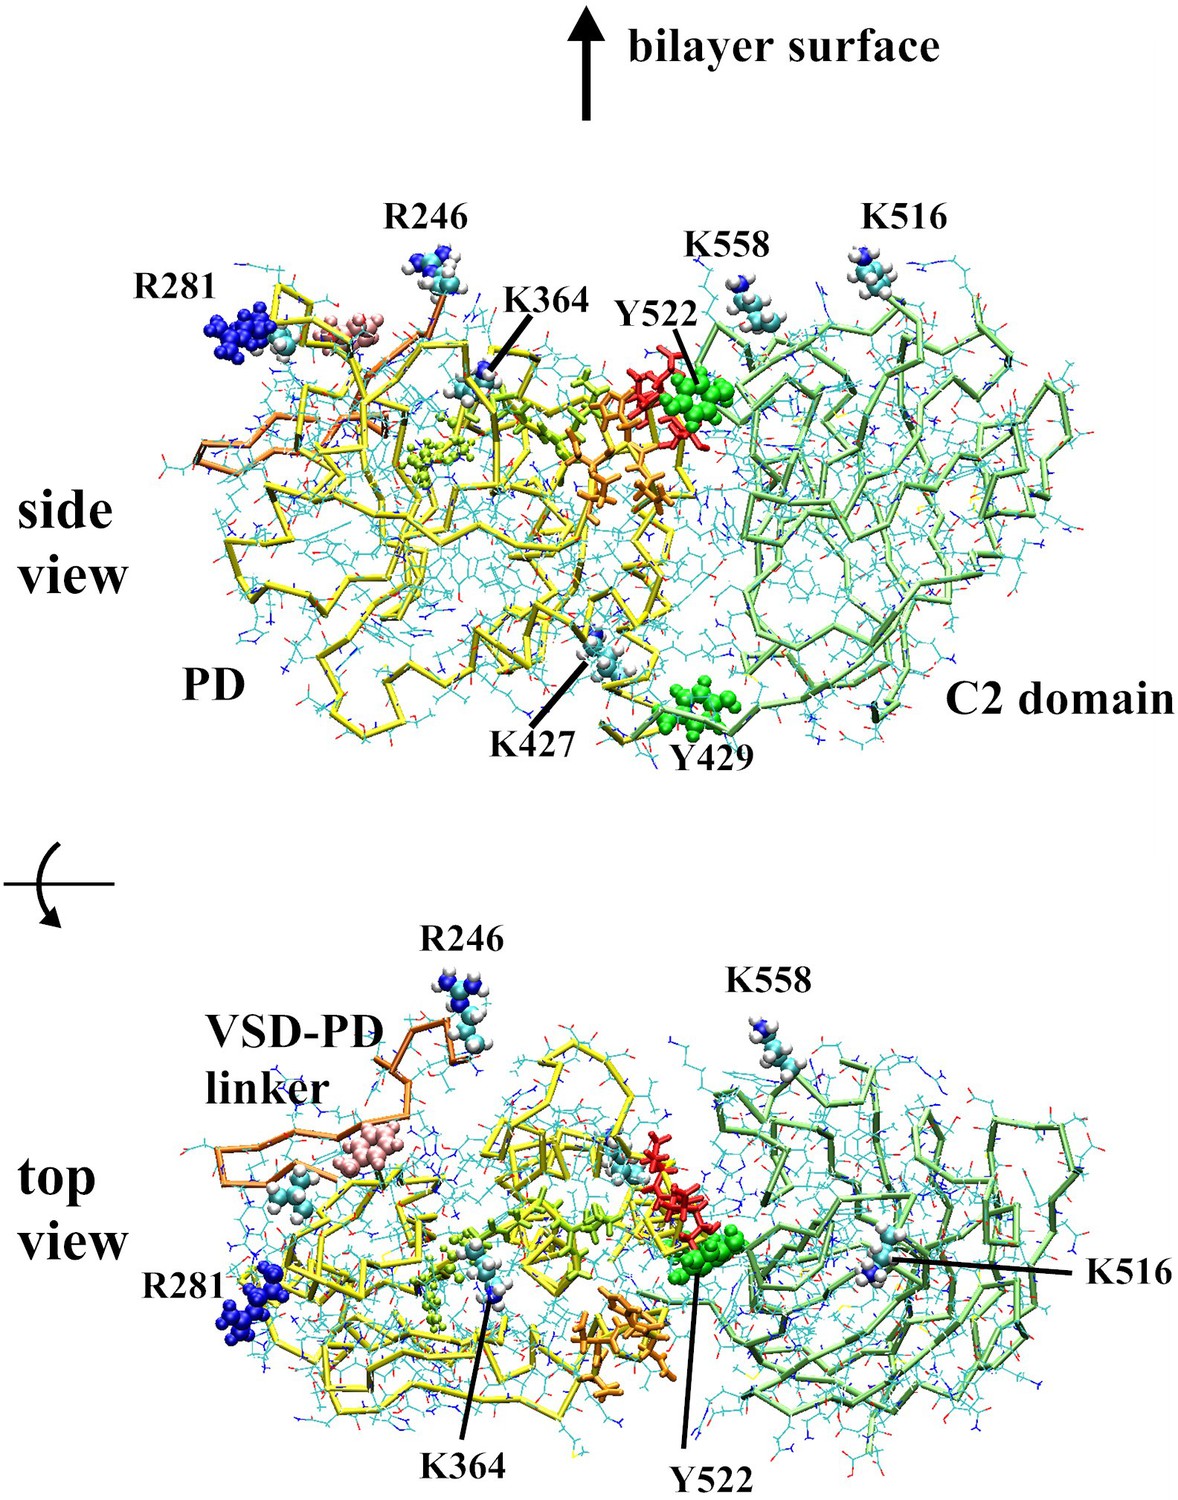
Orientation of the structure of the cytoplasmic catalytic region used for simulations
The amino acid residues of Ci-VSP used as references to describe the initial orientations (Table 1). The reference residues,that is the residues placed in the closest vicinity to the bilayer initially, are highlighted with the van der Waals representation scheme. Orange, yellow and lime chains of bars represent the peptide backbone of the VSD-PD linker, the C2 domain and the PD, respectively. Top; a side view. The direction of the z-axis (i.e., membrane normal) is represented by an arrow. Bottom; a top view, which represents the face considered to serve as the interaction surface when bound to the inner surface of the lipid bilayer membrane.
Figure 2—figure supplement 2
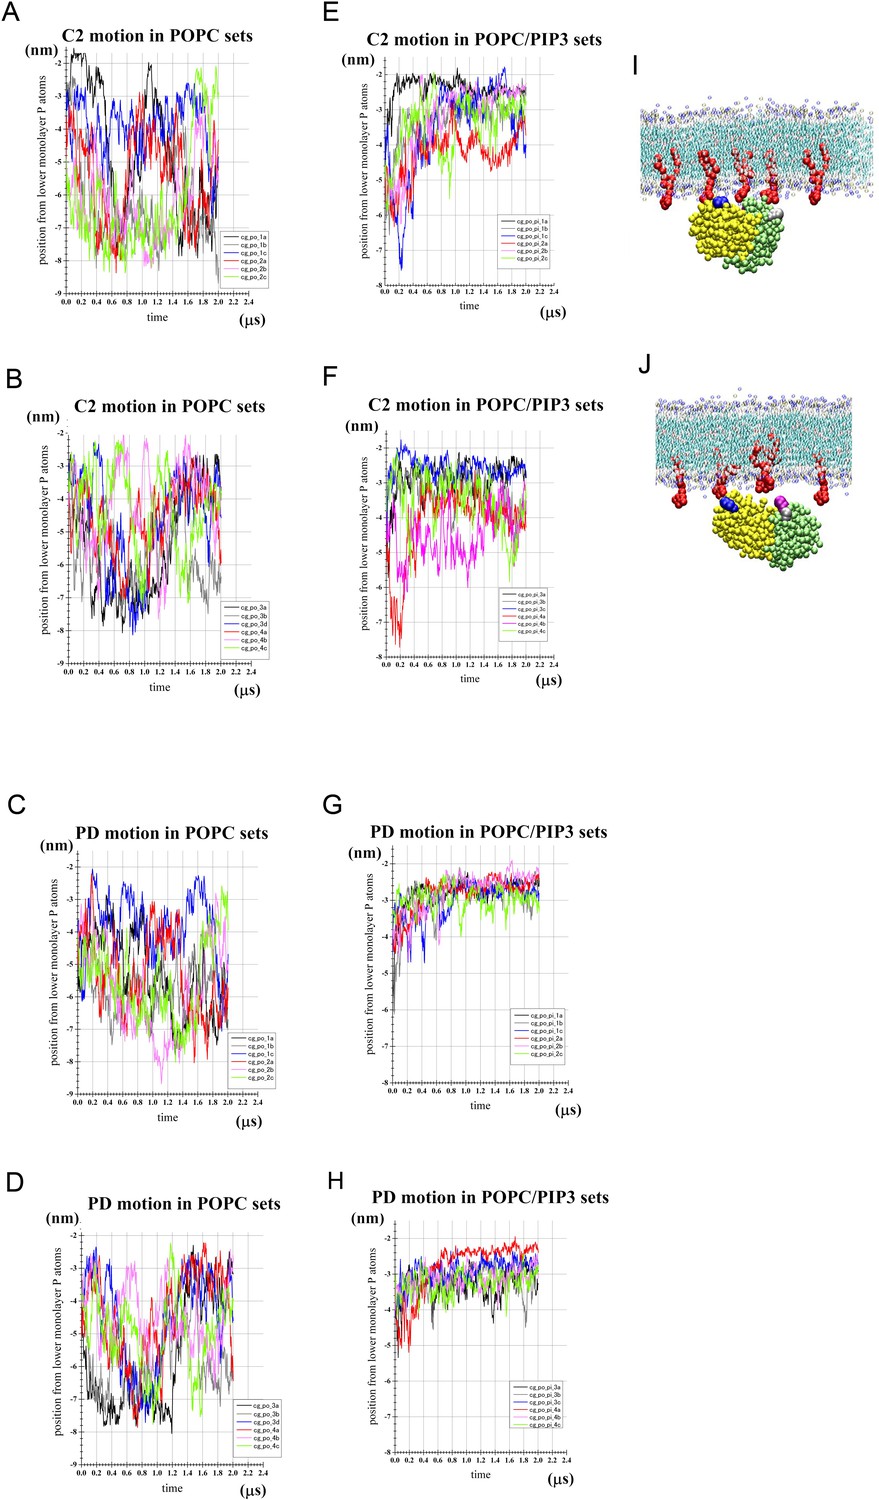
Progress of the CG simulations started with the CCR placed away from the bilayers.
(A) Time development of the z-position of the center of mass (com) of the C2 domain relative to the mean z-position of phosphorus atoms (C2 com-phosphorus distance). Shown are the data of the two sets (cg_po_1 and cg_po_2 in Table 1), each consisting of three runs (a, b and c) started with different initial velocities. (B) Similar to (A) but the data of the other two sets cg_po_3 and cg_po_4 are shown. (C,D) Results for the same runs as (A,B) but showing the PD com-phosphorus distance. (E,F) Similar to (A,B) but showing the C2-phosphorus distance data for the cg_po_pi_1 and _2 sets (E) and the cg_po_pi_3 and _4 sets (F) of the POPC/PI(3,4,5)P3 system. (G,H) Results for the same runs as (E,F) but showing the PD-phosphorus distance. (I) Snapshot of simulation run cg_po_pi_1a of 2 μs-time frame. PI(3,4,5)P3 molecules are highlighted with red van der Waals spheres. For Ci-VSP, C2 domain and PD are shown with lime and yellow van der Waals spheres, respectively. Blue and silver spheres show Arg-281 and Lys-516, respectively. In this example, both the C2 domain and PD were bound to the bilayer. (J) Snapshot of cg_po_pi_2a at 2μs. The representation scheme is similar to (I), but purple spheres represent Lys-555. In this snapshot, the PD, but not the C2 domain, was judged to be bound to the membrane.
Figure 2—figure supplement 3
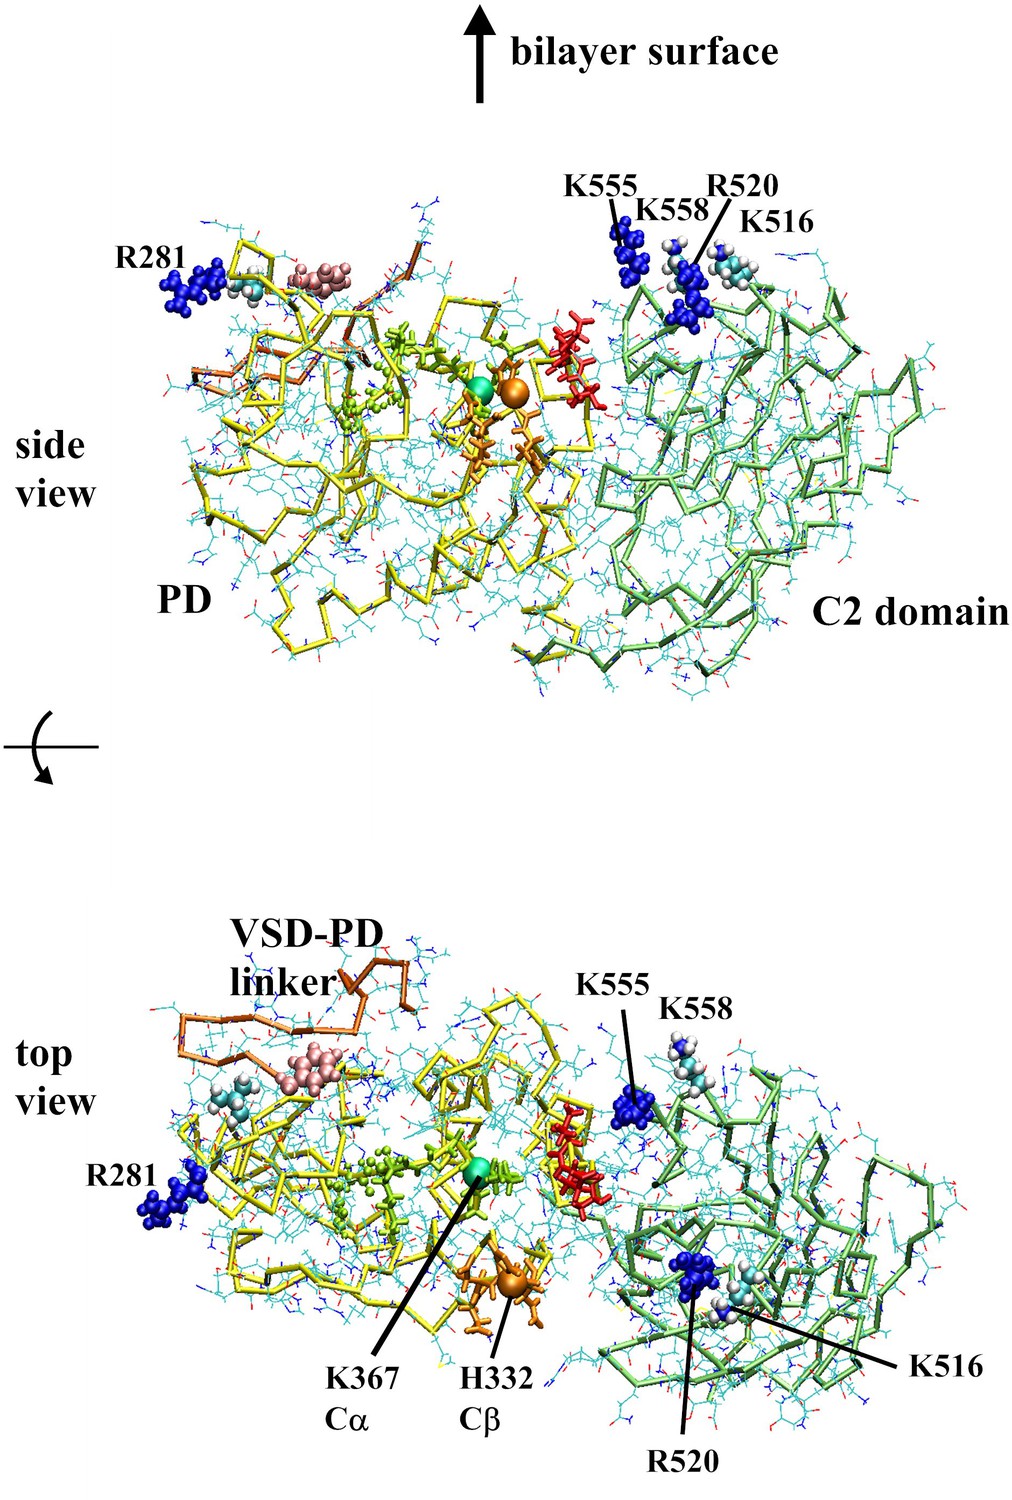
The productive orientation of the CCR.
The residues used as the references to describe the productive orientation as described in Materials and methods are highlighted with the van der Waals spheres. Other representation schemes are the same as those used on the Figure 2—figure supplement 1. Top; a side view. The direction of the z-axis (i.e., membrane normal) is the same as the direction indicated by an arrow. Bottom; a top view.
Figure 2—figure supplement 4
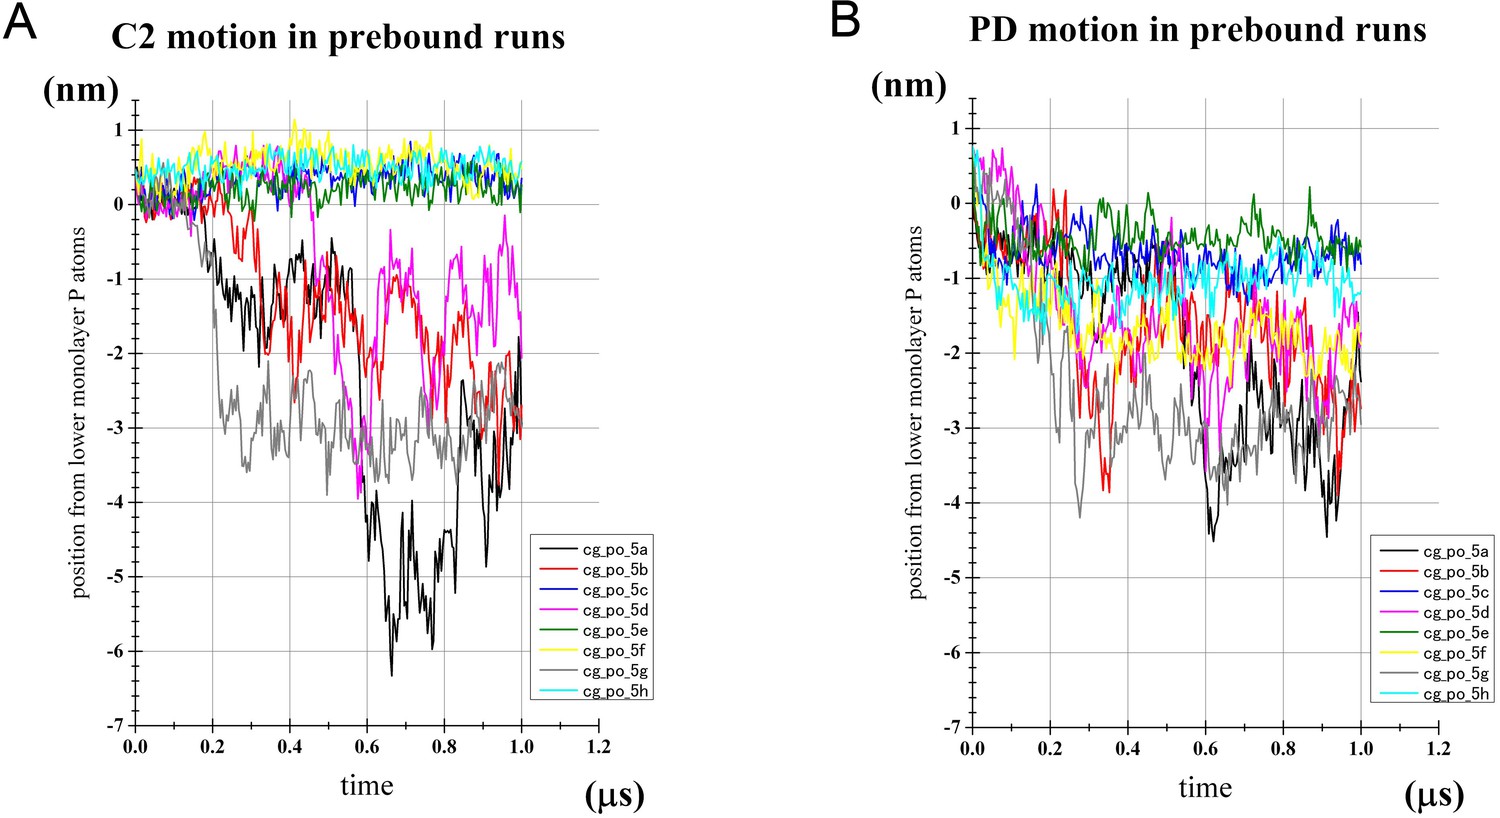
Progress of CG simulation runs in the prebound state.
Progress of CG simulation runs started with the CCR of Ci-VSP in the prebound state (cg_po_5 in Table 1). The POPC bilayer was used. (A) Time development of the z-position of the top atom (as defined in Materials and methods) of the C2 domain relative to the mean z-position of phosphorus atoms (C2 top-phosphorus distance). (B) The data of the same runs as those in (A) but 'PD top-phosphorus' distance is shown. Of note, the PD with the top atom >0.2 nm below the phosphorus layer was judged to be in the unbound state.
Figure 2—figure supplement 5
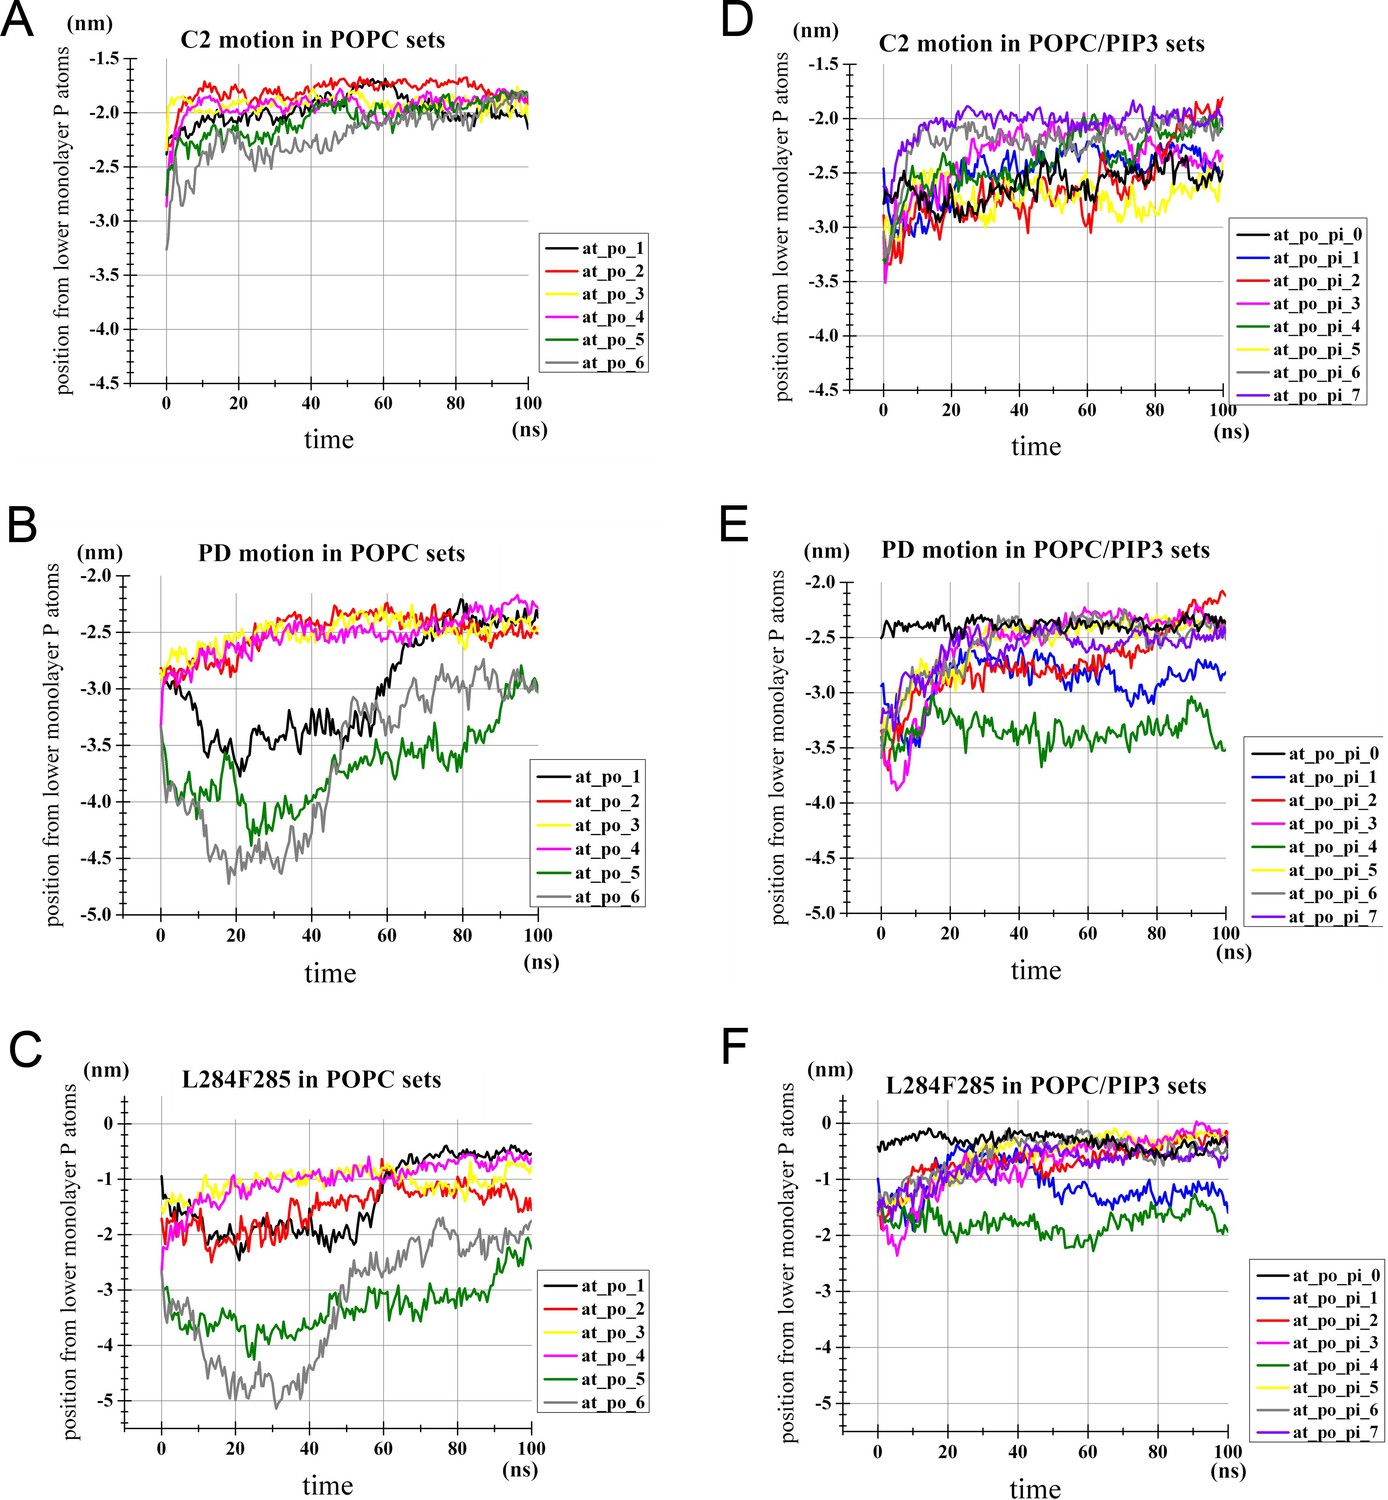
Progress of AT simulation runs (1).
(A,B,C) The results of the POPC sets (at_po_1 to 6 of Table 1). (D,E,F) The results of the POPC/PI(3,4,5)P3 sets (at_po_pi_0 to 7). In each panel, the time development of z-position of the center of mass of the C2 domain (A,D), of the PD (B,E) and of the atoms comprising the residues Leu-284 and Phe-285 (C,F) relative to the mean z-position of phosphorus atoms of the lower monolayer is shown. Of note, except for at_po_pi_0 that started from a structure modeled from the CG run-obtained structure (near the productive orientation), the both the C2 domain and the PD were initially placed away from the bilayer surface as summarized in Table 1. Of note, due to the limited simulation time for our AT simulations, the trajectories showed high dependency on initial positions of PI(3,4,5)P3 molecules.
Figure 2—figure supplement 6
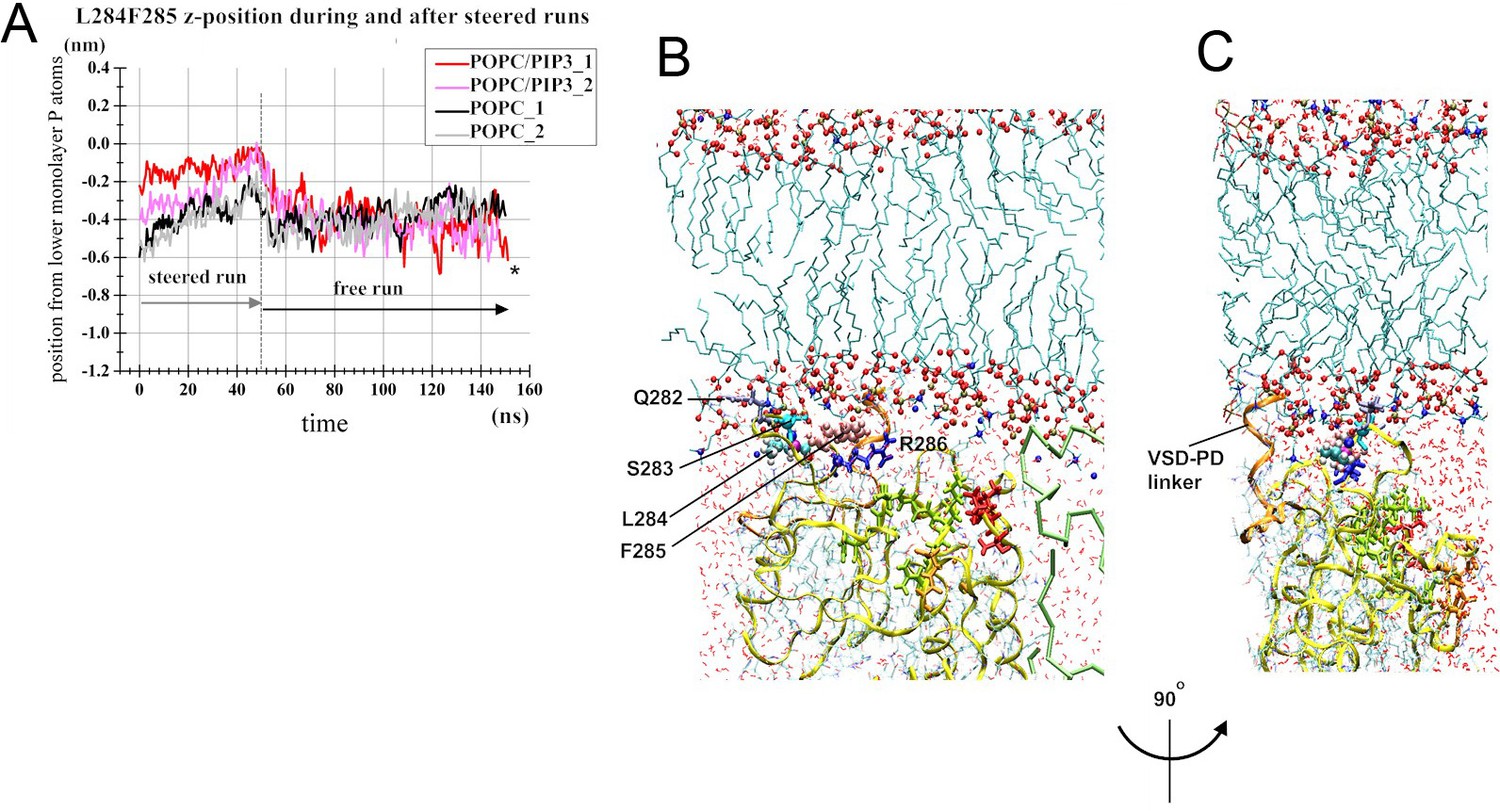
Progress of AT simulation runs (2): steered simulations.
Progress of the steered simulations and the subsequent free simulations (at_steered in Table 1). (A) Results of the four trajectories. The z-position of the center of mass (com) of the group of Leu-284-Phe285 is shown in a manner similar to Figure 2—figure supplement 5. The first 50 ns period corresponds to the period of the steered simulations in which the ‘com’ of Leu-284-Phe-285 was pulled at the rate of 0.01 nm/ns with a harmonic potential with the force constant of 3000 kJ/nm2 along the z-axis toward the bilayer midplane. This external force was removed at 50 ns. The runs named POPC/PI(3,4,5)P3_1 and POPC/PI(3,4,5)P3_2 were started from the structures sampled from the time frames at 100 ns and 50 ns, respectively, of the at_po_pi_5 (Figure 2—figure supplement 5), and POPC_1 and POPC_2 were from the structures of the 80 ns and 100 ns time frames of the at_po_4 run, respectively. (B) Snapshot of the final time frame (i.e., at 150ns) of POPC_1 run of (A). Leu-284 and Phe-285 are highlighted by the van der Waals sphere representation. A couple of neighbor amino acid residues (Gln-282, Ser-283 and Arg-286) are also shown with licorice representation. The peptide backbones of the VSD-PD linker and the PD are shown by orange and yellow ribbons, respectively. Several residues of the catalytic center are also highlighted: orange licorice, His-330-His-333; red licorice, Val-410-Thr-412; lime licorice, His-362-Arg-369. For the POPC bilayer, the following scheme is used: light blue lines, acyl chains; red spheres, carbonyl and ester oxygen atoms; ochre spheres, phosphorus atoms; blue spheres, nitrogen atoms. Water molecules are represented with thin red licorices. (C) Same as (B) but viewed from a different view point. As this example shows, Leu-284 and Phe-285 largely resided ~3–5 Å below the phosphorus layer, despite their hydrophobicity during the free simulation period.
Figure 3
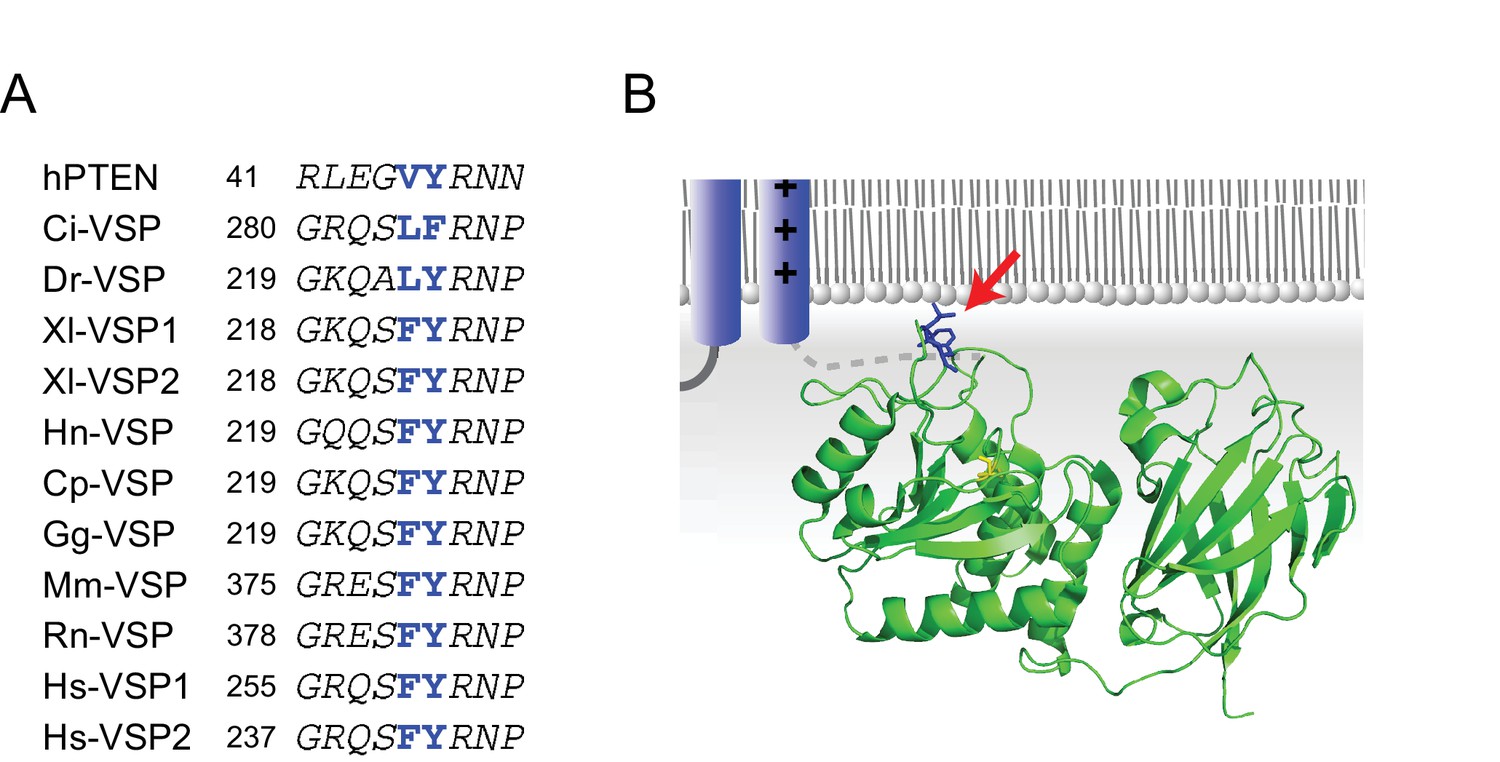
The hydrophobic spine.
(A) Amino acid sequences of PTEN (human) and VSP orthologs around the hydrophobic spine. Ci: sea squirt (Ciona intestinalis), Cp: newt (Cynops pyrrhogaster), Dr: zebrafish (Danio rerio), Gg: chicken (Gallus gallus), Hn: salamander (Hynobius nebulosus), Hs: human (Homo sapiens), Mm: mouse (Mus musculus), Rn: rat (Rattus norvegicus), Xl: clawed frog (Xenopus laevis). (B) Putative conformation of voltage-sensing phosphatase near a phospholipid membrane (dark blue: voltage sensor domain; green: cytoplasmic catalytic region [X-ray crystal structure: 3V0H]). Blue amino acids indicated by red arrows are hydrophobic residues at the phosphatase domain surface (defined as the ‘hydrophobic spine’).
Figure 4 with 2 supplements
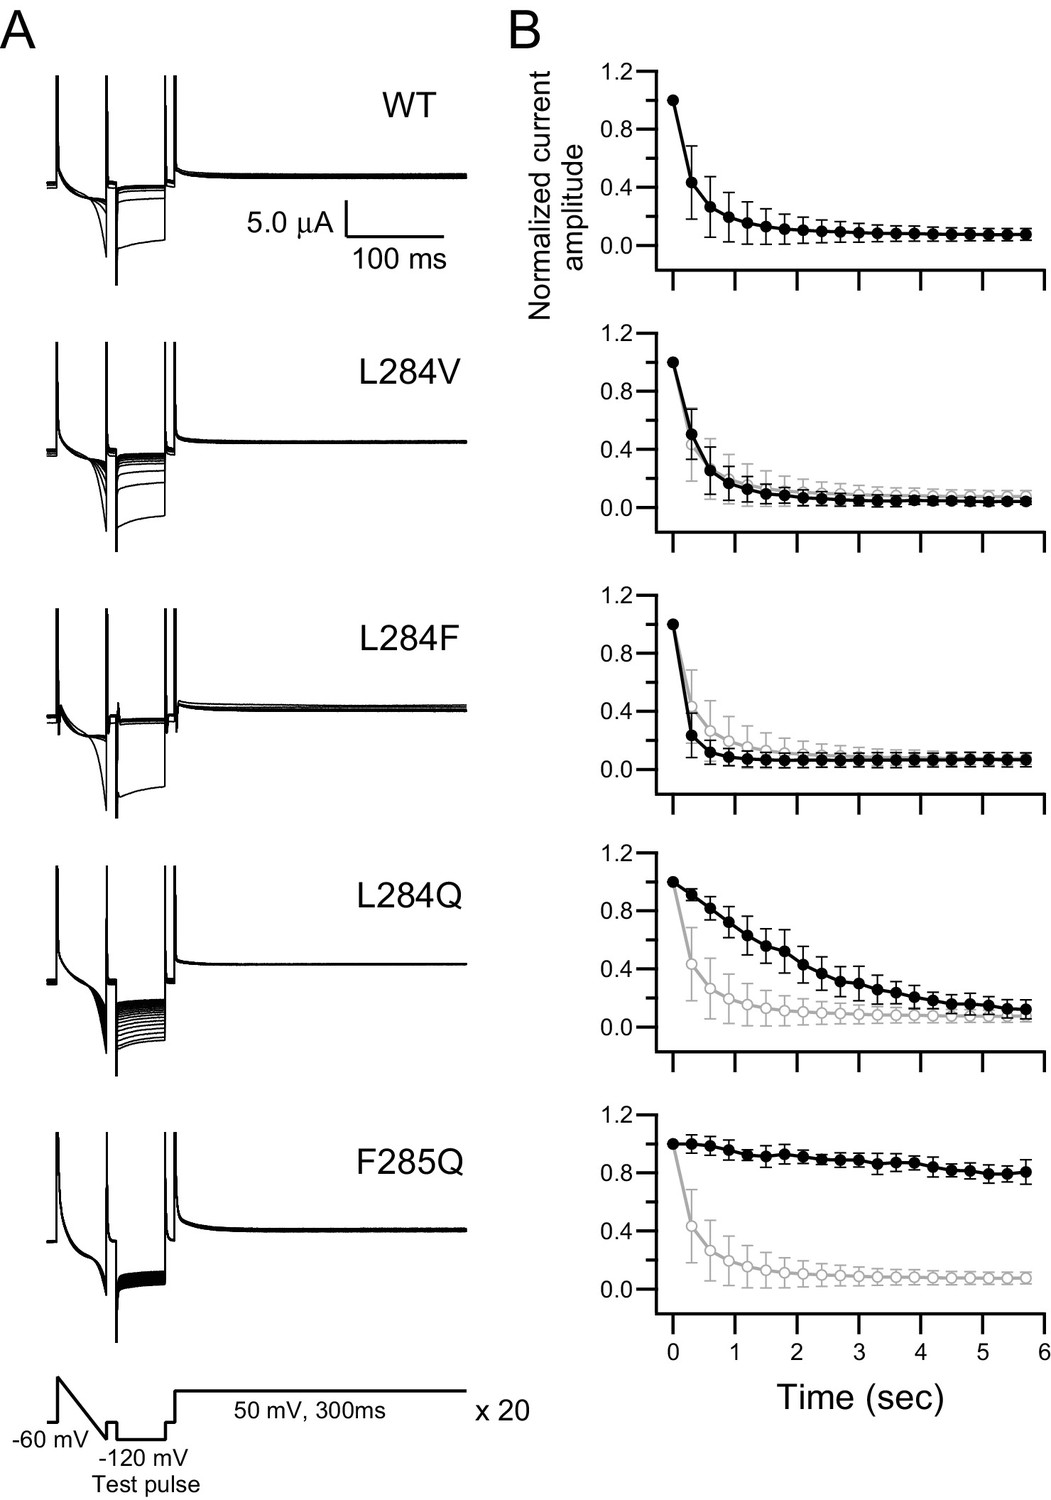
Alteration of voltage-dependent phosphatase activities by mutations in the hydrophobic spine.
(A) Representative current traces of a PI(4,5)P2-sensitive K+ channel (Kir3.2d, GIRK2) coexpressed with Ci-VSP WT, L284V, L284F, L284Q, and F285Q in Xenopus oocytes. A pulse protocol (bottom panel) consists of a 50 ms ramp pulse, 50 ms step pulse at −120 mV (test pulse), and 300 ms depolarization pulse at 50 mV. This protocol was repeated 20 times. All 20 current traces are superimposed. The holding potential was maintained at −60 mV. Kir currents were observed in test pulses, and the current amplitude indicated the relative amount of PI(4,5)P2 in the plasma membrane. (B) Plots of time-dependent normalized current amplitudes of inward K+ currents at the end points of the test pulses. Values were normalized to the first trace current amplitude of the test pulse. Black lines show the plots from current traces of A. Gray lines show the plot from the WT, which is the same trace as that shown at the top. Symbols show the mean ± S.D. of data from 4 to 56 oocytes (WT: n = 56, L284V: n = 5, L284F: n = 35, L284Q: n = 4, F285Q: n = 4).
-
Figure 4—source data 1
Numerical data that were used to generate the chart in Figure 4B.
- https://doi.org/10.7554/eLife.41653.015
Figure 4—figure supplement 1
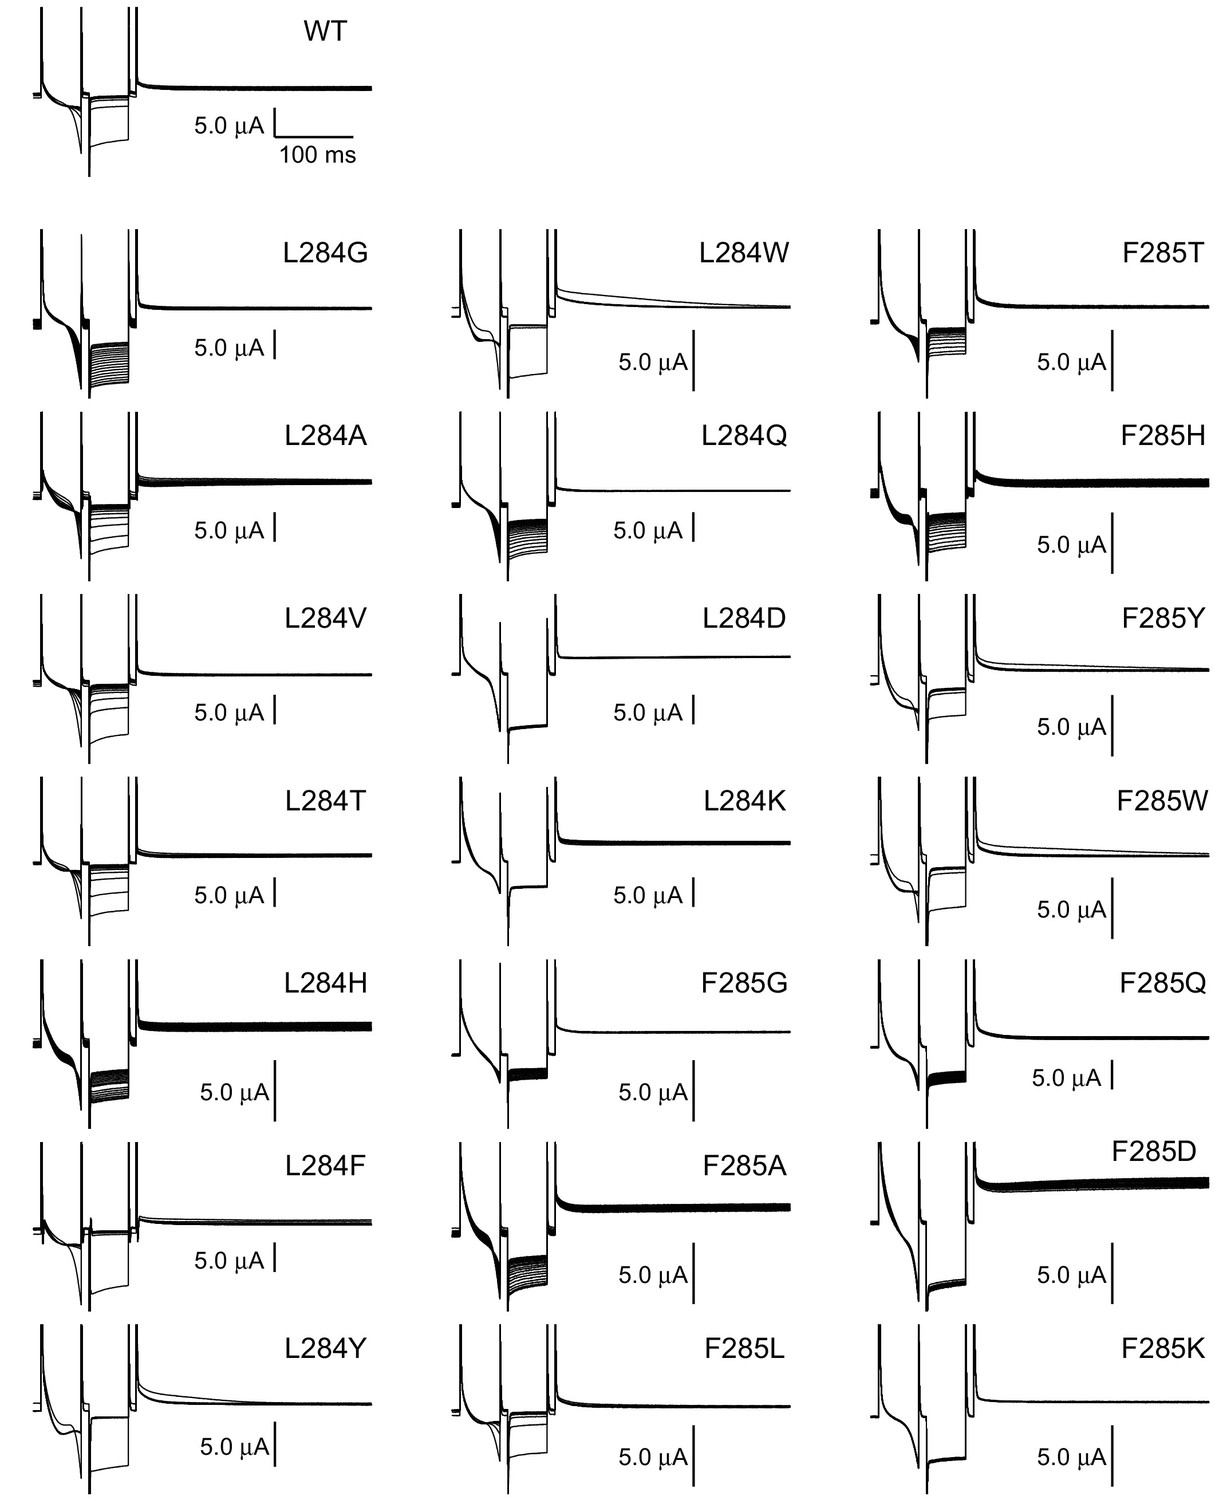
A gallery of voltage dependent phosphatase activities of all Ci-VSP mutants examined with Kir channel (Representative current traces).
Representative current traces of PI(4,5)P2 sensitive K+ channel (Kir3.2d, GIRK2) co-injected with Ci-VSP WT or mutants in Xenopus oocytes. Recording conditions are the same as Figure 4A. All 20 traces during repeated protocols are superimposed.
Figure 4—figure supplement 2
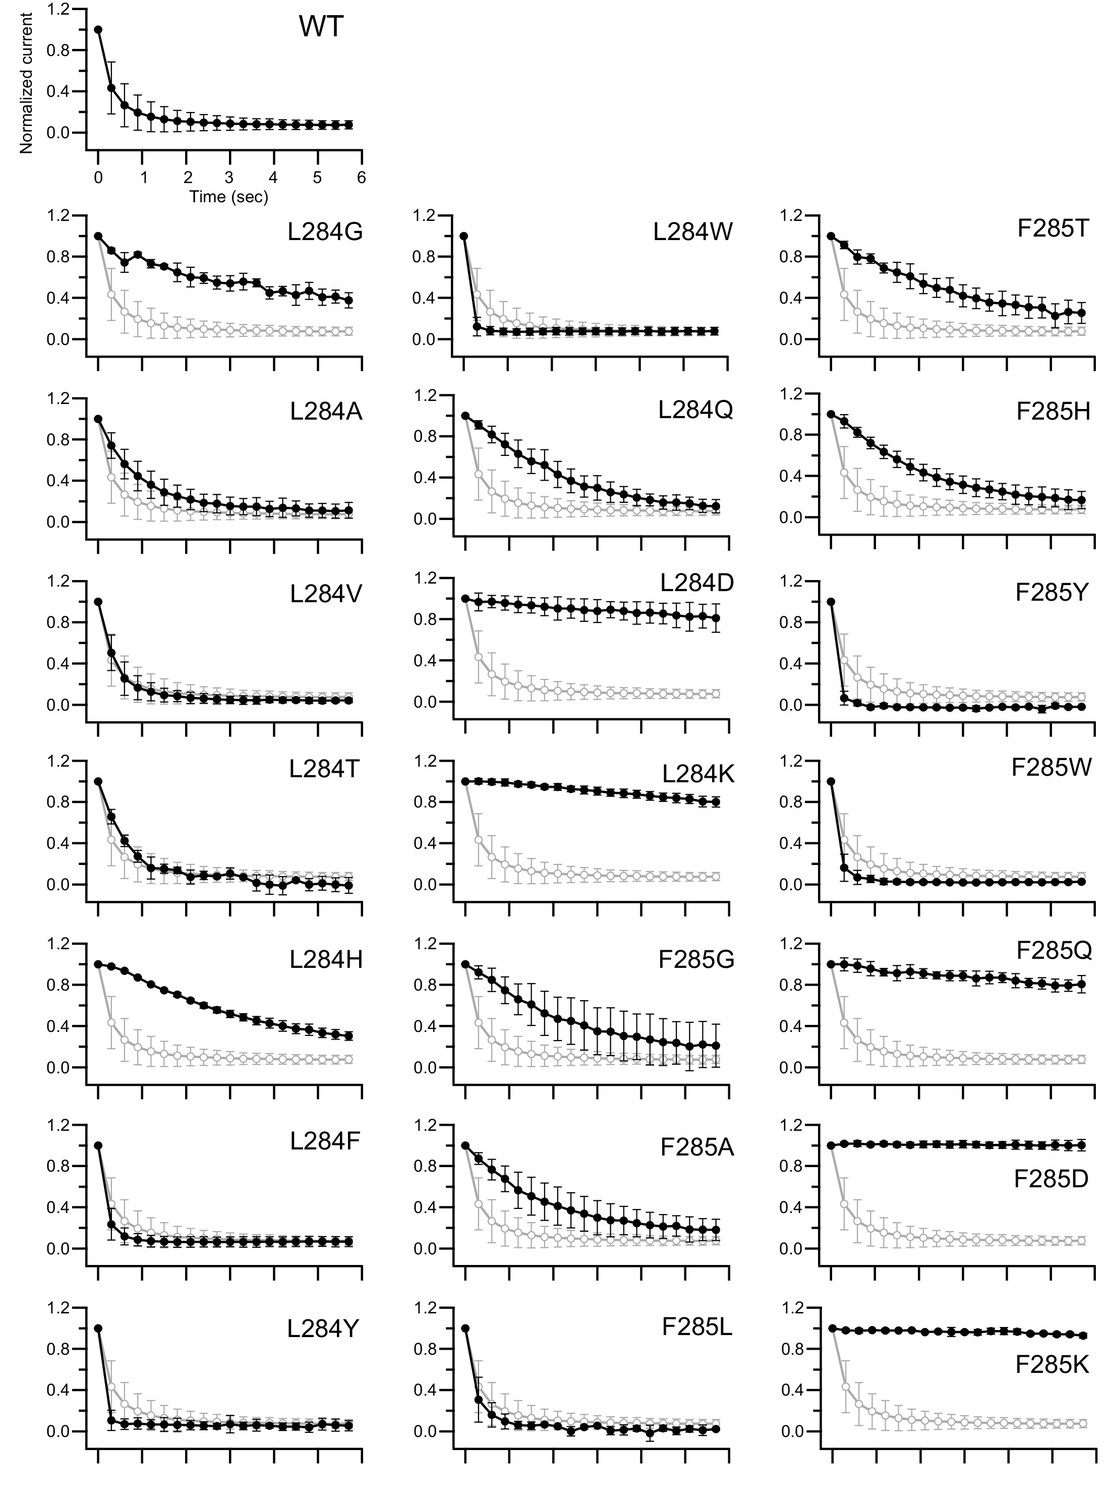
Pooled data of voltage dependent phosphatase activities of all Ci-VSP mutants examined with Kir channel (Current decays).
Plots of time-dependent normalized current amplitudes of the inward K+ current at the end point of the test pulse. Values are normalized to the first trace current amplitude of the test pulse. Black line shows the plot from each mutant. Gray lines show the plots from WT, which is the same trace of the top one. Analysis conditions are the same as Figure 4B.
Figure 5 with 3 supplements
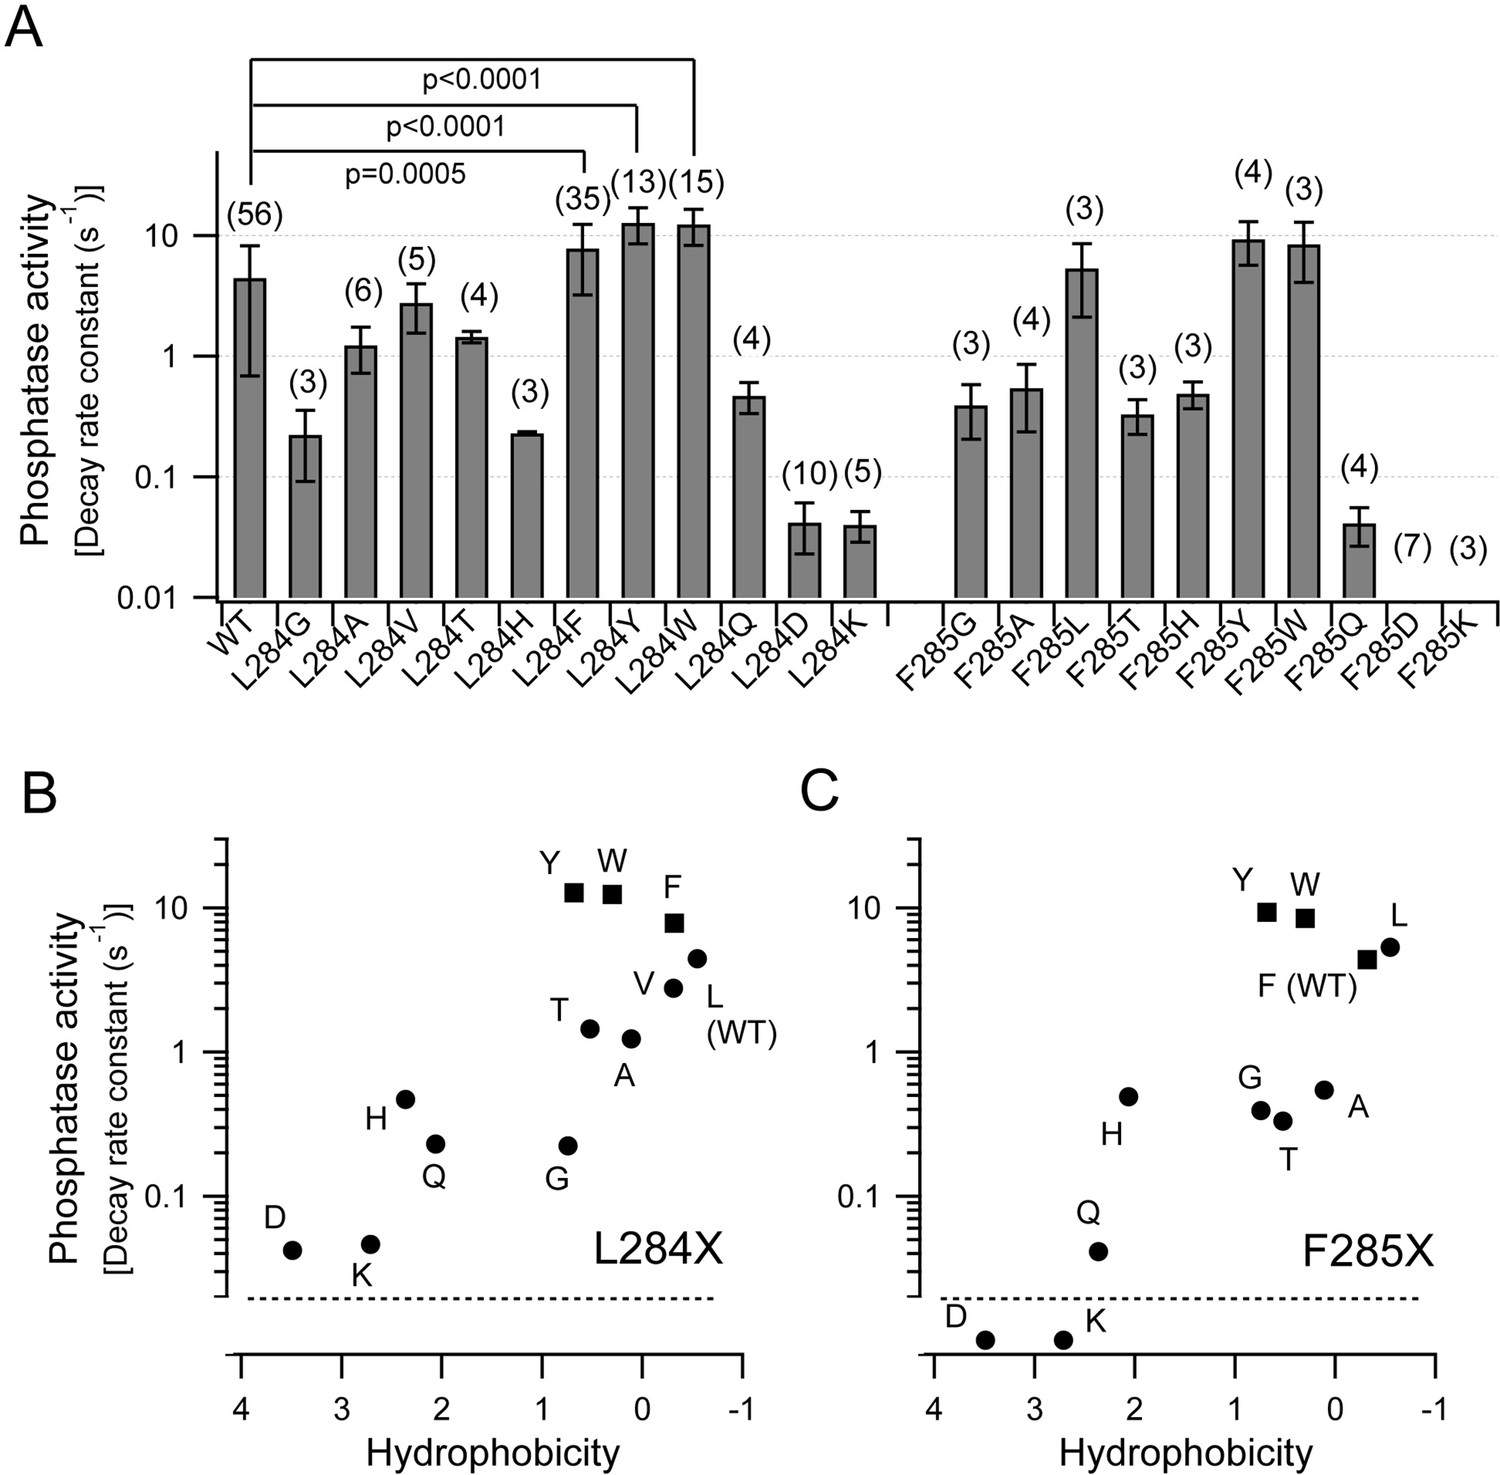
Voltage-dependent phosphatase activities of Ci-VSP depend on the hydrophobicity of the side chains of Leu-284 and Phe-285.
(A) The phosphatase activities of Ci-VSP with mutations in the hydrophobic spine. Decay rate constants of the normalized Kir current (Figure 4B and Figure 4—figure supplement 2) calculated by single exponential fitting are shown as phosphatase activities. Data are the mean ± S.D. from 3 to 56 oocytes. Values in brackets indicate the number of oocytes. Upper bars show p-values from a two-tailed Student’s t-test. (B and C) Phosphatase activities of Ci-VSP mutants at Leu-284 (B) or Phe-285 (C) plotted against the hydrophobicity of the amino acid side chains. The values of voltage-dependent phosphatase activities are from A. Hydrophobicity values are from Hessa et al. (2005).
-
Figure 5—source data 1
Numerical data that were used to generate the chart in Figure 5.
- https://doi.org/10.7554/eLife.41653.020
Figure 5—figure supplement 1
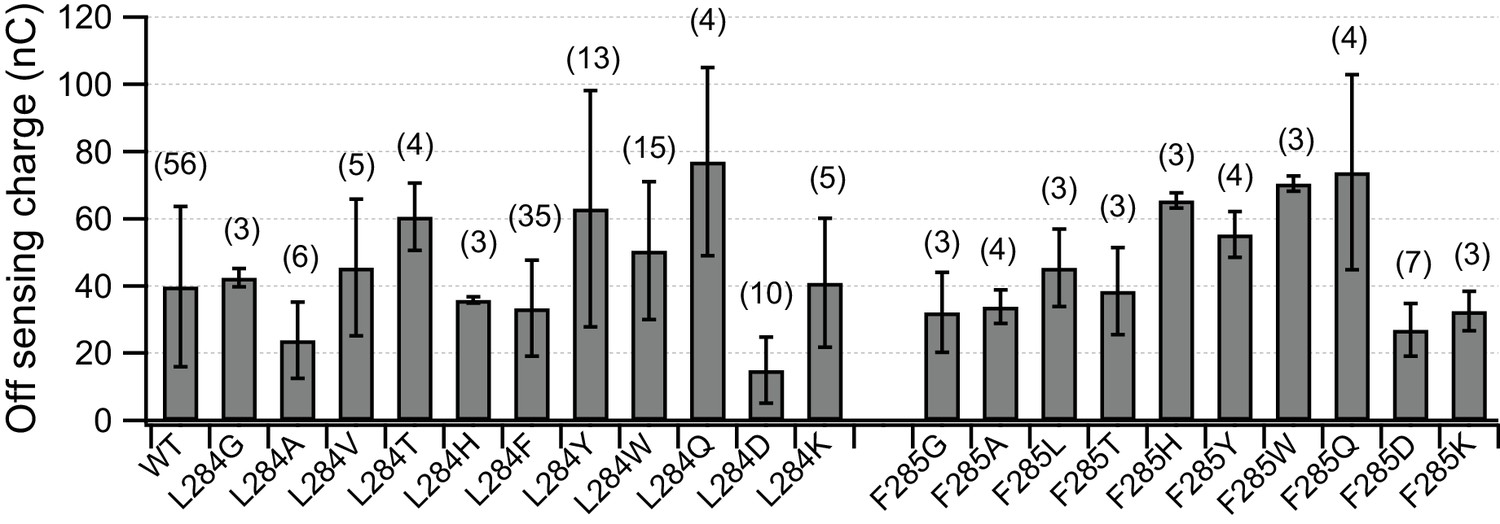
Cell surface expression levels of Ci-VSP constructs as examined by sensing charges.
Off-sensing charges of Ci-VSP mutants in each experiment corresponding to Figure 5A. Sensing currents are measured by repolarization step from 150 mV to holding potential (−60 mV) with a P/4–8 protocol for subtraction of leak current and symmetrical capacitative currents. Integrated observed transient current indicates off sensing charge. Data are the mean ± S.D. and the brackets show the number of cells.
Figure 5—figure supplement 2
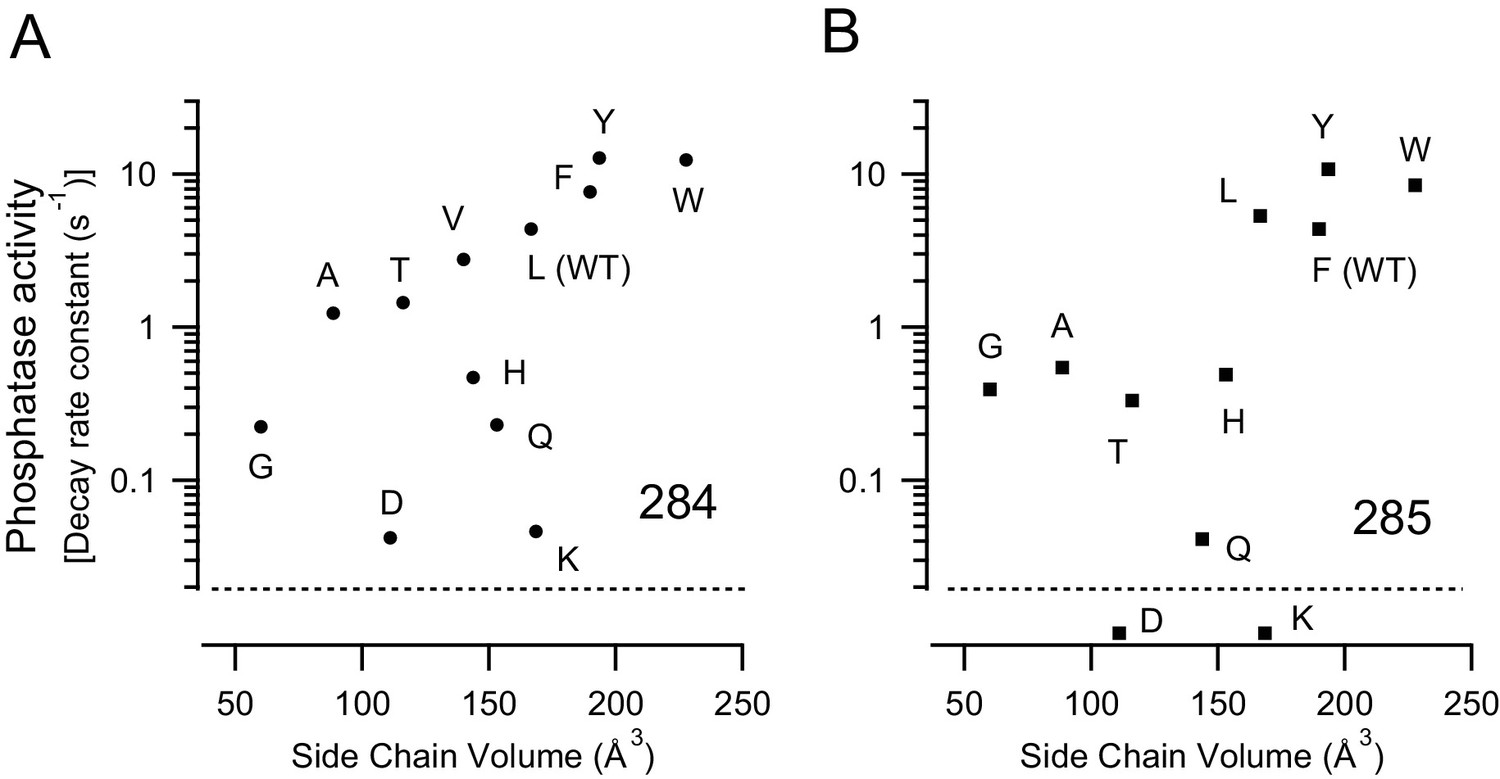
Little correlation between the voltage-dependent phosphatase activity and the side chain volume.
(A, B) The plots of phosphatase activities of Ci-VSP mutants at Leu-284 (A) or Phe-285 (B) against the side chain volume of amino acid. The values of voltage-dependent phosphatase activities and side chain volume are taken from Figure 5A and Zamyatnin (1972), respectively.
Figure 5—figure supplement 3
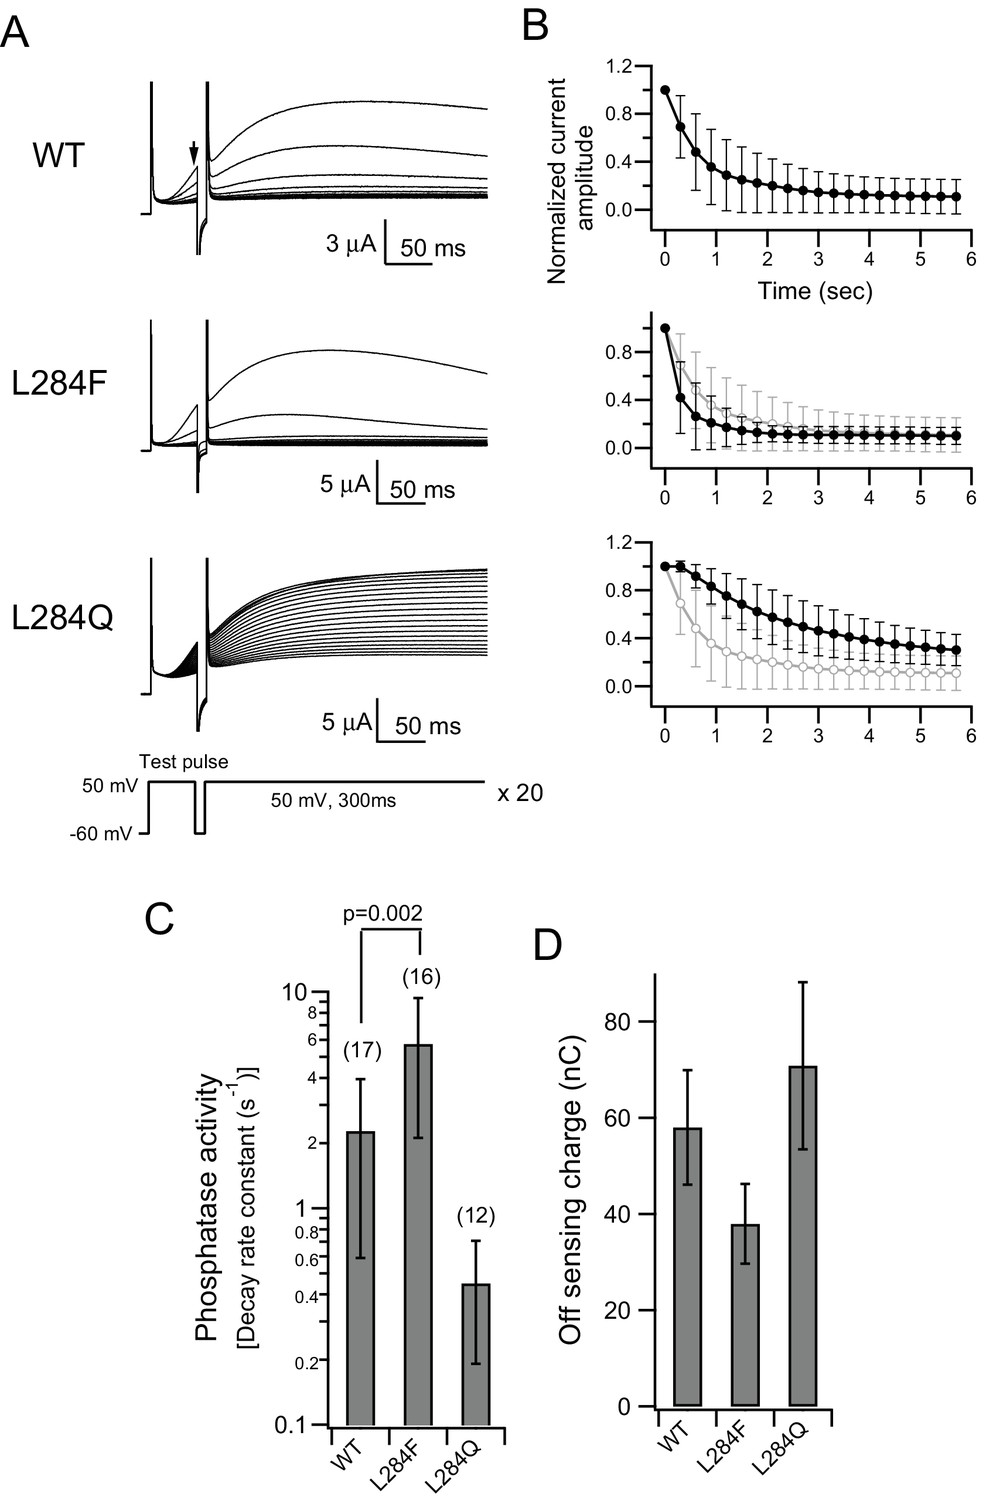
Voltage dependent phosphatase activities of Ci-VSP mutants examined with voltage-gated K+ channel, Kv7.2/7.3.
(A) Representative current traces of PI(4,5)P2 sensitive voltage-gated K+ channel [Kv7.2/7.3 (KCNQ2/3)] co-injected with Ci-VSP WT, L284F, L284Q in Xenopus oocytes. Pulse protocols (bottom panel) are a 50 ms test pulse (50 mV), then a 300 ms depolarization pulse (50 mV), repeated 20 times. All current traces are superimposed. Holding potential was at −60 mV. KCNQ2/3 currents were observed in test pulses and the current amplitude indicated the relative amount of PI(4,5)P2 in membrane. (B) Plots of time-dependent normalized current amplitudes of the outward K+ current at the end point of the test pulse. Values are normalized to the first trace current amplitude of the test pulse. Black lines show the plots from current traces of WT, L284F and L284Q, respectively. Gray lines show the plots from WT, which is the same trace of the top one. Symbols are the mean ± S.D. of data from 12 to 17 different oocytes (WT: n = 17, L284F: n = 16, L284Q: n = 12). (C) Comparison of the phosphatase activities of Ci-VSP mutants. Decay rate constants of normalized KCNQ2/3 currents calculated by single exponential fitting are defined as phosphatase activities. Data are the mean ±S.D. of data from 12 to 17 different oocytes. Values in brackets indicate the number of measured oocytes. Upper bars show p-value of two-tailed Student’s t-test. (D) Off-sensing charges of Ci-VSP mutants at 150 mV in each experiment corresponding to C, which indicate expression level. Sensing currents are measured by a repolarization step from 150 mV to holding potential (−60 mV) with a P/4–8 protocol for subtracting leak current and symmetrical capacitative currents. Integrated observed transient current indicates off-sensing charge. Data are the mean ± S.D.
Figure 6
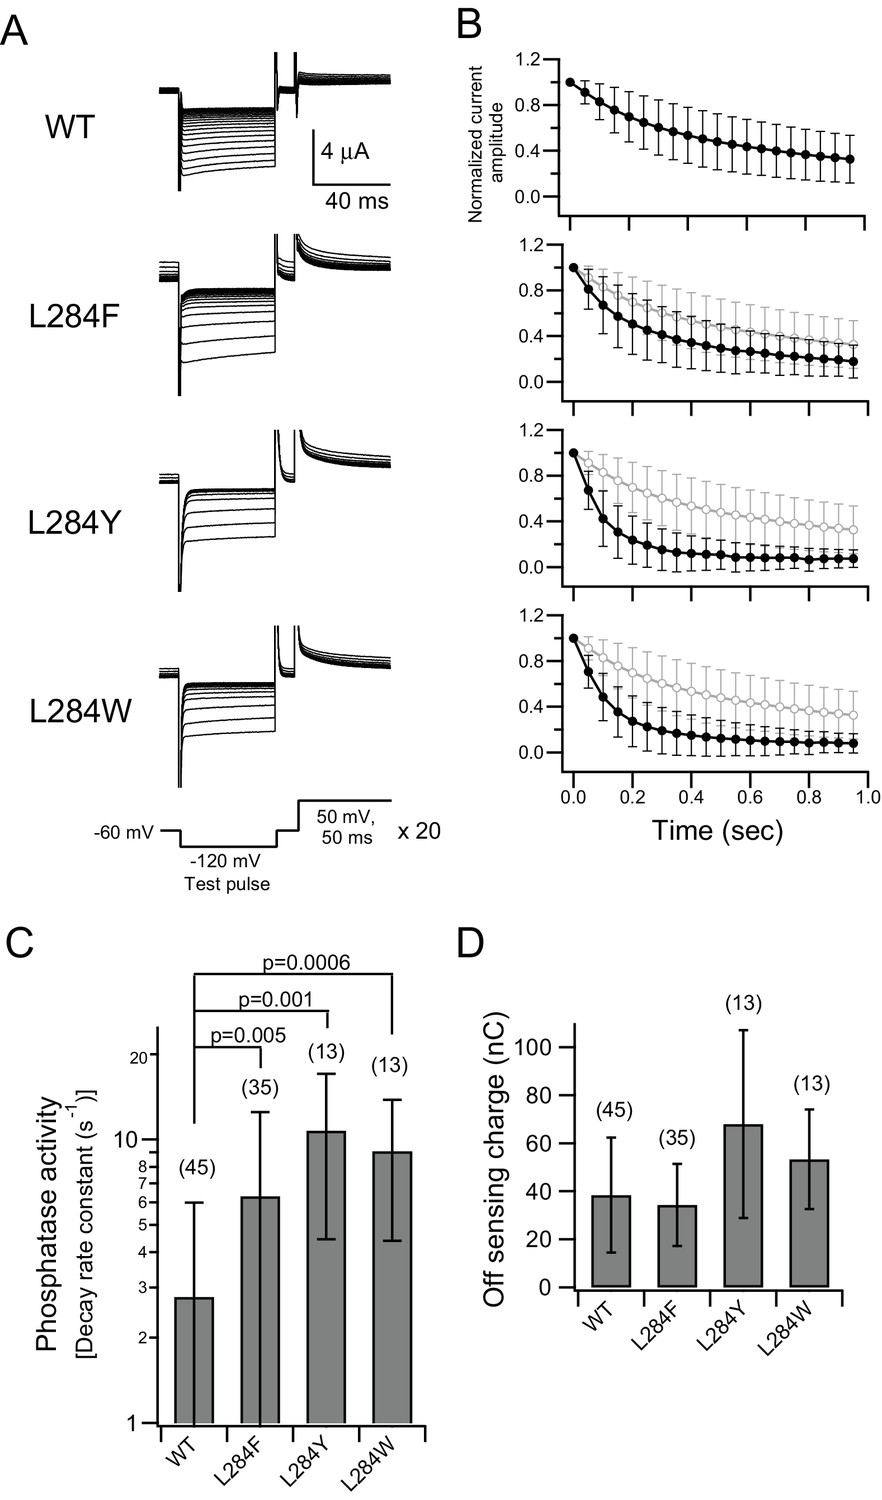
Addition of an aromatic ring to the hydrophobic spine enhances voltage-dependent enzymatic activity.
(A) Representative current traces of a PI(4,5)P2-sensitive K+ channel (Kir3.2d, GIRK2) coexpressed with Ci-VSP WT, L284F, L284Y, and L284W in Xenopus oocytes. Pulse protocols (bottom panel) are a 50 ms test pulse and then 50 ms depolarization pulses (50 mV) repeated 20 times. All current traces are superimposed. The holding potential was maintained at −60 mV. Kir currents were observed during the test pulses, and the current amplitude indicated the relative amount of PI(4,5)P2 in the membrane. (B) Plots of time-dependent normalized current amplitudes of the inward K+ currents at the end point of the test pulse. Values were normalized to the first trace current amplitude of the test pulse. Black lines show the plots from current traces of WT, L284F, L284Y, and L284W. Gray lines show the plot from the WT, which is the same trace as that shown at the top. Symbols show the mean ± S.D. of data from 13 to 45 different oocytes (WT: n = 45, L284F: n = 35, L284Y: n = 13, L284W: n = 13). (C) The phosphatase activities of Ci-VSP mutated with aromatic amino acids at Leu-284. Decay rate constants of the normalized Kir current calculated by single exponential fitting are shown as phosphatase activities. Data are the mean ± S.D. from 13 to 45 oocytes. Values in brackets indicate the number of measured oocytes. Upper bars show p-values from a two-tailed Student’s t-test. (D) Off-sensing charges of Ci-VSP mutants in each experiment corresponding to C, indicating expression levels at the cell surface. Sensing currents were measured by a repolarization step from 150 mV to holding potential (−60 mV), with a P/4–8 protocol used for subtracting leak currents and symmetrical capacitative currents. The integrated observed transient current indicates off-sensing charge. Data are the mean ± S.D. from 13 to 45 oocytes.
-
Figure 6—source data 1
Numerical data that were used to generate the chart in Figure 6B,C,D.
- https://doi.org/10.7554/eLife.41653.022
Figure 7
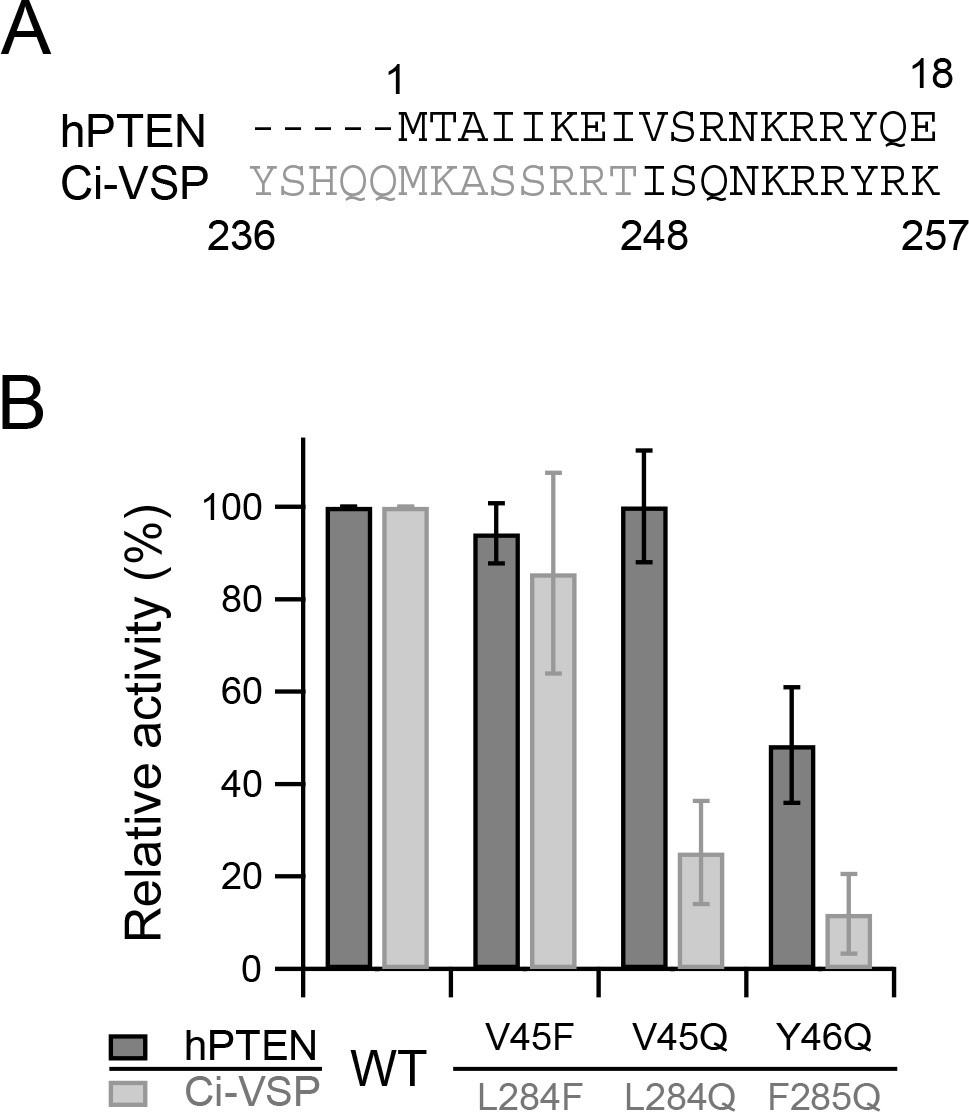
In vitro phosphatase activity of the isolated cytoplasmic catalytic region of Ci-VSP.
(A) Amino acid sequences of hPTEN and the initiating region of the phosphatase domain of Ci-VSP. The regions of proteins used in the in vitro phosphatase activity assay are shown in black letters (full-length PTEN and the cytoplasmic catalytic region of Ci-VSP [248–576]). (B) Relative phosphatase activities of recombinant hPTEN mutants (WT, V45F, V45Q, and Y46Q) and Ci-VSP mutants (WT, L284F, L284Q, and F285Q) determined by a malachite green assay with di-C16-PI(3,4,5)P3 and di-C16-PI(4,5)P2, respectively. Error bars indicate S.D. (hPTEN: n = 6, Ci-VSP: n = 9). The values are normalized to the amount of released phosphate by hPTEN WT or Ci-VSP WT, respectively.
-
Figure 7—source data 1
Numerical data that were used to generate the chart in Figure 7B.
- https://doi.org/10.7554/eLife.41653.024
Figure 8 with 5 supplements
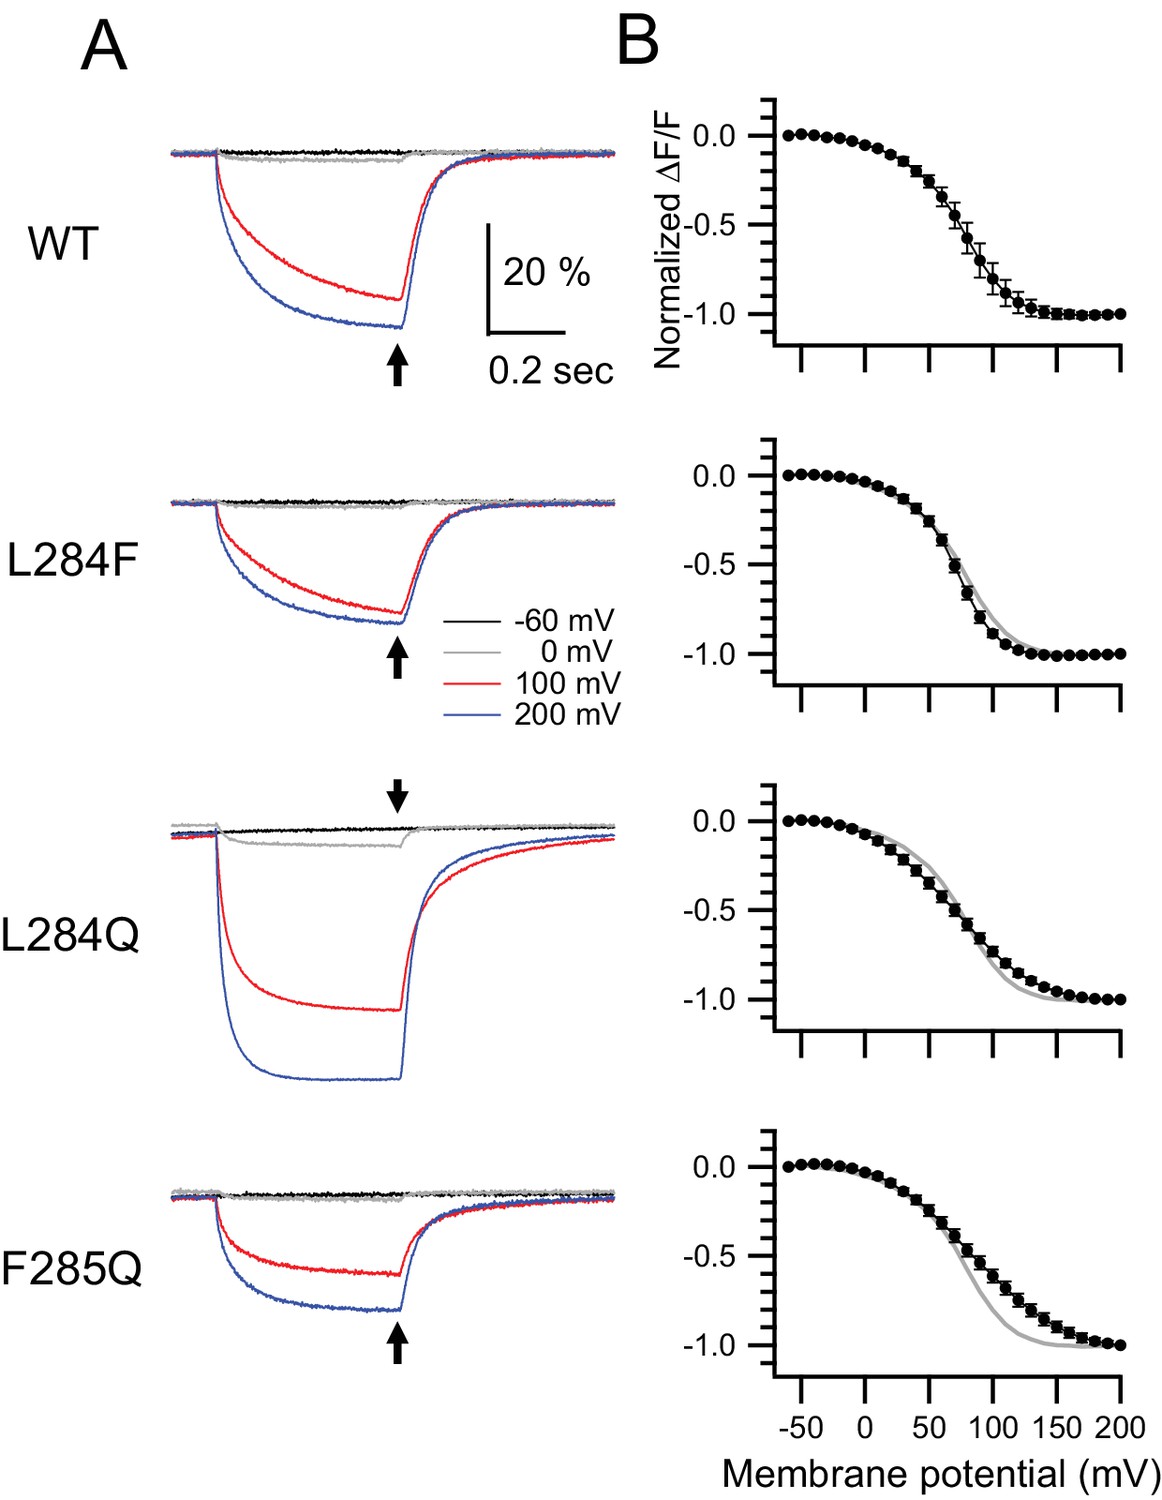
Retrograde effects on voltage sensor domain motion by mutations in the hydrophobic spine.
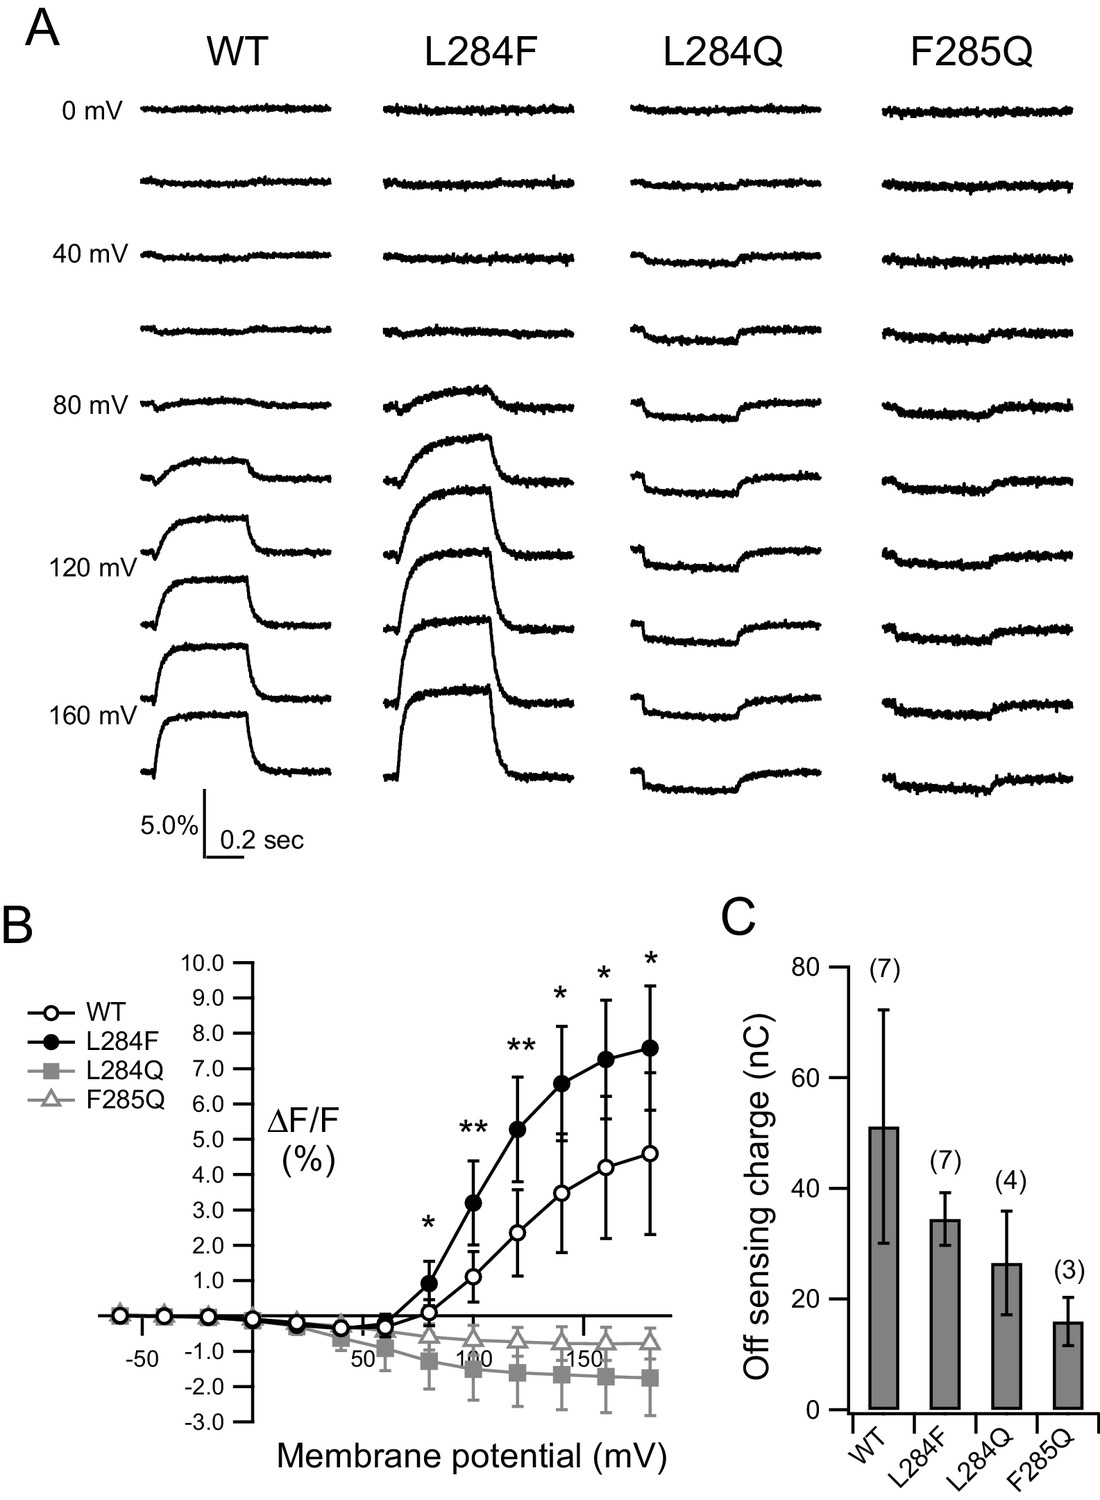
Voltage-clamp fluorometry of Ci-VSP and its hydrophobic spine mutants labeled by TMRM at Gly-214 on the S3-S4 linker of the voltage sensor domain. (A) Representative fluorescence changes of Ci-VSP WT, L284F, L284Q, and F285Q, with G214C-TMRM measured using 500 ms depolarizing pulses. Black, gray, red, and blue lines show traces at −60, 0, 100, and 200 mV, respectively. The holding potential was maintained at −60 mV. Traces are normalized to the fluorescence level before depolarization. (B) Normalized fluorescence-voltage (F–V) relationship of Ci-VSP WT and mutants. The values at arrows in A were normalized to that at 200 mV and plotted. Error bars indicate S.D. (G214C-TMRM: WT: n = 6, L284F: n = 6, L284Q: n = 6, F285Q: n = 6).
-
Figure 8—source data 1
Numerical data that were used to generate the chart in Figure 8B.
- https://doi.org/10.7554/eLife.41653.031
Figure 8—figure supplement 1
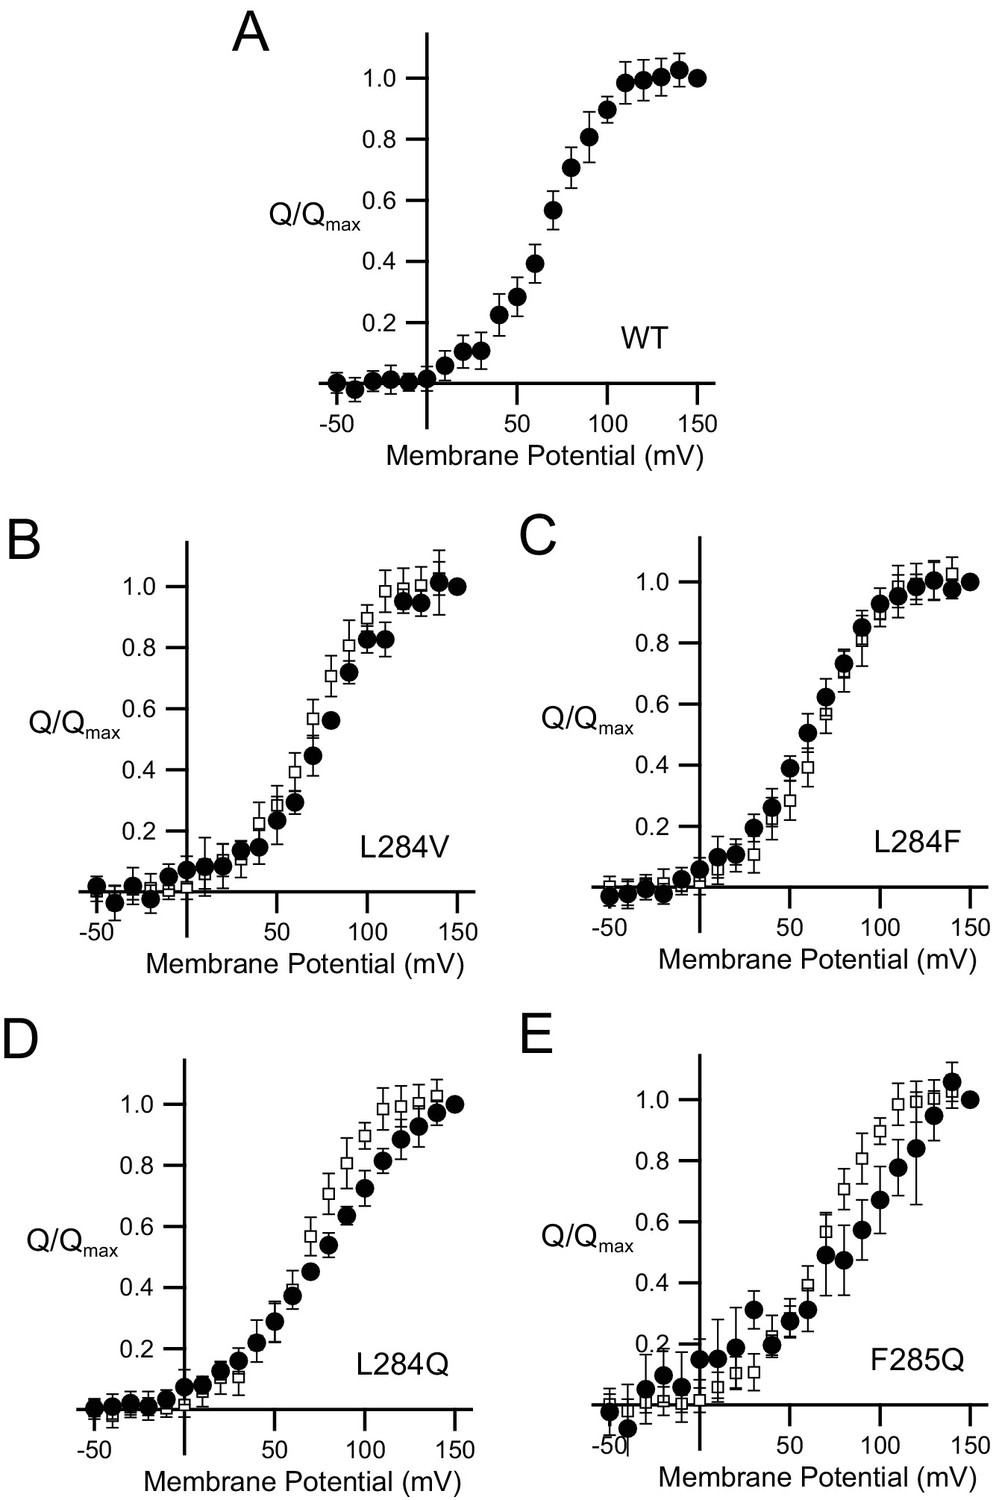
Charge-voltage relathionships of the voltage sensor domain.
Charge-Voltage relathionships of Ci-VSP WT (A), L284V (B), L284F (C), L284Q (D) and F285Q (E). The moved charges were estimated by the integration of off-sensing currents. All mutants were made in the background of the phosphatase inactive mutation (C363S). Black circles and blank squares are shown in mutants and WT, respectively. Error bars indicated S.D. (WT: n = 9, L284V: n = 6, L284F: n = 8, L284Q: n = 8 and F285Q n = 6).
Figure 8—figure supplement 2
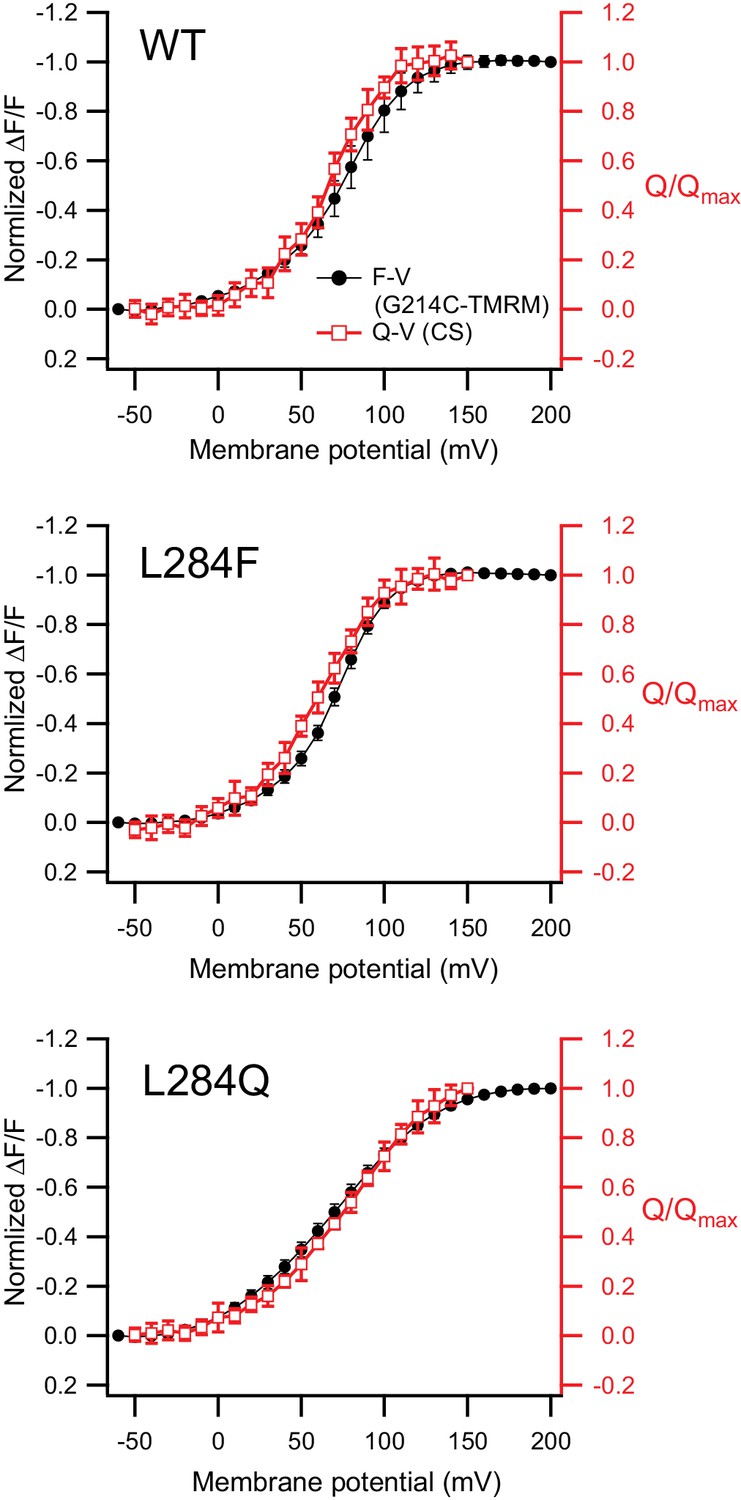
The fluoroscence-voltage relationships versus the charge-voltage relationships.
Comparison between charge-voltage relationships of Ci-VSP WT, L284F, L284Q (Red: curves are identical to Figure 8—figure supplement 1A, (C and D) and fluorescence-voltage (F–V) relationships of those constructs with G214C-TMRM (Black: curves are identical to Figure 8B).
Figure 8—figure supplement 3

Kinetic analysis of the voltage sensor motion by VCF (1).
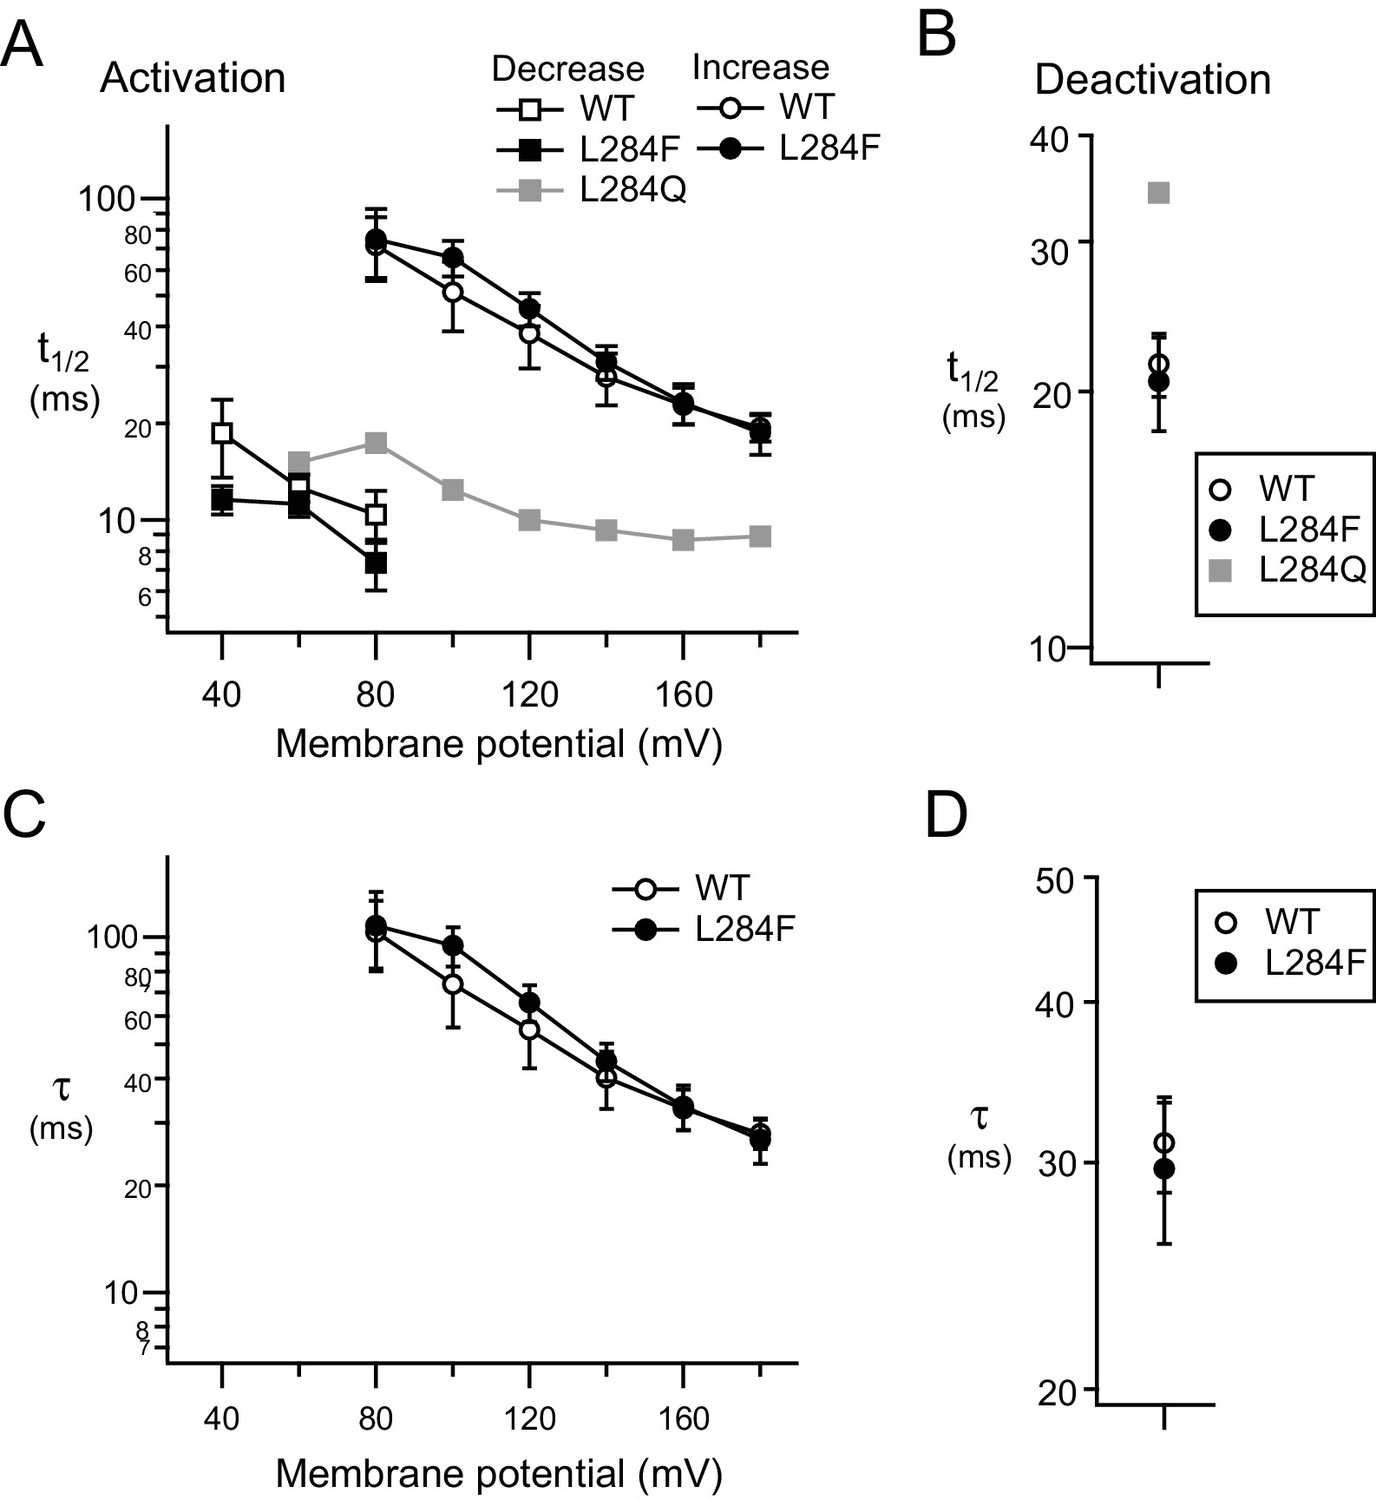
(A and B) Representative voltage-dependent fluorescence changes of Ci-VSP and mutants with G214C-TMRM. Voltage steps ranged from −100 to 200 mV in 10 mV increments. Holding potential was −60 mV. Black lines show the fluorescence changes of L284F (A) and L284Q (B), respectively. Gray lines show those of WT. Traces are normalized to the fluorescence level before depolarization. (C) Activation kinetics are shown as time to half of maximum fluorescence change (t1/2). White, black and gray symbols show t1/2 of WT, L284F and L284Q, respectively. Error bars indicate S.D. (WT: n = 3, L284F: n = 4, L284Q: n = 3). We also calculated time constant of fluorescence changes by single and double exponential fitting during depolarization pulse (121.5–600 ms) as shown in Figure 8—figure supplement 4A. (D) Deactivation kinetics are analyzed as time to half of maximum fluorescence change (t1/2) calculated from the fluorescence trace from 200 mV to holding potential. White, black and gray symbols show t1/2 of WT, L284F and L284Q, respectively. Error bars indicate S.D. (WT: n = 3, L284F: n = 4, L284Q: n = 3). We also calculated time constant of fluorescence changes by single (WT and L284F) or double exponential fitting (L284Q) after depolarization pulse (630–930 ms) as shown in Figure 8—figure supplement 4B.
Figure 8—figure supplement 4
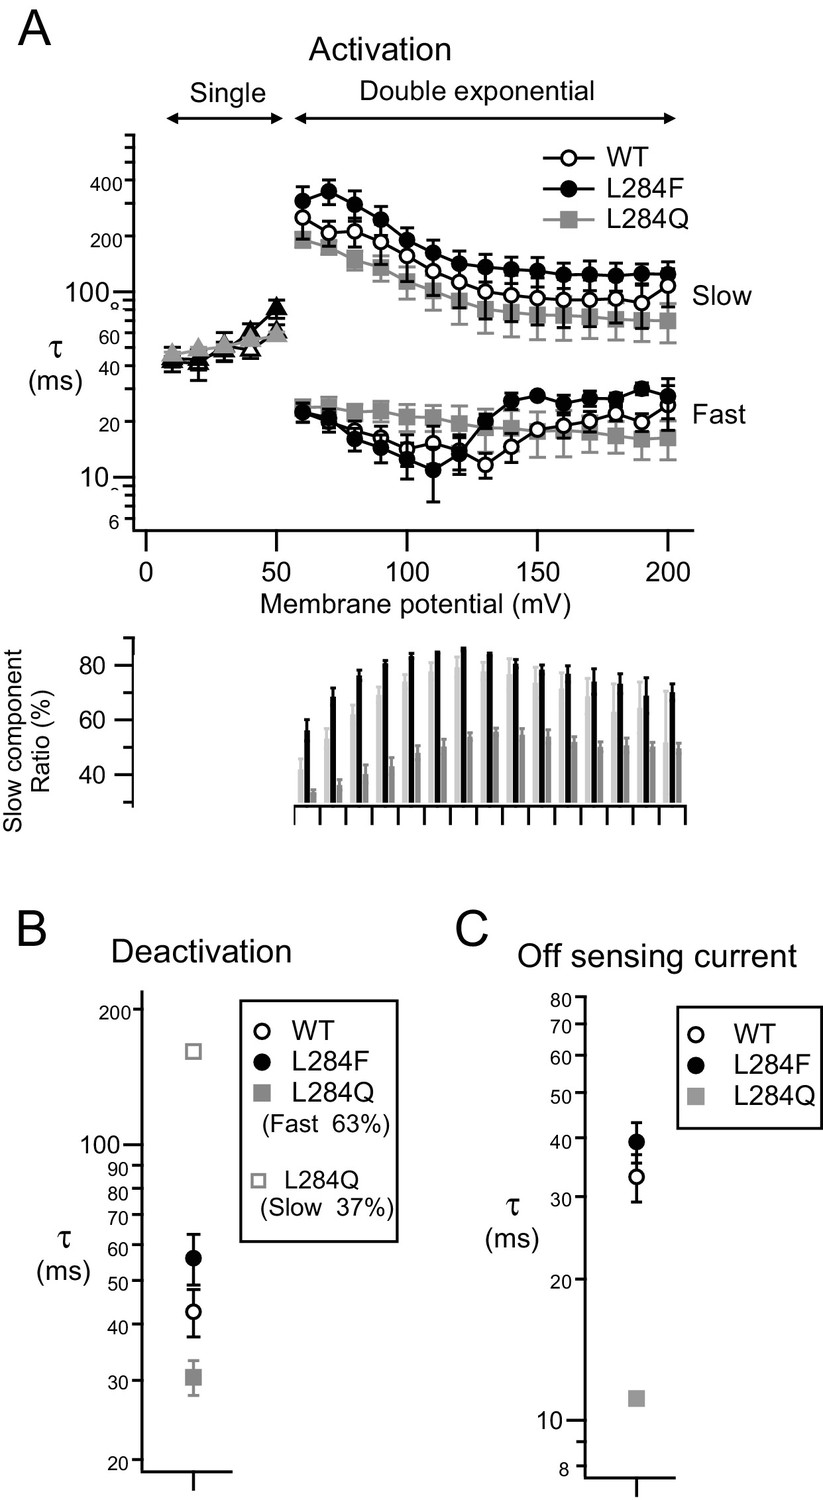
Kinetic analysis of the voltage sensor motion by VCF (2).
(A) On-time constants of fluorescence changes (Figure 8—figure supplement 3A and B) which were calculated by single (10 to 50 mV) and double exponential fitting (>60 mV) during depolarization pulse (121.5–600 ms). White, black and gray symbols show the time constants of WT, L284F and L284Q, respectively. Circles and rectangles indicate two time constants in fitting the time course of fluorescence change by double exponentials, respectively. Error bars indicate S.D. (WT: n = 3, L284F: n = 4, L284Q: n = 3). The bottom panel shows the ratio of the slow component versus total value. (B) Off-time constants of fluorescence changes (Figure 8—figure supplement 3A and B) which were calculated by single (WT and L284F) or double exponential fitting (L284Q) after depolarization pulse (630–930 ms). White, black and gray rectangles and a gray circle show the time constants of WT, L284F, L284Q (fast component, 63%) and L284Q (slow component, 37%), respectively. Error bars indicate S.D. (WT: n = 3, L284F: n = 4, L284Q: n = 3). (C) Off-time constants of sensing current measured from the same oocyte of (A) and (B) were calculated by single exponential fitting after depolarization pulse. White and black rectangles and a gray triangle show the time constants of WT, L284F and L284Q, respectively. Error bars indicate S.D. (WT: n = 3, L284F: n = 4, L284Q: n = 3).
Figure 8—figure supplement 5

Retrograde effects on voltage sensor motion by mutations with Q208C-TMRM on the S3-S4 linker.
Voltage-clamp fluorometry of Ci-VSP and three mutants labeled by TMRM at Qln-208 on the S3-S4 linker of the voltage sensor domain. (A) Representative fluorescence traces of Ci-VSP WT, L284F, L284Q and F285Q with Q208C-TMRM recorded with 500 ms depolarizing pulses. Black, gray, red and blue lines show the traces at −60, 0, 100 and 200 mV, respectively. Holding potential was −60 mV. Traces are normalized to the fluorescence level before depolarization. (B) Normalized fluorescence-voltage (F–V) relationships of Ci-VSP WT and mutants. The values at arrows in A were normalized to that in 30 mV and plotted. Error bars indicate S.D. (WT: n = 3, L284F: n = 3, L284Q: n = 3, F285Q: n = 4).
Figure 9 with 2 supplements
Detection of voltage-dependent conformational changes in the cytoplasmic catalytic region of VSP using an unnatural fluorescent amino acid, Anap.
(A) Representative voltage-dependent fluorescence changes of an unnatural amino acid, Anap, incorporated at Lys-555 with mutations in the hydrophobic spine (WT, L284F, L284Q, and F285Q), measured with 500 ms depolarizing pulses ranging from 0 to 180 mV in 20 mV increments. The holding potential was maintained at −60 mV. Traces are normalized to the fluorescence level before depolarization. (B) Fluorescence-voltage (F–V) relationships of Ci-VSP WT and mutants. Values at the end point of test pulse in A were plotted. Black blank circles, black circles, gray squares, and gray blank triangles show the fluorescence changes of WT, L284F, L284Q, and F285Q, respectively. Error bars indicate S.D. (WT: n = 7, L284F: n = 7, L284Q: n = 4, F285Q: n = 3). The statistical significance of differences between WT and L284F were evaluated by a two-tailed Student’s t-test (*: p<0.05, **: p<0.005). (C) Sensing charges calculated from the off-sensing current measured following the 160 mV depolarizing step. The data were collected from the same oocytes described in B. Error bars indicate S.D., and the brackets show the number of experiments.
-
Figure 9—source data 1
Numerical data that were used to generate the chart in Figure 9B,C.
- https://doi.org/10.7554/eLife.41653.035
Figure 9—figure supplement 1
Kinetic analysis of the cytoplasmic conformational changes as reported by the fluorescence of K555Anap.
(A) The time to half of maximum fluorescence changes (t1/2) of Anap on activation phase. White, black and gray symbols show the t1/2 of WT, L284F and L284Q, respectively. Circles and rectangles indicate the t1/2 of the large fluorescence increase and small fluorescence decrease, respectively. Error bars indicate S.D. (WT: n = 3, L284F: n = 4) and are not shown in L284Q (n = 2). (B) The t1/2 of Anap fluorescence changes upon membrane repolarization. White, black and gray show the t1/2 of WT, L284F, L284Q, respectively. Error bars indicate S.D. (WT: n = 3, L284F: n = 4) and are not shown in L284Q (n = 2). (C and D) On (C) and off (D) time constants of Anap fluorescence changes by single exponential fitting during and after depolarization pulse, respectively. Error bars indicate S.D. (WT: n = 3, L284F: n = 4). Because the fluorescence changes of L284Q were too small to be analyzed by exponential fitting, we could not show the time constants.
Figure 9—figure supplement 2
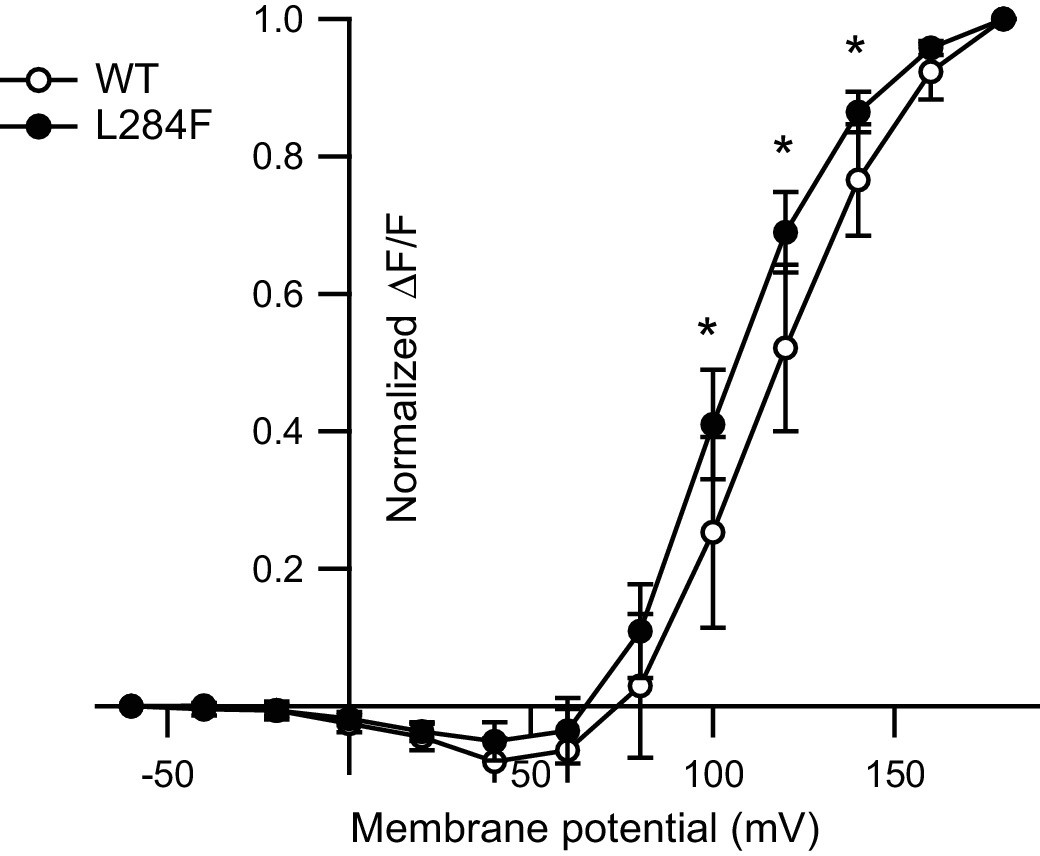
Addition of an aromatic residue to the hydrophobic spine caused leftward shift of the F-V relationship of Anap introduced into the C2 domain.
Normalized fluorescence-voltage (F–V) relationships of Ci-VSP WT and L284F with K555Anap. The curves are taken from Figure 9B and normalized to the value at 180 mV. Black blank and filled circles show the fluorescence changes of WT and L284F, respectively. Error bars indicate S.D. (WT: n = 7, L284F: n = 7). *: p<0.05 by two-tailed Student’s t-test.
Figure 10 with 2 supplements
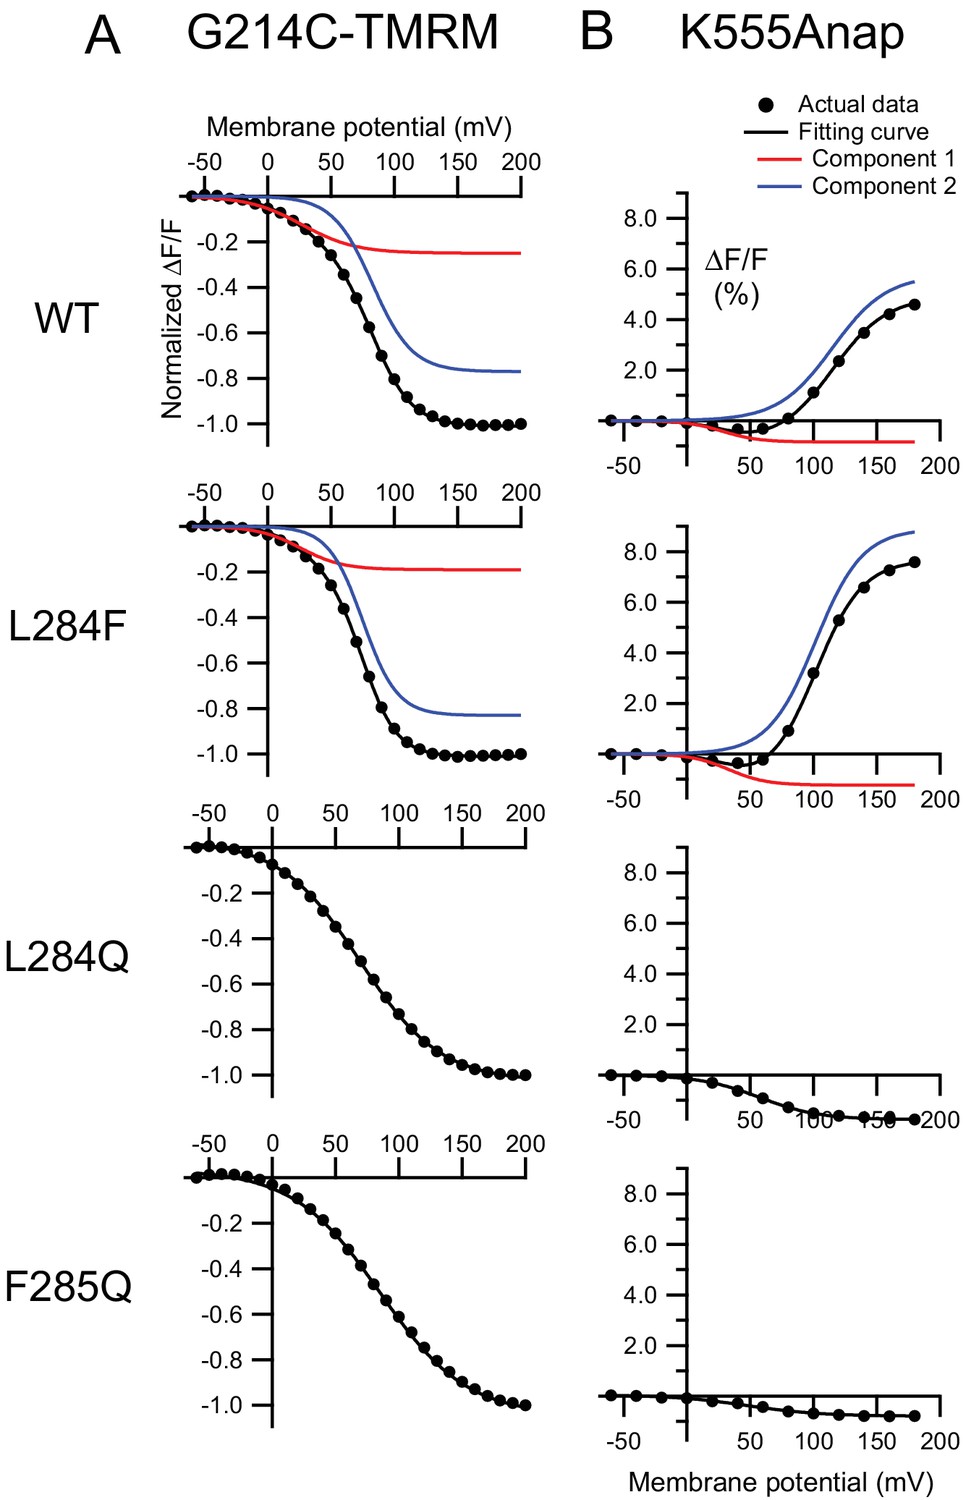
Voltage-dependent conformational changes in the VSD tightly link to those in the CCR.
Fluorescence-voltage relationships and fitting results of the Ci-VSP WT and mutants with different fluorescent probes [G214C-TMRM (A) or K555Anap (B) ]. F-V relationships from experimental data in Figure 8B or 9B (black circles) were fitted with one or the sum of two Boltzmann distributions (black solid line). Red and blue lines show individual two components fitted with the sum of two Boltzmann distributions. All fitting parameters and equations are shown in Table 2 and its legend.
-
Figure 10—source data 1
Numerical data that were used to generate the chart in Figure 10.
- https://doi.org/10.7554/eLife.41653.039
Figure 10—figure supplement 1
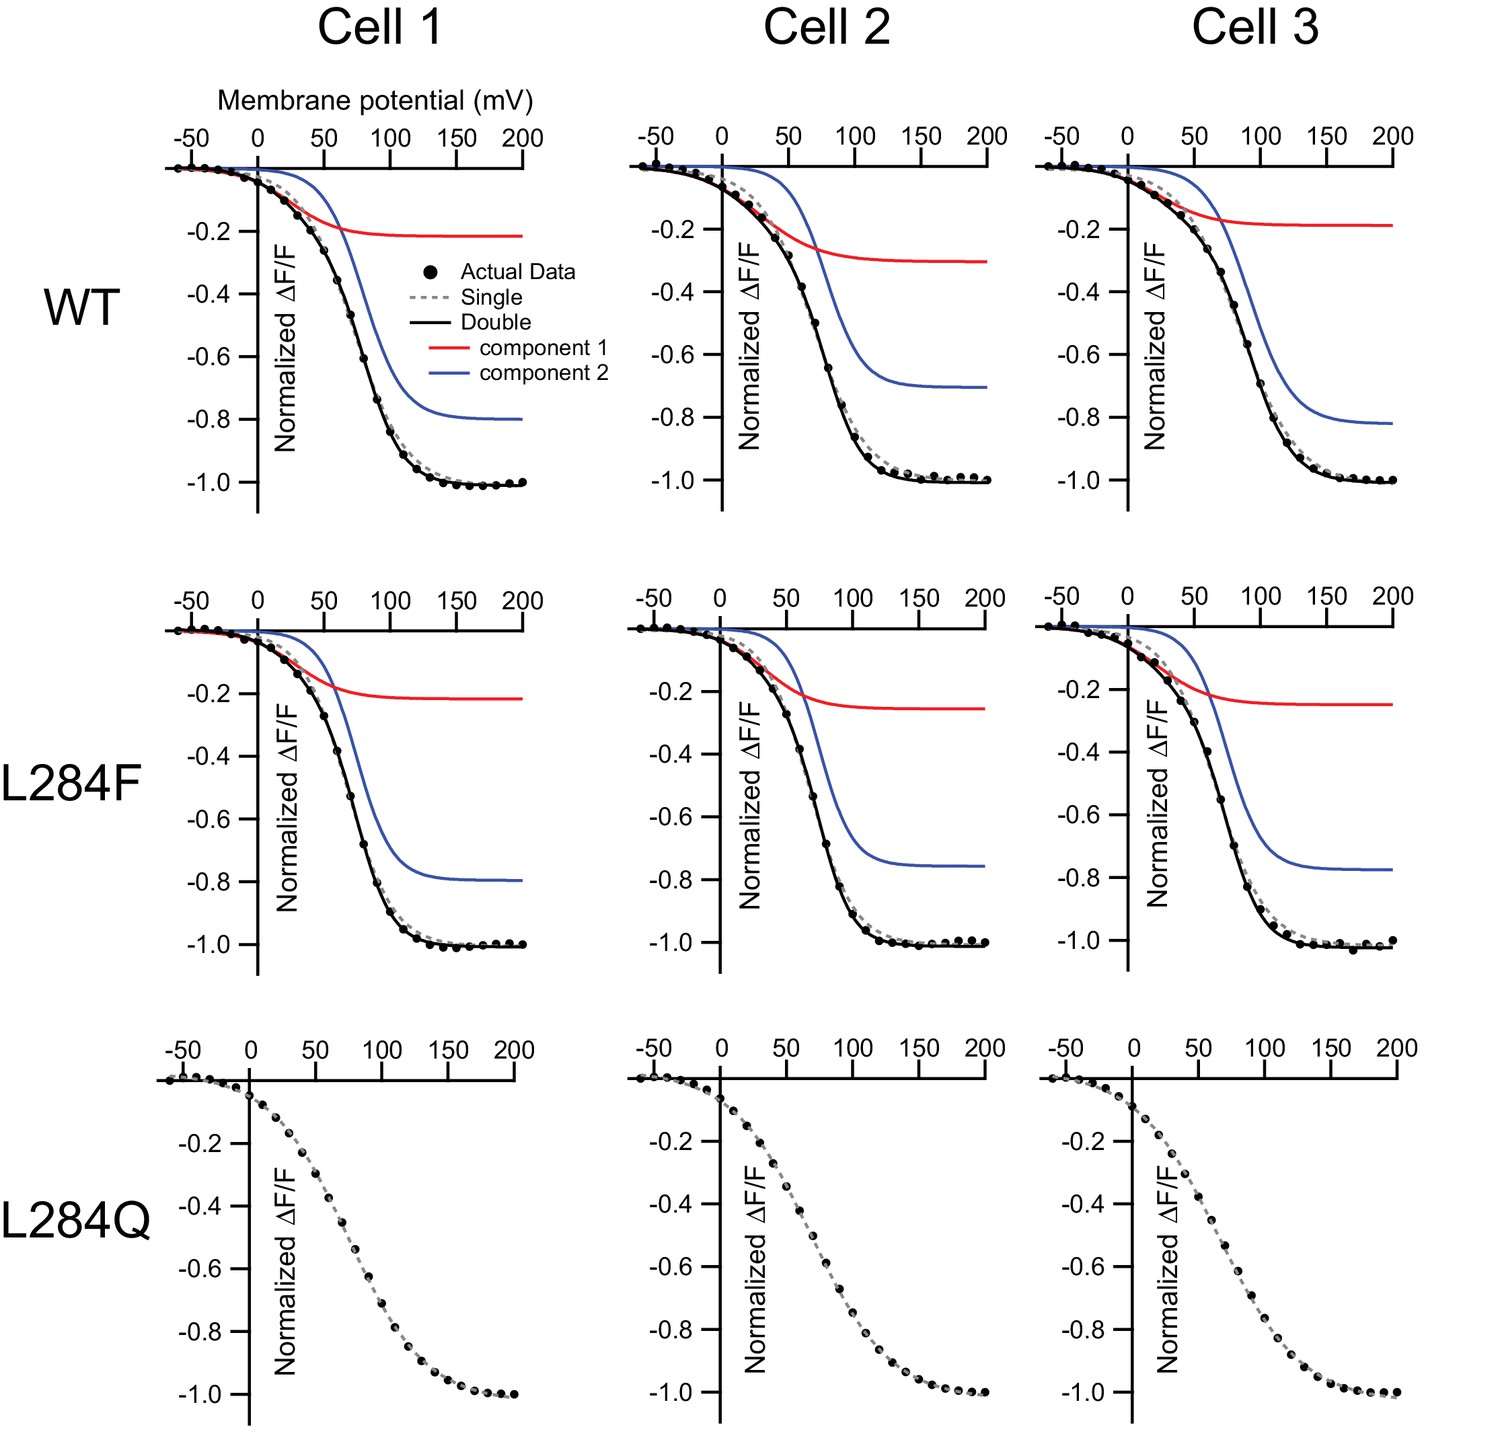
Fitting the F-V relationships with single or double Boltzmann distributions.
F-V relationships of Ci-VSP WT and mutants with G214C-TMRM from representative experimental data of three individual cells (black circles) were fitted by single (gray broken line) or two components of Boltzmann distribution (black lines), respectively. Red and blue lines show individual two components fitted by the sum of two Boltzmann distributions. In WT and L284F, experimental data were not well fitted by single Boltzmann distribution and better fitted by two components of Boltzmann distribution. On the other hand, the equation of single Boltzmann distribution was sufficient to fit the curve of L284Q (See also Table 2).
Figure 10—figure supplement 2

Evaluation of voltage-dependent cytoplasmic conformational changes in another two mutations at the hydrophobic spine using K555Anap .
Representative voltage-dependent fluorescence changes of K555Anap with mutations in the hydrophobic spine (WT, L284T and L284K), measured with 500 ms depolarizing pulses ranging from 0 to 180 mV in 20 mV increments. The holding potential was maintained at −60 mV. Traces are normalized to the fluorescence level before depolarization.
Figure 11 with 1 supplement
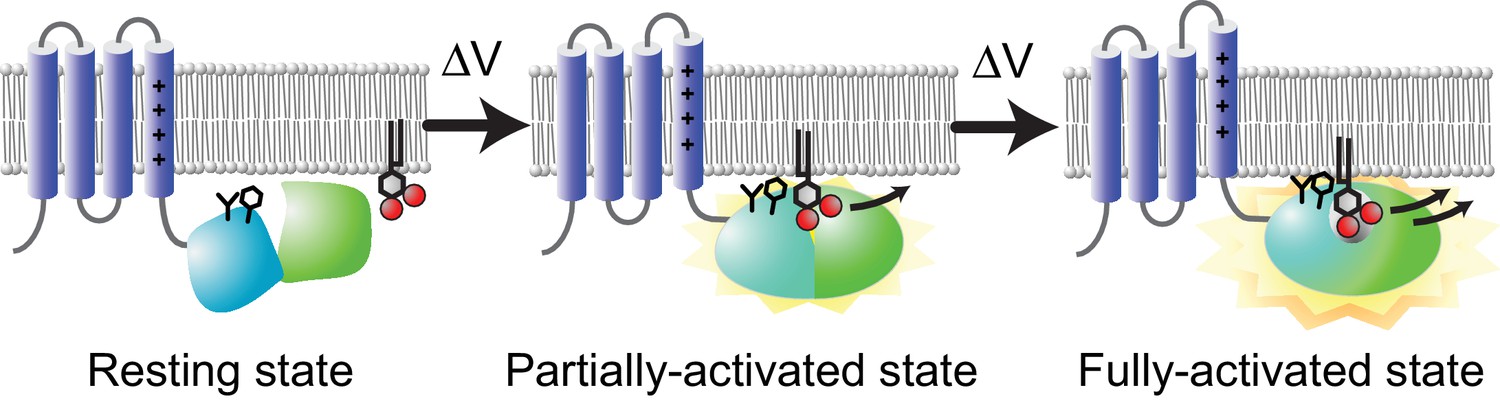
Schematic illustration of VSP activity: A model of two-step activation.
Two-step conformational and activity changes in VSP. The black sticks on the PD shows the hydrophobic spine consisting of amino acid side chains of Leu-284 and Phe-285. In the resting state (left), the PD (turquoise) forms no or weak interactions with the plasma membrane, which cannot catalyze the substrate. At low membrane voltages (middle), the PD is pulled to the membrane by the partially activated VSD (blue), which shows low phosphatase activity. At higher membrane voltages, the VSD is fully activated, and the PD is tightly anchored to the membrane surface, inducing high phosphatase activity. The weak enzyme activity at the middle state is consistent with the results of the Anap study of L284Q and L284K mutants which showed low enzyme activity (Figure 10—figure supplement 2).
Figure 11—figure supplement 1
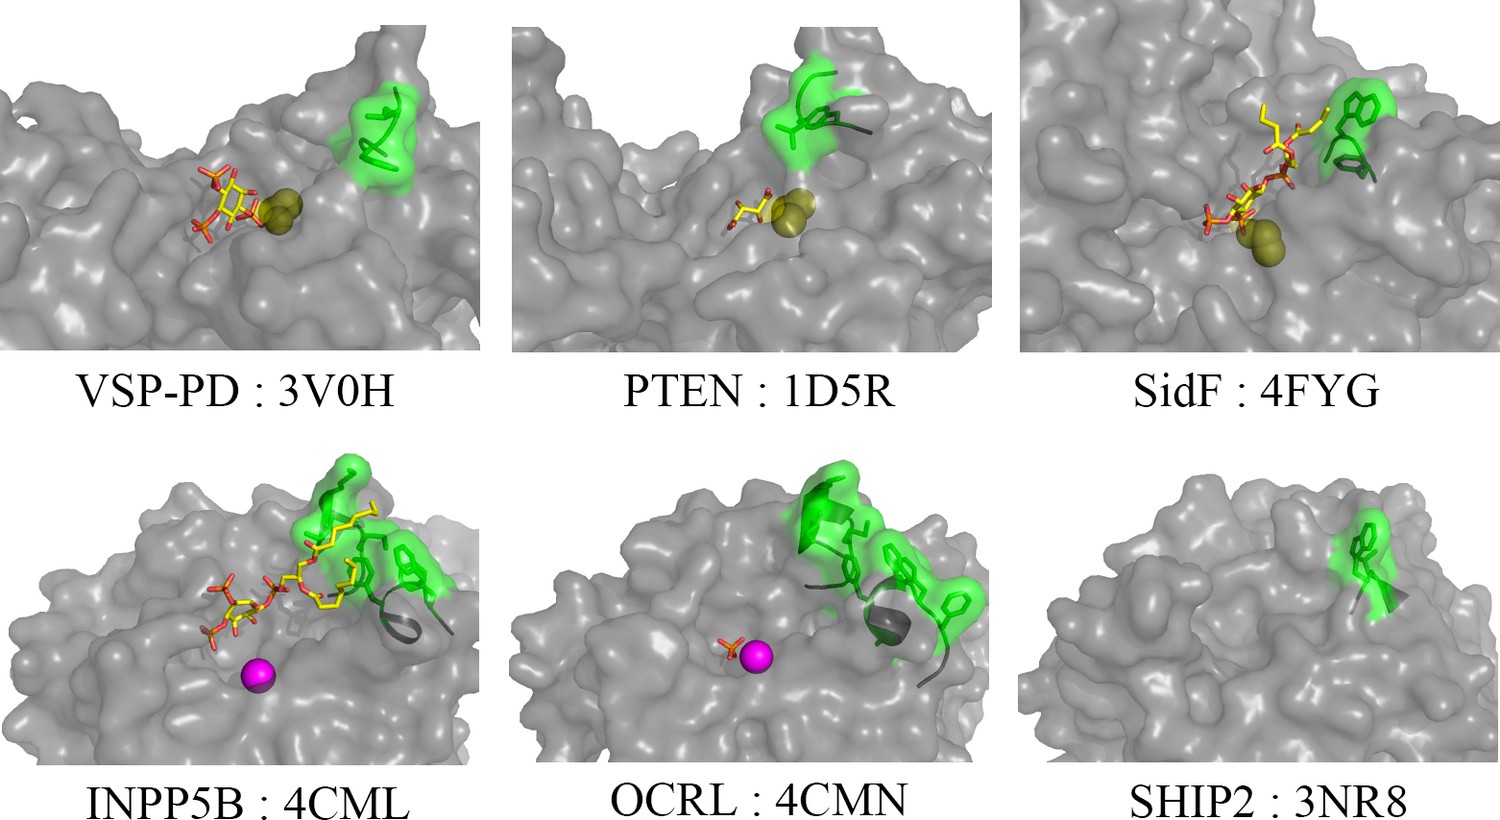
Membrane interface around PIPs binding region in various phosphoinositides phosphatases.
Green region shows the hydrophobic surface. Yellow and magenta balls show the reaction site, Cys (VSP, PTEN and SidF) and Mg2+ (INPP5B, OCRL), respectively. Sticks show the co-crystallized substances in the recognition site (VSP: IP3, PTEN: Tartrate, SidF: diC4-PI(3,4)P2, INPP5B: diC8-PI(3,4)P2, OCRL: phosphate).
Tables
Table 1
Summary table of simulations.
https://doi.org/10.7554/eLife.41653.003| Simulation ID | Bilayer composition | Duration | Initial position (nm) / orientation* | Time fraction (%) showing PD-bilayer binding† | Time fraction (%) showing C2-bilayer binding† | Time fraction (%) showing the productive orientation†,‡ |
|---|---|---|---|---|---|---|
| coarse-grained | ||||||
| cg_po_1a, b, c | 212 POPC | 3 × 2μs | −3.5 / C2K558 | 0.0, 0.0, 0.8 | 10.8, 0.0, 0.0 | 0.0, 0.0, 0.0 |
| cg_po_2a, b, c | 212 POPC | 3 × 2μs | −4.1 / LDR246 | 0.4, 0.0, 0.0 | 0.0, 0.0, 0.0 | 0.0, 0.0, 0.0 |
| cg_po_3a, b, c | 212 POPC | 3 × 2μs | −3.5 / PDK364, C2Y522 | 0.0, 0.0, 0.0 | 0.0, 0.0, 0.8 | 0.0, 0.0, 0.0 |
| cg_po_4a, b, c | 212 POPC | 3 × 2μs | −3.5 / PDK427, PDY429 | 0.0, 0.0, 0.0 | 0.0, 0.2, 0.0 | 0.0, 0.0, 0.0 |
| cg_po_5a to h | 212 POPC | 8 × 1μs | −1.6 / LDR246, C2K558 (prebound) | 4.4, 8.4 § | 45.8, 99.6 § | 2.8, 3.6 § |
| cg_po_pi_1a, b, c | 208 POPC/4 PI(3,4,5)P3 | 3 × 2μs | −4.0 / C2K558 | 95.8, 86.6, 93,4 | 95.2, 12.8, 44.7 | 71.7, 0.4, 34.7 |
| cg_po_pi_2a, b, c | 208 POPC/4 PI(3,4,5)P3 | 3 × 2μs | −4.0 / LDR246 | 99.6, 93.6, 97.6 | 5.0, 57.1, 38.7 | 3.8, 33.3, 3.2 |
| cg_po_pi_3a, b, c | 208 POPC/4 PI(3,4,5)P3 | 3 × 2μs | −4.0 / PDK364, C2Y522 | 78.8, 86.6, 72.9 | 50.7, 48.7, 98.8 | 30.7, 27.3, 34.7 |
| cg_po_pi_4a, b, c | 208 POPC/4 PI(3,4,5)P3 | 3 × 2μs | −3.5 / PDK427, PDY429 | 83.2, 89.8, 90.6 | 13.0, 4.6, 28.9 | 0.0, 3.4, 7.4 |
| Atomistic | ||||||
| at_po_1 | 212 POPC | 100ns | −2.6 / LDR246, C2K558 | 42.2 | 97.1 | 42.2 |
| at_po_2 | 212 POPC | 100ns | −2.6 / LDR246, C2K558 | 92.5 | 99.0 | 51.0 |
| at_po_3 | 212 POPC | 100ns | −2.6 / LDR246, C2K558 | 97.2 | 98.2 | 97.2 |
| at_po_4 | 212 POPC | 100ns | −3.2 / LDR246, C2K558 | 98.5 | 99.5 | 97.5 |
| at_po_5 | 212 POPC | 100ns | −3.2 / LDR246, C2K558 | 10.4 | 85.1 | 0.0 |
| at_po_6 | 212 POPC | 100ns | −3.2 / LDR246, C2K558 | 0.5 | 90.7 | 0.0 |
| at_po_pi_0 ¶ | 208 POPC/4 PI(3,4,5)P3 | 100ns | −2.5 / PDR281, C2K558 | 97.9 | 39.1 | 39.1 |
| at_po_pi_1 | 208 POPC/4 PI(3,4,5)P3 | 100ns | −3.1 / LDR246, C2K558 | 86.1 | 81.2 | 60.9 |
| at_po_pi_2 | 208 POPC/4 PI(3,4,5)P3 | 100ns | −3.1 / LDR246, C2K558 | 91.1 | 31.2 | 28.2 |
| at_po_pi_3 | 208 POPC/4 PI(3,4,5)P3 | 100ns | −3.4 / LDR246, C2K558 | 79.7 | 89.1 | 77.2 |
| at_po_pi_4 | 208 POPC/4 PI(3,4,5)P3 | 100ns | −3.4/ LDR246, C2K558 | 0.0 | 80.0 | 0.0 |
| at_po_pi_5 | 208 POPC/4 PI(3,4,5)P3 | 100ns | −3.1 / PDR281, C2K516 | 94.5 | 19.9 | 17.9 |
| at_po_pi_6 | 208 POPC/4 PI(3,4,5)P3 | 100ns | −3.4 / PDR281, C2K516 | 84.1 | 95.5 | 83.6 |
| at_po_pi_7 | 208 POPC/4 PI(3,4,5)P3 | 100ns | −3.4 / PDR281, C2K516 | 85.1 | 98.1 | 84.6 |
| at_steered | 208 POPC/4 PI(3,4,5)P3/ 212 POPC, | Two runs named POPC/PI(3,4,5)P3_1 and 2 were started with structures sampled from at_po_pi_5 and POPC_1 and 2) were with two structures from at_po_4.# | ||||
-
*The protein position is represented by the z-position (i.e., the positions along the z-axis, which is parallel to the membrane normal) of the center of mass of the protein relative to the phosphorus layer. Orientation is represented by the domain name [C2, PD or VSD-PD linker (LD)] along with, in superscript, the residue initially located the nearest to the bilayer. 'PDK364, C2Y522' for example, represents that both Tyr-522 of the C2 domain and Lys-364 of the PD were equally close to the bilayer.
†For the CG sets, three values correspond to the three independent runs (a,b and c).
-
‡The fraction of the time period showing not only the productive orientation but also the binding of the both the PD and C2 domain is shown.
§The results of two representative runs are shown.
-
¶Initial structure was prepared mimicking the structure sampled from cg_po_pi_1a. In this run, both domains were initially set bound to the POPC/PI(3,4,5)P3 bilayer, but the C2 domain detached from and the PD remained bound to the bilayer.
#The legend for Figure 2—figure supplement 6 has more detail.
Table 2
Fitting parameters of fluorescence-voltage relationships of Ci-VSP G214C-TMRM and K555Anap.
F-V curves (Normalized ΔF/F or ΔF/F vs voltage) shown in Figure 10 were fitted by single or two components of Boltzmann distribution, F(V)=A/[1 + exp((V-V1/2)/slope] or F(V) = A1/[1 + exp((V-V1/2,1)/slope1] + A2/[1 + exp((V-V1/2,2)/slope2]. Where, ‘A’ is the amplitude of each component, ‘V’ is the membrane potential for test pulse, ‘V1/2' is the half-maximum potential, ‘slope’ is the steepness of the curve. In the case of G214C-TMRM, ‘Ratio’ in this table is calculated by A1/(A1+A2) or A2/(A1+A2). In K555Anap, ‘A’ in this table indicates the absolute fluorescence change of each component. All data are shown as mean ± S.D. The statistical significance of differences were evaluated by a two-tailed Student’s t-test
| G214C-TMRM | Ratio (%) | V1/2 (mV) | N | |
|---|---|---|---|---|
| WT | component 1 | 24.3 ± 7.0 | 27.1 ± 4.3 | 6 |
| component 2 | 75.7 ± 7.0 | 82.7 ± 5.5a | ||
| L284F | component 1 | 18.6 ± 5.7 | 23.4 ± 6.6 | 6 |
| component 2 | 81.4 ± 5.7 | 75.1 ± 1.2a | ||
| L284Q | - | 69.2 ± 4.1 | 6 | |
| F285Q | - | 85.1 ± 4.4 | 6 | |
| K555Anap | A (%) | V1/2 (mV) | N | |
|---|---|---|---|---|
| WT | component 1 | −0.85 ± 0.48 | 28.3 ± 10.1 | 7 |
| component 2 | 5.76 ± 2.81b | 115.0 ±11.3c | ||
| L284F | component 1 | −1.23 ± 0.34 | 33.1 ± 4.3 | 7 |
| component 2 | 8.90 ± 1.92b | 101.6 ±3.9c | ||
| L284Q | −1.76 ± 1.08 | 57.2 ± 6.76 | 4 | |
| F285Q | −0.84 ± 0.46 | 47.3 ± 14.8 | 3 | |
-
a, p=0.026; b, p=0.046; c, p=0.028 by two-tailed Student’s t-test.
Key resources table
| Reagent type (species) or resource | Designation | Source or reference | Identifiers | Additional information |
|---|---|---|---|---|
| Gene (Ci.intestinalis) | Ci-VSP | Murata et al. (2005) (PMID: 15902207) | GeneBank ID: NM_001033826 | |
| Recombinant DNA reagent | human-PTEN (plasmid) | gift from Dr. Tomohiko Maehama | ||
| Recombinant DNA reagent | mouse-Kir3.2d (plasmid) | gift fom Dr. Yoshihisa Kurachi | ||
| Recombinant DNA reagent | rat-Kv7.2 (plasmid) | gift from Drs. David McKinnon and Koichi Nakajo | ||
| Recombinant DNA reagent | rat-Kv7.3 (plasmid) | gift from Drs. David McKinnon and Koichi Nakajo | ||
| Recombinant DNA reagent | bovine-Gbeta (plasmid) | Furukawa et al., 1998 (PMID: 9651354) | gift from Dr. Toshihide Nukada | |
Recombinant DNA reagent | bovine- Ggamma (plasmid) | Furukawa et al., 1998 (PMID: 9651354) | gift from Dr. Toshihide Nukada | |
| Recombinant DNA reagent | pAnap (plasmid) | Chatterjee et al., 2013 (PMID: 23924161) | Addgene: plasmid #48696 | Obtained from Dr. Peter G. Schultz through Addgene |
| Chemical compound, drug | 3-(6-acetylnaphthalen-2-ylamino)−2-aminopropanoic acid (Anap) | FutureChem | FC-8101 | |
| Chemical compound, drug | Biomol Green Reagent | ENZO Life Sciences | BML-AK111-0250 | |
| Chemical compound, drug | PtdIns-(4,5)-P2(1,2-dipalmitoyl) sodium salt (di-C16-PI(4,5)P2) | Cayman | 10008115 | |
| Chemical compound, drug | PtdIns-(3,4,5)-P3(1,2-dipalmitoyl) sodium salt (di-C16-PI(3,4,5)P3) | Cayman | 64920 | |
| Chemical compound, drug | 1-Palmitoyl-2-Oleoyl-sn-Glycero-3-(Phospho-L-Serine) sodium salt (POPS) | Avanti Polar Lipids | 840034C |
Additional files
-
Transparent reporting form
- https://doi.org/10.7554/eLife.41653.043
Download links
A two-part list of links to download the article, or parts of the article, in various formats.
Downloads (link to download the article as PDF)
Open citations (links to open the citations from this article in various online reference manager services)
Cite this article (links to download the citations from this article in formats compatible with various reference manager tools)
The hydrophobic nature of a novel membrane interface regulates the enzyme activity of a voltage-sensing phosphatase
eLife 7:e41653.
https://doi.org/10.7554/eLife.41653


