Stem cells repurpose proliferation to contain a breach in their niche barrier
- Howard Hughes Medical Institute, The Rockefeller University, United States
- Howard Hughes Medical Institute, Janelia Research Campus, United States
Figures
Figure 1 with 3 supplements
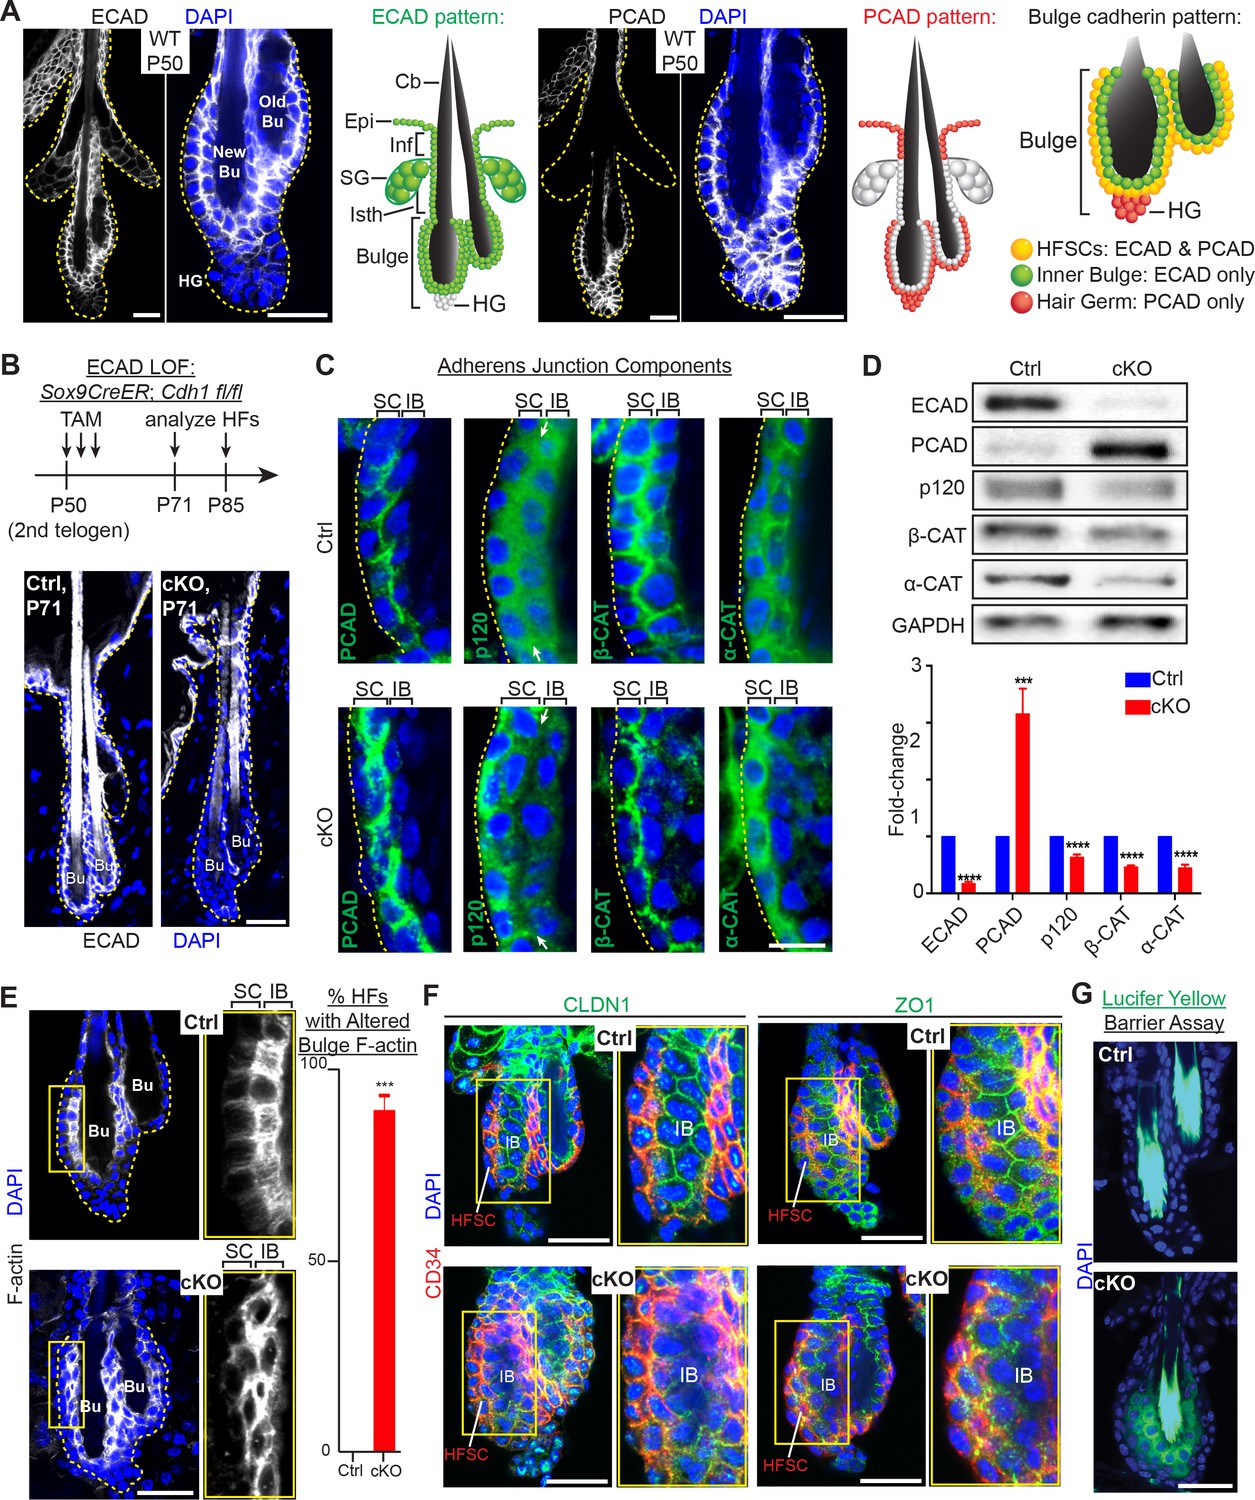
Adherens junctions in the niche but not its stem cells are affected by E-cadherin depletion.
Images are from whole-mount immunofluorescence microscopy; DAPI (blue) marks chromatin. Antibodies are color-coded. (A) E-cadherin and P-cadherin expression (magnified views at right), summarized in drawings. Cb, club hair; Epi, epidermis; Inf, infundibulum; SG, sebaceous gland; Isth, isthmus; hair germ, hair germ; HFSCs, hair follicle stem cells. Scale bars, 30 μm. (B) Strategy of inducing Cdh1 ablation during the extended 2nd telogen and analyzing thereafter. Images show effective E-cadherin depletion in cKO bulge and isthmus by postnatal day 71 (P71). Scale bar, 30 μm. (C) Bulge expression of AJ proteins P-cadherin, p120-catenin, β-catenin and α-catenin. Shown are magnified views of bulge bilayer, with outer layer of stem cells (SC) and inner layer of ‘inner bulge’ (IB) niche cells (see Figure 1—figure supplement 2Afor zoomed out views). White arrows highlight the paucity of p120 at the Cdh1 cKO stem cell:niche interface. Scale bar, 10 μm. (D) Immunoblots of AJ proteins. Data are mean ±SEM of≥4 independent replicates of FACS-purified bulge HF stem cells normalized to GAPDH. ***p < 0.001; ****p < 0.0001. (E) Phalloidin staining reveals perturbations in F-actin within the inner bulge (IB), arising from Cdh1 ablation. Right, quantifications (n = 4 mice per condition/genotype; N = 20 HFs per mouse). Data are mean ±SEM. ***p < 0.001. (F) Whole-mount Z-stack imaging of tight junction components claudin one and zona occludens 1 (green). HF stem cells are co-labeled by CD34 (in red). Note paucity of tight junction labeling within the inner bulge (IB), arising from E-cadherin loss. (G) Barrier assay. Underlying dermis was removed from HFs and epidermis, which were then submerged in Lucifer yellow at 37°C for 3 hr, followed by fixation, mounting and imaging. Scale bar, 30 μm.
Figure 1—figure supplement 1
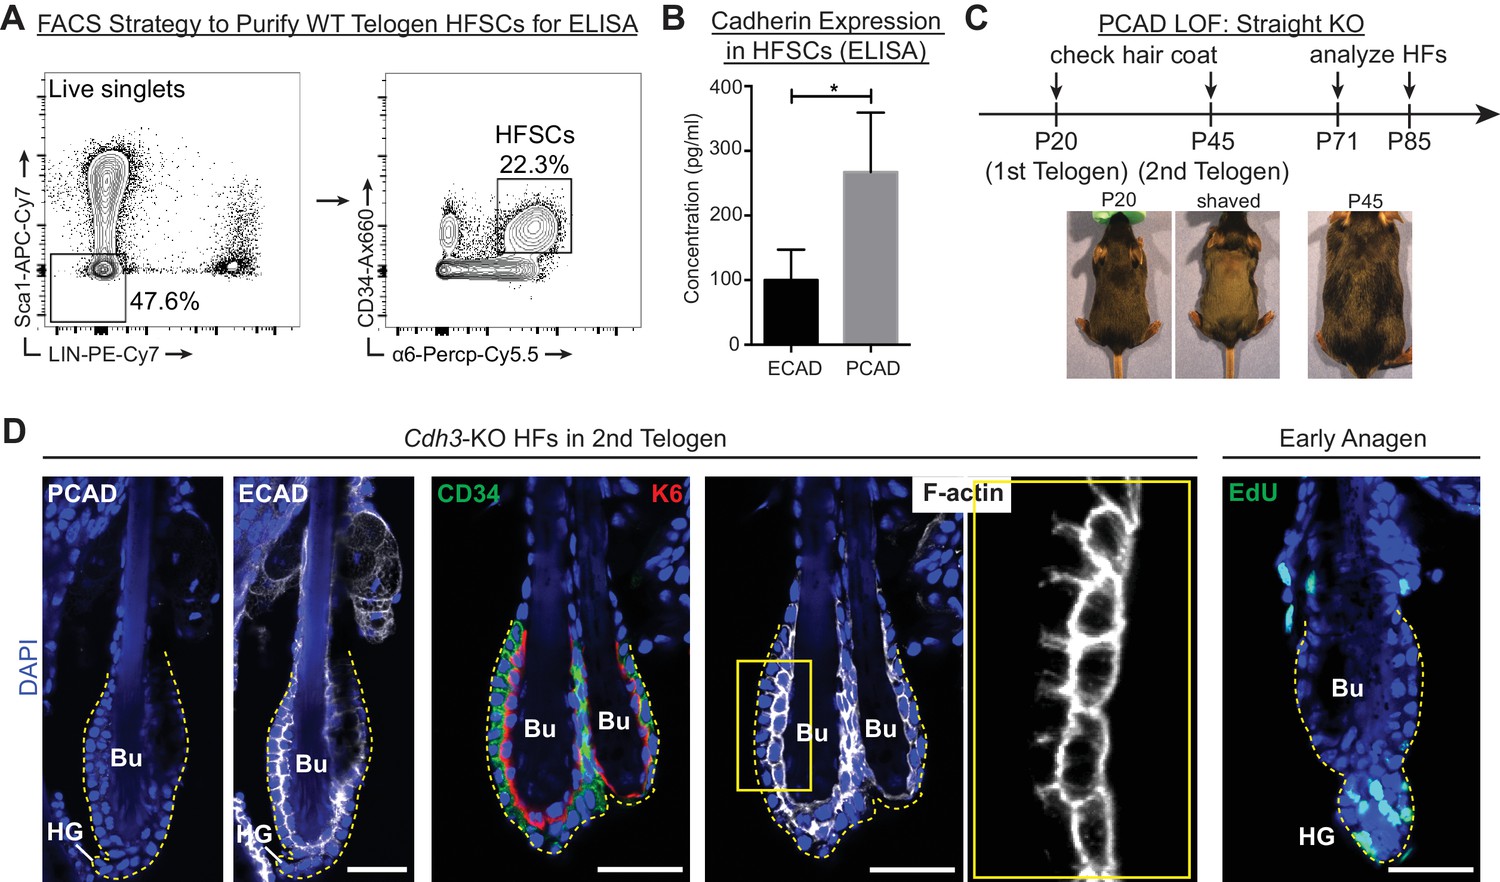
Cdh3-Null HFs have proper architecture and undergo hair cycling normally.
Scale bars, 30 μm. (A) FACS strategy to purify WT 2nd telogen HF stem cells (HFSCs) for ELISA. Live cells were first gated with exclusion markers Sca1 (epidermis), CD45 (immune cells), CD140a (fibroblasts), CD31 (endothelial cells) and CD117 (c-kit+ cells) [LIN-]. HF stem cells are CD34Hi; α6Hi. (B) Concentrations of ECAD and PCAD in protein lysates of FACS-purified HF stem cells as determined by ELISA (n = 4 mice per condition/genotype). Data are mean ±SEM. *p < 0.05. (C) Strategy to analyze Cdh3-null HFs. KO and WT littermates were shaved at P20 to analyze 1st adult hair cycle progression and found to be indistinguishable as both made a new hair coat by P45. (D) Whole-mount immunofluorescence of Cdh3-null HFs in 2nd telogen for PCAD, ECAD, CD34 (HF stem cell marker), keratin 6 (K6, inner bulge marker) and F-actin (phalloidin). Far right panel, Cdh3-null HF bulge region in anagen I, following a 24 hr pulse of nucleotide analogue 5-ethynyl 2’-deoxyuridine (EdU) (marks cells in S-phase of cell cycle). Bu, bulge; HG, hair germ.
Figure 1—figure supplement 2
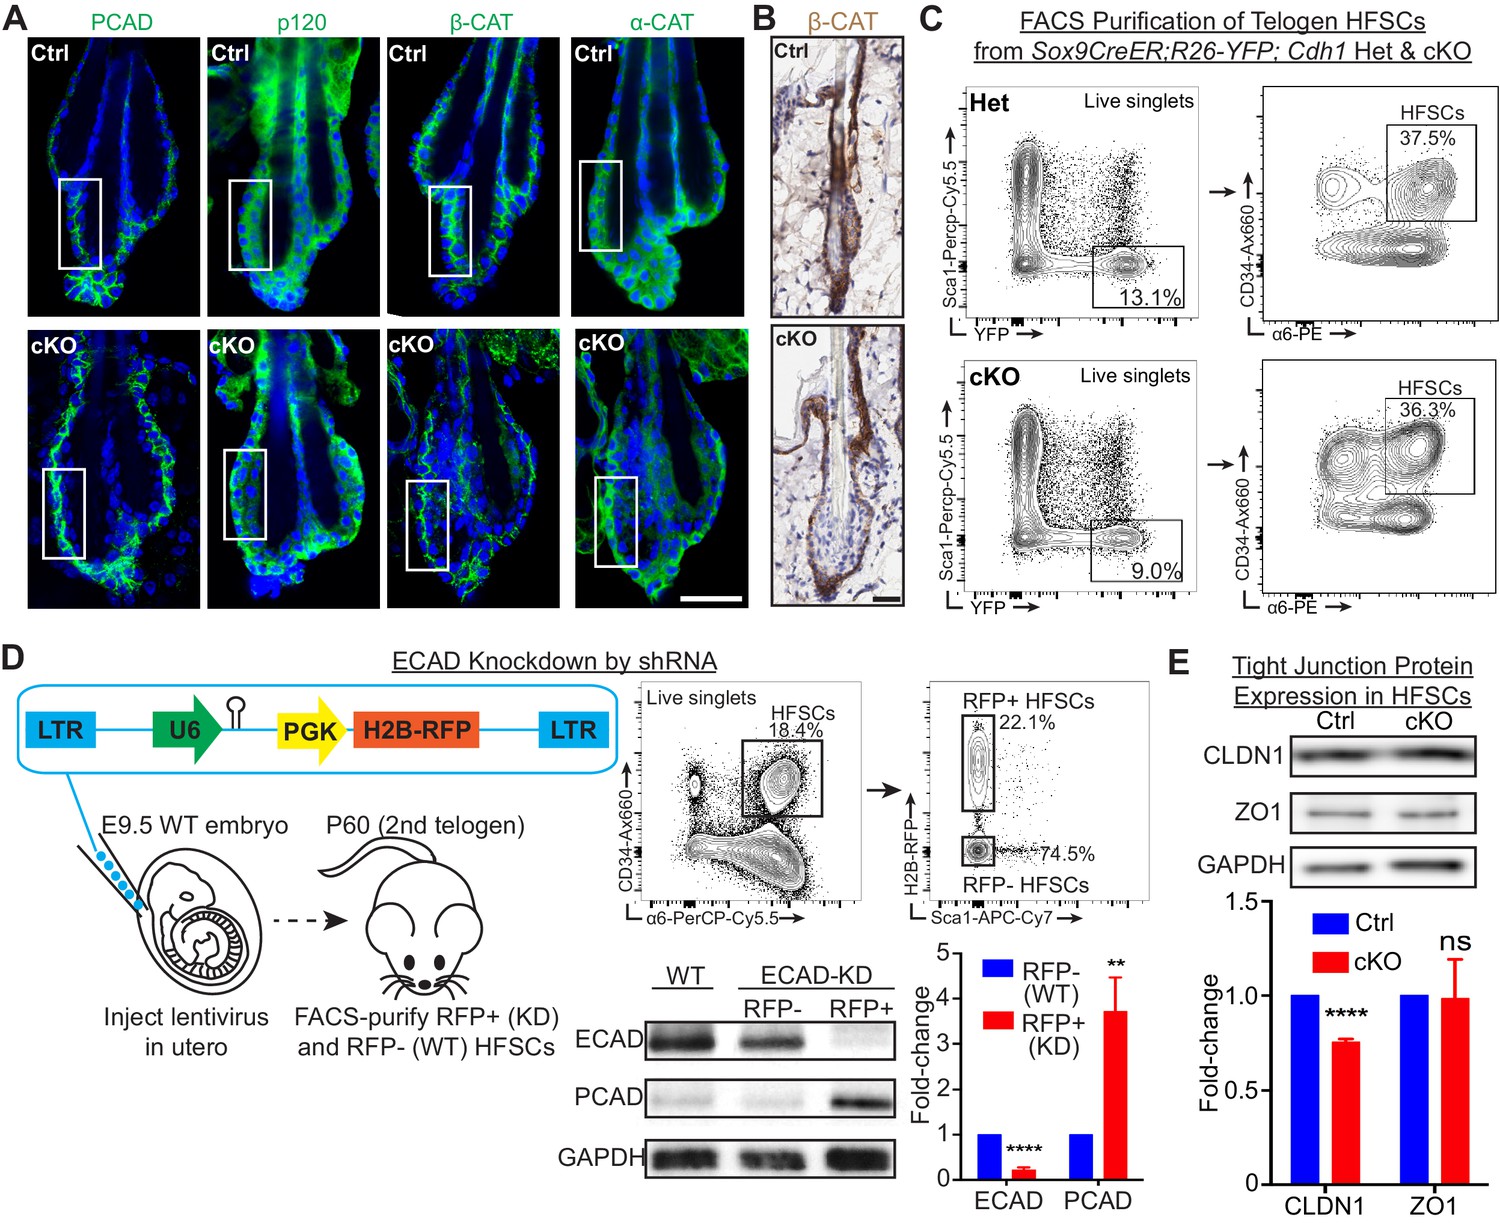
E-cadherin is critical to maintain the integrity of the stem cell niche.
Scale bars, 30 μm. (A) Whole-mount immunofluorescence of adherens junction proteins P-cadherin (PCAD), p120-catenin (p120), β-catenin (β-CAT) and α-catenin (α-CAT). White boxed regions are presented as zoomed-in views in Figure 1C. (B) Immunohistochemistry of β-catenin reveals the absence of its nuclear localization and signal only in the basal layer of Cdh1 cKO bulge. (C) FACS strategy to isolate Sox9CreER; Rosa26lox-STOP-lox-YFP Cdh1-cKO and Het HF stem cells, which are YFP+; CD34Hi; α6Hi; Sca1-. (D) Lentiviruses harboring Cdh1-shRNA and H2B-RFP transgenes were injected into E9.5 WT embryos in utero. Injected mice were allowed to develop till 2nd telogen and harvested at P60. Lentiviral-infected RFP+ (KD) and uninfected RFP- (WT) HF stem cells (CD34Hi; α6Hi; Sca1-), along with HF stem cells from un-injected WT littermates, were FACS-purified for immunoblotting. Data are mean ±SEM (n = 4 mice per condition/genotype). **p < 0.01; ****p < 0.0001. (E) Immunoblotting of tight junction proteins, claudin 1 (CLDN1) and zona occludens 1 (ZO1), in FACS-purified HF stem cells. Data are mean ±SEM (n = 4 mice per condition/genotype). ****p < 0.0001; ns, non-significant.
Figure 1—figure supplement 3

Desmosomes are intact in E-cadherin-deficient bulge.
Scale bars = 30 μm unless indicated otherwise. (A) Electron microscopy of Cdh1-cKO and WT bulge. (B) Whole-mount immunofluorescence of desmosomal proteins. DSG3, desmoglein 3; DP1/2, desmoplakin 1/2. (C) Electron microscopy of the ultrastructure of half-desmosome (between club hair [Cb] and inner bulge layer).
Figure 2 with 1 supplement
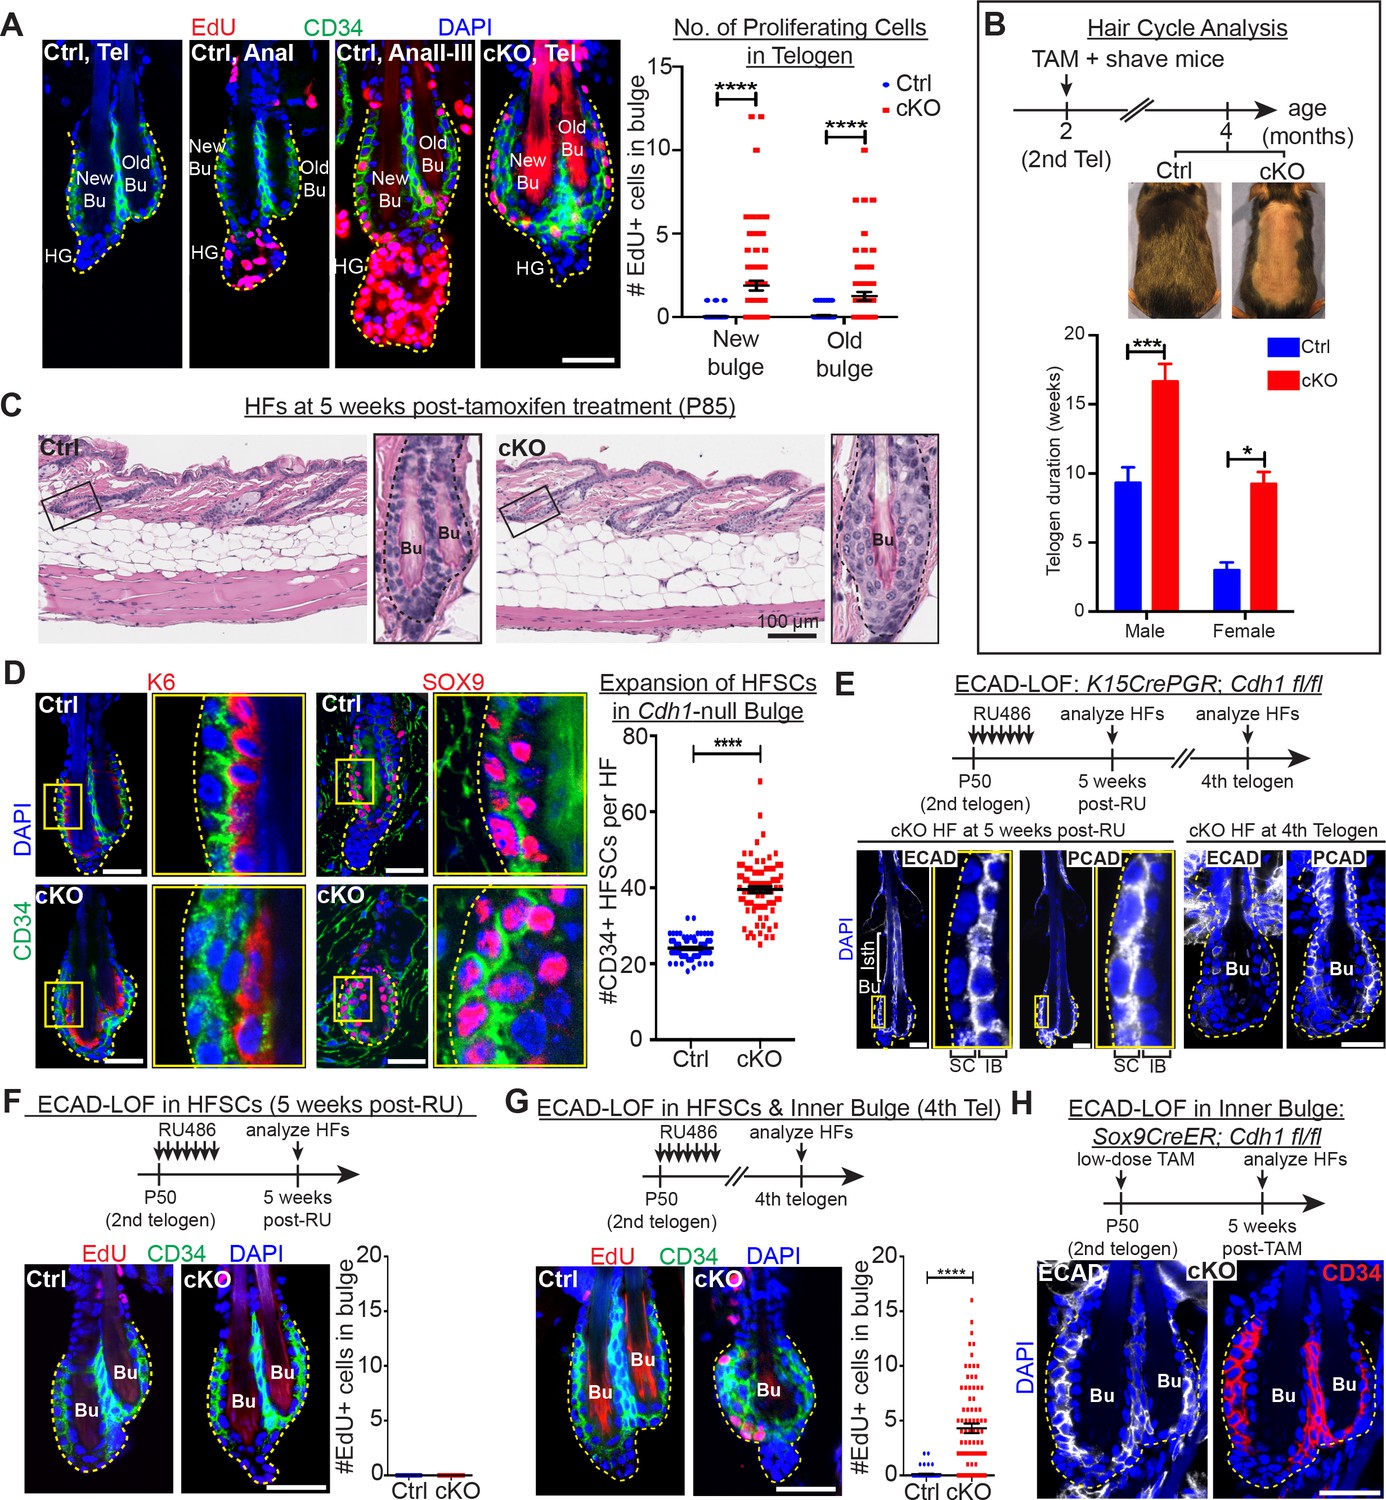
Telogen stem cells proliferate when E-cadherin is depleted from the bulge.
Scale bars, 30 μm unless indicated otherwise. (A) (Left) Whole-mount immunofluorescence of HFs from mice pulsed with nucleotide analogue EdU for 24 hr prior to analysis. Proliferation dynamics are compared for control (Ctrl) HF, telogen (Tel) vs anagen (Ana) sub-stages I-III, and Cdh1 cKO HF in telogen. (Right) Quantifications of EdU+ CD34+ HF stem cells (n = 4 mice per condition/genotype; N = 20 HFs per mouse). Data are mean ±SEM. ****p < 0.0001. (B) Top: Following Cdh1 ablation in the bulge of 2nd telogen HFs, mice were shaved and monitored for hair coat recovery. Within 2 months, Ctrl mice had regenerated a new hair coat and entered their 3rd telogen, but Cdh1 cKO HFs were still in their 2nd telogen. Bottom: Telogen duration was determined as the period between week 8 of age (when TAM was administered) and the week during which 50% of shaved back skin had entered anagen (n = 4 mice per condition/genotype). Data are mean ± SEM. *p < 0.05; ***p < 0.001. (C) Skin histology, as examined by hematoxylin and eosin staining. Magnified views of boxed areas are shown, with black dashed lines denoting epithelial-dermal boundaries. Note hyperthickening of Cdh1 cKO bulge, compared to Ctrl. (D) Cdh1 bulge expansion derives from stem cells, as revealed by immunofluorescence for markers of stem cells (CD34+, SOX9+) vs inner bulge niche cells (K6+, SOX9+). Yellow-boxed regions are magnified at right of images. Quantifications of HF stem cell (HFSC) numbers at right (n = 4 mice per condition/genotype; N = 20 HFs per mouse). Data are mean ±SEM. ****p < 0.0001. (E–G) HF stem cell-specific ECAD loss of function was induced by activating Krt15CrePGR in 2nd telogen. HFs were analyzed by whole-mount immunofluorescence in 2nd or 4th telogen post-ablation (see Figure 2—figure supplement 1D for more details). (E) In 2nd telogen, ECAD is specifically depleted in HF stem cells (SC; boxed regions are magnified at the right). Following hair cycling, the inner bulge (IB) derives from HF stem cell progeny and hence is also Cdh1-null by 4th telogen. Hyperthickened bulge architecture correlates with ECAD loss of function in the niche cells of the inner bulge. (F–G) EdU labeling performed 24 hr prior to analyses shows that ECAD loss of function in HF stem cells alone does not elicit telogen-phase proliferation (F), while ECAD loss of function in both HF stem cells and inner bulge causes marked proliferative response (G). Data are mean ±SEM (n = 4 mice per condition/genotype; N = 20 HFs per mouse). (H) Inner bulge-specific ECAD loss of function was induced as indicated (see Figure 2—figure supplement 1E for more details). Note expansion in surrounding WT CD34+ stem cells, not seen in HF stem cell-specific ECAD loss of function.
Figure 2—figure supplement 1
Dissecting the causes of telogen HF stem cell proliferation upon loss of E-cadherin.
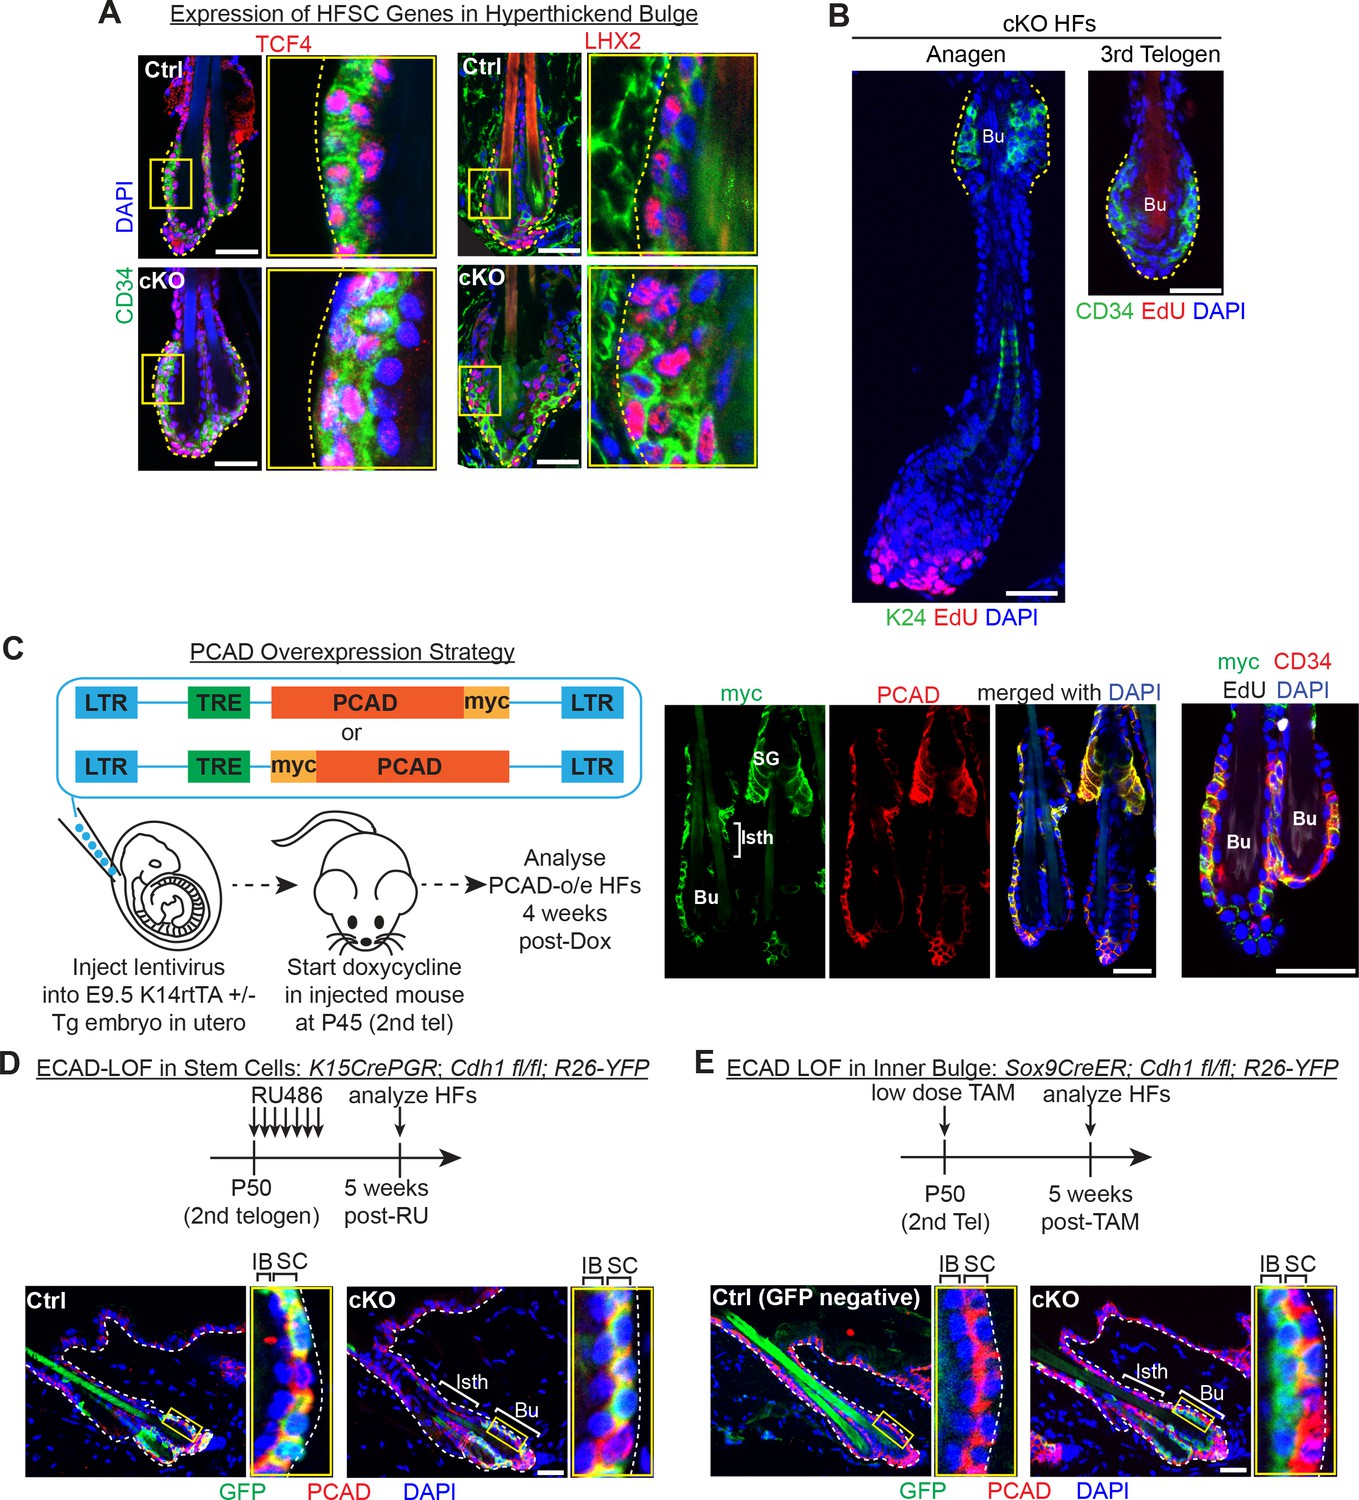
Scale bars, 30 μm. (A) Progeny of the proliferative Cdh1-null HF stem cells maintain expression of the HF stem cell transcription factors TCF4 and LHX2. (B) Whole-mount immunofluorescence of Cdh1-null HFs in anagen and 3rd telogen. Note the absence of EdU +HFSCs in the bulge (Bu), marked by K24 or CD34. (C) Lentiviral particles with a TET-responsive element (TRE) driving expression of either PCAD tagged with myc at its C-terminal end or PCAD tagged with myc between its pro-peptide and protein sequences were injected into E9.5 Krt14-rtTA ± embryos in utero. Injected mice were allowed to develop to adulthood before doxycycline feed was used to induce PCAD over-expression (O/E) at P42 (2nd telogen). Whole-mount immunofluorescence of PCAD-O/E HFs demonstrates co-localization of PCAD and myc tag, notably in isthmus (Isth) and sebaceous gland (SG) that do not normally express PCAD (see Figure 1A), and their maintenance of bulge bilayer architecture (single CD34+ HF stem cell layer and single inner bulge layer) with no ectopic proliferation. (D) Strategy to achieve ECAD loss of function in HF stem cells only. RU486 was administered daily by intraperitoneal injection of and topical application on Krt15CrePGR mice as in Figure 2E. This was validated by immunofluorescence of sagittal skin sections showing GFP (Rosa26lox-STOP-lox-YFP Cre activity reporter). Note expression largely in HF stem cells (PCAD+) (magnified inset). (E) Strategy to achieve ECAD loss of function in inner bulge only. Instead of administering 1.5 mg of tamoxifen by daily intraperitoneal injections of Sox9CreER mice as in Figure 1B, a single dose of 1.5 mg of tamoxifen was administered topically on the hair coat of mice. This was validated by immunofluorescence of sagittal skin sections showing GFP (Rosa26lox-STOP-lox-YFP Cre activity reporter). Note expression largely in inner bulge (Bu) (PCADneg).
Figure 3
When the stem cell niche is breached, bacteria infiltrate but are not required for the stem cell response.
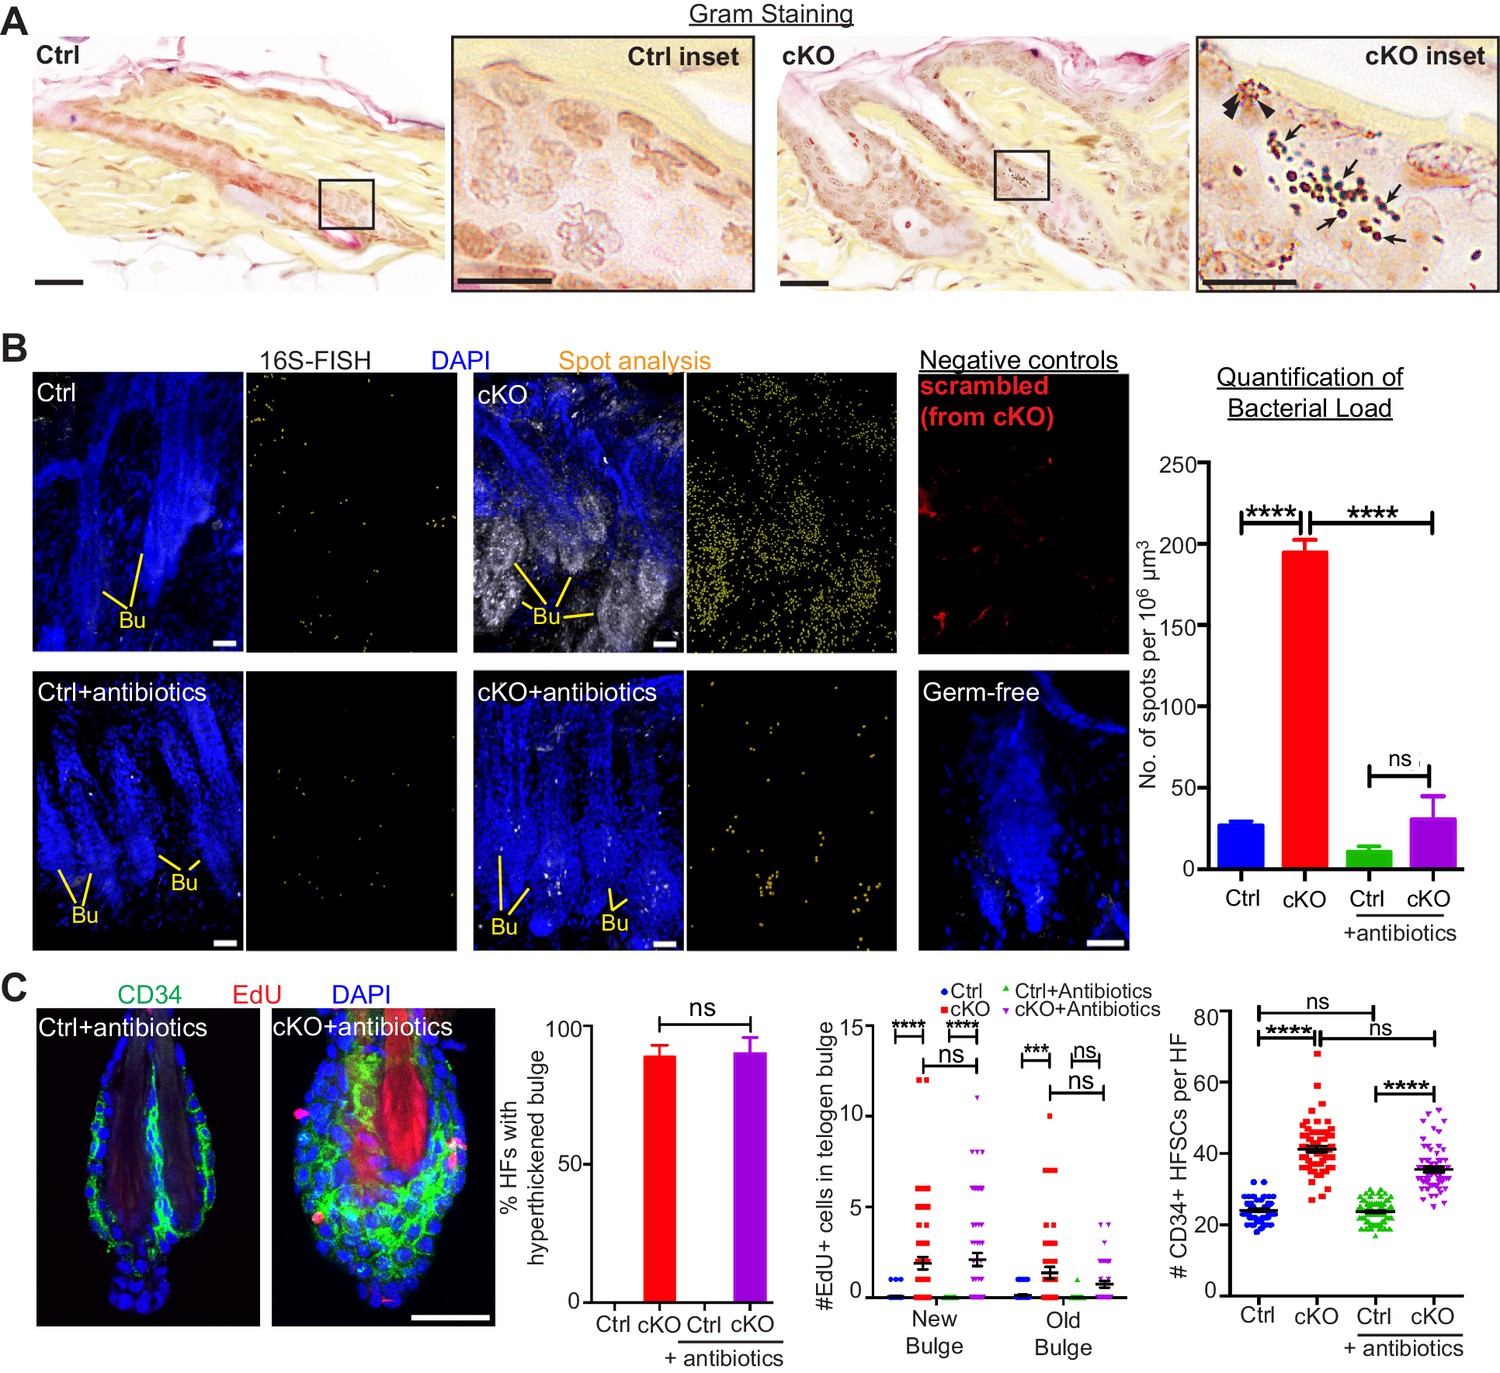
(A) Gram staining of sagittal skin sections reveals near absence of bacteria in control HFs but presence of Gram-positive (deep violet; arrows) and Gram-negative (pink; arrowheads) bacteria in Cdh1 cKO HFs. Scale bars, 30 μm. Magnified images are of boxed areas (scale bars,10 μm). (B) Fluorescence in situ hybridization (FISH) of pan-bacterial 16S rRNA (white) in cleared skin whole-mounts, co-labeled for DAPI (blue). Spot analysis of 16S-FISH signal (yellow) was used to quantify bacterial load per 106 μm3 of skin. Negative controls included simultaneous FISH with scrambled probe on all samples (shown here in red from cKO), and analyses on germ-free mice (in bottom right frame). Antibiotics treatment of Sox9CreER; Cdh1fl/fl cKO mice depleted bacterial load to near control levels, as quantified at right. Scale bars, 30 μm. Data are mean ±SEM (n = 3 mice per condition/genotype). ****p < 0.0001; ns, non-significant. (C) Whole-mount immunofluorescence of telogen HFs from Cdh1 cKO and control mice treated with antibiotics. Note persistence of multiple layers of CD34+ proliferative stem cells within Cdh1 null HF bulge despite microbial depletion. Accompanying graphs quantify changes in niche architecture, EdU incorporation and HF stem cell (HFSC) numbers, presented as mean ±SEM (n = 3 mice per condition/genotype; N = 20 HFs per mouse). ***p < 0.001 ****p < 0.0001; ns, non-significant. Scale bar = 30 μm. Sox9CreER; Cdh1fl/fl cKO and control (without antibiotics) datasets are from Figure 2.
Figure 4 with 1 supplement
A barrier breach within the stem cell niche results in immune cell recruitment.
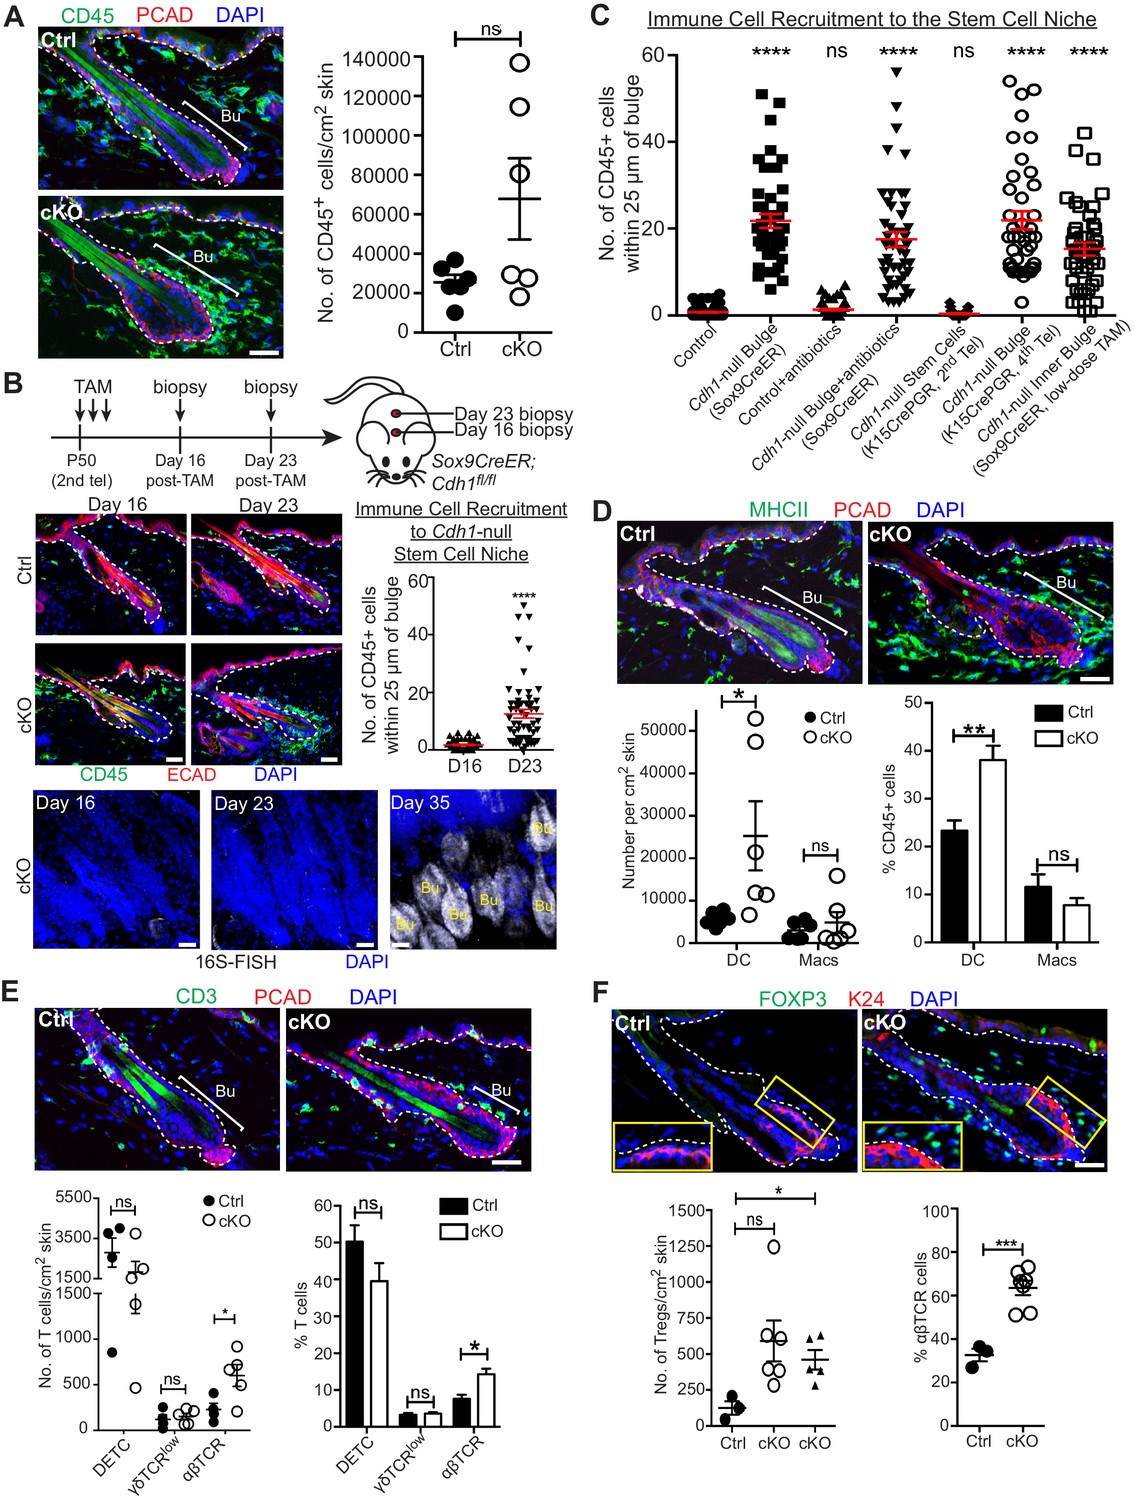
Scale bars, 30 μm. (A) Immunofluorescence (left) and flow cytometry quantifications (right; details below) of immune cells (CD45+) in Sox9CreER; Cdh1fl/fl cKO and control skins. (B) Sagittal skin sections were analyzed as indicated to determine the temporal relation between efficient E-cadherin depletion, recruitment of CD45+ immune cells and increase in 16S-FISH signals. Shown are quantifications of CD45+ immune cell numbers within a 25 μm radius from the bulge. Data are ±SEM (n = 4 mice per condition/genotype, N ≥ 10 HFs per mouse). ****p < 0.0001. (C) Quantifications of CD45+ immune cell numbers within a 25 μm radius from the bulge in sagittal skin sections from mice whose a) ECAD status within the bulge of telogen HFs, and b) status of antibiotic treatment, are shown. Data are ±SEM (n ≥ 3 mice per condition/genotype, N ≥ 10 HFs per mouse). In each case, significance testing was performed relative to control. ns, non-significant; ****p < 0.0001. Note that the swarm of CD45+ cells surrounding bulge is dependent upon ECAD loss of function in the niche not its stem cells. (D–F) Immunofluorescence and flow cytometry quantifications to characterize the CD45+ immune cell populations in Sox9CreER; Cdh1fl/fl cKO and control skins. Antibodies used were against: MHC Class II [dendritic cells (DCs), monocytes and macrophages (Macs)]; CD11c (DCs); CD11b and CD64 (Macs); CD3 (T cells); γδTCR [dendritic epidermal T cells (DETCs), some dermal T cells]; TCRβ (αβ T cells, including regulatory T cells [Tregs]); and FOXP3 (Tregs). Note accumulation of immune cells, particularly DCs and Tregs, specifically around the Cdh1-null HF bulge. Flow cytometry data are mean ±SEM (n = 4–6 mice per condition/genotype as indicated), confirming the significant differences (*p < 0.05; **p < 0.01, ***p < 0.001) in αβ TCR cells, Tregs and DCs between Ctrl and cKO (ns, non-significant). [Note that for Treg quantifications in F, the open-circle dataset included an outlier that was consistent with our findings, but which made the difference statistically insignificant. The triangle dataset excluded the outlier, in which case the difference between cKO and control was statistically significant.] See Figure 4—figure supplement 1A–E for more immunofluorescence images. See Figure 4—figure supplement 1F and G for flow cytometry strategies used to perform quantifications here and in (A).
Figure 4—figure supplement 1
A barrier breach within the stem cell niche results in immune cell recruitment.
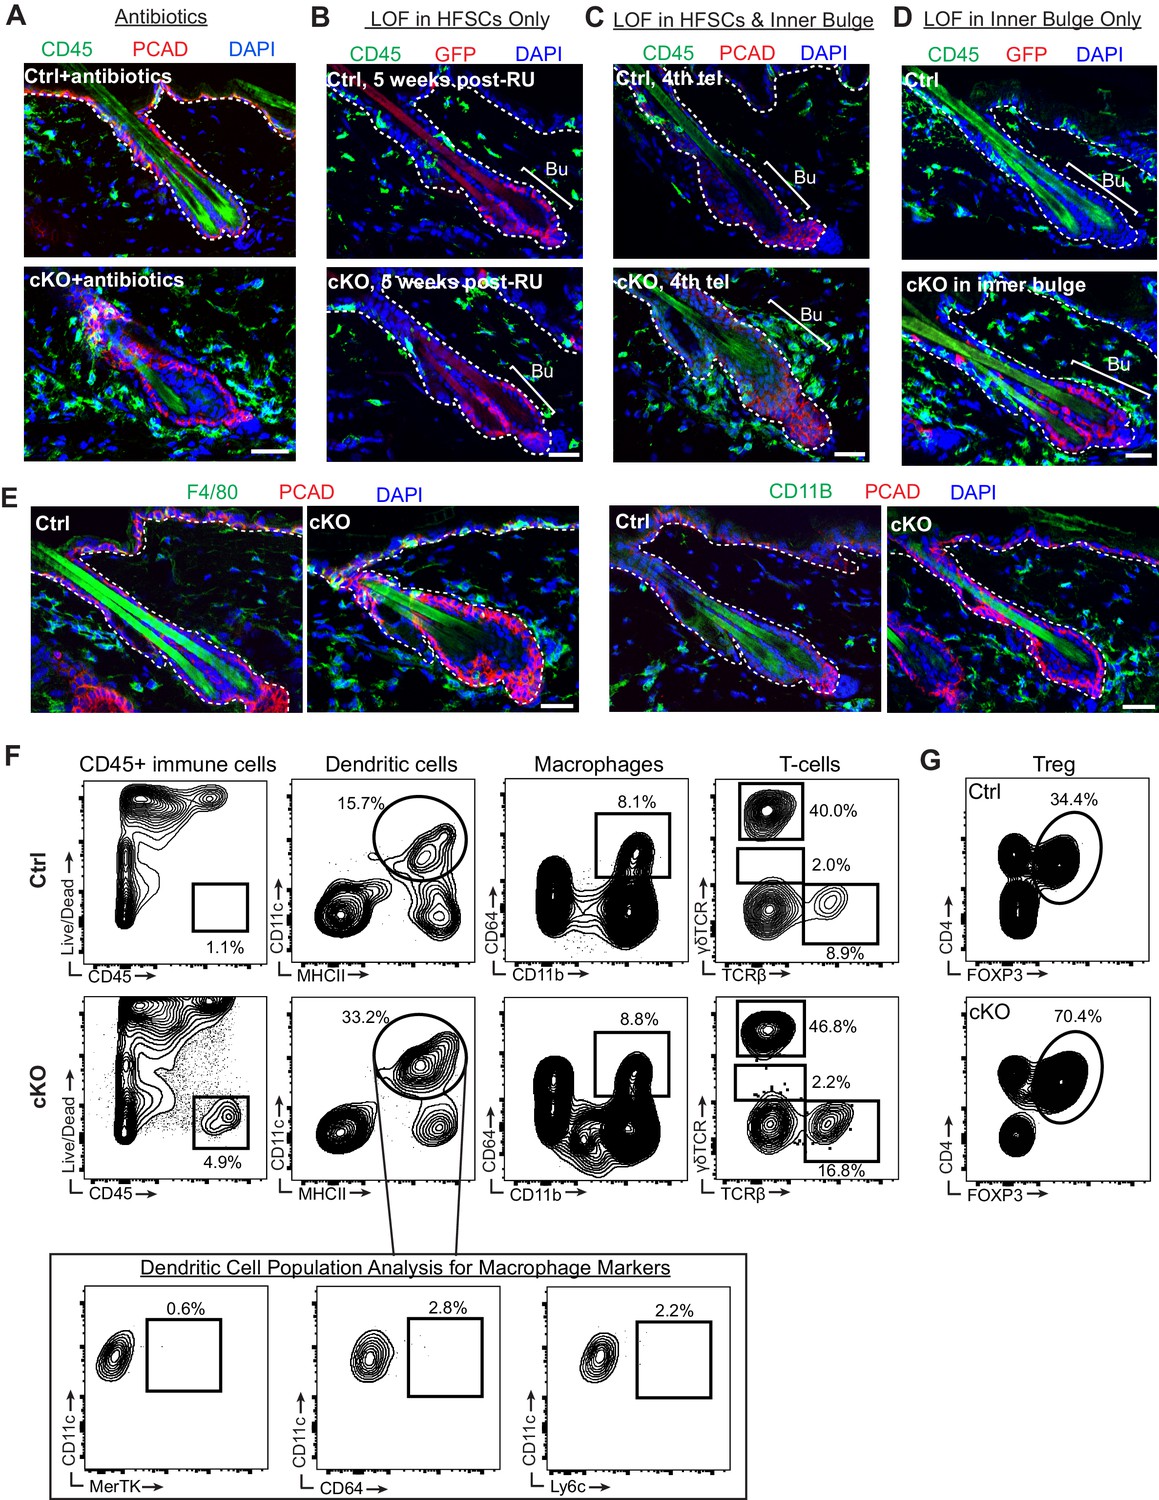
Scale bars, 30 μm. (A) CD45+ immune cells were still recruited to Cdh1 cKO bulge despite the reduced bacterial load by antibiotics treatment. (B) ECAD loss of function specifically in HF stem cells using Krt15CrePGR did not cause accumulation of CD45+ immune cells around cKO HF at 5 weeks post-RU, as revealed by immunofluorescence of sagittal skin sections. (C) ECAD loss of function in both HF stem cells and inner bulge of Krt15CrePGR-activated HFs at 4th telogen now caused presence of CD45+ immune cell accumulation around Cdh1-cKO bulge, as revealed by immunofluorescence of sagittal skin sections. (D) ECAD loss of function specifically in inner bulge of Sox9CreER-activated HFs was sufficient to recruit CD45+ immune cells. (E) Immunofluorescence of sagittal skin sections for immune cell markers F4/80 and CD11b. (F, G) Representative examples of flow cytometry analysis of various innate and adaptive immune cell populations in whole skin preps. Quantifications of data are presented in Figure 4. Note: for solid tissues, like skin, extensive enzymatic digestion is required, which correspondingly increases the numbers of dead cells, including CD45+ immune cells (Naik et al., 2015). Importantly, however, further analyses of the flow data showed that this did not alter the relative percentages of different immune cell populations in Cdh1 cKO compared to WT skins.
Figure 5 with 1 supplement
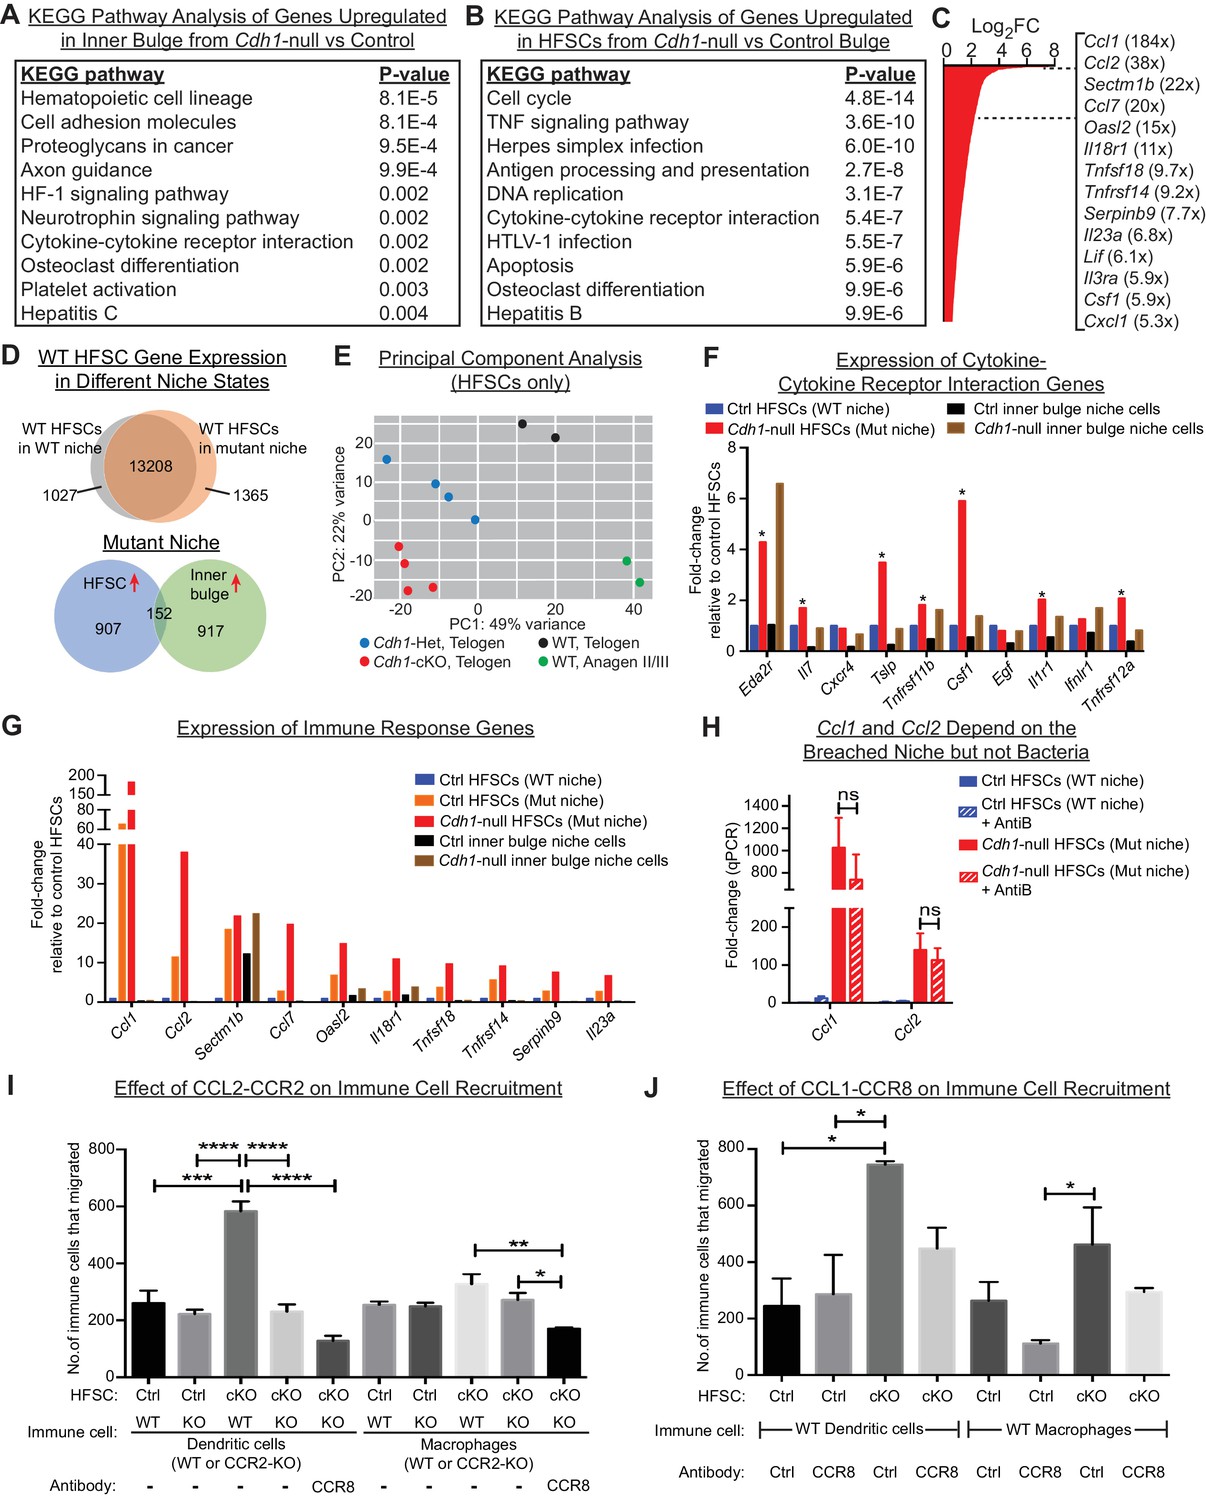
HF stem cells up-regulate chemokines to recruit immune cells.
Stem cells or inner bulge niche cells were isolated from Sox9CreER cKO or matched littermate heterozygous control animals, that were either treated with low-dose Tamoxifen (Tamlow, to target only the inner bulge niche cells for Cdh1 loss-of-function) or regular-dose Tamoxifen (Tamreg, to target both inner bulge niche and stem cells). (A) KEGG pathway analyses of genes significantly up-regulated (p < 0.05, absolute fold-change ≥1.5) in Cdh1-null vs control inner bulge niche cells (both with normal stem cells). Shown are the top 10 of 30 pathways with p-values<0.05. (B) KEGG pathway analyses of genes significantly up-regulated (p < 0.05, absolute fold-change ≥1.5) in Cdh1-null vs control HF stem cells (HFSCs) from Cdh1-null or control bulge. Shown are the top 10 of 50 pathways with p-values<0.05. Overall, p-values are much lower for stem cells than inner bulge niche cells (A). (C) Fold-changes (FC) of significantly up-regulated genes in Cdh1-null stem cells from Cdh1-null bulge. Listed at right are top genes associated with immune response (FCs indicated in parentheses). (D) Top, Venn diagram comparing changed transcripts in WT stem cells that surround either a Cdh1-null mutant inner bulge niche (Tamlow) or a WT inner bulge niche (no Tam). Both populations commonly express 13208 genes (TPM [transcripts per kilobase million]≥1), but WT stem cells surrounding a mutant inner bulge gain expression of 1365 genes by ≥1.5 fold and lose expression of 1027 genes (TPM <1). Bottom, Venn diagram comparing gene expression changes in stem cells vs inner bulge niche cells from Cdh1-null bulge. Note that the stem cells and their niche adopt highly distinct transcriptomes (upregulated genes shown here). (E) Principal component analysis (PCA) comparing transcriptomes of telogen-phase HF stem cells of WT, Cdh1 cKO and Het bulges, and of anagen II/III HF stem cells from WT bulges. (F, G) Relative expression of genes within the KEGG pathway term ‘cytokine-cytokine receptor interaction’ and genes associated with immune response that scored as significantly up-regulated (Cdh1-null vs control) for niche (F) or stem cells (G). Note that of the few immune signaling genes in the breached niche signature, most are more highly and significantly expressed by the stem cells (*) (F); conversely, many immune response genes in the stem cell signature are barely expressed, if at all, in the breached inner bulge niche (G). Navy and red bars correspond to data from Tamreg mice; orange, black and brown bars correspond to data from Tamlow mice. (H) Two highly upregulated immune response stem cell genes, Ccl1 and Ccl2, are still as highly expressed even after antibiotics treatment, underscoring their independence from bacterial infiltration. qRT-PCR data are normalized to Ppib. Data are mean ±SEM (n = 4 mice per condition/genotype). ns, non-significant. All data were from Tamreg mice. (I, J) Transwell migration assays. Cdh1-null and Ctrl HF stem cells were seeded in bottom Boyden chamber. Bone marrow-derived dendritic cells (BMDCs) or macrophages (BMDM), either WT or deficient for CCR2 receptor, were placed in upper chamber, with or without isotype control or CCR8 blocking antibody. CD45+ BMDCs and BMDM that were chemo-attracted to bottom chambers were quantified by flow cytometry. Data are mean ±SEM (n = 3). Comparisons that are statistically significant are denoted by asterisks. *p < 0.05; **p < 0.01; ***p < 0.001; ****p < 0.0001.
Figure 5—figure supplement 1
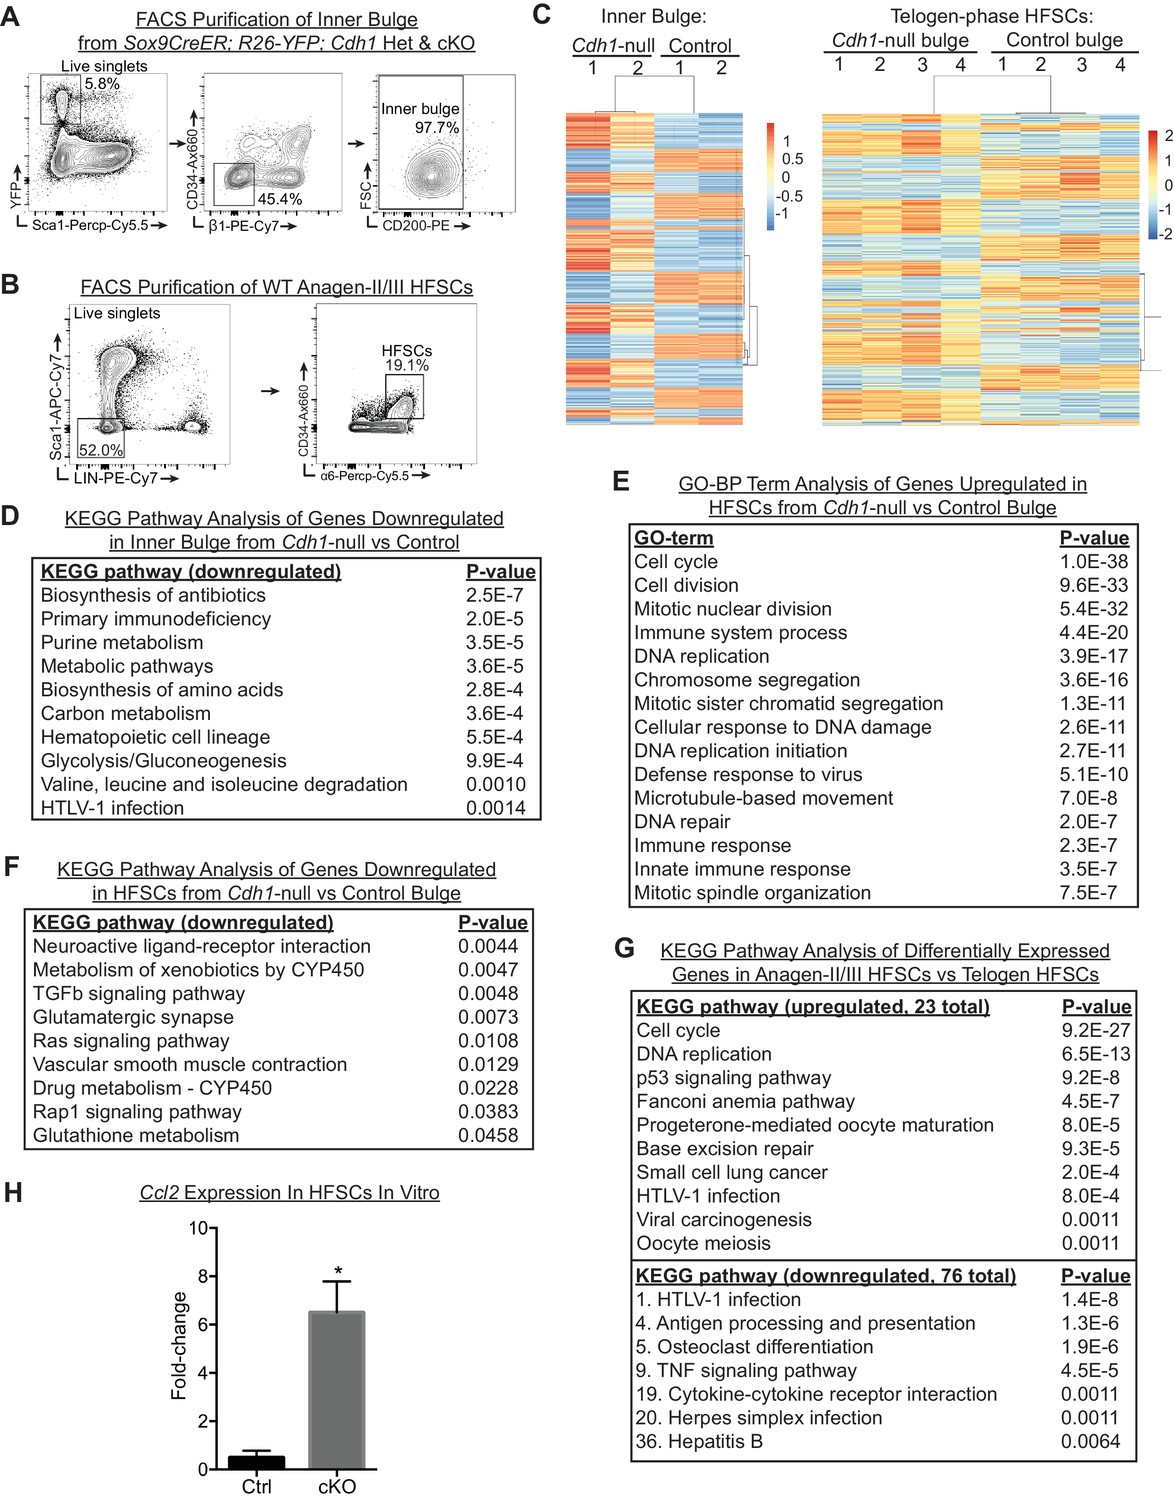
HF stem cells from Cdh1-null bulge display a gene expression profile distinct from WT HF stem cells that are naturally proliferating in anagen.
(A) FACS strategy to purify inner bulge cells from Sox9CreER-activated HFs based on YFP+; Sca1-;CD34-; b1-; CD200Lo. (B) FACS strategy to purify WT bulge HF stem cells in anagen sub-stages II and/or III based on Sca1-; LIN- (CD45, CD140a, CD117, CD31); CD34Hi; a6Hi. (C) Heat-map of hierarchical clustering of differentially expressed genes (p < 0.05, absolute fold-change ³ 1.5) in inner bulge (n = 2 mice per condition/genotype) and in HF stem cells (n = 4 mice per condition/genotype) from Cdh1-null vs. control bulge. (D) KEGG pathway analysis of significantly down-regulated genes in Cdh1-null vs control inner bulge. (E) Gene ontology biological process (GO-BP) term analysis of significantly up-regulated genes in HF stem cells from Cdh1-null vs. control bulge. Shown here are the top 15 of 235 GO terms. (F) KEGG pathway analysis of significantly down-regulated genes in HF stem cells of Cdh1-null vs control bulge. (G) KEGG pathway analysis of differentially expressed genes in WT anagen II/III HF stem cells vs. WT telogen HF stem cells (p < 0.05, absolute fold-change ³ 1.5). For up-regulated pathways, the top 10 of 23 are shown. For downregulated pathways, only those that were upregulated in HF stem cells from Cdh1-null bulge (see Figure 5B) are shown; numbers denote their ranking among the total of 76 pathways, with #1 being the pathway with the lowest p-value. (H) Relative expression of Ccl2 in cultured HF stem cells, normalized to Ppib (n = 3). Data are mean ± SEM. *p < 0.05.
Figure 6 with 2 supplements
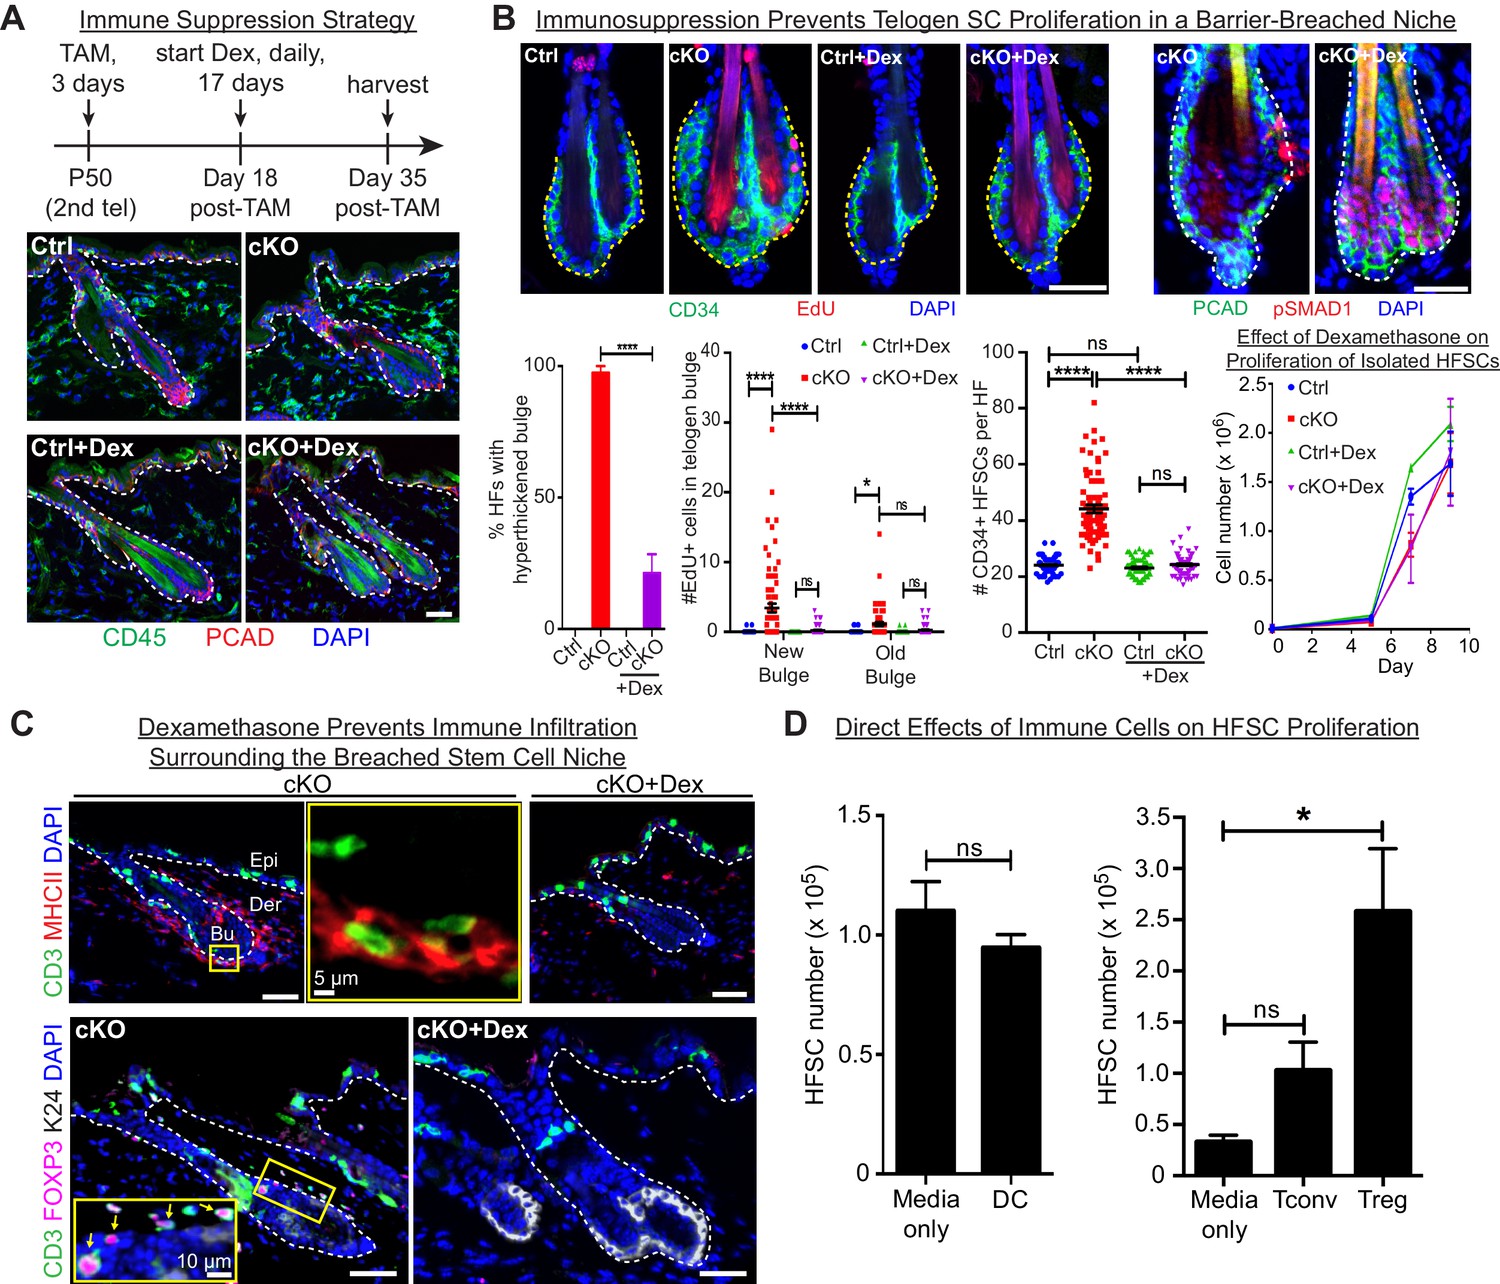
Stem cell proliferation and bulge hyperthickening arise from immune cell stimulation.
Scale bars, 30 μm unless indicated otherwise. (A) Dexamethasone suppressed infiltration of immune cells to the bulge when administered after ECAD loss of function but prior to the immune response,. (B) As shown by CD34+, EdU incorporation and pSMAD1 whole-mount immunofluorescence, telogen-phase Cdh1-null bulge stem cells maintain quiescence in Dex-treated mice. Note that only when stem cell-stimulatory signals override BMP signals coming from the niche is pSMAD1 lost. Accompanying graphs quantify changes in niche architecture, HF stem cell (HFSC) proliferation and stem cell number, presented as mean ±SEM (n = 4 mice per condition/genotype; N = 20 HFs per mouse). ns, non-significant; *p < 0.05; ****p < 0.0001. Graph at right shows that Dex does not significantly impact HF stem cell proliferation in vitro; data are mean ±SEM (n = 3). (C) Upon Dex treatment, the influx of DCs and Tregs to the breached stem cell niche is blocked. Note that resident immune cells still show similar patterns. Note also the close proximity of DCs and Tregs in the cKO bulge region (magnified in top middle panel). (D) Tregs directly impact stem cell proliferation, as shown by in vitro co-culture assays of FACS-purified Cdh1 cKO HF stem cells with BMDCs, conventional T cells (Tconv) or FACS-purified Tregs, prepared and tested as described in the methods. Experiments were performed in triplicate. In contrast to Tconv and DCs, the effects of Tregs were substantial (p < 0.05). Data are mean ±SEM. ns, non-significant; *p < 0.05.
Figure 6—figure supplement 1
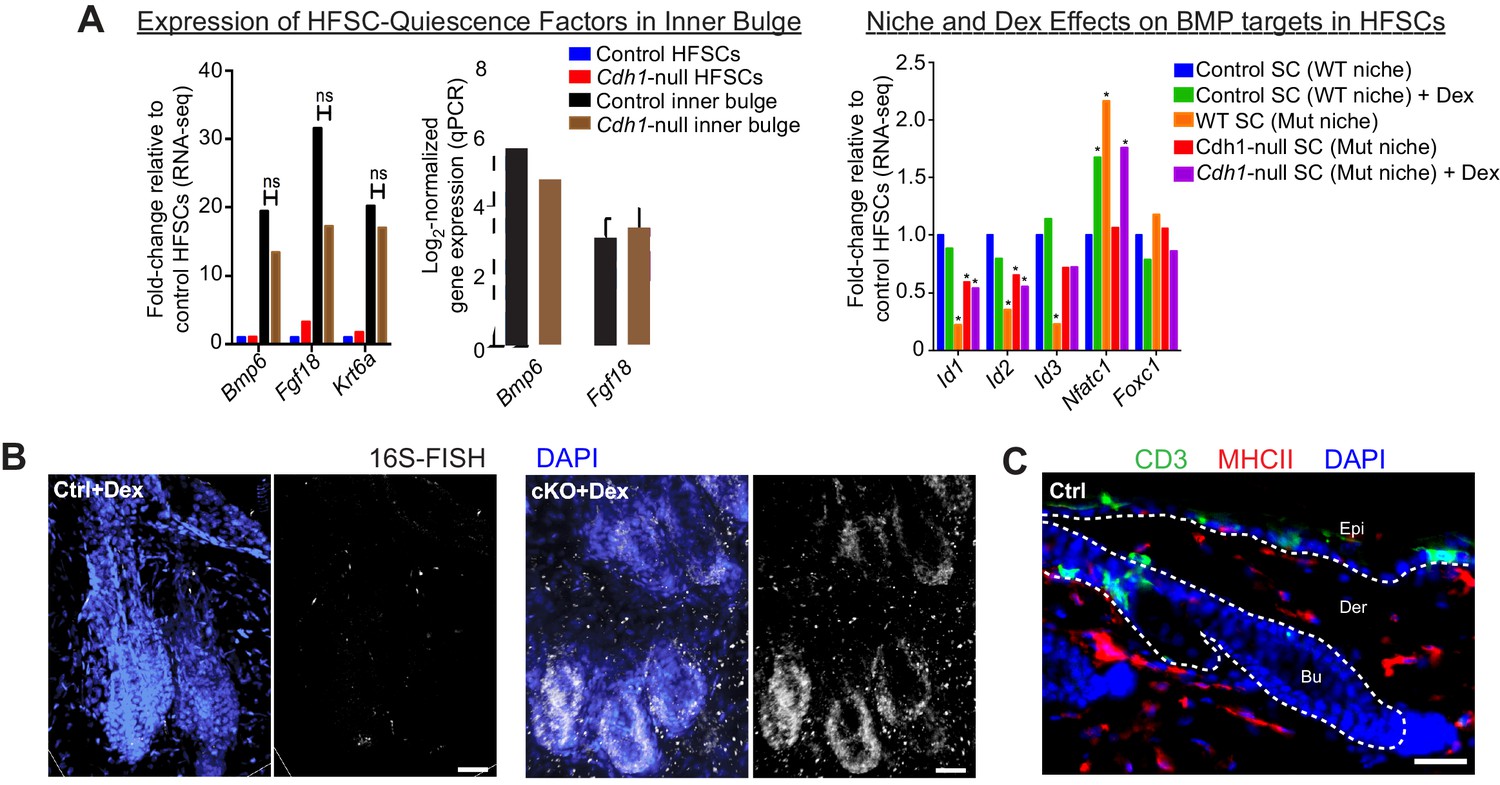
Analysis of BMP signaling in HF stem cells and inner bulge niche cells with breached barrier function.
Scale bars, 30 μm. (A) Fgf18 and Bmp6 transcripts remain high in the Cdh1-null inner bulge niche cells. Krt6a encodes K6, a marker of the inner bulge. ns, non-significant. Left are fold-changes generated by differential gene expression analysis of RNA-seq data by DESeq2; middle are confirmatory qRT-PCRs (n ≥ 3 mice per condition/genotype). Data are mean ±SEM. ns, non-significant. Right are relative expression of BMP target genes as revealed by RNA-seq. *p < 0.05 (absolute fold-change ≥1.5) relative to control HF stem cells. (B) Bacteria are still present in immunosuppressed Cdh1 cKO skin as judged by 16S rRNA FISH. (C) Control skin immunolabeled to show resident immune cell patterns of telogen-phase control skin. CD3 marks epidermal T cells which are mostly DETCs, while MHC II marks macrophages, DCs and some monocytes. DAPI is in blue.
Figure 6—figure supplement 2

E-cadherin expression in the HF stem cell bulge niche is essential to maintain tissue barrier function.
(A) Relative expression of NOTCH target genes in various HF stem cell and inner bulge populations. *p < 0.05 (absolute fold-change ≥1.5) relative to control HFSCs. (B) Relative expression of HF bulge genes that are bound by NICD and RBPj upon NOTCH signaling in myogenic cells. *p < 0.05 (absolute fold-change ≥1.5) relative to control HF stem cells. #p < 0.05 relative to control inner bulge. (C) Relative expression of putative YAP target genes in various HF stem cell and inner bulge populations. *p < 0.05 (absolute fold-change ≥1.5) relative to control HF stem cells. #p < 0.05 (absolute fold-change ≥1.5) relative to control inner bulge. (D) Findings from the various loss of function mouse lines used in this study point to the inner bulge being critical to maintaining HF barrier function, HF stem cell homeostasis and bulge niche architecture.
Figure 7
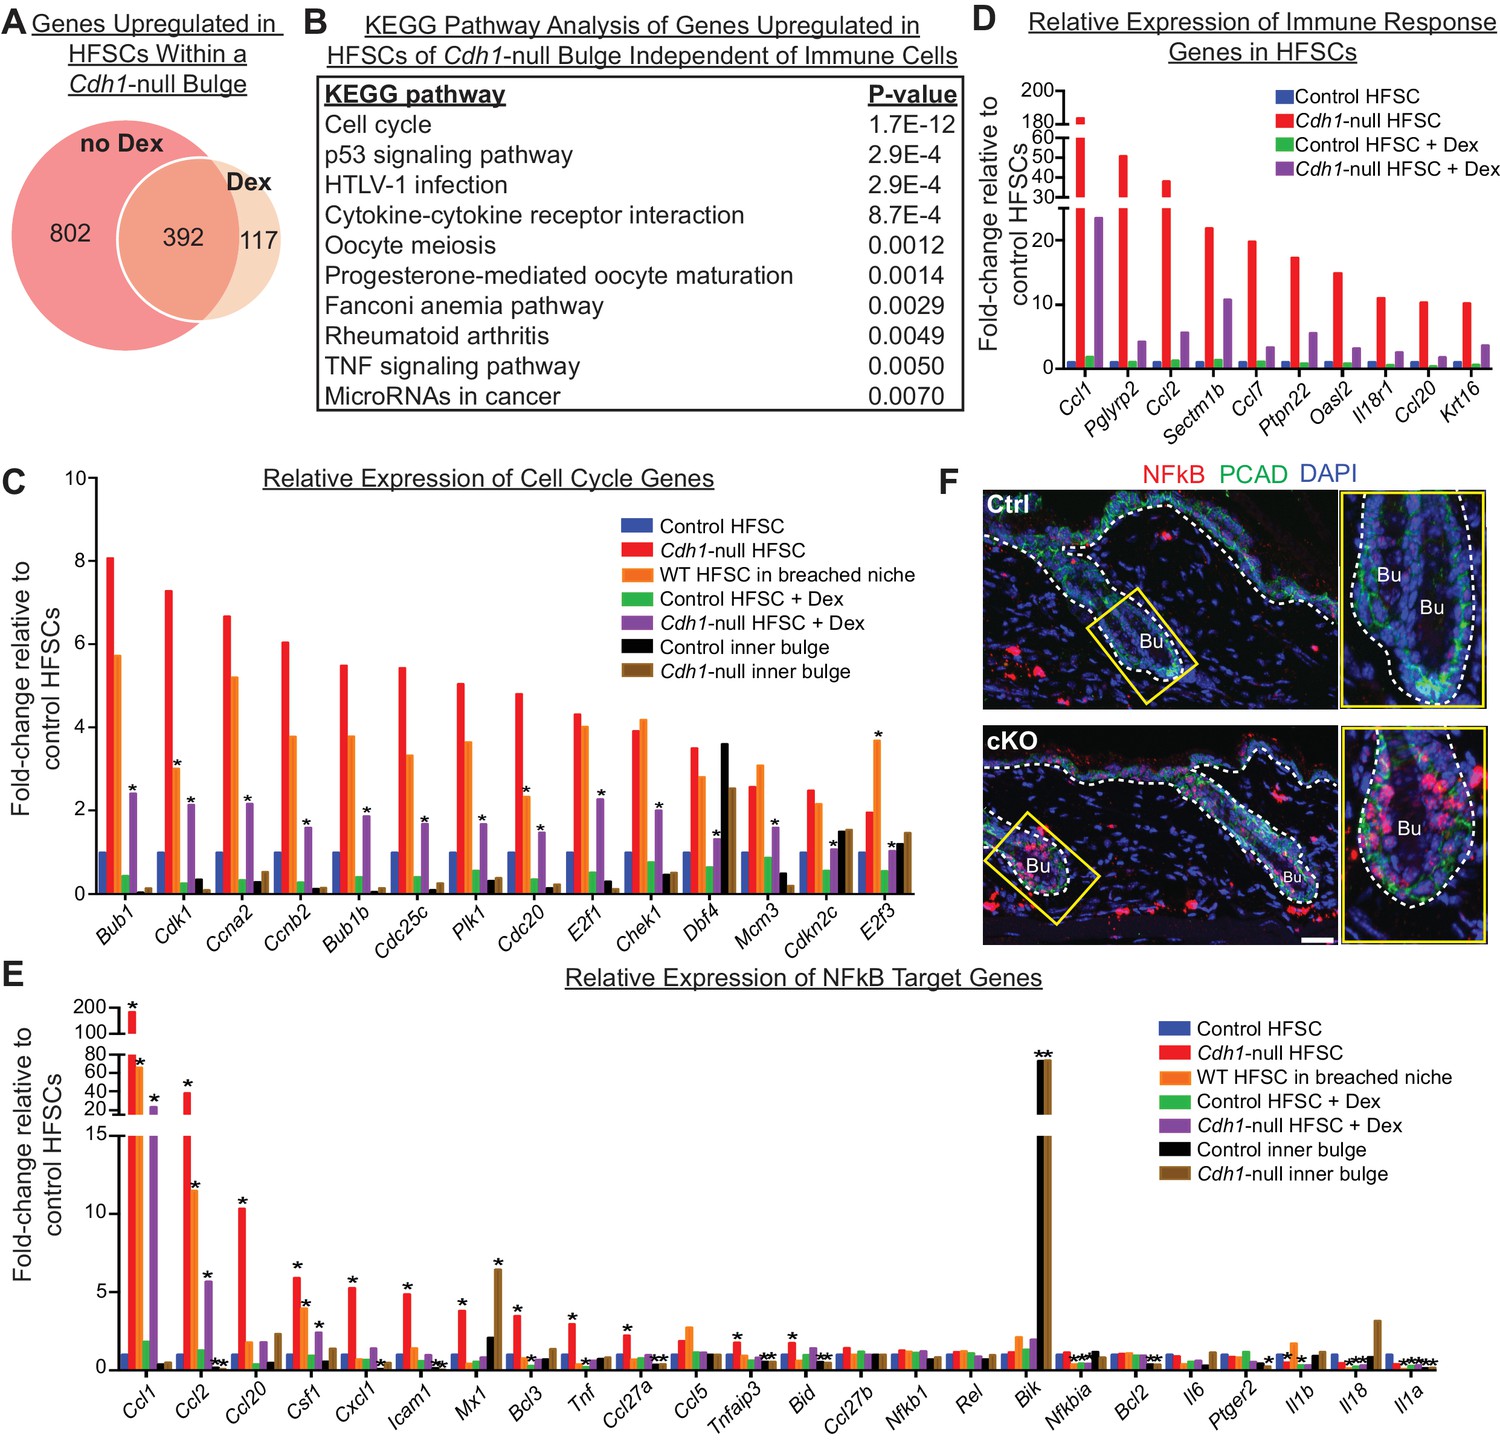
Stem cell transcriptomic changes occur in direct response to a barrier breach.
(A, B) Comparisons of transcriptomes of HF stem cells (HFSCs) from Cdh1 cKO vs.Ctrl bulges ±Dex. Venn Diagram (A) showed 392 overlapping genes that were significantly up-regulated (p < 0.05, fold-change [FC]≥1.5, 509 genes total) independent of Dex. (B) KEGG pathway analysis of these genes. (C) Relative expression of ‘Cell cycle’ genes from (B) in various HF stem cell and inner bulge populations. These genes are also significantly upregulated (p < 0.05) in WT SCs in a breached niche vs. control SCs. *p < 0.05 relative to Cdh1-null HFSCs. (D) Relative expression of immune response genes in stem cells from Cdh1-null bulge vs. Ctrl bulge in the absence or presence of Dex treatment. (E) Relative expression of NFkB target genes in various HF stem cell and inner bulge populations. *p < 0.05 (with absolute FC ≥1.5) relative to control HF stem cells. (F) Immunofluorescence for phosphorylated p65, a subunit of the NFkB transcription factor. Note increased nuclear p-p65 signal in Cdh1-cKO bulge (Bu) indicative of NFkB signaling activity.
Figure 8
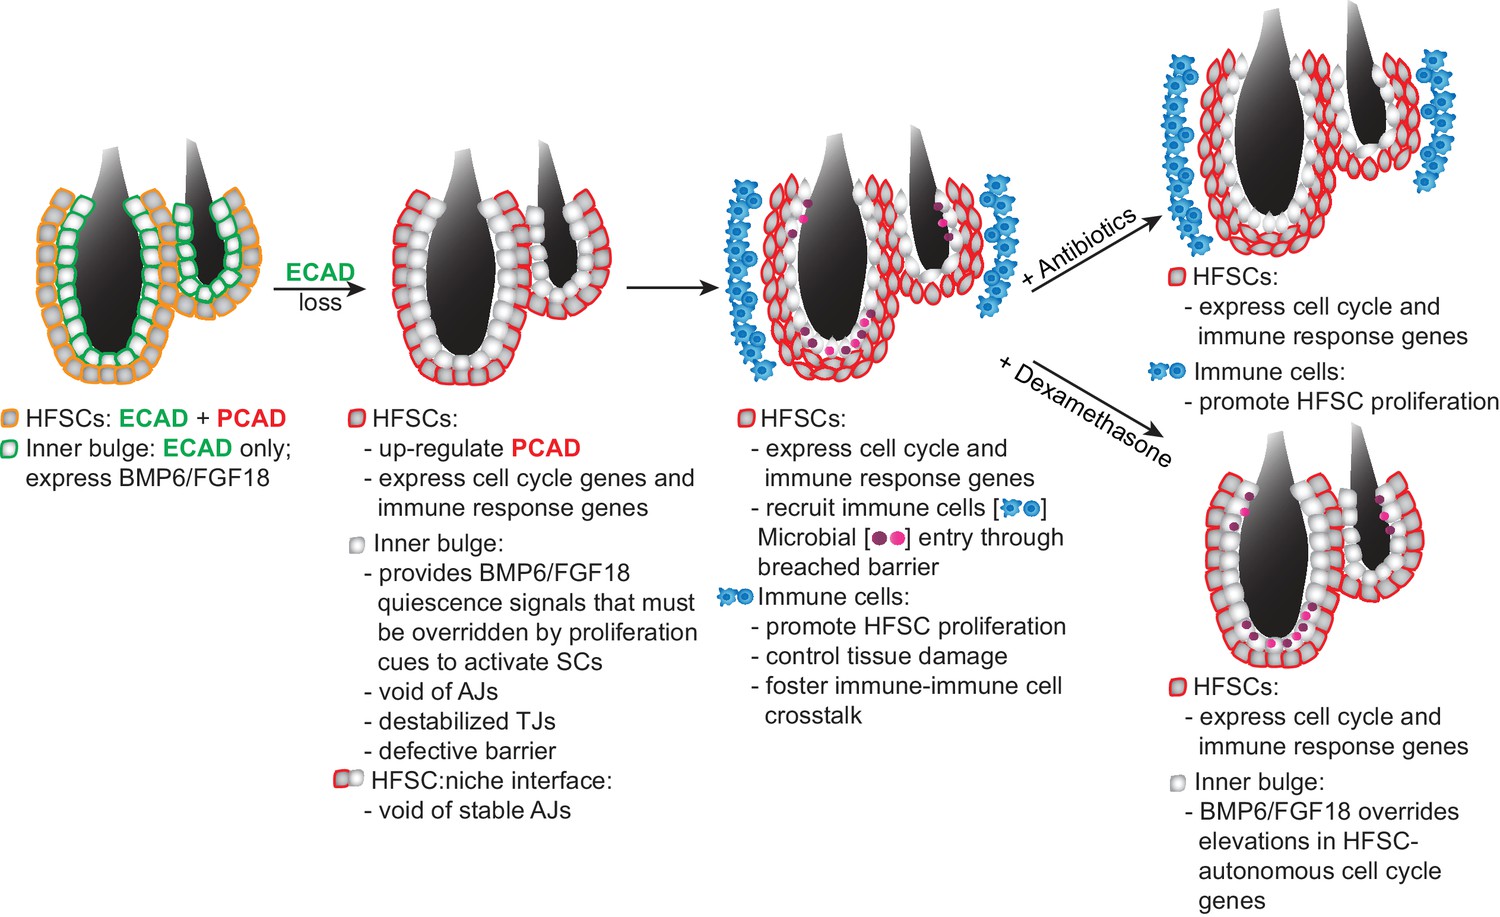
Model Summarizing How Stem Cells Respond to a Breach in Their Niche Barrier and Launch a Patch Process by Repurposing Stem Cell Proliferation.
During telogen, inner bulge niche cells express BMP6 and FGF18, which maintain stem cell quiescence. When the sole cadherin (ECAD) of the inner bulge is removed, the niche cannot make adherens junctions (AJs), leading to tight junction destabilization, a barrier breach and microbial infiltration. Even though stem cells have compensatory PCAD and maintain stem cell-stem cell AJs, they cannot form AJs along the niche-stem cell interface. This reduction in AJ components induces a cell cycle transcriptome which lowers the threshold for proliferation, but is kept in check by niche inhibitory signals. Within their breached niche, stem cells also induce a transcriptome geared towards recruiting immune cells to the bulge, independent of the increased bacterial load. The stem cells need this altered microenvironment to tip their proliferative balance. Without anagen cues, newly generated stem cells remain within the bulge, where they are repurposed to boost the output of distress signals to the immune system and contain the breached barrier by reinforcing the bulge with layers of immune cells and stem cells that display intact cellular junctions.
Additional files
-
Transparent reporting form
- https://doi.org/10.7554/eLife.41661.019
Download links
A two-part list of links to download the article, or parts of the article, in various formats.
Downloads (link to download the article as PDF)
Open citations (links to open the citations from this article in various online reference manager services)
Cite this article (links to download the citations from this article in formats compatible with various reference manager tools)
Stem cells repurpose proliferation to contain a breach in their niche barrier
eLife 7:e41661.
https://doi.org/10.7554/eLife.41661


