Genetic effects on promoter usage are highly context-specific and contribute to complex traits
- University of Tartu, Estonia
- Wellcome Sanger Institute, Wellcome Genome Campus, United Kingdom
- University of Cambridge, United Kingdom
- Addenbrooke’s Hospital, United Kingdom
Figures
Figure 1 with 4 supplements
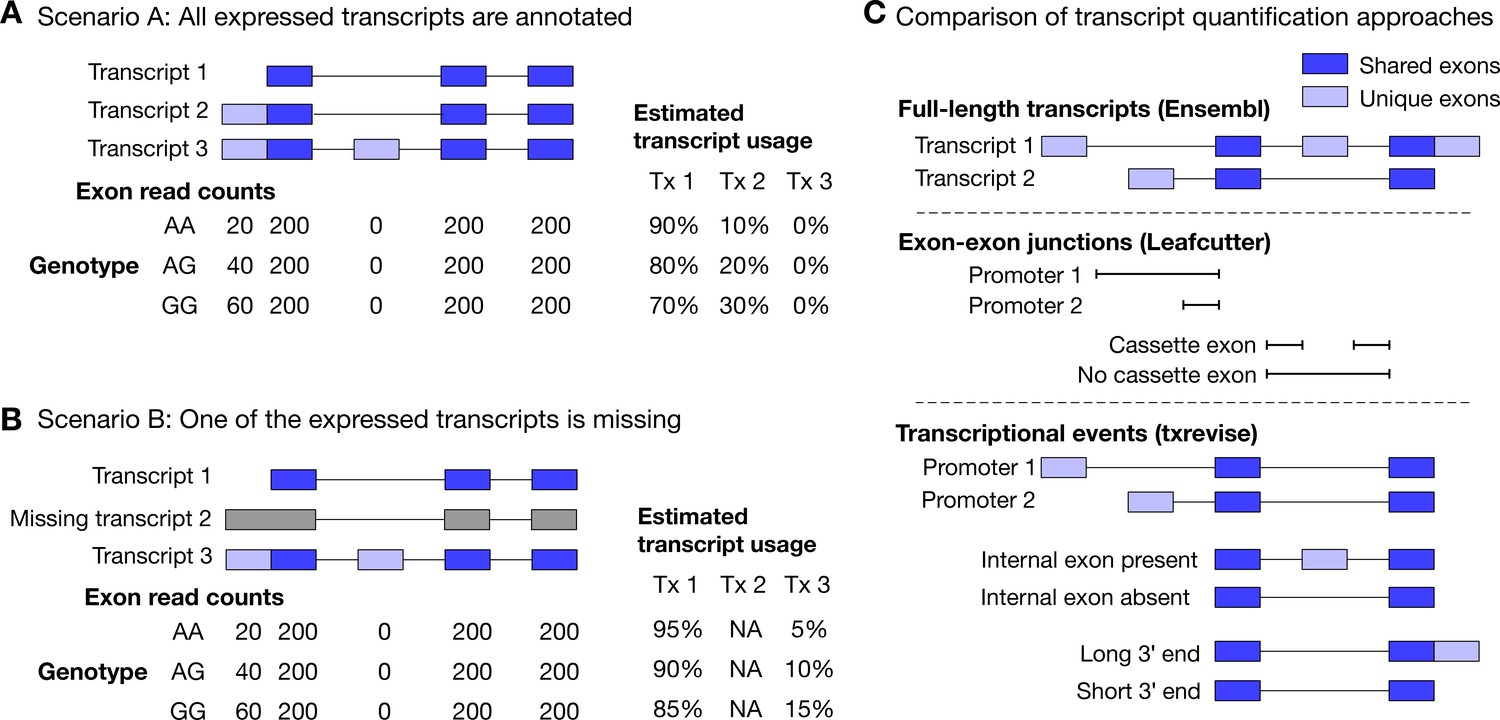
Challenges of quantifying transcript usage from RNA-seq data.
Transcript quantification seeks to estimate the most likely configuration of known transcripts that best explains observed read counts supporting the inclusion of each exon. (A) In scenario A, each copy of the G allele increases the usage of transcript 2 by 10%. Since both expressed transcripts (transcript 1 and transcript 2) are annotated, we successfully detect the change and conclude that the G allele increases the expression of the proximal promoter of the gene. (B) In scenario B, each copy of the G allele still increases the usage of transcript 2 by 10%. However, since transcript 2 is missing from the annotations, reads originating from transcript 2 are now falsely assigned to transcript 3. Since transcript 3 also contains alternative second exon, we now falsely conclude that in addition to promoter usage, the G allele is also associated with increased inclusion of exon 2, even though there are no reads mapping to exon 2. Furthermore, the magnitude of the genetic effect is underestimated, because the reads assigned to transcript 3 are assumed to be evenly distributed across the promoter and the alternative exon. (C) Top panel: Two hypothetical transcripts that differ from each other at the promoter, at an internal exon and at the 3ʹ end. Middle panel: Leafcutter uses reads mapping to exon-exon junctions to identify alternatively excised introns. Bottom panel: txrevise uses the exons shared between transcripts (dark blue) as a scaffold to construct three independent transcriptional events from the two original transcripts.
Figure 1—figure supplement 1
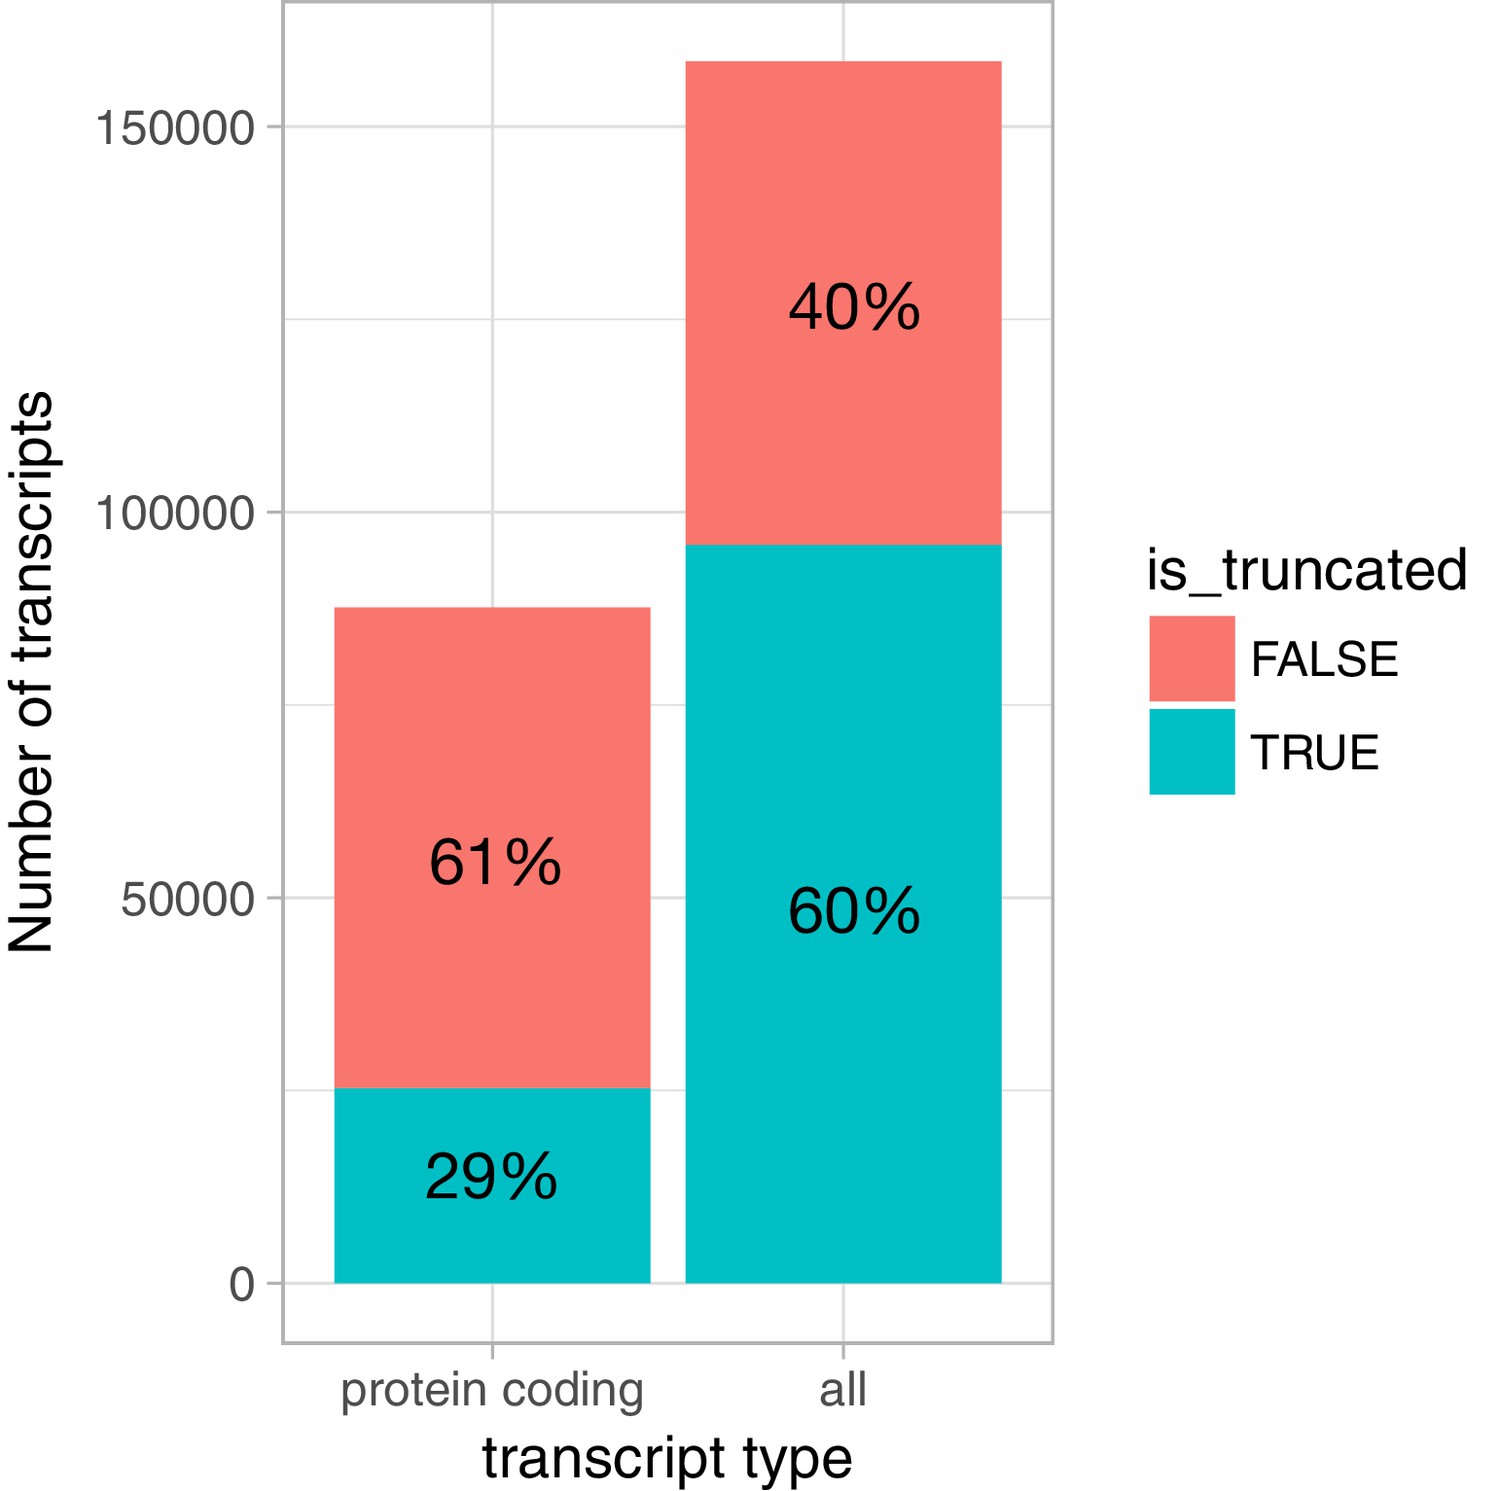
Prevalence of truncated transcripts in the Ensembl database.
For protein coding transcripts, we extracted the cds_start_NF and cds_end_NF fields from the Ensembl v87 GTF file to identify transcripts that were truncated at either 5ʹ or 3ʹ ends. For non-protein coding transcripts, we considered all transcripts annotated as nonsense_mediated_decay, processed_transcript or retained_intron to be truncated at both 5ʹ or 3ʹ ends, because we observed that many of those started and ended abruptly in the middle of exons. We included only protein coding genes in the analysis.
Figure 1—figure supplement 2
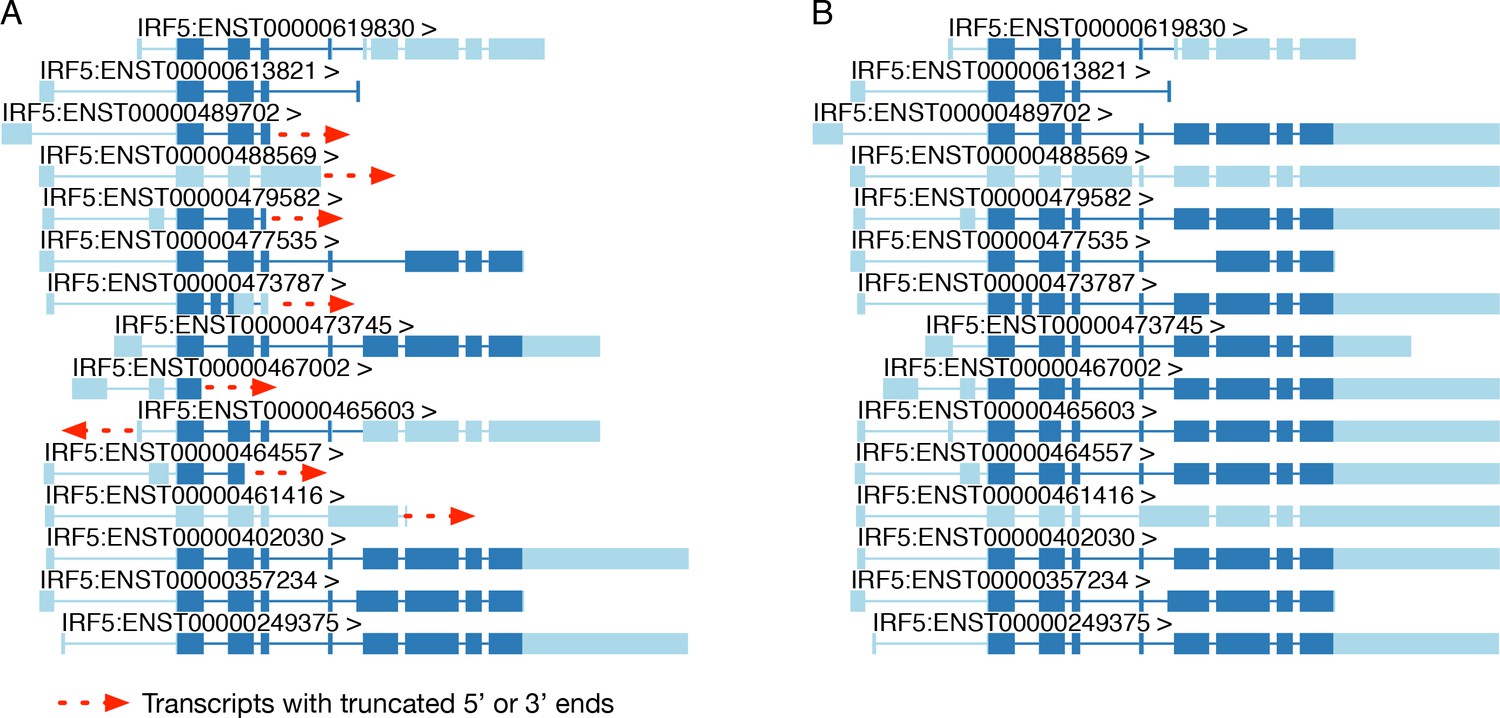
Extending truncated transcript annotations with txrevise.
(A) Original transcript annotations for IRF5 in the Ensembl database. (B) Txrevise extends truncated IRF5 transcripts by copying over exons from the longest transcript of the gene (ENST00000402030). The dark blue regions represent the annotated coding regions while the light blue regions represent either 5ʹ or 3ʹ UTRs or non-coding transcripts. This functionality is implemented in the extendTranscriptsPerGene function of the txrevise R package.
Figure 1—figure supplement 3
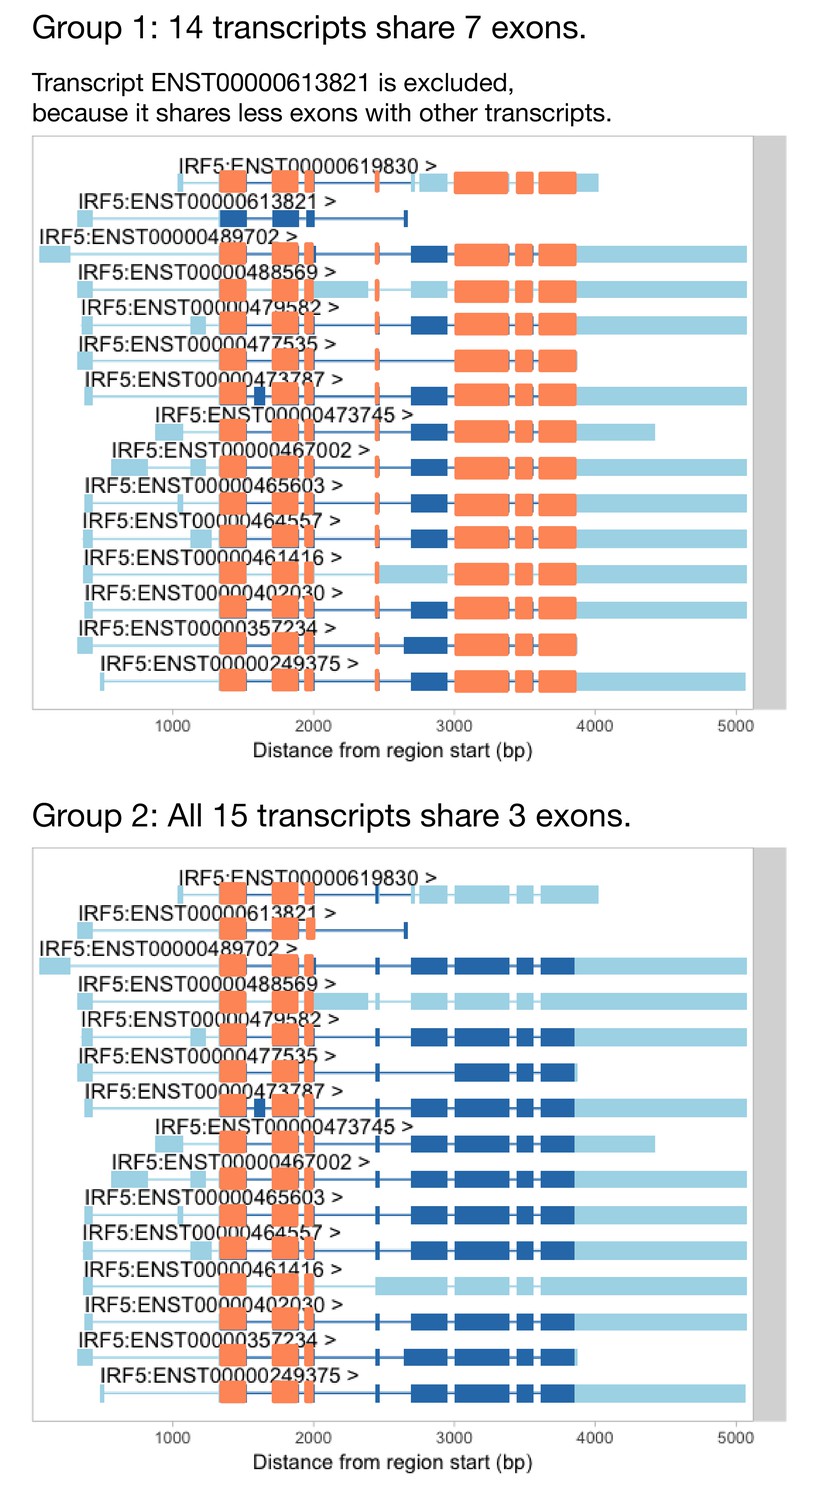
Identifying groups of transcripts that share the most exons.
Before we can use txrevise to stratify transcripts into events, we need to identify a group of transcripts that all share at least one exon. IRF5 has three exons that are shared between all of the transcripts and so we could use those as a scaffold for txrevise to construct independent transcriptional events (group 2). However, some genes do not have any exons that are shared across all transcripts. In that case, it might be preferential to choose the largest group of transcripts that share the most exons (group 1). Furthermore, even in the case of IRF5, one transcript (ENST00000613821) is much shorter than others and excluding it might lead to better stratification of transcripts into alternative promoter, internal exon and 3ʹ end events (group 1). However, it is challenging to automatically decide whether to prefer more shared exons between transcripts (as illustrated by group 1) or larger number of transcripts (eg. group 2). Thus, txrevise uses an heuristic approach that first ranks groups of transcripts according to the number of exons that they share and then picks the first two groups that share the largest number of exons between each other. In case of IRF5, these two groups are denoted as group 1 and group 2 on this figure. This functionality is implemented by the identifyTranscriptGroups function of the txrevise R package.
Figure 1—figure supplement 4
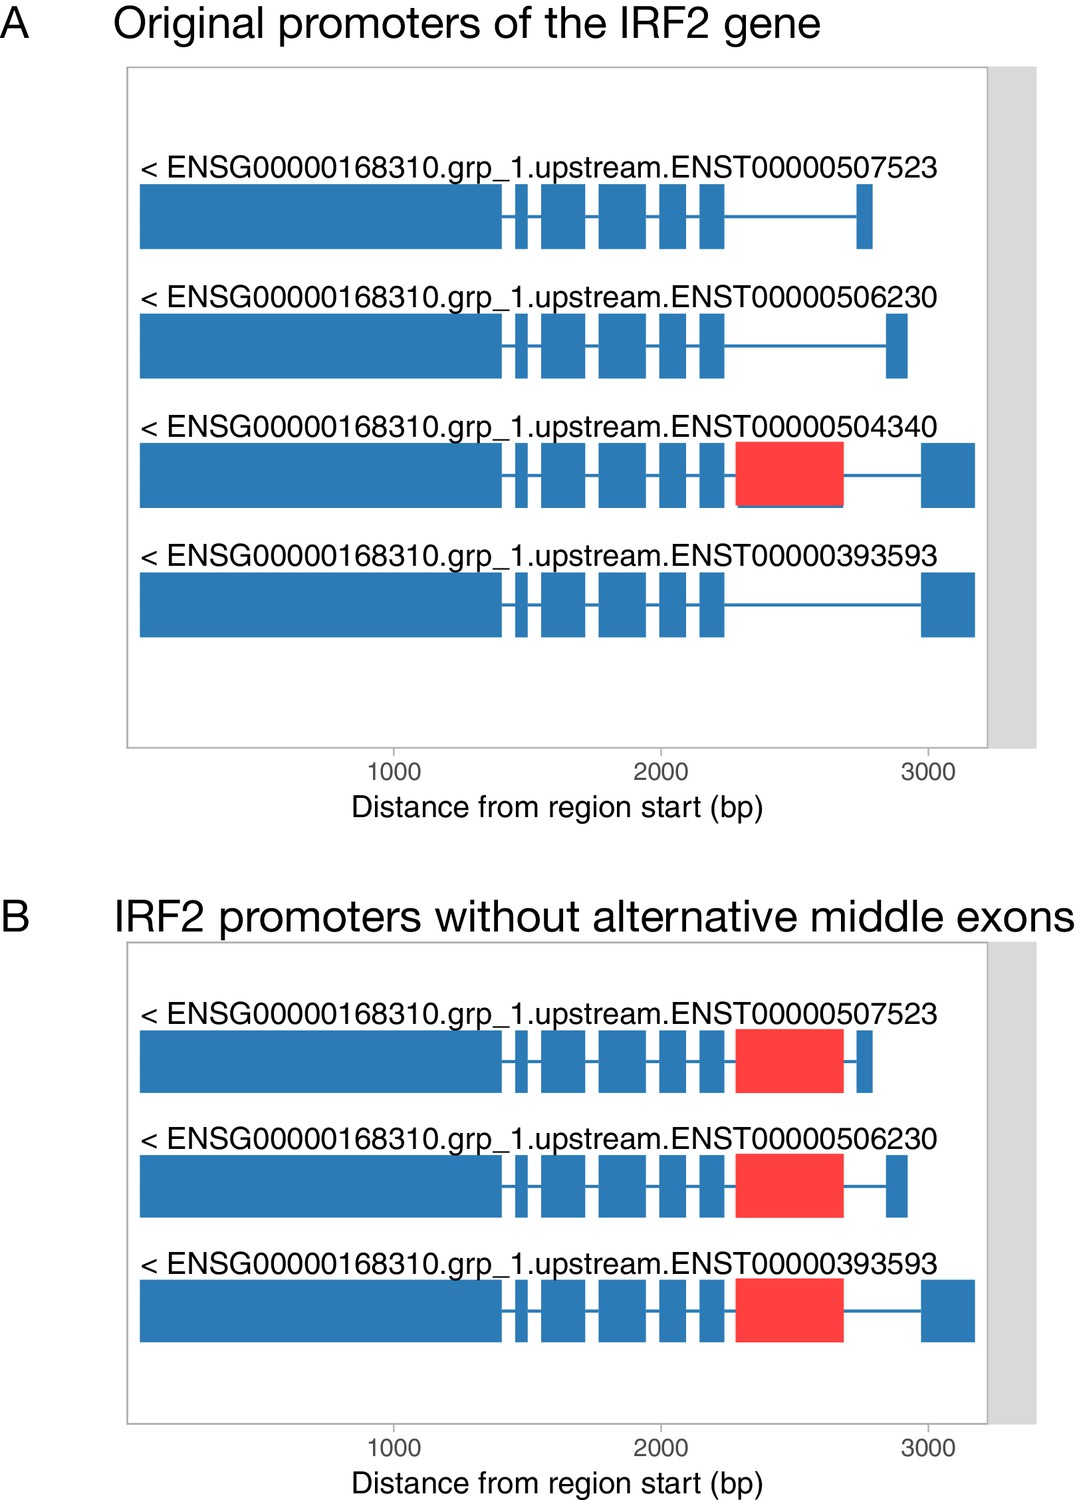
Filling in alternative internal exons for promoter and 3ʹ end events.
(A) Original transcript start events constructed by txrevise contain an alternative second exon. (B) To construct promoter events, the alternative second exon is added into all transcripts and redundant transcripts are removed.
Figure 2 with 7 supplements
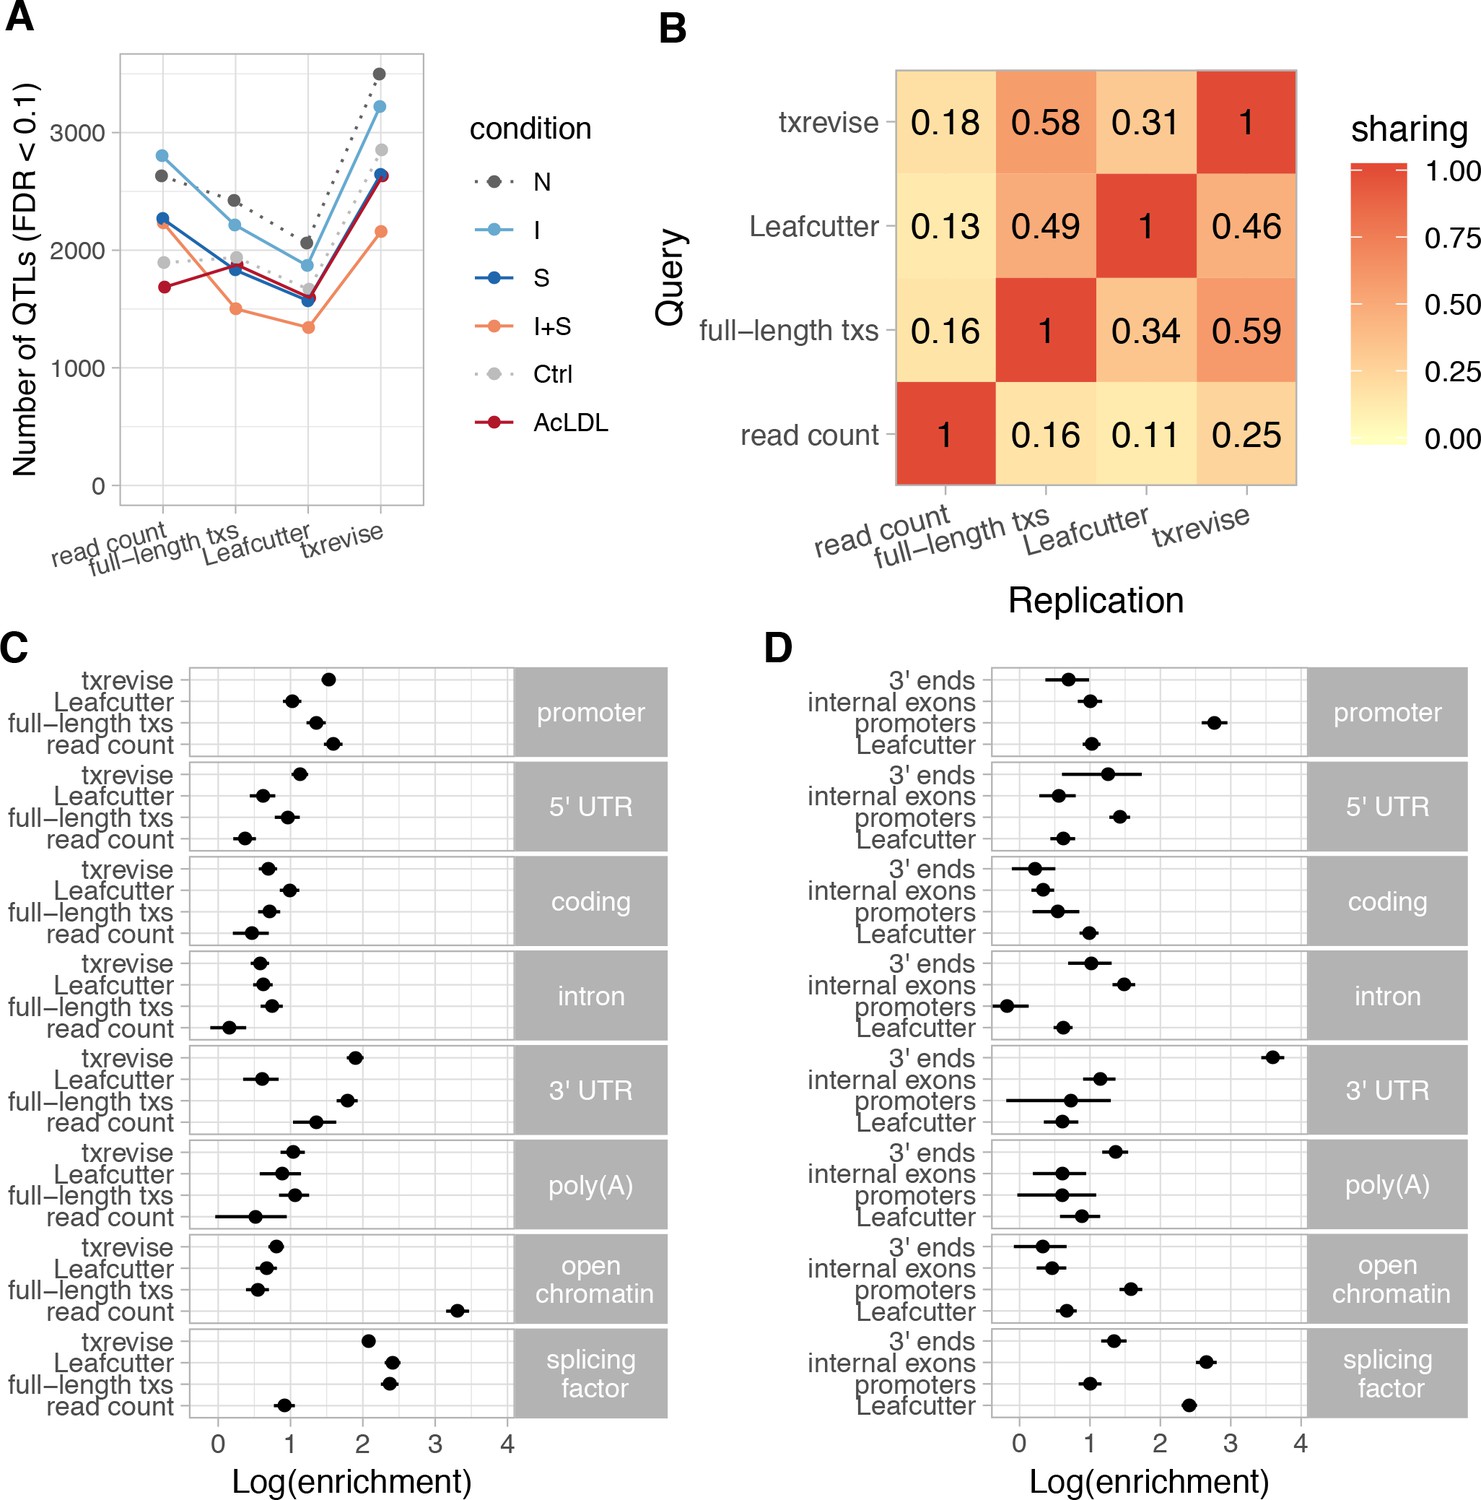
Diversity of QTLs detected by different quantification methods.
In panels A-C, all txrevise QTLs from promoters, internal exons and 3ʹ ends have been pooled to facilitate comparison with eQTLs as well as Leafcutter and full-length transcript usage QTLs. (A) Number of QTLs detected by read count, full-length transcript usage, Leafcutter and txrevise methods in each condition (N, naive; I, IFNɣ; S, Salmonella; I + S, IFNɣ+Salmonella; Ctrl; AcLDL) at 10% FDR. The number of QTLs detected by Leafcutter and txrevise are reported at the level of independent events (intron clusters or promoters/internal exons/3ʹ ends) and can include multiple QTLs per gene (Figure 2—figure supplement 2). The quantile-quantile plots are presented in Figure 2—figure supplement 3. (B) Sharing of QTLs detected by four quantification methods. The numbers on the heatmap show the fraction of QTLs detect by one method that were replicated by each of the three other methods (r2 >0.8 between lead variants). Only QTLs with FDR < 0.01 were included in the analysis. (C) Enrichment of genomic annotations at QTLs detected by the four quantification methods. (D) Comparison of Leafcutter tuQTLs to promoter, internal exon and 3ʹ end usage QTLs detected by txevise. Genomic annotations used for enrichment analysis: promoter - promoter flanking regions (−2000 bp to +200 bp); 5ʹ UTR, coding, intron, 3ʹ UTR - corresponding regions extracted from Ensembl transcripts; poly(A) - experimentally determined polyadenylation sites (±25 bp) (Gruber et al., 2016); open chromatin - open chromatin regions from macrophages (Alasoo et al., 2018); splicing factor - experimentally determined binding sites of splicing factors detected by eCLIP (Van Nostrand et al., 2017). The points on panels C and D show the natural logarithm of enrichment for each annotation and the lines represent the 95% confidence intervals from fgwas (Pickrell, 2014).
Figure 2—figure supplement 1
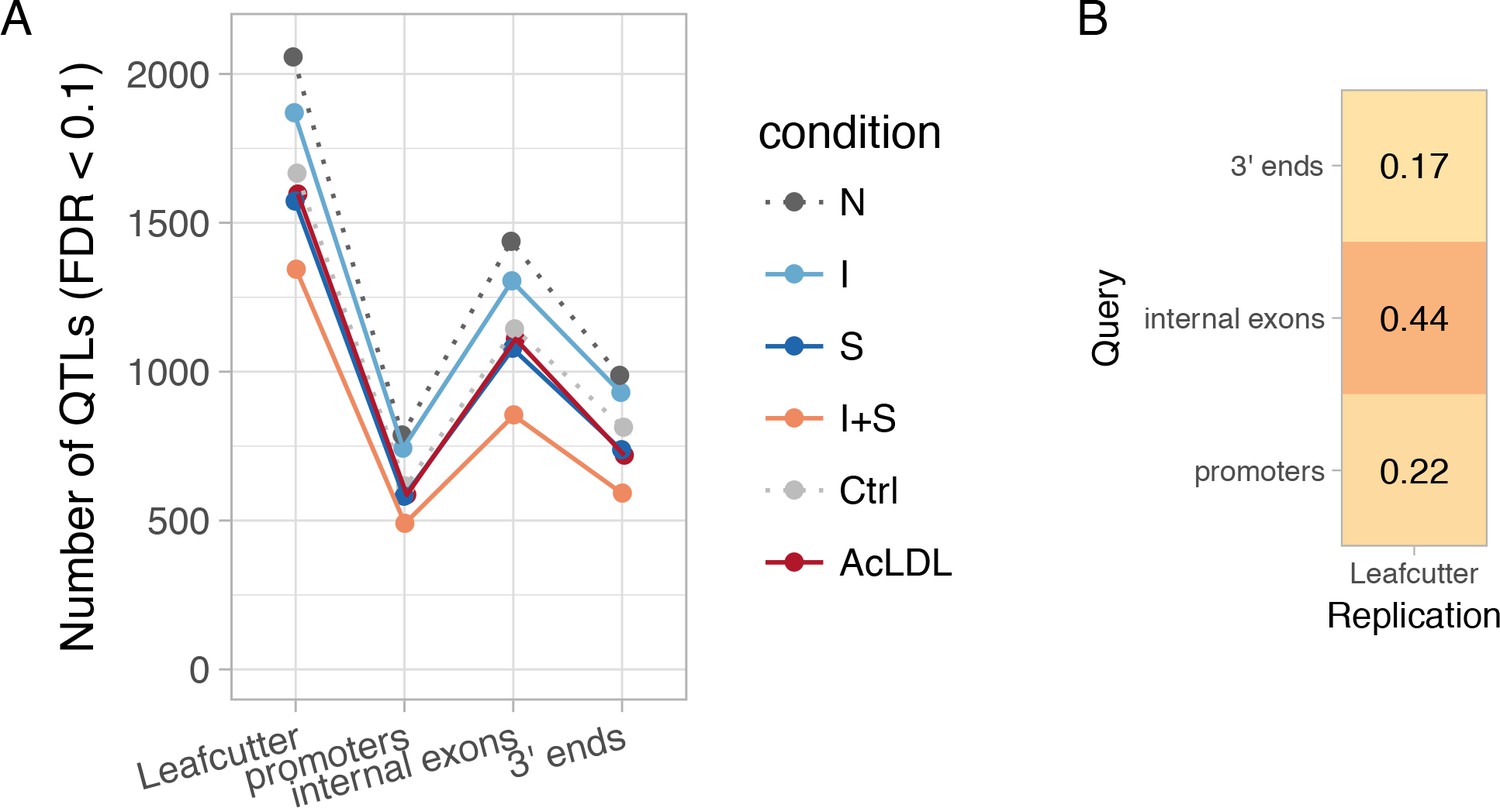
Diversity of transcript usage QTLs.
(A) Number of detected transcript usage QTLs affecting exon-exon junction usage (Leafcutter) or different parts of the transcript (promoters, internal exons, 3ʹ ends) in each experimental condition. N, naive; I, IFNɣ; S, Salmonella; I + S, IFNɣ+Salmonella. (B) Fraction of txrevise promoter, internal exon and 3ʹ end usage QTLs that were replicated by Leafcutter (lead variant within r2 >0.8 for the same gene; see Materials and methods).
Figure 2—figure supplement 2
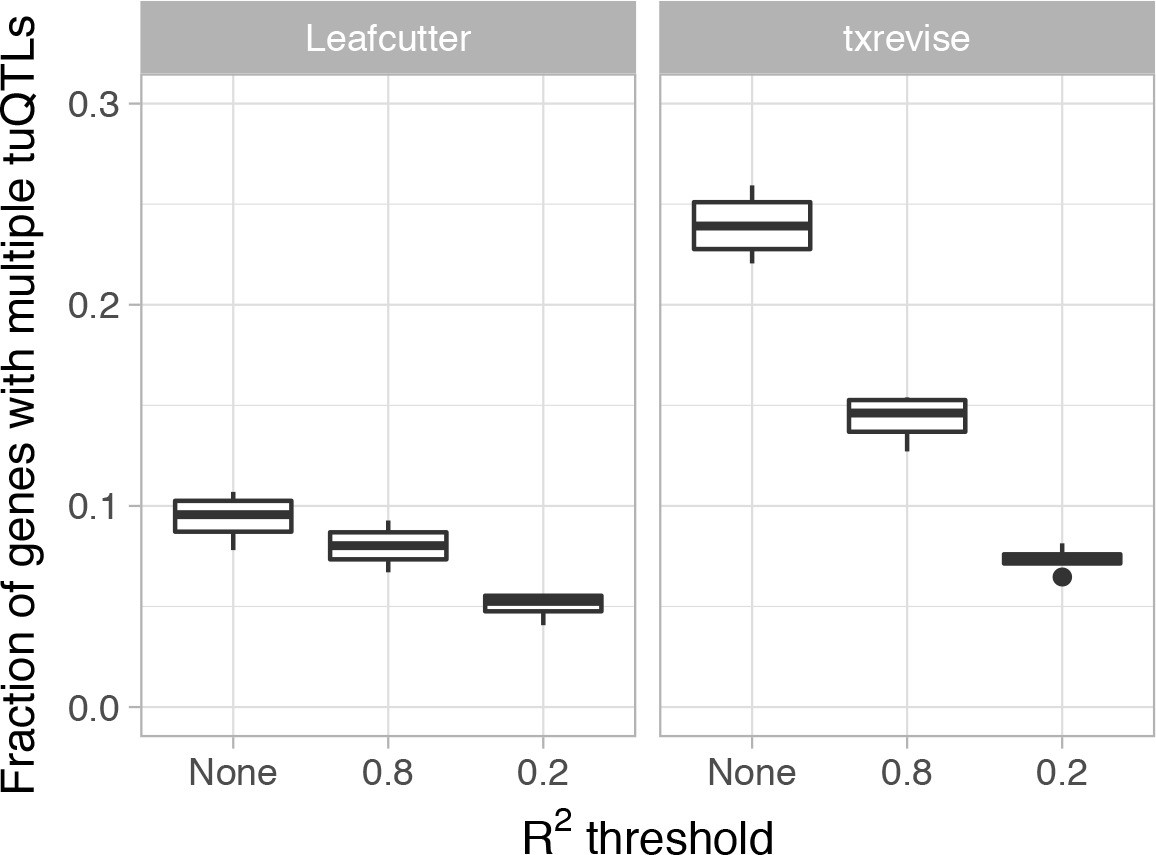
Fraction of genes with multiple independent tuQTLs detected by Leafcutter and txrevise.
We first identified all tuQTLs for the same gene at the same 10% FDR threshold and then ascertained their independence by thresholding on LD at two levels of stringency (r2 <0.2 or r2 <0.8).
Figure 2—figure supplement 3

Quantile-quantile plots of the QTLs detected by the four quantification methods.
The number of independent features tested by each quantification method are marked on the plot. In case of transcript usage QTLs (full-length transcripts, Leafcutter and txrevise), the ‘--grp-best’ option of QTLtools ensured that permutation p-values were corrected for the number of alternative transcripts, exon-exon junction or transcriptional events tested. Only the quantile-quantile plots from the naive condition are shown, but the other conditions looked very similar.
Figure 2—figure supplement 4
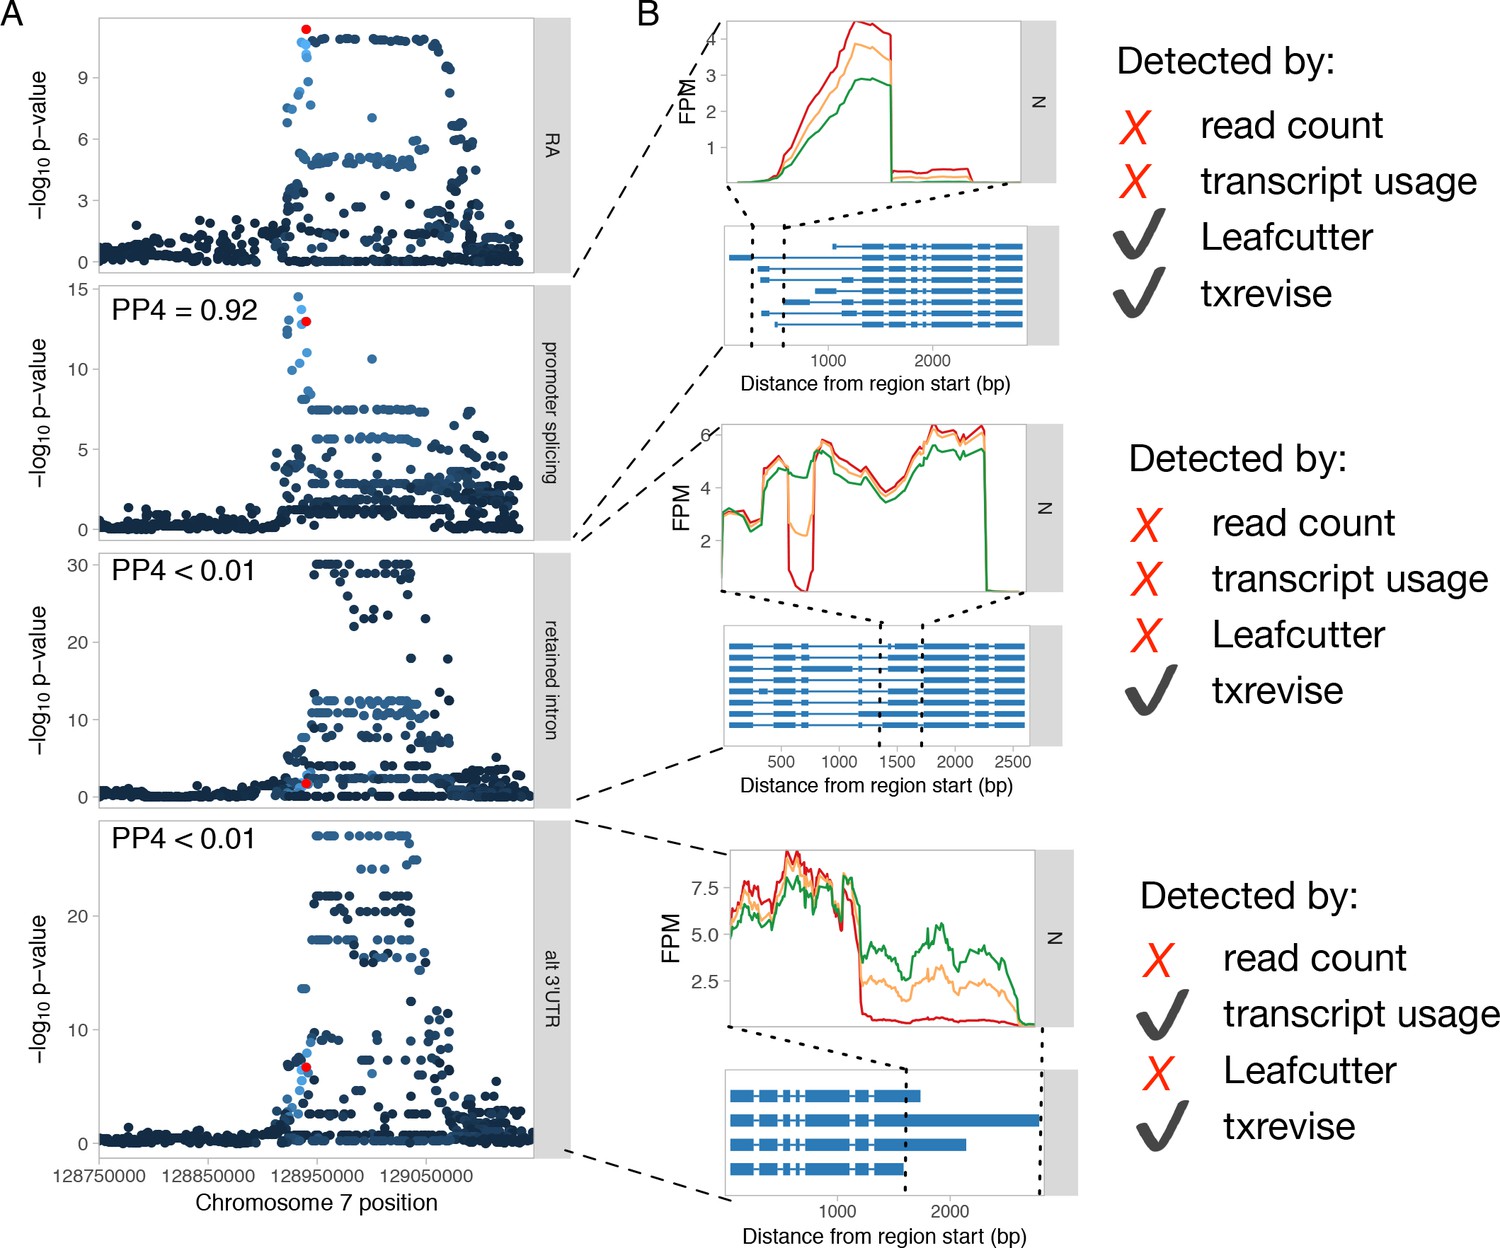
Genetics of transcript usage of the IRF5 gene.
(A) Three independent tuQTLs for IRF5 regulating splicing in the first exon, intron retention in coding exon 5, and 3ʹ UTR length. PP4 represents the posterior probability from coloc (Giambartolomei et al., 2014) that the GWAS and QTL signals share a single causal variant. Only the promoter splicing QTL colocalises with a GWAS hit for rheumatoid arthritis (RA) (Okada et al., 2014) (PP4 = 0.92). The red dot represents the RA GWAS variant while the other dots are shaded according to the r2 from the lead GWAS variant. (B) RNA-seq read coverage plots of the three tuQTLs stratified by the genotypes of the lead variants. Only txrevise detected all three tuQTLs. Leafcutter only detected the first splicing event, because the other two did not manifest at level of junction reads. Similarly, full-length transcript usage analysis only detected the polyadenylation event, because it had the largest effect size. FPM, fragments per million.
Figure 2—figure supplement 5
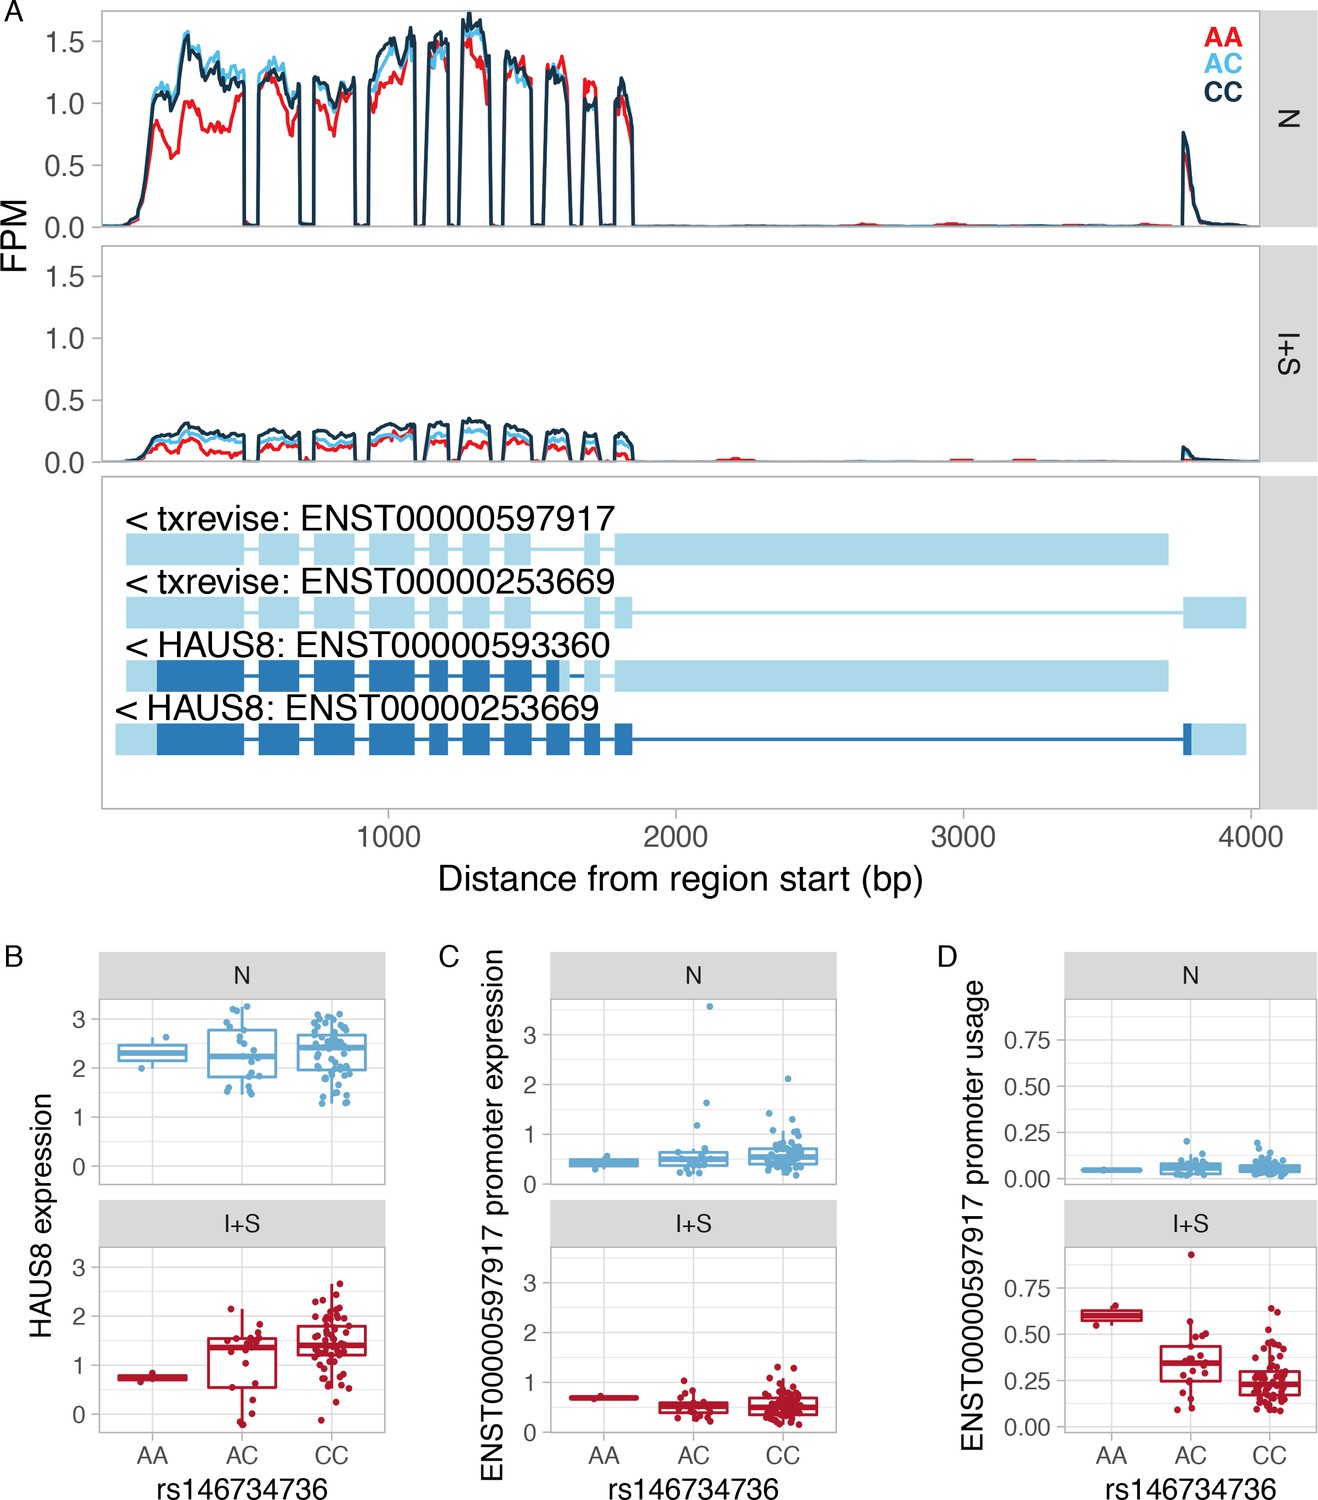
Example of an apparent tuQTL caused by a strong eQTL.
(A) RNA-seq read coverage plot of the HAUS8 gene stratified by the genotype of the lead eQTL variant. FPM, fragments per million. (B) The rs146734736 variant is an IFNɣ+Salmonella specific eQTL for the HAUS8 gene, regulating its total gene expression level. (C) The y-axis shows the absolute expression of the secondary promoter (ENST00000597917) in transcripts per million (TPM) units as estimated by Salmon. The lead eQTL variant is not associated with the absolute expression level of the secondary promoter in either condition. Furthermore, the average expression of the ENST00000597917 promoter is below 1 TPM, suggesting that it is either not expressed or expressed at a very low level. This is mirrored by very low read coverage at the alternative promoter (panel A). (D) Since the rs146734736 variant is associated with total expression level of the HAUS8 gene (panel B), but not with the absolute expression level of the ENST00000597917 promoter (panel C), it appears to be associated with the usage of the ENST00000597917 promoter. This is because promoter usage is calculated by dividing the expression level of one promoter by the total expression of all promoters of the gene. N, naive; I + S, IFNɣ+Salmonella.
Figure 2—figure supplement 6
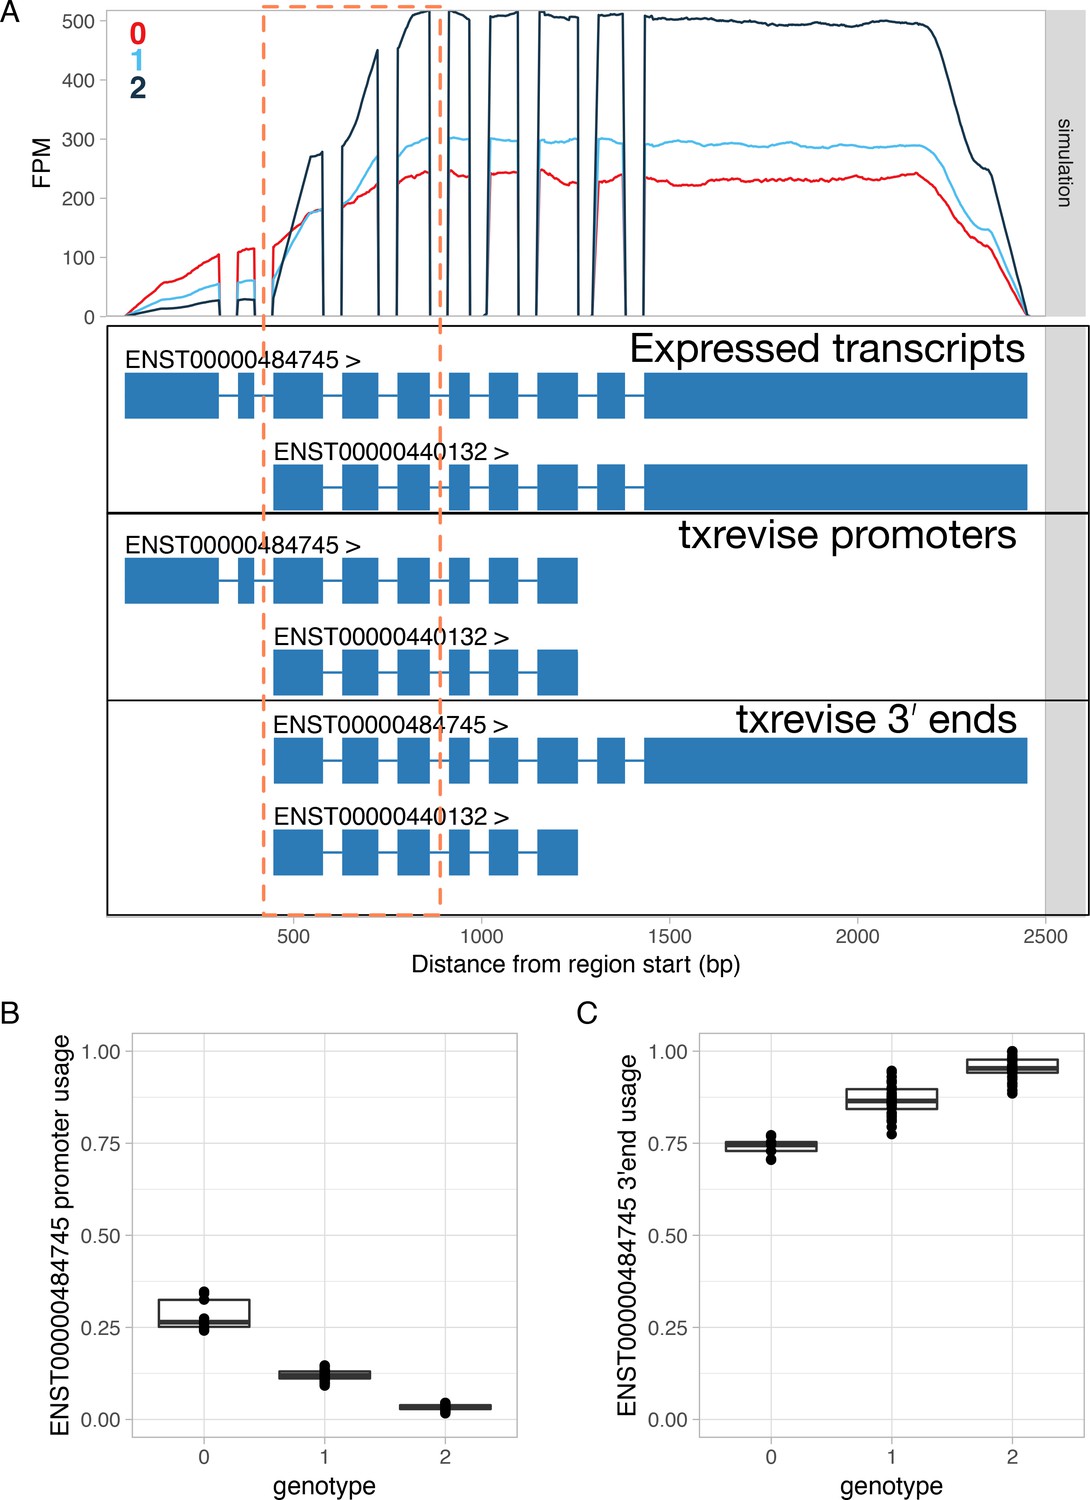
Simulated promoter usage QTL for the RNF220 gene leads to a false positive association at the 3ʹ end.
Simulations were performed using polyester (Frazee et al., 2015). (A) Simulated read coverage of the RNF220 gene. Each additional copy of the alternative allele was simulated to decrease the usage of the long 5ʹ end over the short 5ʹ end (Expressed transcripts). Note that due to positional bias (Love et al., 2016; Roberts et al., 2011) in the RNA-seq data, the read coverage gradually decreases at the 5ʹ and 3ʹ ends of the transcript. The extent of this bias is likely to depend on the fragment length distribution of the dataset. While the simulated data had fragment length distribution with mean = 250 and sd = 25, this can vary substantially for real-world datasets. Importantly, increased usage of the short 5ʹ end leads to lower read coverage at exons 3–5 due to this bias (highlighted by the dashed orange box). FPM, fragments per million. (B) Estimated usage of the long 5ʹ end event stratified by the genotype of the simulated causal variant. In this case, txrevise is able to correctly detect the decrease in long 5ʹ end usage. (C) Estimated usage of the transcript with the long 3ʹ end stratified by the causal promoter usage QTL variant. Although we simulated no change at the 3ʹ end of the gene, txrevise still detects a false positive association. This is due to the fact that individuals with higher expression of the transcript with a short 5ʹ end have relatively fewer reads mapping to exons 3–5 (dashed orange box) compared to the exons that are specific to the long 3ʹ end. Consequently, it seems that the genetic variant decreasing short 5ʹ end usage is also associated with increased expression of the long 3ʹ end even though there are no additional reads mapping to the long 3ʹ end.
Figure 2—figure supplement 7
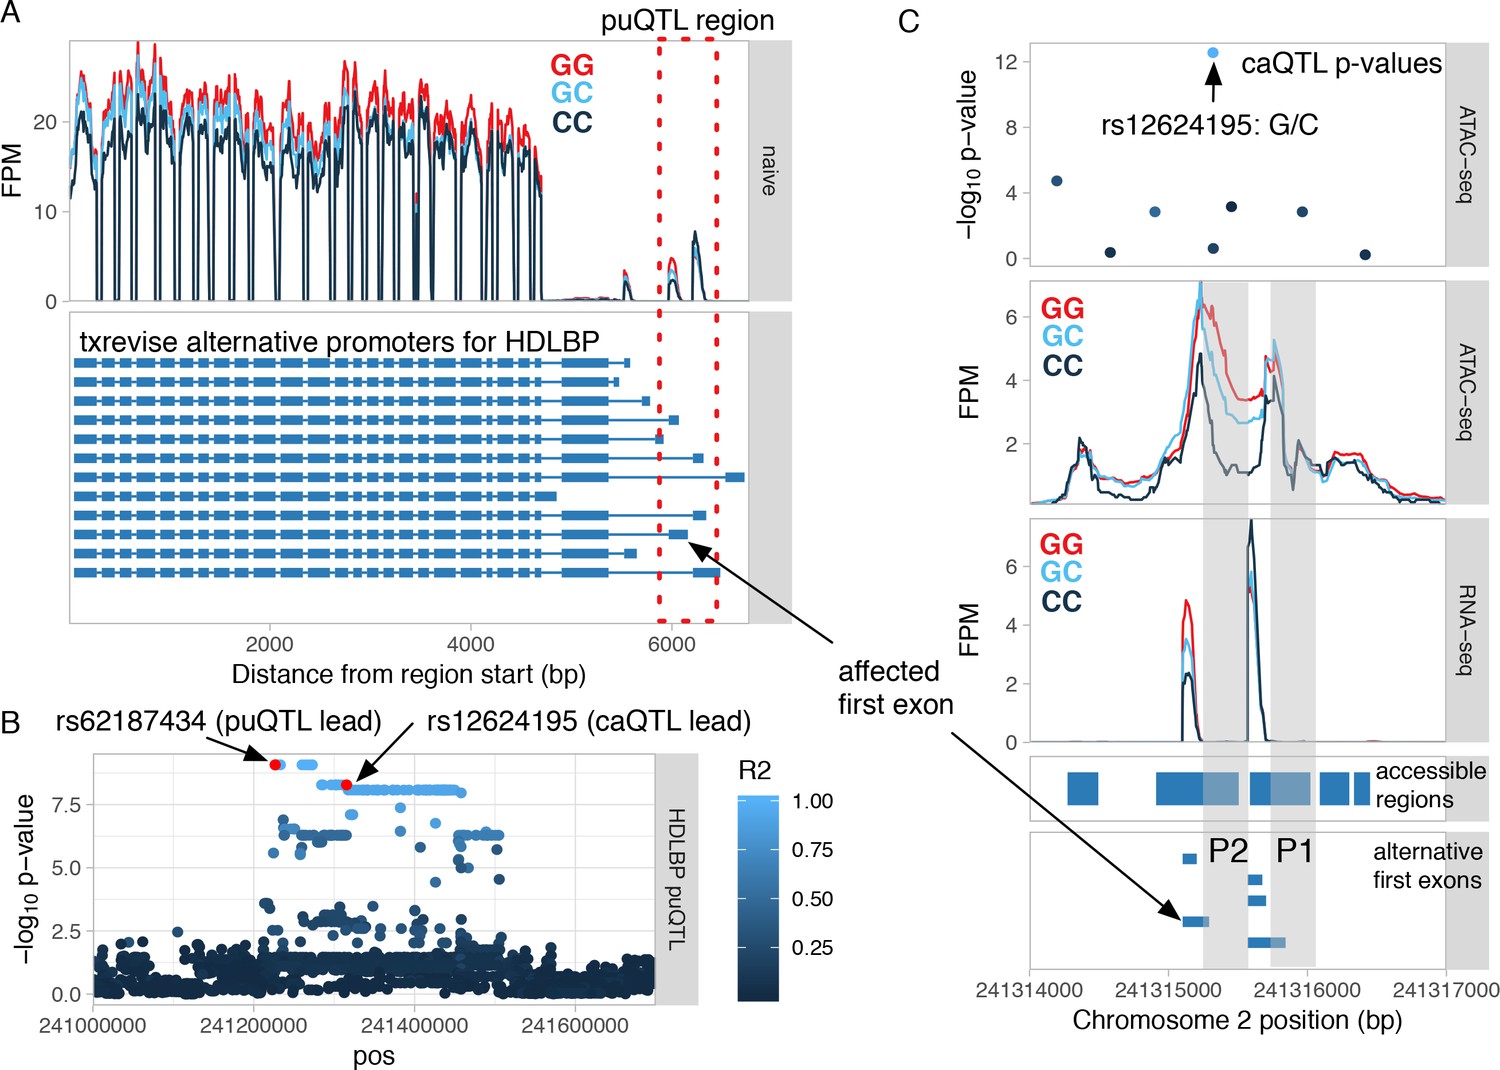
Shared genetic effect on promoter usage and chromatin accessibility at the promoter of HDLBP.
(A) The RNA-seq read coverage plot from the HDLBP locus stratified by the genotype of the promoter usage QTL (puQTL) lead variant (rs62187434). The blue gene models depict the alternative promoter events quantified by txrevise. The affected promoter region is highlighted by the red rectangle and zoomed-in view is shown on panel C. (B) Manhattan plot of the puQTL p-values from the region. The affected first exon regulated by the puQTL is marked on panel A. The puQTL lead variant is in high LD with a chromatin accessibility QTL (caQTL) lead variant in the same promoter region (r2 = 0.96). The lead variants of both QTLs are marked by the red circles. (C) Closer view of the genomic region covering the two alternative promoters. The caQTL lead variant (rs12624196, top panel) is in the middle of the broader accessible region spanning the two promoters P1 and P2 and is associated with increased chromatin accessibility at the second promoter (P2), but not the first promoter (P1) (middle panel). The caQTL variant is also associated with increased transcription from the alternative first exons downstream of the P2 promoter (bottom panel). FPM - fragments per million.
Figure 3 with 2 supplements
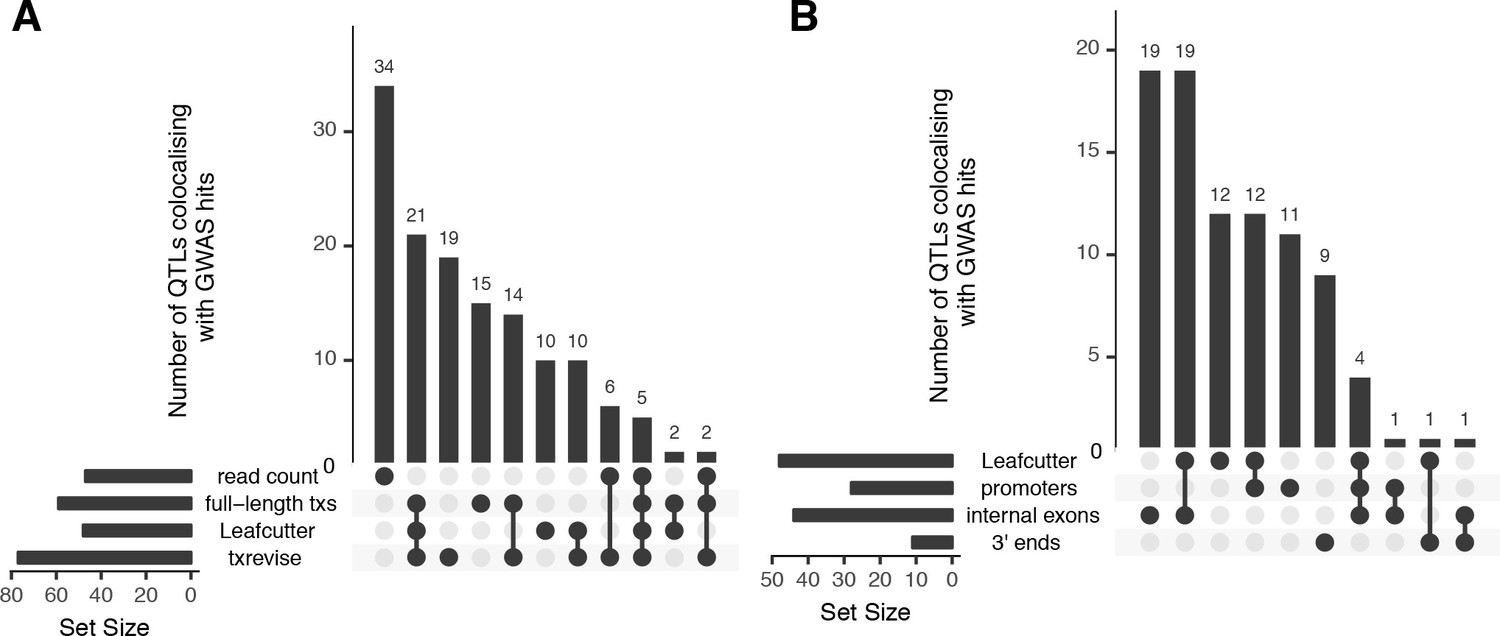
Overlap of colocalised gene-trait pairs detected by the four quantification methods across 33 complex traits.
The UpSetR plot is an alternative to Venn diagrams for visualising intersection of multiple sets (Conway et al., 2017). The horizontal bars show the total number of colocalised trait-gene pairs detected by each quantification method. The dark circles indicate different patterns of sharing between the quantification methods and the vertical bars show how many gene-trait pairs followed a given sharing pattern. For example, in panel A, the first column shows that 34 colocalised gene-trait pairs were detected only at the total read count level but not at the transcript level. Similarly, the second column shows that 21 colocalised gene-trait pairs were detected by all transcript-level methods but not by total read count. (A) Sharing of colocalised gene-trait pairs between the four quantification methods. (B) Sharing of colocalised gene-trait pairs between Leafcutter and three independent txrevise event types (promoters, internal exons, 3ʹ ends).
Figure 3—figure supplement 1
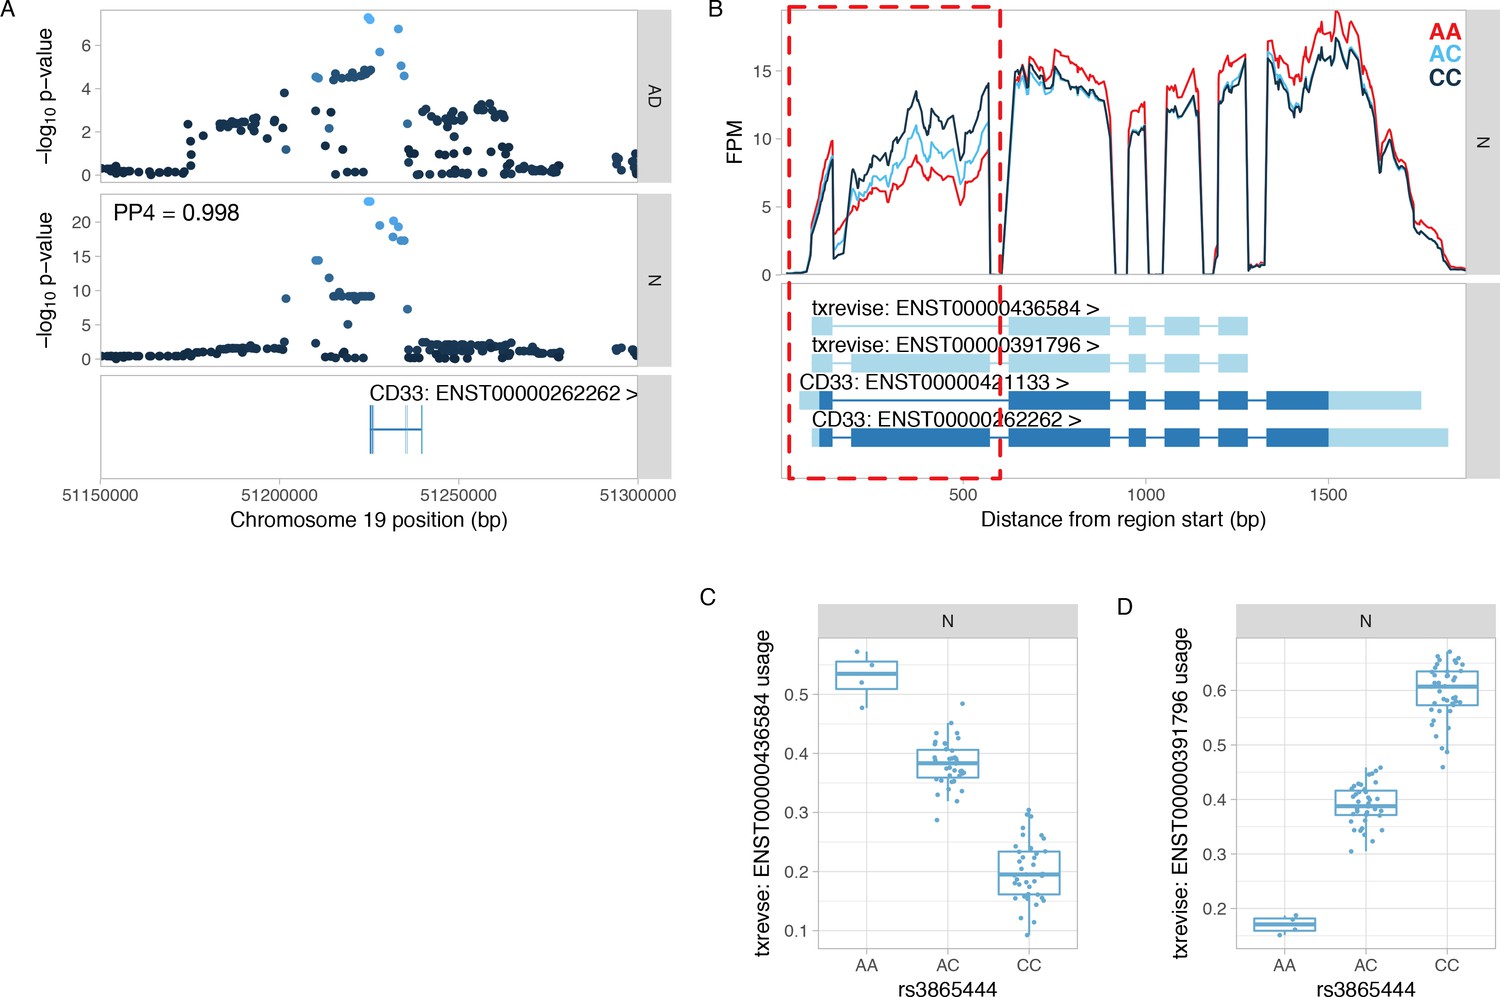
Colocalisation between CD33 splicing QTL and GWAS hit for Alzheimer’s disease.
(A) Manhattan plots of the Alzheimer’s disease (AD) GWAS hit (Lambert et al., 2013) and a splicing QTL (sQTL) for CD33. PP4 represents the posterior probability from coloc (Giambartolomei et al., 2014) that the GWAS and sQTL signals share a single causal variant. The dots are shaded according to r2 from the lead GWAS variant. (B) Read coverage plot of the CD33 gene stratified by the genotype of the lead sQTL variant (rs3865444). The alternatively spliced exon 2 is highlighted by the red rectangle. Ensembl transcript annotations falsely link skipped exon 2 to alternative 5ʹ and 3ʹ UTRs, although these do not appear to be regulated by the sQTL variant. FPM, fragments per million. (C) Usage of the CD33 transcript with skipped exon 2 stratified by the lead sQTL variant. (D) Usage of the CD33 transcript containing exon 2 stratified by the lead sQTL variant. N, naive.
Figure 3—figure supplement 2
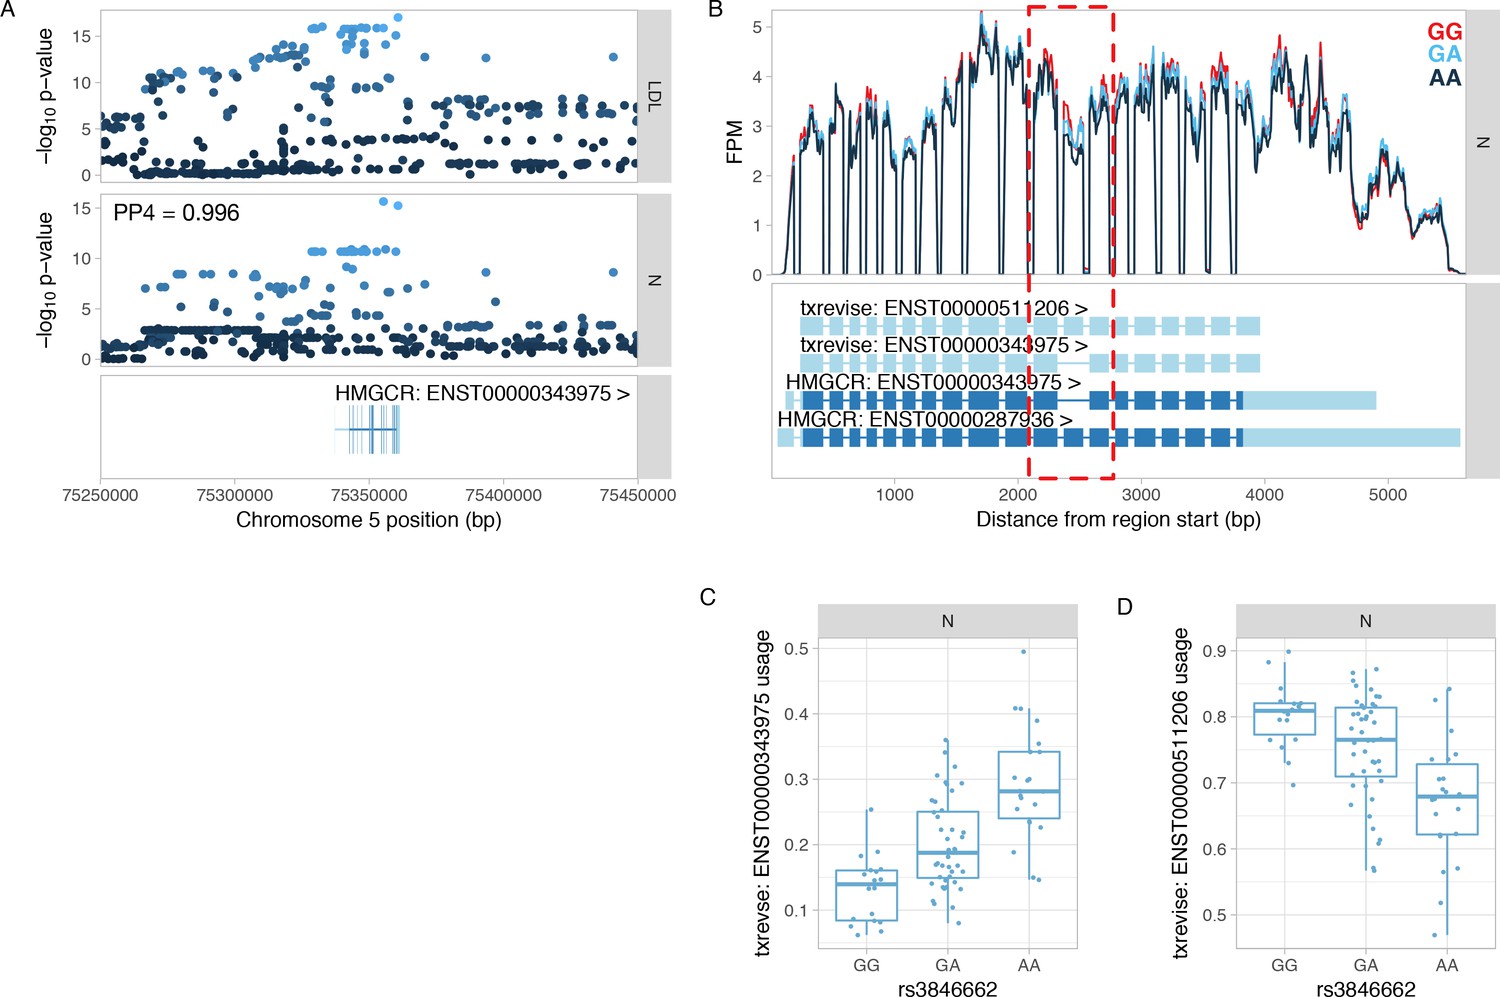
Colocalisation between HMGCR splicing QTL and GWAS hit for LDL.
(A) Manhattan plots of the LDL GWAS hit (Iotchkova et al., 2016) and an splicing QTL (sQTL) for HMGCR. PP4 represents the posterior probability from coloc (Giambartolomei et al., 2014) that the GWAS and sQTL signals share a single causal variant. The dots are shaded according to r2 from the lead LDL GWAS variant. (B) Read coverage plot of the HMGCR gene stratified by the genotype of the lead sQTL variant (rs3846662). The alternatively spliced exon 13 is highlighted by the red rectangle. Ensembl transcript annotations falsely link skipped exon 13 to alternative 5ʹ and 3ʹ UTRs although these do not appear to be differentially regulated by the sQTL variant. FPM, fragments per million. (C) Usage of the HMGCR transcript with skipped exon 13 stratified by the lead sQTL variant. (D) Usage of the HMGCR transcript containing exon 13 stratified by the lead sQTL variant. N, naive.
Figure 4 with 3 supplements

Condition-specificity of eQTLs and tuQTLs.
(A) Fraction of all QTLs detected in each simulated condition that are response QTLs (FDR < 10% and more than 50% of the genetic variance explained by the interaction term). (B) Fraction of txrevise tuQTLs classified as response QTLs, stratified by the part of the gene that they influence (promoters, internal exons or 3ʹ ends). (C) Fraction of GWAS colocalisations that are response QTLs. (D) Colocalisation between a GWAS hit for rheumatoid arthritis (RA) and IFNɣ-specific tuQTL at the CD40 locus. PP4 represents the posterior probability from coloc (Giambartolomei et al., 2014) that the GWAS and QTL signals share a single causal variant. The dots are shaded according to r2 from the lead RA GWAS variant. (E) Top panel: The lead GWAS variant (rs4239702) is associated with increased expression of the short 5ʹ UTR of the CD40 gene. Bottom panel: Ensembl annotations couple the short 5ʹ UTR to skipped exon 6, but this is not supported by RNA-seq data (Figure 4—figure supplement 2). FPM, fragments per million. (F) Relative expression of the short 5ʹ UTR stratified by the genotype of the lead GWAS variant. N, naive; I, IFNɣ; S, Salmonella; I + S, IFNɣ+Salmonella.
Figure 4—figure supplement 1
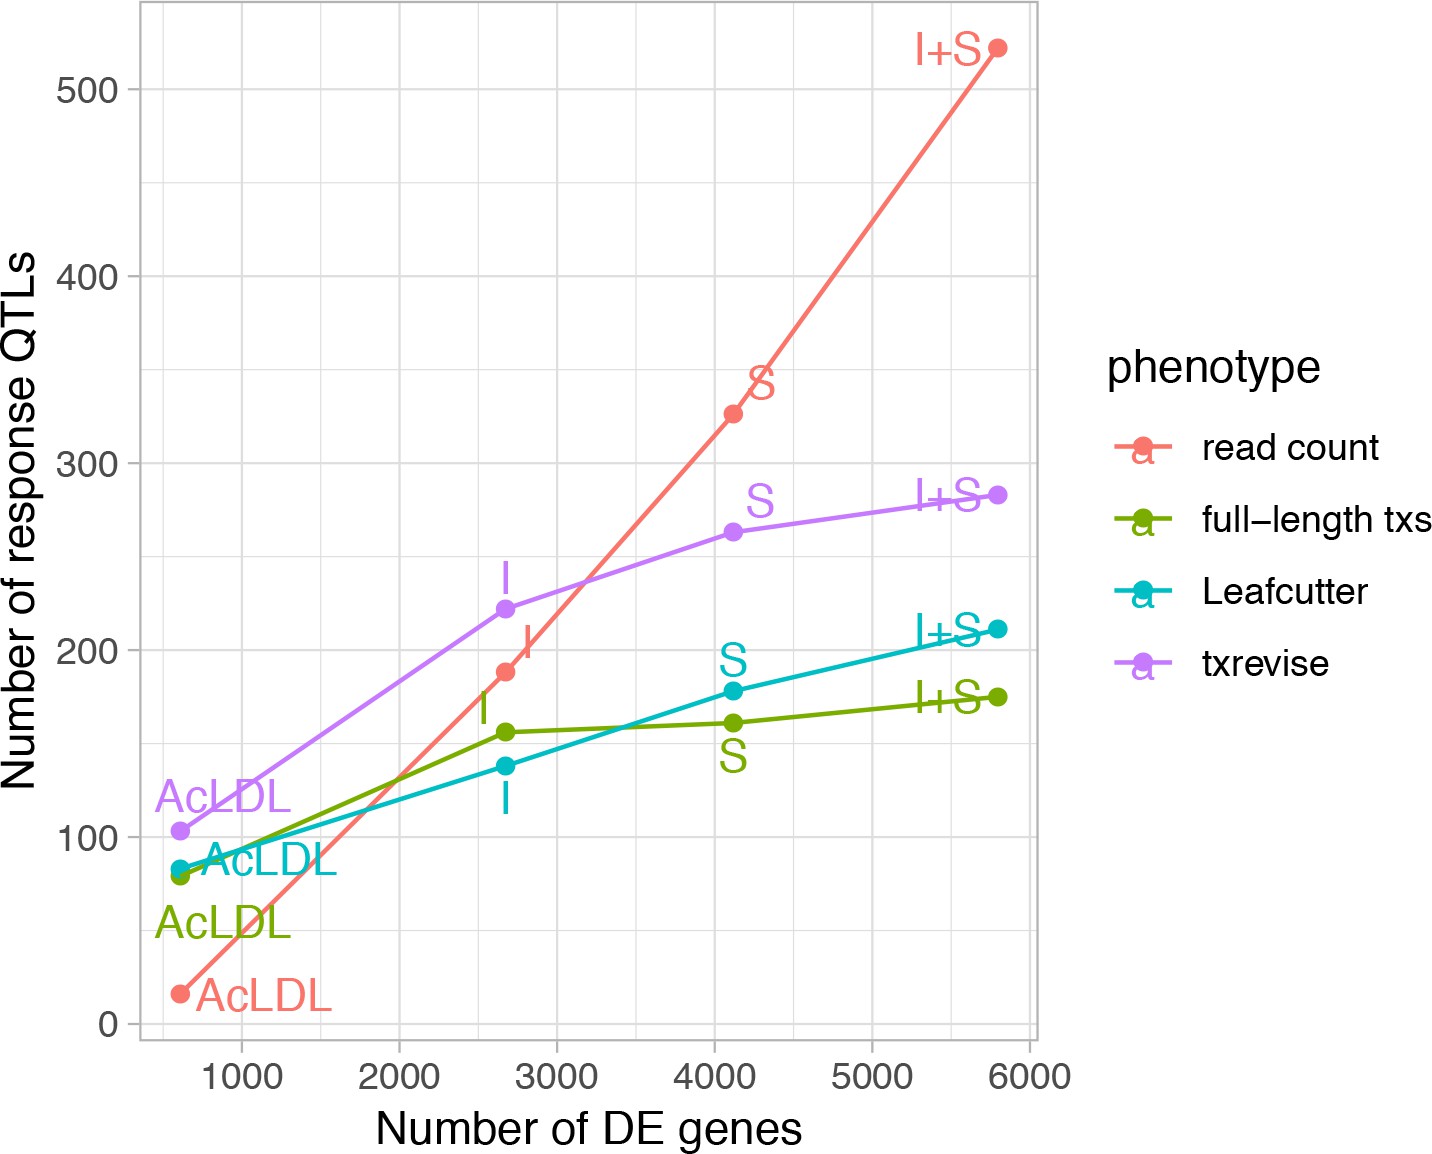
Relationship between differential expression and response eQTL count.
The x-axis shows the number of differentially expressed (DE) genes between the naive and one of the stimulated conditions and the y-axis shows the number of response eQTLs detected in that condition relative to the unstimulated condition N, naive; I, IFNɣ; S, Salmonella; I + S, IFNɣ+Salmonella.
Figure 4—figure supplement 2
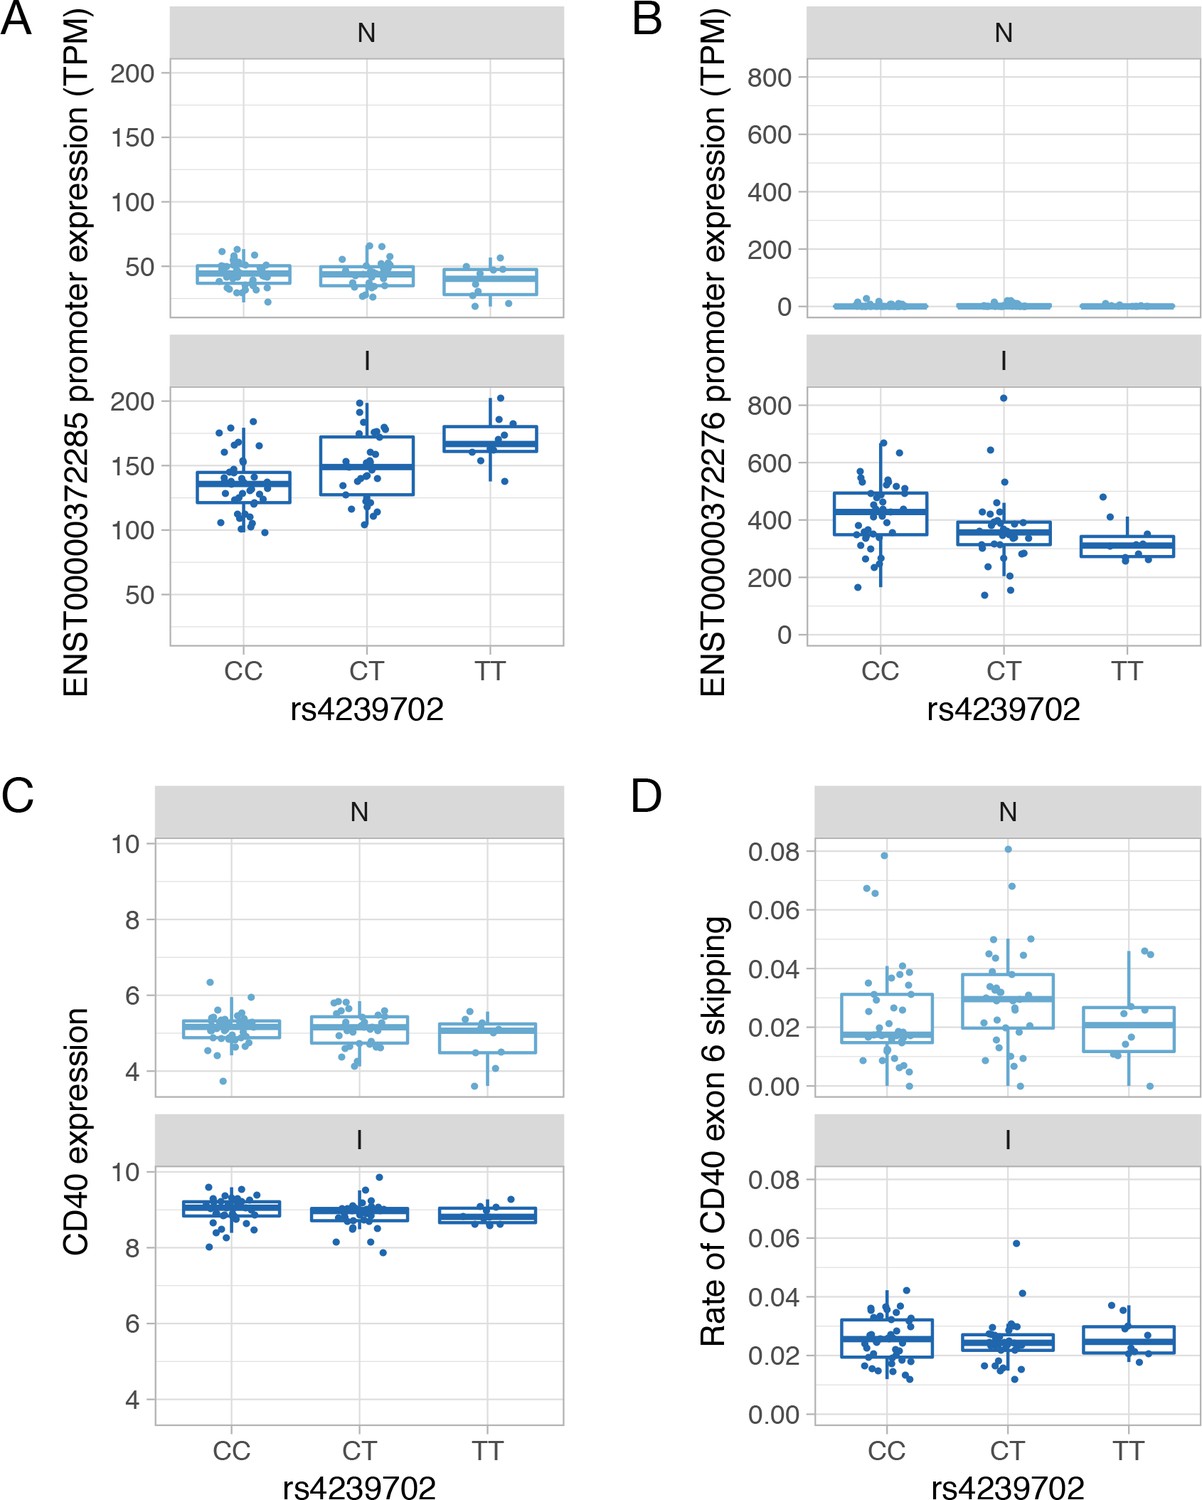
Genetics of CD40 expression.
(A) Absolute expression of the ENST00000372285 promoter in TPM units stratified by the genotype of the rs4239702 variant. (B) Absolute expression of the ENST00000372276 promoter in TPM units stratified by the genotype of the rs4239702 variant. (C) Normalized CD40 read count stratified by the genotype of the rs4239702 variant. (D) Rate of CD40 exon 6 skipping stratified by the genotype of the rs4239702 variant. N, naive; I, IFNɣ.
Figure 4—figure supplement 3
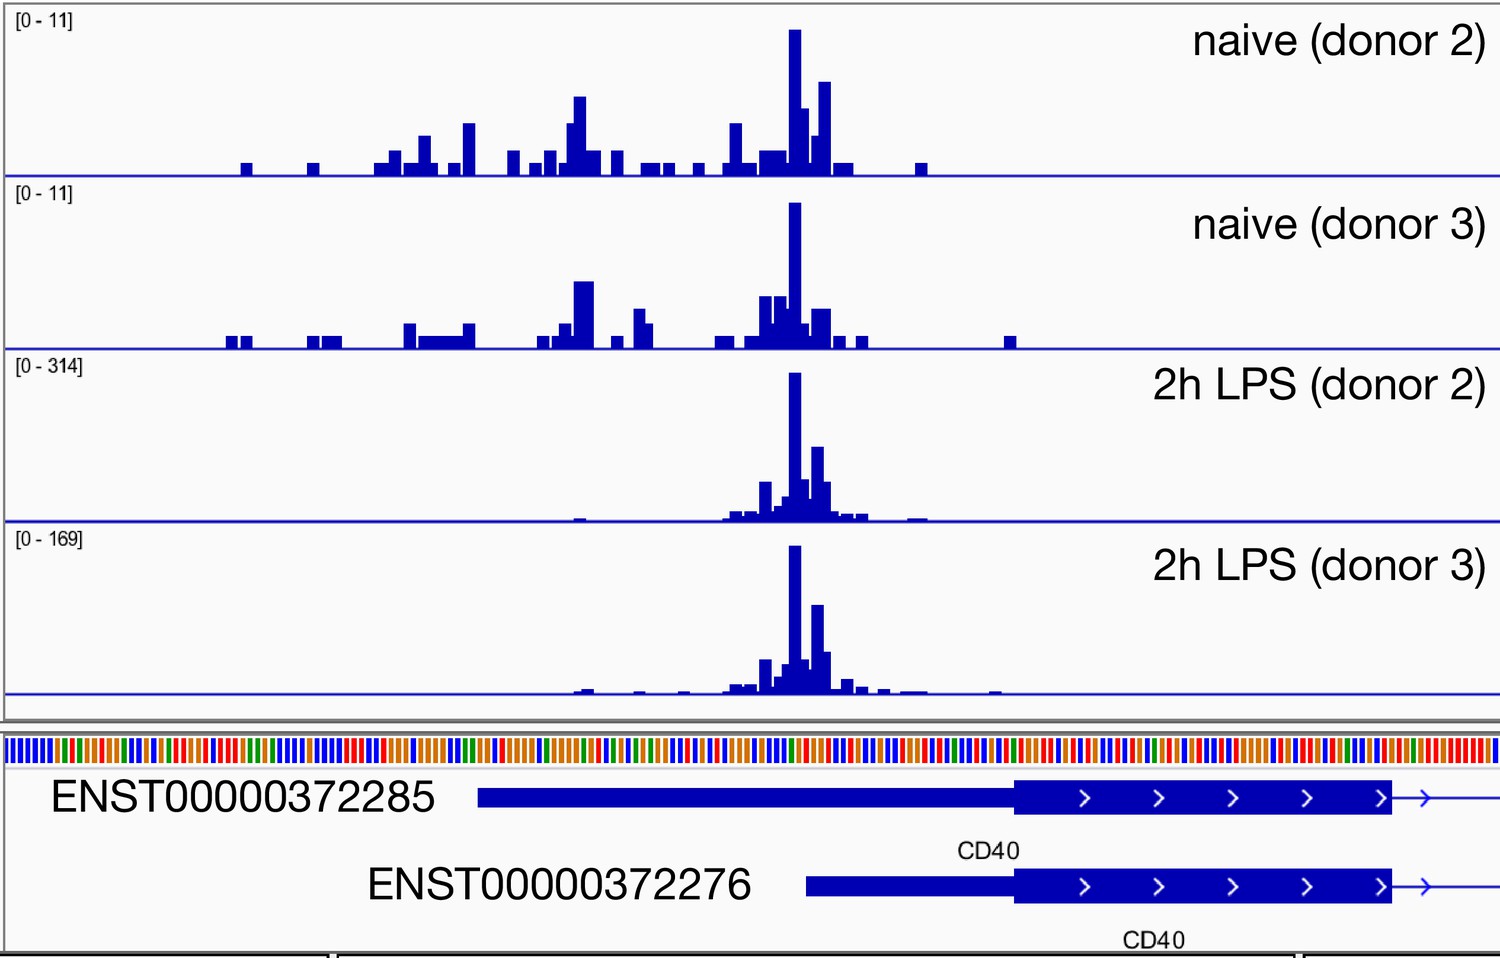
Regulation of CD40 promoter usage in response to 2 hr lipopolysaccharide (LPS) stimulation in primary macrophages.
The genome browser screenshot shows the read coverage of the Cap Analysis of Gene Expression (CAGE) data from two replicates of monocyte-derived macrophages before and after stimulation with LPS. The data was generated by the FANTOM5 consortium (Baillie et al., 2017). The CD40 promoter containing the short 5ʹ UTR is strongly upregulated after 2 hr LPS stimulation.
Additional files
-
Supplementary file 1
Metadata for the macrophage differentiation experiments performed in this study.
- https://doi.org/10.7554/eLife.41673.023
-
Supplementary file 2
Metadata for the RNA-seq samples generated in this study.
- https://doi.org/10.7554/eLife.41673.024
-
Transparent reporting form
- https://doi.org/10.7554/eLife.41673.025
Download links
A two-part list of links to download the article, or parts of the article, in various formats.
Downloads (link to download the article as PDF)
Open citations (links to open the citations from this article in various online reference manager services)
Cite this article (links to download the citations from this article in formats compatible with various reference manager tools)
Genetic effects on promoter usage are highly context-specific and contribute to complex traits
eLife 8:e41673.
https://doi.org/10.7554/eLife.41673


