The SNAP-25 linker supports fusion intermediates by local lipid interactions
- Saarland University, Germany
- Max Planck Institute for Experimental Medicine, Germany
- Otto-von-Guericke University, Germany
Figures
Figure 1 with 3 supplements
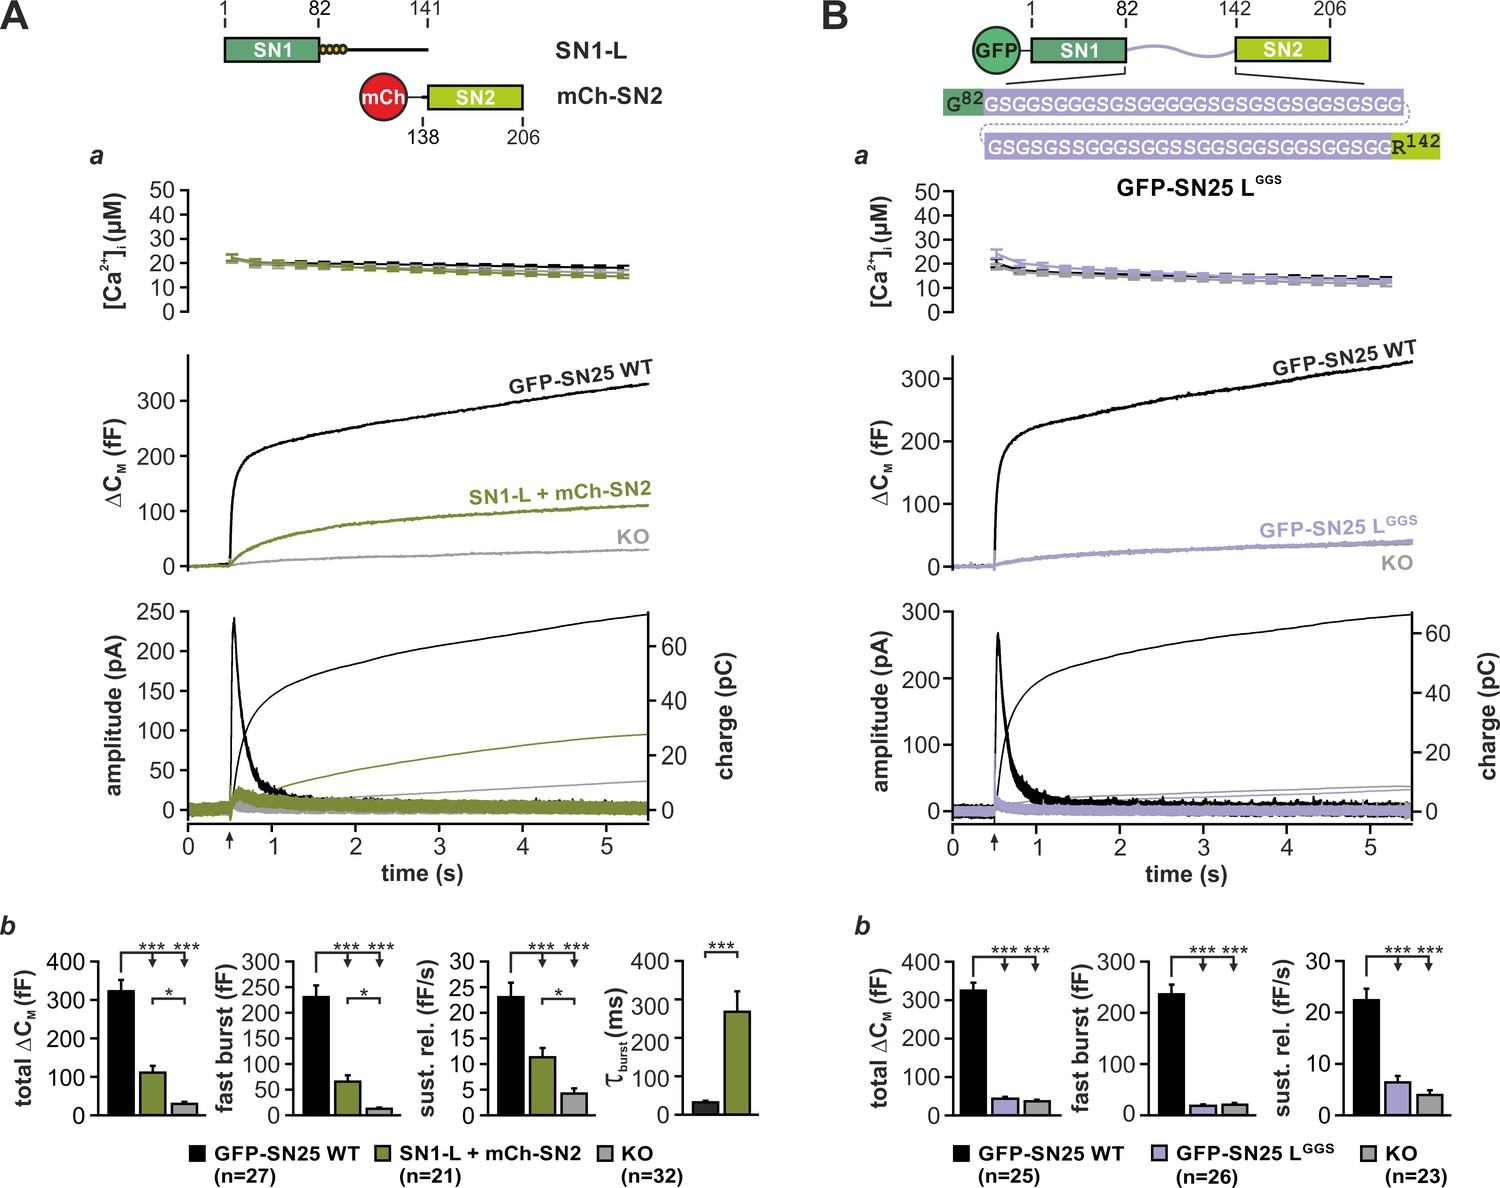
Integrity and primary structure of the SNAP-25 linker are important for Ca2+-dependent secretion.
(A) Cartoon (top) illustrates the structure of the two co-expressed SNAP-25 fragments: SN1-L (aa 1–141) comprises SN1 and the full linker, while mCherry (mCh)-SN2 represents SN2 (aa 138–206) N-terminally fused to mCherry. (a) Electrophysiological measurements of secretion in KO chromaffin cells co-expressing mCh-SN2 and SN1-L showed a poor rescue of secretion. Averaged traces for [Ca2+]i (top), capacitance measurements (middle) and amperometric recordings (bottom) in KO cells (gray) and in KO cells expressing the fragments (light green) or WT protein (black) are shown. Arrow indicates UV-flash. (b) Quantification of the data presented in (a). Average capacitance changes after 5 s (total ΔCM) and 1 s (fast burst) are depicted. Sustained release represents mean ΔCM/s occurring between 1 s and 5 s. Kinetics of the secretory burst was approximated by a monoexponential function, yielding τburst. (B) Cartoon (top) illustrates the substitution of the whole linker (aa 83–141) by a flexible G/S peptide in SN25 LGGS. (a) Characterization of GFP-SN25 LGGS-mediated secretion in KO chromaffin cells by Ca2+-uncaging. Depicted are averaged traces for [Ca2+]i (top), capacitance measurements (middle) and amperometric recordings (bottom) in KO cells (gray) and KO cells expressing GFP-SN25 LGGS (pastel blue) or WT protein (black). (b) Quantitative analysis of the average capacitance changes after 5 s (total ΔCM) and 1 s (fast burst). Sustained release represents mean ΔCM/s occurring between 1 s and 5 s. Data are shown as mean ± SEM. Statistical analysis was done with ANOVA and Tukey’s test.
-
Figure 1—source data 1
Extended statistical data as Microsoft Excel spreadsheet.
- https://doi.org/10.7554/eLife.41720.009
Figure 1—figure supplement 1
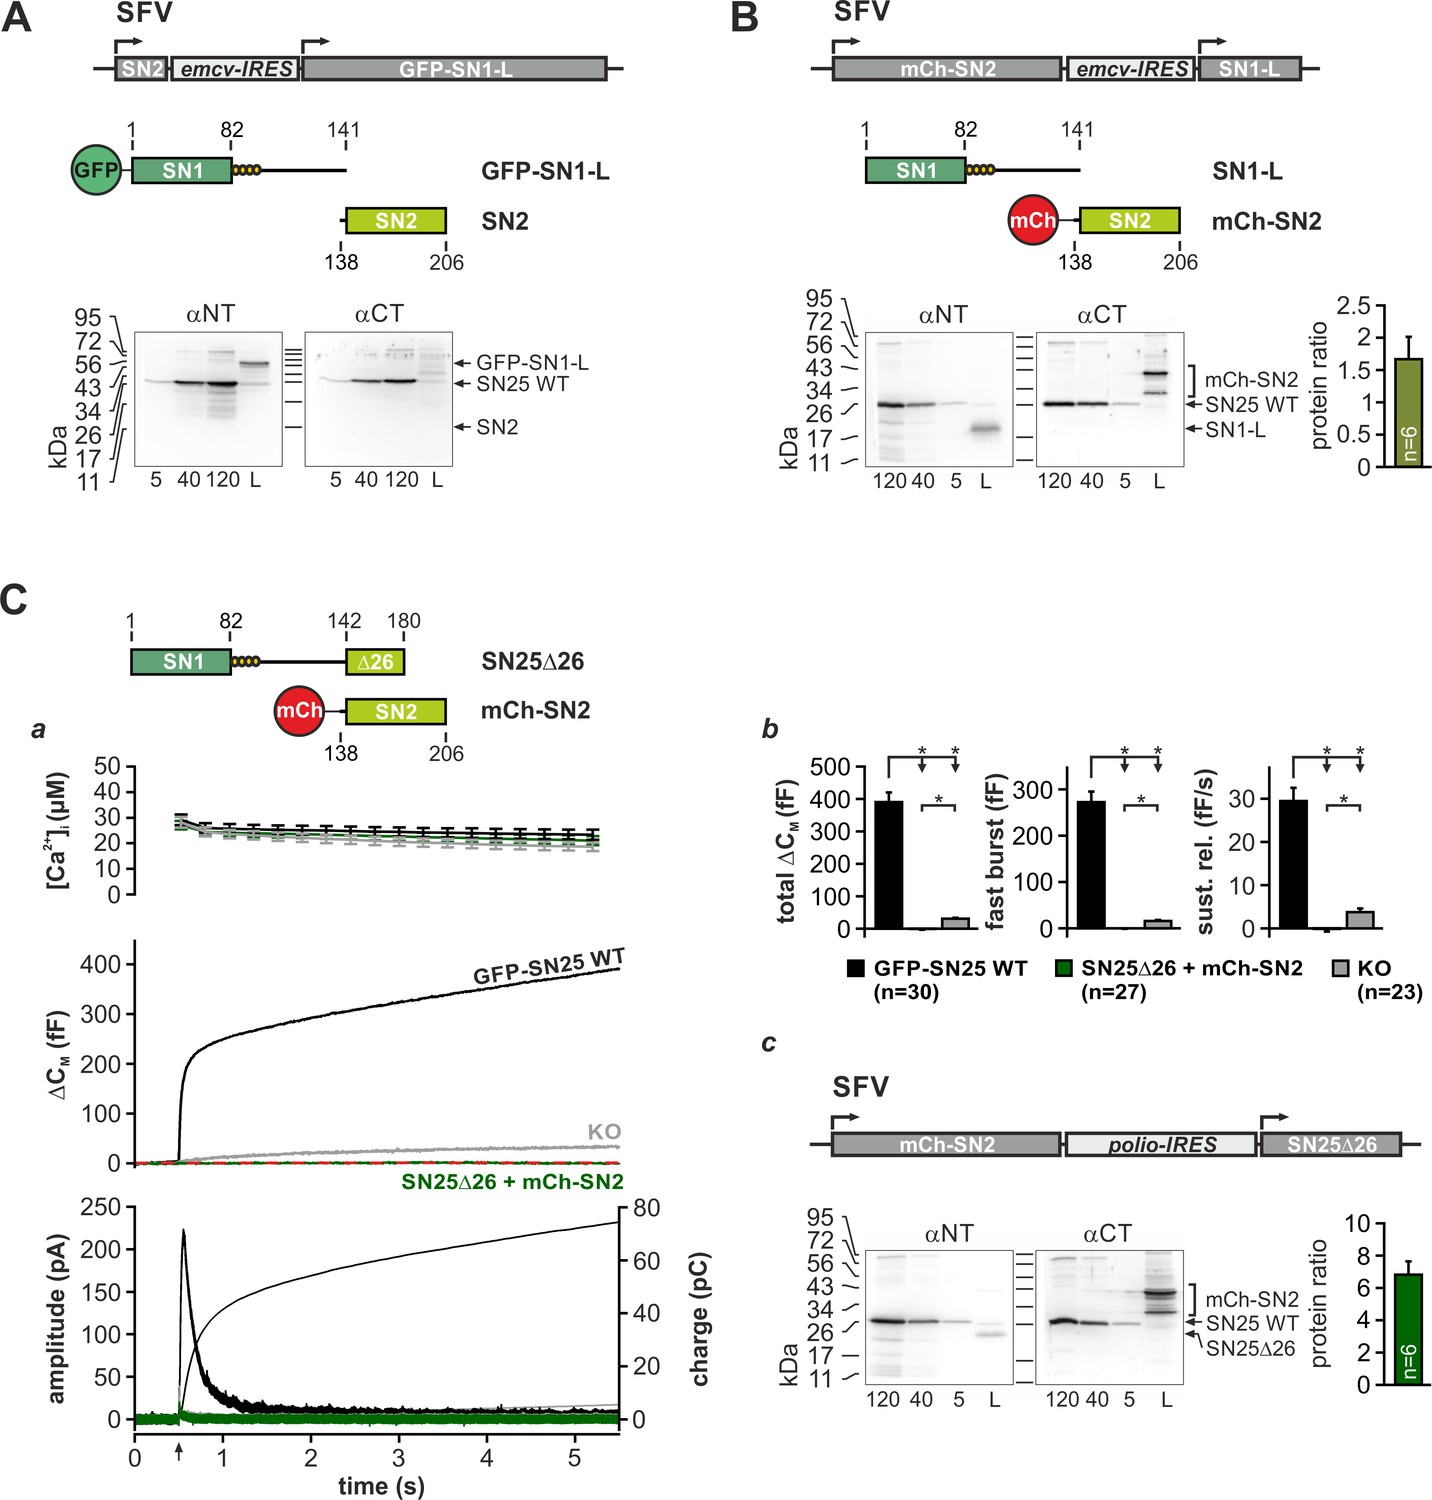
Reconstitution experiments with two complementary SNAP-25 fragments.
(A) Analysis of fragment expression in chromaffin cells infected by a bicistronic SFV containing open reading frames (ORFs) for isolated SN2 (aa 138–206; first ORF) and a continuous SN1-L fragment (aa 1–141; second ORF), which was N-terminally fused to GFP as a marker (GFP-SN1-L). Cartoon illustrates the structure of the SFV containing an encephalomyocarditis (emcv) virus IRES for expression of the second ORF. Antibodies that specifically recognize either N- or C-terminal epitopes in SNAP-25 were employed to detect the fragments in lysates of infected WT chromaffin cells. Recombinant WT SNAP-25 (SN25 WT) was used as reference (first three lanes on blot; protein content [ng] is indicated beneath the respective lane) in order to estimate the amount of expressed SNAP-25 fragment in lysates (labelled ‘L’). Note that fluorophore-tagged SNAP-25 fragments typically produce multiple bands on blots due to crosslinking via residual disulfide bridges (Mohrmann et al., 2010). Unexpectedly, isolated SN2 could not be detected in lysates, suggesting that the fragment is rapidly degraded. In contrast, the SN1-containing fragment was observed with high abundancy (B) Expression analysis for a bicistronic SFV that drives mCherry (mCh)-SN2 fusion protein together with isolated SN1-L. Using the same experimental paradigm as in (A), we found a balanced expression of both fragments, indicating that fusion with mCh can stabilize SN2 in chromaffin cells. (C) Instead of SN1-L, the longer SN25Δ26 (aa 1–180) was co-expressed with mCh-SN2 using a polio virus IRES for translation to establish a disparate expression ratio (top, cartoon). (C) Electrophysiological characterization of secretion in uninfected KO cells (gray), KO cells co-expressing SN25Δ26 and mCh-SN2 (dark green), and KO cells rescued with WT protein (black). (a) Averaged traces for [Ca2+]i (top), capacitance measurements (middle) and amperometric recordings (bottom) are shown. Arrow indicates UV-flash. Co-expression of the SNAP-25 fragments did not reconstitute secretion but rather resulted in suppression of residual release. (b) Quantitative analysis of capacitance measurements. (c) Expression analysis of SN25Δ26 and mCh-SN2 fragments demonstrated a high mCh-SN2/SN25Δ26 ratio, as intended. All data are given as mean ± SEM. n is indicated in each panel. Statistical testing was done by ANOVA with Dunn’s post-hoc test.
-
Figure 1—figure supplement 1—source data 1
Extended statistical data as Microsoft Excel spreadsheet.
- https://doi.org/10.7554/eLife.41720.004
Figure 1—figure supplement 2
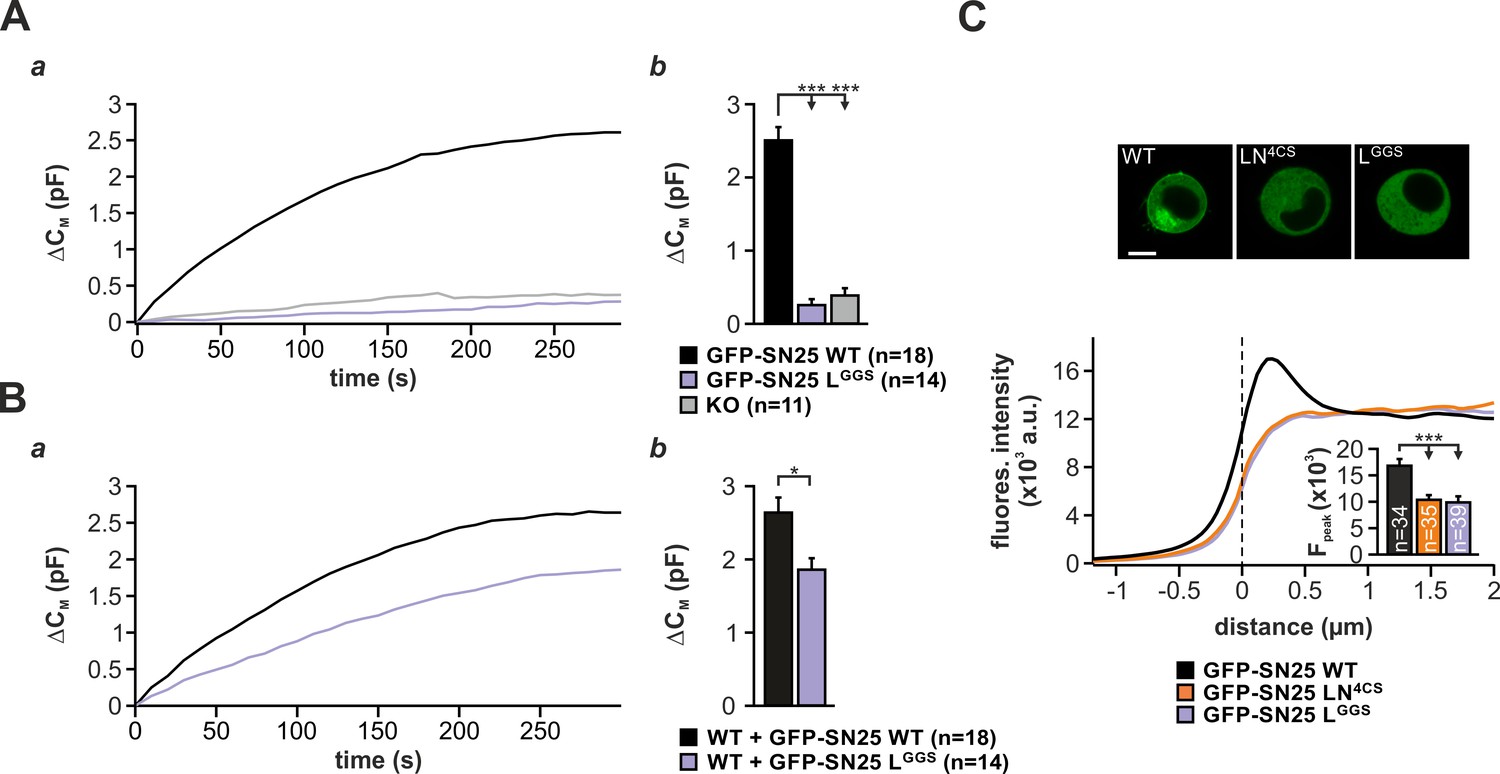
GFP-SN25 LGGS is unable to drive secretion in response to strong, long-lasting stimuli in KO cells but exerts a dominant-negative effect in WT cells.
(A) Analysis of the maximal secretion level that can be reached by infusion of intracellular solution containing 19 µM free Ca2+ via the patch pipette. (a) Averaged traces of membrane capacitance recordings in uninfected KO cells (gray), KO cells expressing GFP-SN25 LGGS (pastel blue) or KO cells expressing WT protein (black) are depicted. (b) The capacitance change after 300 s was quantified. (B) Characterization of maximal secretion in WT cells expressing either GFP-SN25 WT (black) or GFP-SN25 LGGS (pastel blue). (a) The same stimulation paradigm as in (A) was used. (b) Quantification shows that the linker substitution mutant induces a significant reduction in the total capacitance change after 300 s (right panel). (C) Confocal analysis of the intracellular distribution of GFP-SN25 LGGS in comparison to the palmitoylation mutant GFP-SN25 LN4CS and GFP-SN25 WT. Exemplary pictures for KO cells expressing GFP-SN25 WT , GFP-SN25 LN4CS, or GFP-SN25 LGGS (top). Scale bar is 5 µm. Averaged radial line scans through the plasma membranes of cells expressing GFP-SN25 LGGS (pastel blue), GFP-SN25 LN4CS (orange), or WT protein (black). As expected, GFP-SN25 LGGS is mainly located in the cytosol due to the loss of its palmitoylation site. Inset shows the quantification of fluorescence levels at the membrane. Data are shown as mean ± SEM; n is indicated in panel. Statistical comparisons were made using ANOVA with Tukey’s post-hoc test.
-
Figure 1—figure supplement 2—source data 1
Extended statistical data as Microsoft Excel spreadsheet.
- https://doi.org/10.7554/eLife.41720.006
Figure 1—figure supplement 3
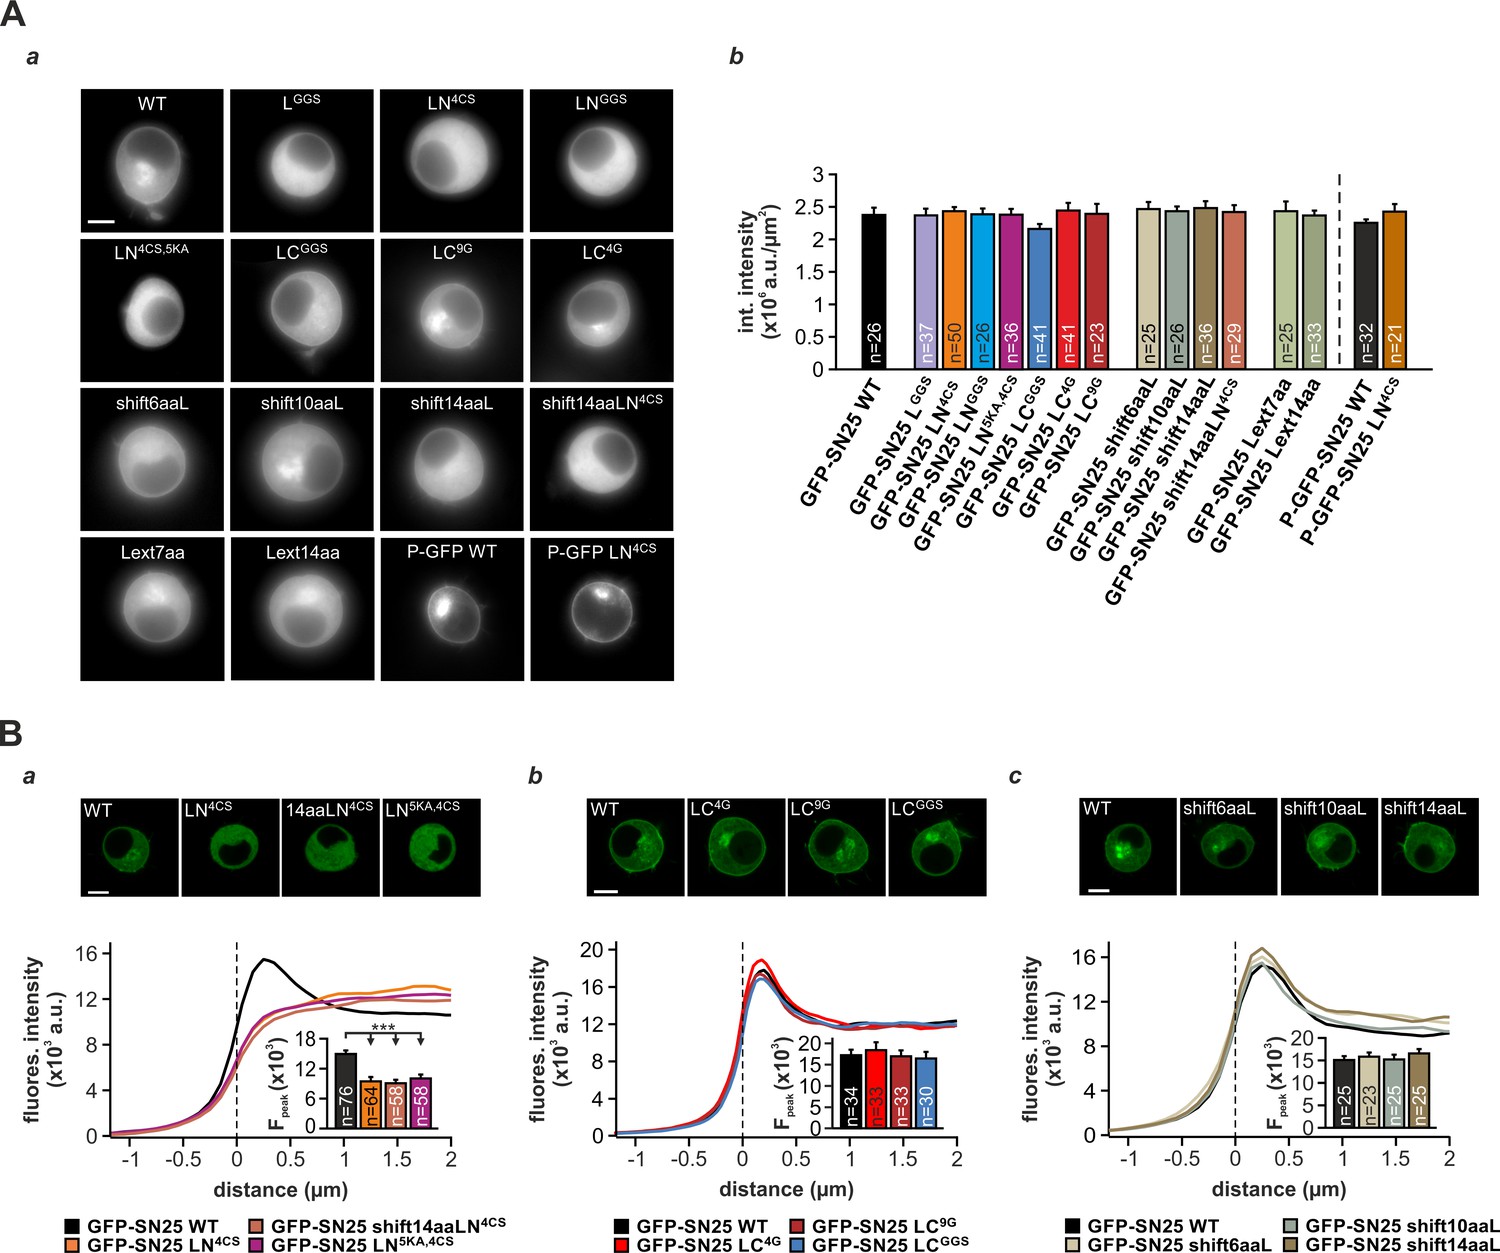
Expression analysis of SNAP-25 linker mutants.
(A) Fluorescence analysis in KO cells expressing the characterized GFP-tagged SNAP-25 variants. (a) Exemplary epifluorescence pictures for all tested mutants are shown. Abbreviated mutant labels are used (‘GFP-SN25’ skipped). Scale bar is 5 µm. (b) Mean integrated fluorescence of GFP over the whole cell body was quantified, but no significant differences in SNAP-25 expression were found for the differents mutants in comparison to WT controls. (B) Confocal analysis of intracellular distribution for three sets of SNAP-25 mutants: (a) GFP SN25 WT/GFP-SN25 LN4CS/ GFP-SN25 shift14LN4CS/ GFP-SN25 LN5KA,4CS, (b) GFP SN25 WT/GFP-SN25 LC4G / GFP-SN25 LC9G / GFP-SN25 LCGGS, and (c) GFP SN25 WT/GFP-SN25 shift6aaL/GFP-SN25 shift10aaL/GFP-SN25 shift14aaL. Exemplary pictures for cells expressing the corresponding mutants or WT SNAP-25 (top). Scale bar is 5 µm in each panel. For each mutant, averaged radial line scans through the plasma membrane of cells were analyzed. In aligned scanline profiles, membrane fluorescence was quantified at the position, where the fluorescence peak occurred in WT controls. Insets show mean membrane fluorescence levels. Error is SEM. n is indicated in bar graph. Statistical significance was tested using ANOVA with Tukey’s test.
-
Figure 1—figure supplement 3—source data 1
Extended statistical data as Microsoft Excel spreadsheet.
- https://doi.org/10.7554/eLife.41720.008
Figure 2 with 1 supplement
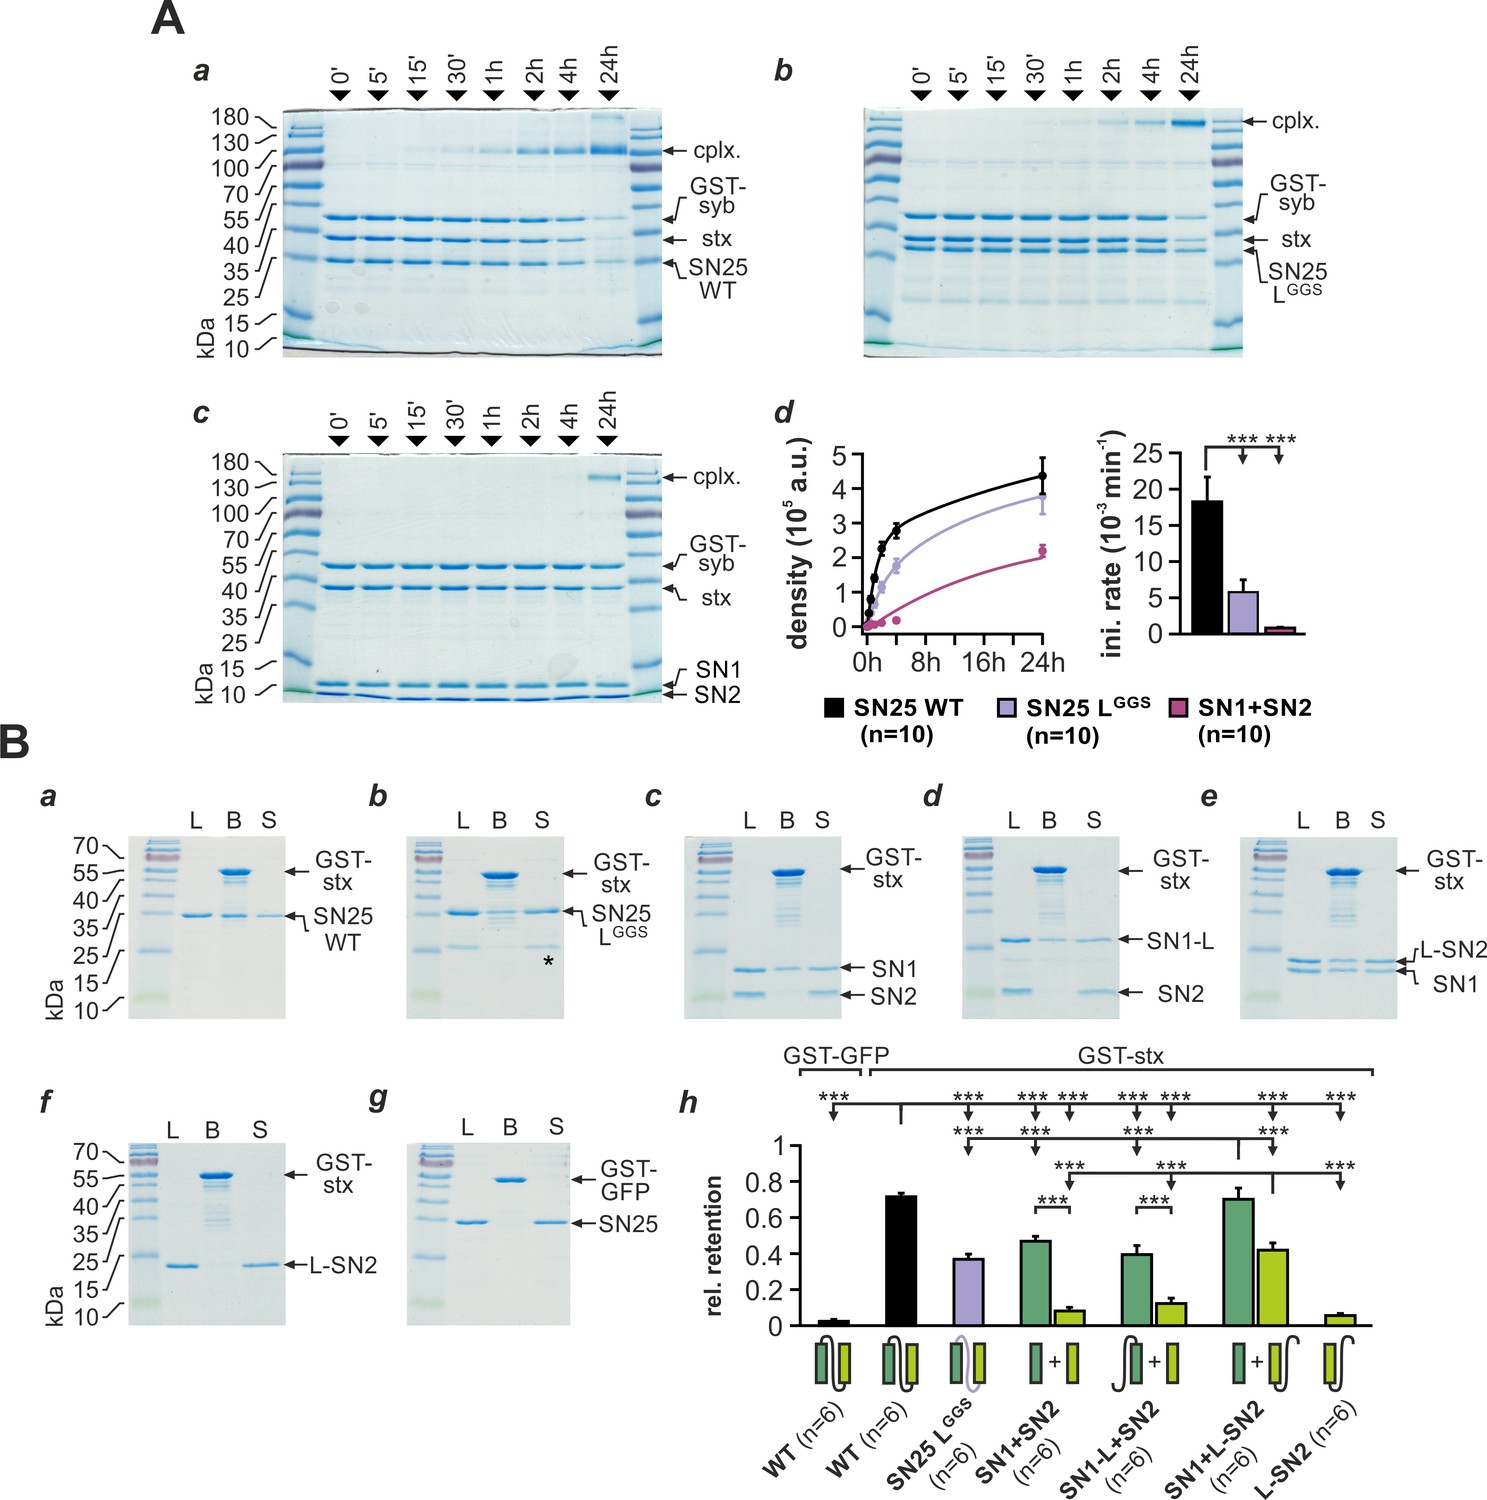
SNAP-25 linker motifs promote t-SNARE interactions and ternary complex assembly.
(A) Kinetics of SNARE complex assembly was assayed by mixing equimolar amounts of purified GST-syb-2 (aa 1–116) and stx-1A (aa 1–262) with (a) SN25 WT, (b) SN25 LGGS, or (c) isolated SN1/SN2 fragments. SNARE complex formation was analyzed by SDS PAGE after different times (indicated above lanes). (d) Quantitative analysis of complex formation. Biexponential fits of the kinetic profiles (left panel) demonstrated a significant decrease of the initial rate constant for SN25 LGGS and SN1/SN2 fragments (right panel). (B) Binding of SN25 LGGS or SNAP-25 fragments to immobilized stx-1A was tested in pulldown assays. Depicted are representative Coomassie-stained gels for different experimental conditions: (a) pulldown of SN25 WT, (b) SN25 LGGS (‘*” marks a contaminating degradation product), (c) SN1 and SN2, (d) SN1-L and SN2, (e) SN1 and L-SN2, and (f) L-SN2. (g) GST-GFP was used as a negative control. Each gel shows load (‘L’), GST-stx-1A containing beads after binding reaction (‘B’), and supernatant (‘S’). (h) To quantify the binding to immobilized stx-1A, we calculated the average retention ratio nprey/nstx-1A for each protein/fragment. Depicted errors are SEM. n is indicated in the corresponding panels. Statistical analysis was done with ANOVA and Tukey’s test.
-
Figure 2—source data 1
Extended statistical data as Microsoft Excel spreadsheet.
- https://doi.org/10.7554/eLife.41720.013
Figure 2—figure supplement 1
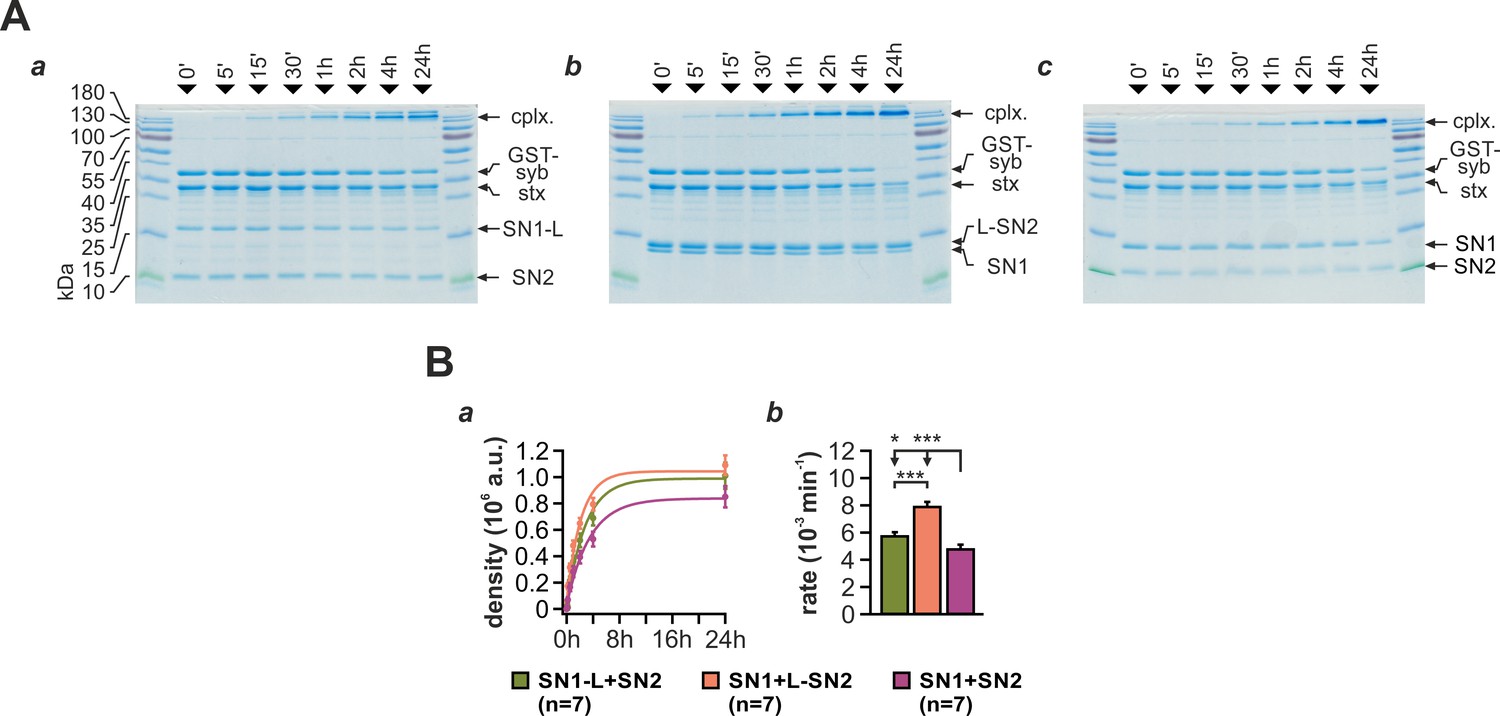
A continuous L-SN2 fragments can facilitate ternary SNARE complex formation.
(A) SNARE complex assembly was assayed in mixtures containing either (a) SN1-L and SN2, (b) SN1 and L-SN2, or (c) SN1 and SN2 together with GST-syb-2 (aa 1–116) and stx-1A (aa 1–262). Depicted are exemplary Coomassie-stained gels with reaction samples taken from each mixture after defined time intervals (indicated above lanes). (B) The amount of assembled SNARE complexes was quantified by densitometry. (a) The reaction profiles showed a slight acceleration for fragments containing the full linker, especially for the reaction setup containing continuous L-SN2. (b) A monoexponential approximation of the kinetics demonstrated that the rate constant for reaction mixtures containing SN1/L-SN2 was significantly increased compared to SN1-L/SN2 and controls. The SN1-L/SN2 combination formed SNARE complexes still significantly faster than linker-less fragments. Error is SEM. n is indicated in bar graph. Statistical significance was tested using ANOVA with Tukey’s test.
-
Figure 2—figure supplement 1—source data 1
Extended statistical data as Microsoft Excel spreadsheet.
- https://doi.org/10.7554/eLife.41720.012
Figure 3 with 2 supplements
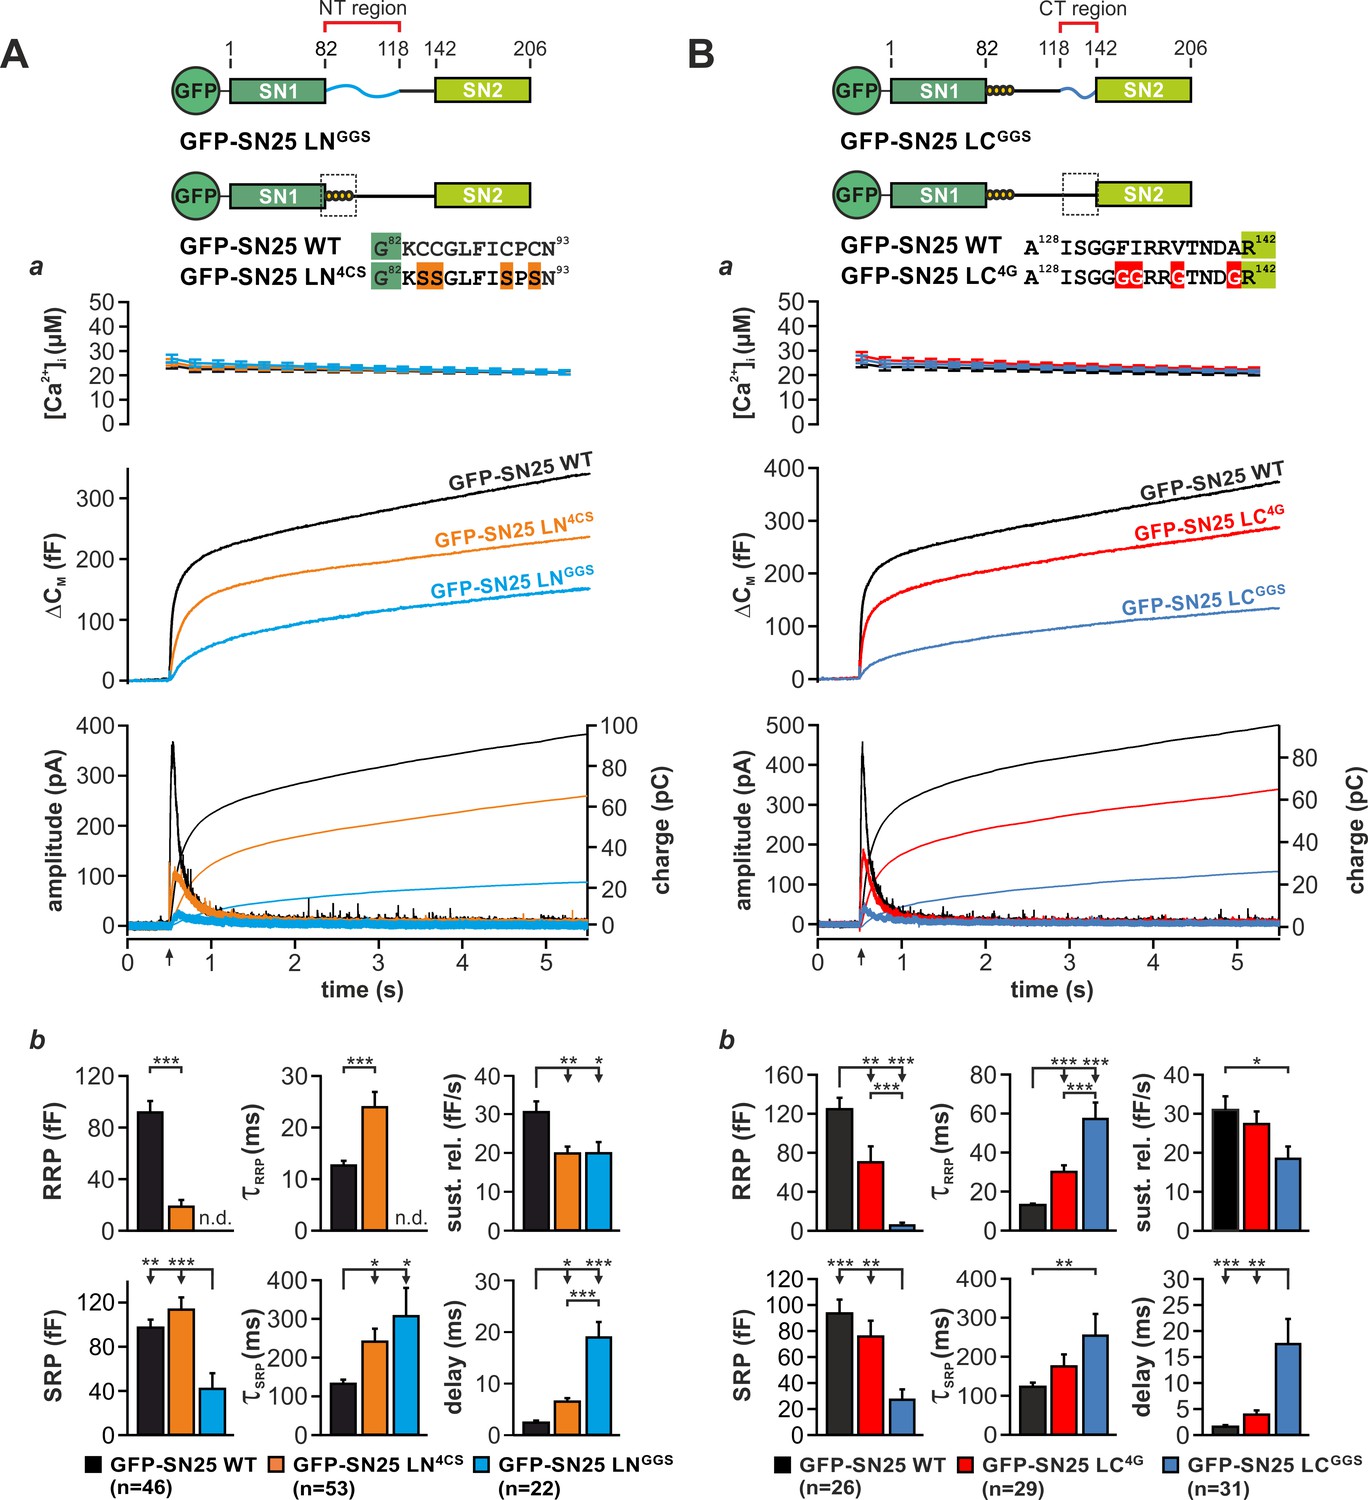
Motifs in N- and C-terminal linker regions promote secretion.
(A) Characterization of secretion deficits induced by GFP-SN25 LNGGS or GFP-SN25 LN4CS. Cartoon illustrates the structure of the tested mutants. (a) Averaged traces for [Ca2+]i (top panel), capacitance measurements (middle) and amperometric recordings (bottom) in KO cells expressing GFP-SN25 LNGGS (cyan), GFP-SN25 LN4CS (orange), or WT protein (black) are shown. Arrow indicates UV flash. (b) Quantitative analysis of the kinetic properties of the secretory burst. The mean amplitude of RRP and SRP as well as the corresponding time constants τfast and τslow are depicted. Sustained release rate reflects the slope of the linear secretion component. The mean exocytotic delay indicates the average latency of secretion after the flash. (B) Characterization of secretion in KO cells expressing GFP-SN25 LCGGS or GFP-SN25 LC4G. Cartoon illustrates the structure of the C-terminal linker substitutions mutants. (a) Averaged recordings for the GFP-SN25 LCGGS mutant (blue), GFP-SN25 LC4G (red) or wildtype controls (black) are shown. Panel organization as in (Aa). (b) Quantitative analysis of kinetic parameters. All data are presented as mean ± SEM; n is indicated in the corresponding panels. Statistical comparisons were performed with ANOVA and Tukey’s post-hoc test.
-
Figure 3—source data 1
Extended statistical data as Microsoft Excel spreadsheet.
- https://doi.org/10.7554/eLife.41720.019
Figure 3—figure supplement 1
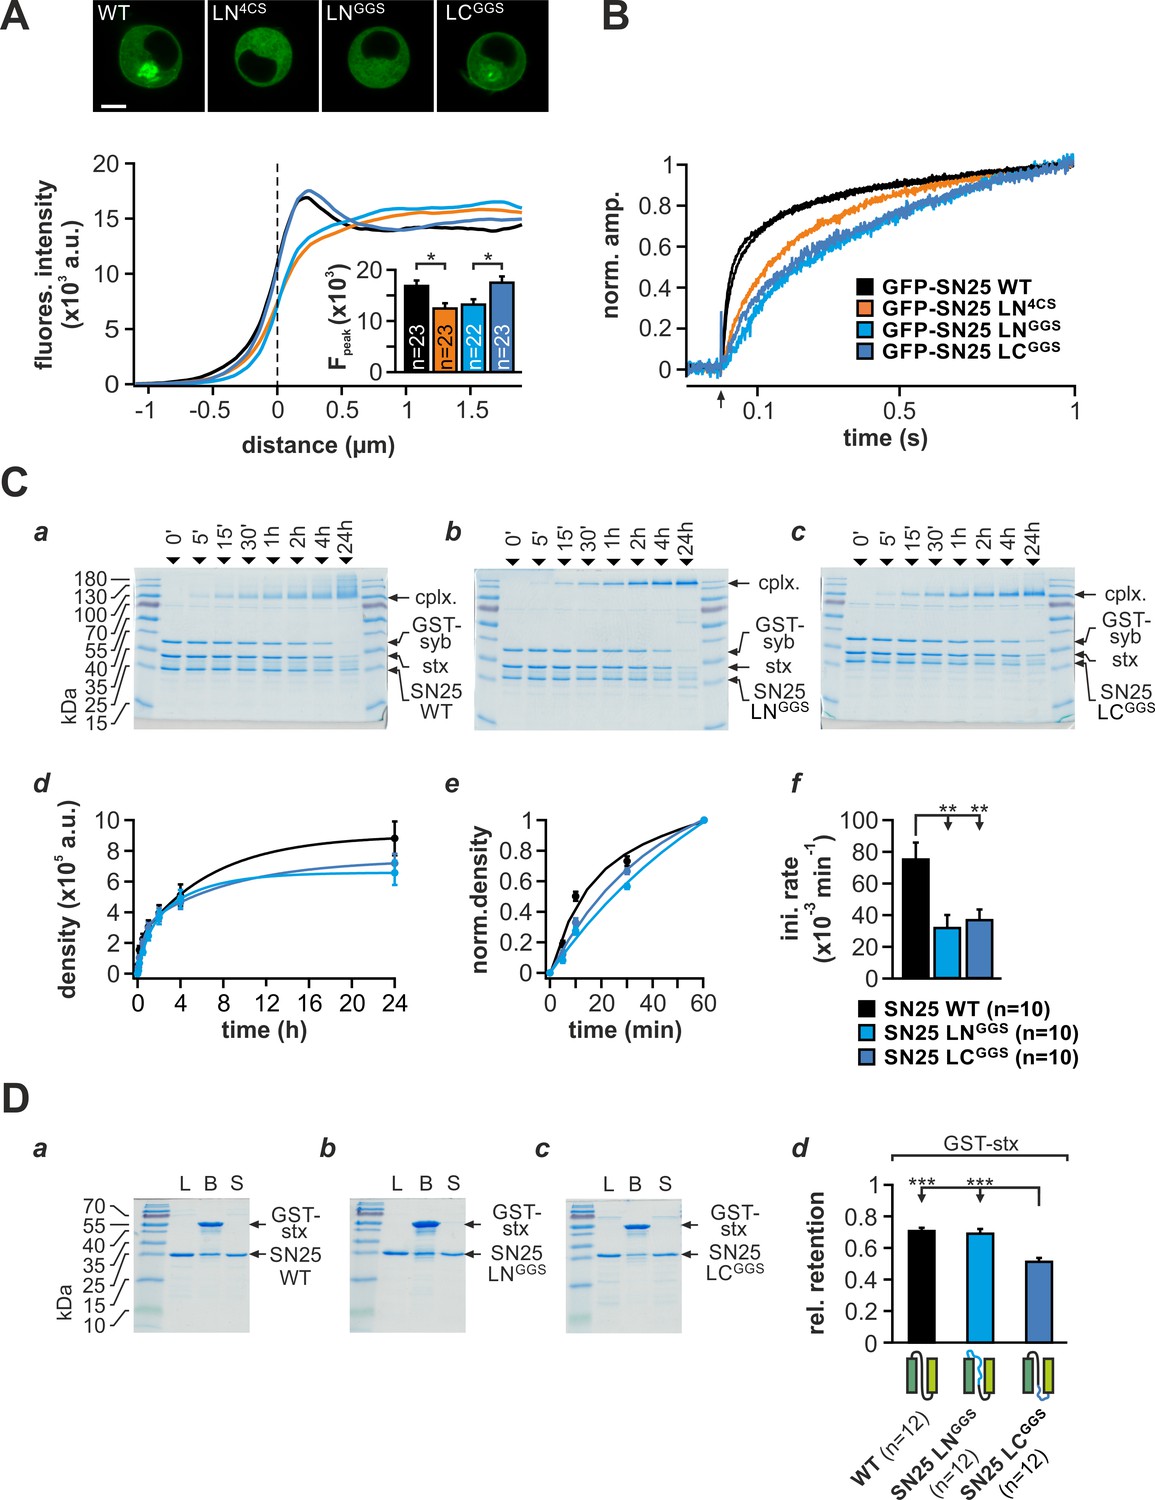
Extended characterization of the partial linker substitution mutants SN25 LNGGS and SN25 LCGGS.
(A) Confocal analysis of protein localization. Exemplary pictures for cells expressing the different SNAP-25 variants (top). Averaged radial line scans through the plasma membranes of cells expressing GFP-SN25 LNGGS (cyan), GFP-SN25 LCGGS (blue), GFP-SN25 LN4CS (orange), or WT protein (black). The inset shows the quantification of fluorescence levels at the membrane, at the position indicated by the fluorescence peak in WT controls. (B) Normalized plot highlighting the phenotypical similarities of SN25 LNGGS and SN25 LCGGS. Data were normalized to the ΔCM value reached at 1 s after the flash (flash indicated by arrow) and the sustained component was eliminated by subtraction. (C) SNARE complex formation was comparatively assayed for (a) WT protein, (b) SN25 LNGGS, or (c) SN25 LCGGS by mixing the corresponding variant with equimolar amounts of purified GST-syb-2 and stx-1A. Samples of the reaction mixture were taken after different time intervals (indicated above lanes) and analyzed by SDS PAGE. (d) Quantitative analysis of complex formation. (e) Biexponential fits showed a slight slowdown of the kinetics for SN25 LNGGS and SN25 LCGGS in the initial phase of assembly. (f) The mean initial rate constants for SN25 LNGGS and SN25 LCGGS were significantly decreased compared to WT controls. (D) Binding of both partial substitution mutants to immobilized stx-1A was assayed in pulldown experiments. Representative Coomassie-stained gels for (a) WT controls, (b) SN25 LNGGS, and (c) SN25 LCGGS are shown. Load (‘L’), GST-stx-1A containing beads after binding reaction (‘B’), and supernatant (‘S’) are depicted on each gel. (d) Quantification of protein retention on immobilized stx-1A. The average ratio nprey/nstx-1A was calculated for each condition, showing that only SN25 LCGGS was retained in significantly lower amounts. All data are given as mean ± SEM; n is indicated within panels. Statistical analysis was done with ANOVA and Tukey’s test.
-
Figure 3—figure supplement 1—source data 1
Extended statistical data as Microsoft Excel spreadsheet.
- https://doi.org/10.7554/eLife.41720.016
Figure 3—figure supplement 2

Complex secretion phenotype of an extended substitution mutant targeting the backfolding C-terminal linker loop.
(A) Cartoon illustrating the nine amino acid-long substitution in SN25 LC9G (top). Characterization of the secretion properties of KO chromaffin cells expressing GFP-SN25 LC9G (dark red) or WT SNAP-25 (black): Averaged [Ca2+]i measurements (top), capacitance traces (middle), and amperometric recordings (bottom) are shown. (B) Kinetic analysis of membrane capacitance. The mean RRP/SRP amplitudes, the corresponding time constants, the mean rate of sustained release, as well as the exocytotic delay were analyzed. Note the significant decrease in the RRP amplitude, the prolongation of time constants for release of RRP/SRP vesicles, and the increased delay. Data are displayed as mean ± SEM; n is shown in the corresponding panel. Statistical tests were performed with ANOVA and Tukey’s post-hoc test.
-
Figure 3—figure supplement 2—source data 1
Extended statistical data as Microsoft Excel spreadsheet.
- https://doi.org/10.7554/eLife.41720.018
Figure 4
Intramolecular acylation of SNAP-25 is required for efficient triggering and stability of primed vesicles.
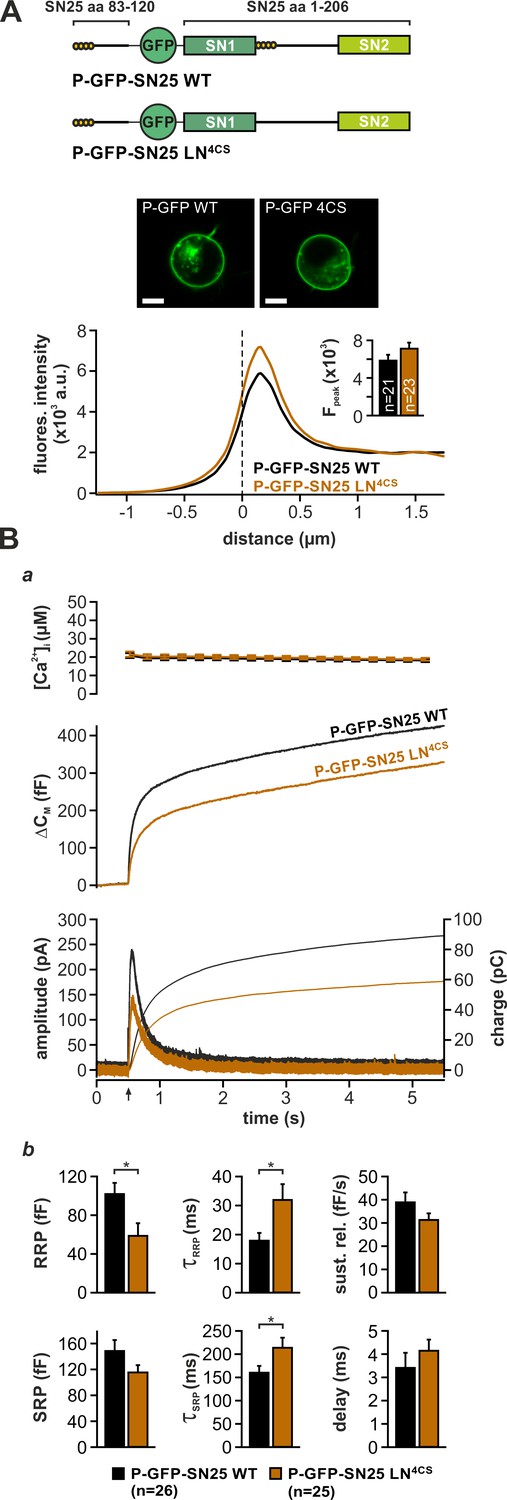
(A) Cartoon illustrates the construction of SNAP-25 variants carrying a secondary palmitoylation motif fused to the GFP-tag. The cellular localization of SNAP-25 variants was analyzed by confocal microscopy. Exemplary pictures of KO cells expressing P-GFP-SN25 LN4CS or double-acylated WT protein are shown. Scale bar is 5 µm. Mean radial line scans for P-GFP-SN25 LN4CS (red) and P-GFP-SN25 WT (black) demonstrate similar plasma membrane localization. Inset depicts the average fluorescence near the plasma membrane. (B) Characterization of secretion properties in KO cells expressing P-GFP-SN25 LN4CS (red) or P-GFP-SN25 WT (black). (a) Shown are averaged Ca2+-imaging results (top), capacitance measurements (middle) and amperometric recordings (bottom). Arrow indicates UV flash. (b) Quantitative analysis of RRP and SRP size, time constants of release components, sustained release rate, and exocytotic delay. Data are depicted as mean ± SEM; n is indicated in the panels. Statistical comparisons were done using Student’s t-test.
-
Figure 4—source data 1
Extended statistical data as Microsoft Excel spreadsheet.
- https://doi.org/10.7554/eLife.41720.021
Figure 5 with 2 supplements
The acylated N-terminal linker motif does not play an essential role in force transfer.
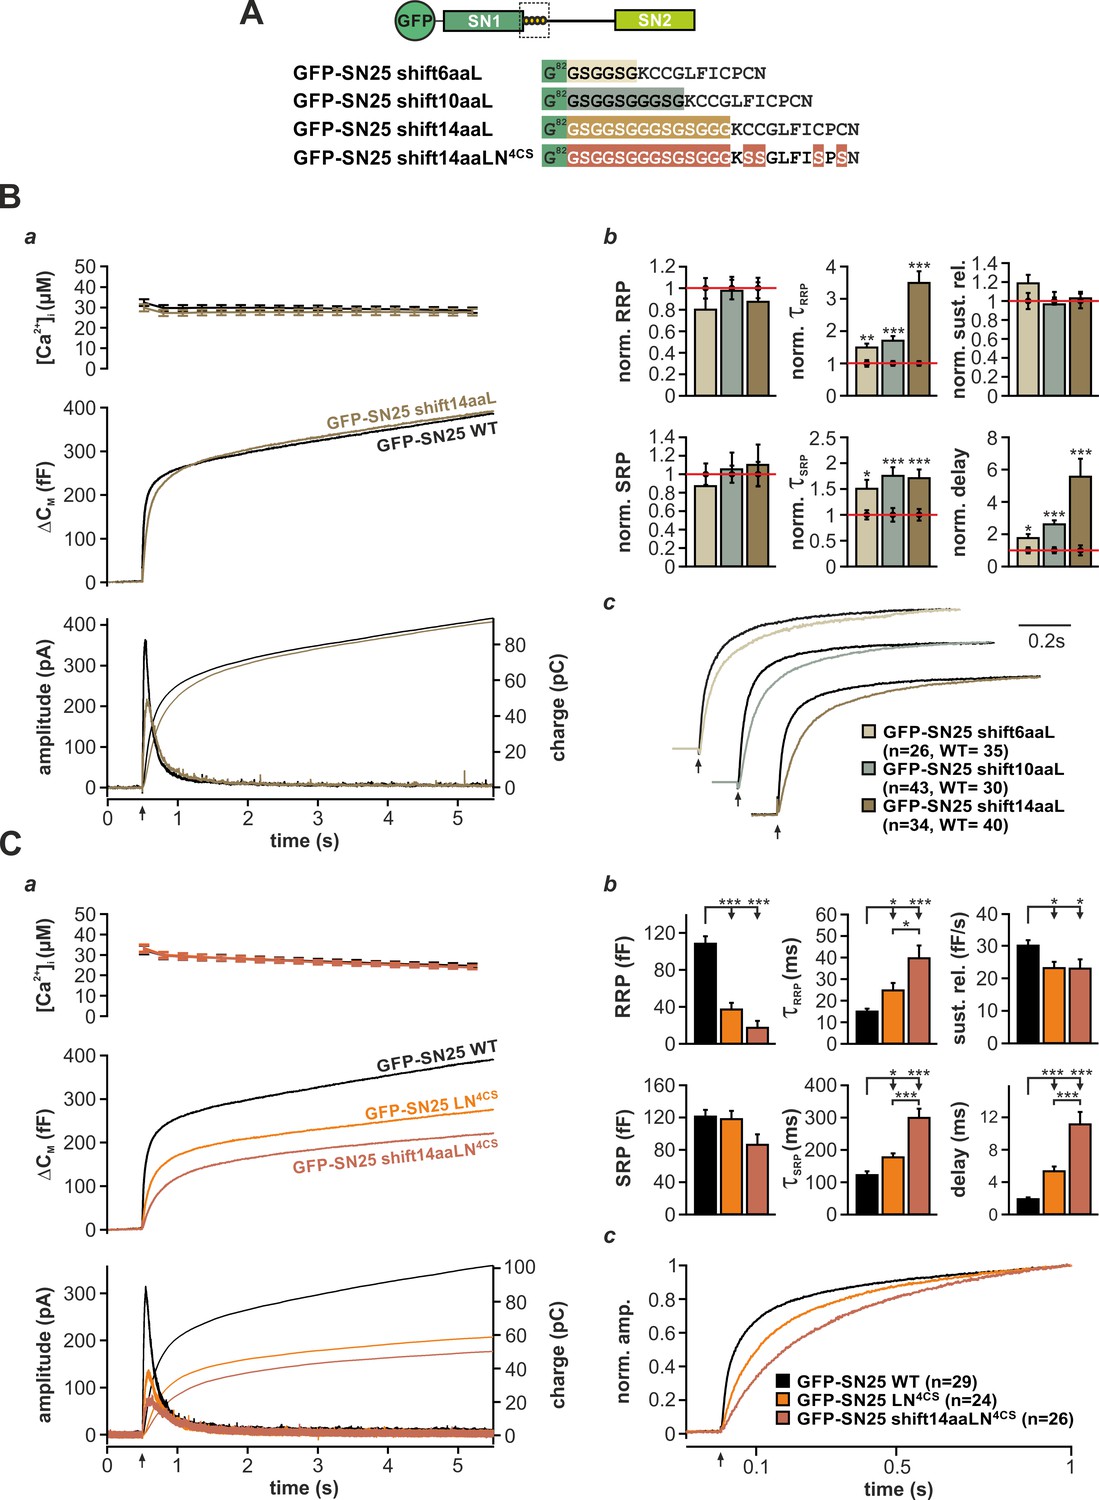
(A) Structure of the three mutants SN25 shift6/10/14aaL, which contain ‘uncoupling’ spacers, and the double mutant SN25 shift14aaLN4CS. (B) The secretion phenotype of GFP-SN25 shift14aaL (olive; WT in black) is shown as example for the functional deficits induced by spacer insertions. (a) Averaged [Ca2+]i measurements (top), capacitance traces (middle) and amperometric recordings (bottom) are shown. UV flash is indicated by arrow. (b) Analysis of kinetic parameters for all three tested mutants: GFP-SN25 shift6aaL (beige), GFP-SN25 shift10aaL (gray), and GFP-SN25 shift14aaL (olive). Data for the kinetic parameters were normalized to the corresponding WT control values. Statistical analyses were performed between mutant and control measurements (Student’s t-test). (c) Normalized plots of averaged capacitance traces highlight the kinetic deceleration caused by spacer insertions. All three pairs of WT/mutant traces are equally scaled. (C) Comparative electrophysiological analysis of secretion in GFP-SN25 LN4CS (orange), GFP-SN25 shift14aaLN4CS (red-brown), and WT protein-expressing KO cells (black). (a) Panel organization as in (Ba). (b) Quantitative analysis of kinetic parameters. (c) Normalized plot of the secretory burst component highlighting the changed kinetics of the double mutant. All data are mean ± SEM; n is indicated in the corresponding panel. Statistical comparisons were performed using ANOVA and Tukey’s test.
-
Figure 5—source data 1
Extended statistical data as Microsoft Excel spreadsheet.
- https://doi.org/10.7554/eLife.41720.027
Figure 5—figure supplement 1
Internal extension of the linker does not alter secretion properties.
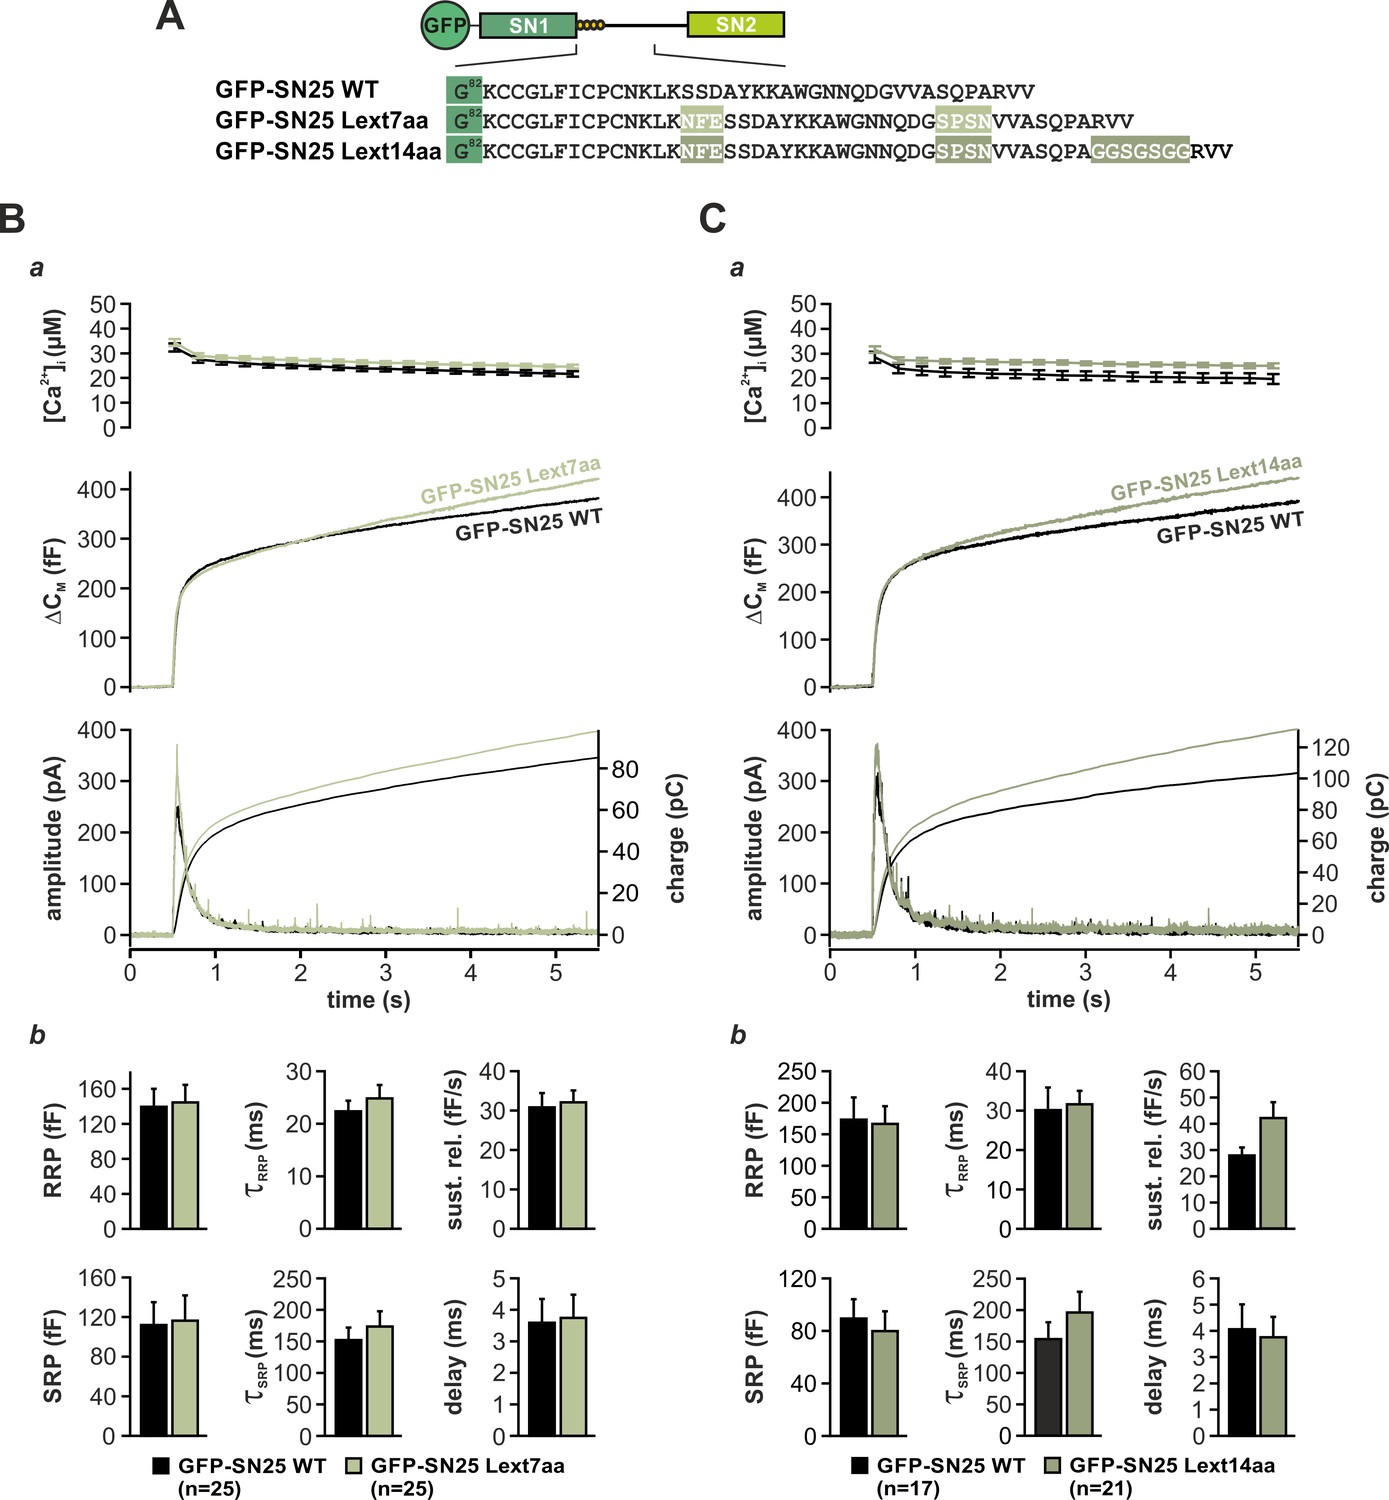
(A) Cartoon outlining the changes introduced in the tested mutants: In GFP-SN25 Lext7aa the N-terminal linker region was extended by small insertions found in the corresponding sequence of SNAP-23, whose homologous N-terminal section is seven amino acids longer. In GFP-SN25 Lext14aa, an additional seven residues long G/S spacer was inserted after A118. (B) Electrophysiological analysis of secretion in KO cells expressing GFP-SN25 Lext7aa (light green) or controls (black). (a) Averaged traces show [Ca2+]i measurements (top), capacitance change (middle) and amperometric currents (bottom) in Ca2+-uncaging experiments. Arrow indicates UV flash. (b) Quantification of kinetic parameters. Mean amplitudes of RRP and SRP components, the corresponding time constants τfast and τslow, sustained release rate, and exocytotic delay are shown. (C) Characterization of release in KO cells expressing GFP-SN25 Lext14aa (dark green) or controls (black). (a) Panel organization as described in (B). (b) Quantitative analysis did not show significant differences in the tested parameters (ANOVA and Tukey’s post-hoc test). All displayed data are presented as mean ± SEM. n is indicated in each panel.
-
Figure 5—figure supplement 1—source data 1
Extended statistical data as Microsoft Excel spreadsheet.
- https://doi.org/10.7554/eLife.41720.024
Figure 5—figure supplement 2

Removal of lysine residues in vicinity of the palmitoylation motif slightly decreases release rate.
(A) Cartoon illustrates the positions of the five K→A substitutions in the linker. Characterization of Ca2+-dependent secretion in KO cells expressing either GFP-SN25 WT (black), the original palmitoylation mutant SN25 LN4CS (orange), or SN25 LN5KA,4CS (violet), in which the flanking charged lysine residue were substituted. Averaged [Ca2+]i measurements (top), capacitance traces (middle) and amperometric recordings (bottom) are shown. UV flash is indicated by arrow. (B) Quantification of kinetic parameters. Note the significant increase in the τRRP in GFP-SN25 LN5KA,4CS in comparison to GFP-SN25 LN4CS. (C) Normalized plot of averaged capacitance traces highlights an additional kinetic deceleration of release in GFP-SN25 LN5KA,4CS-expressing cells in comparison to palmitoylation mutant GFP-SN LN4CS. All data are given as mean ± SEM; n is indicated in the corresponding panels. Statistical comparisons were done using ANOVA and Tukey’s test.
-
Figure 5—figure supplement 2—source data 1
Extended statistical data as Microsoft Excel spreadsheet.
- https://doi.org/10.7554/eLife.41720.026
Figure 6
The N-terminal linker segment controls fusion pore expansion.
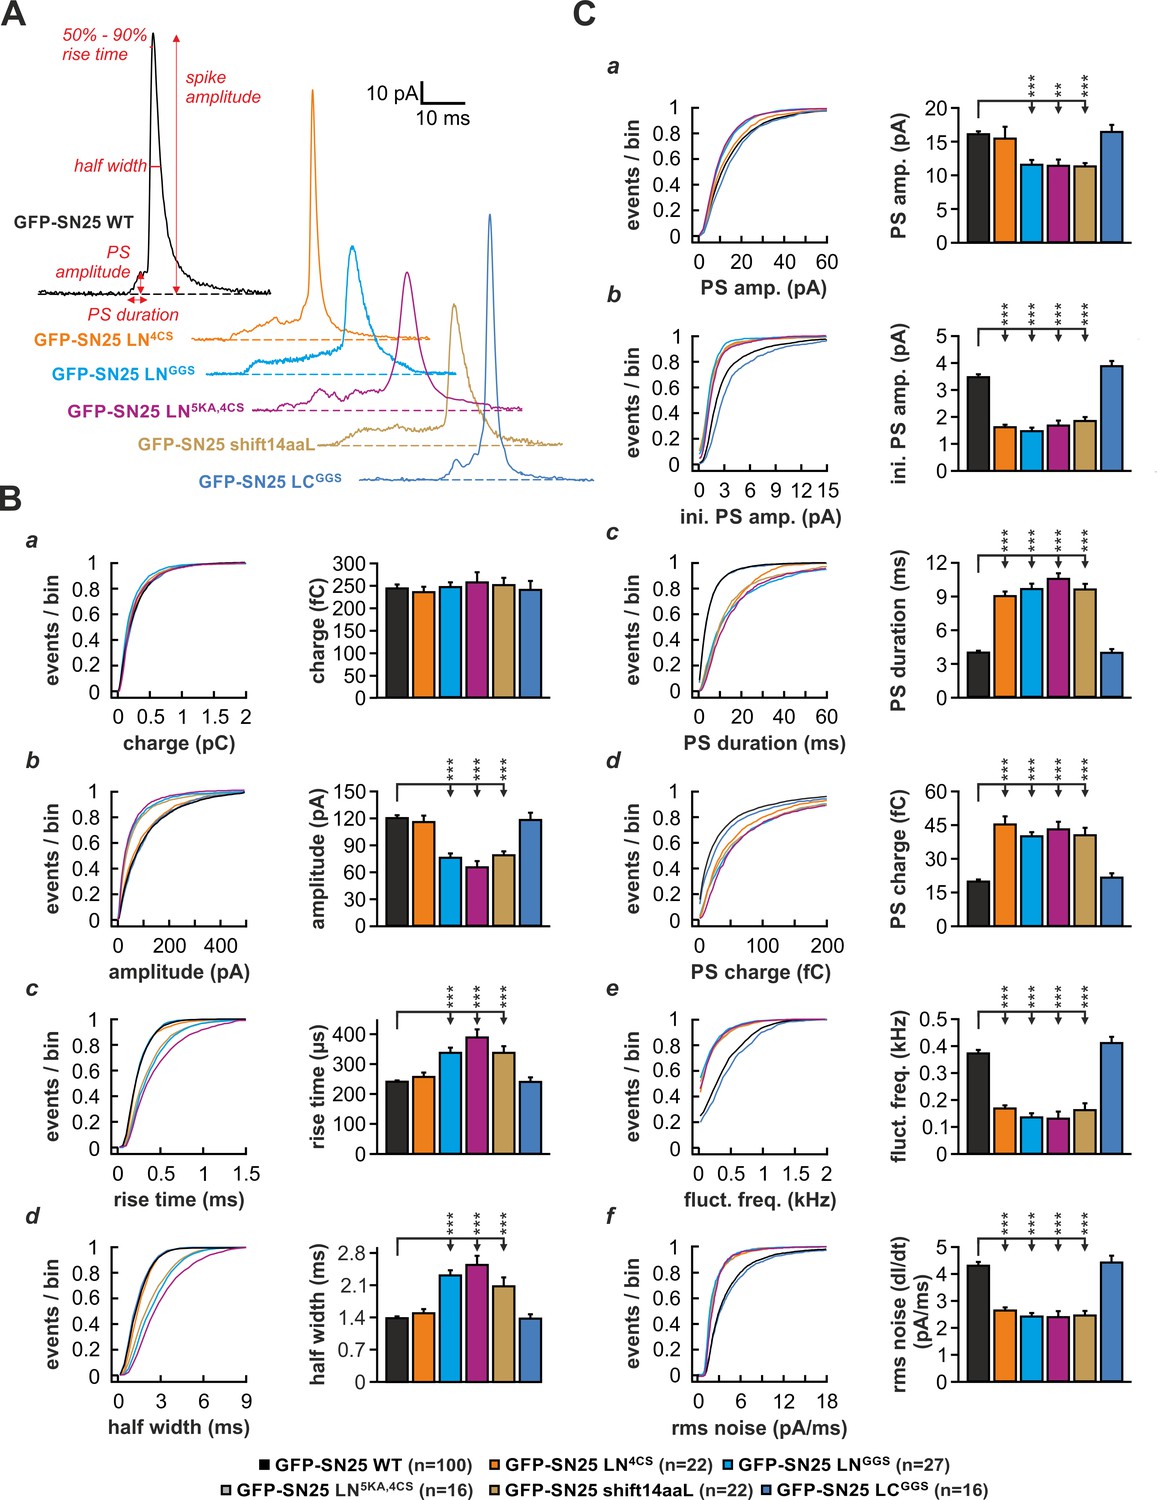
(A) Exemplary amperometric spikes recorded in KO cells expressing different N- and C-terminal linker mutants. The kinetic parameters determined during analysis are marked for a spike recorded in control experiments with WT SNAP-25. (B) Quantitative analysis of main spike properties. Data were collected for the following conditions (# of events/ # of cells): WT protein (black, 12633/100), GFP-SN25 LN4CS (orange, 1419/22), GFP-SN25 LNGGS (cyan, 1986/27), GFP-SN25 LN5KA,4CS (grey, 1391/16), GFP-SN25 shift14aaL (olive, 2377/22) and GFP-SN25 LCGGS (blue, 1014/16). Cumulative frequency distributions are displayed for (a) spike charge, (b) amplitude, (c) 50–90% rise time, and (d) half width. Bar graphs depict means of the median determined from the frequency distribution for each cell. (C) Analysis of PS waveform. Cumulative frequency distributions for (a) PS amplitude, (b) initial amplitude, (c) duration, (d) charge, (e) fluctuation frequency, and (f) root mean square (rms) noise of the current derivative are shown. As in (B), bar graphs show mean of cell medians for each parameter. Errors are SEM. Statistical comparisons were performed by ANOVA using Tukey’s test.
-
Figure 6—source data 1
Extended statistical data as Microsoft Excel spreadsheet.
- https://doi.org/10.7554/eLife.41720.029
Figure 7
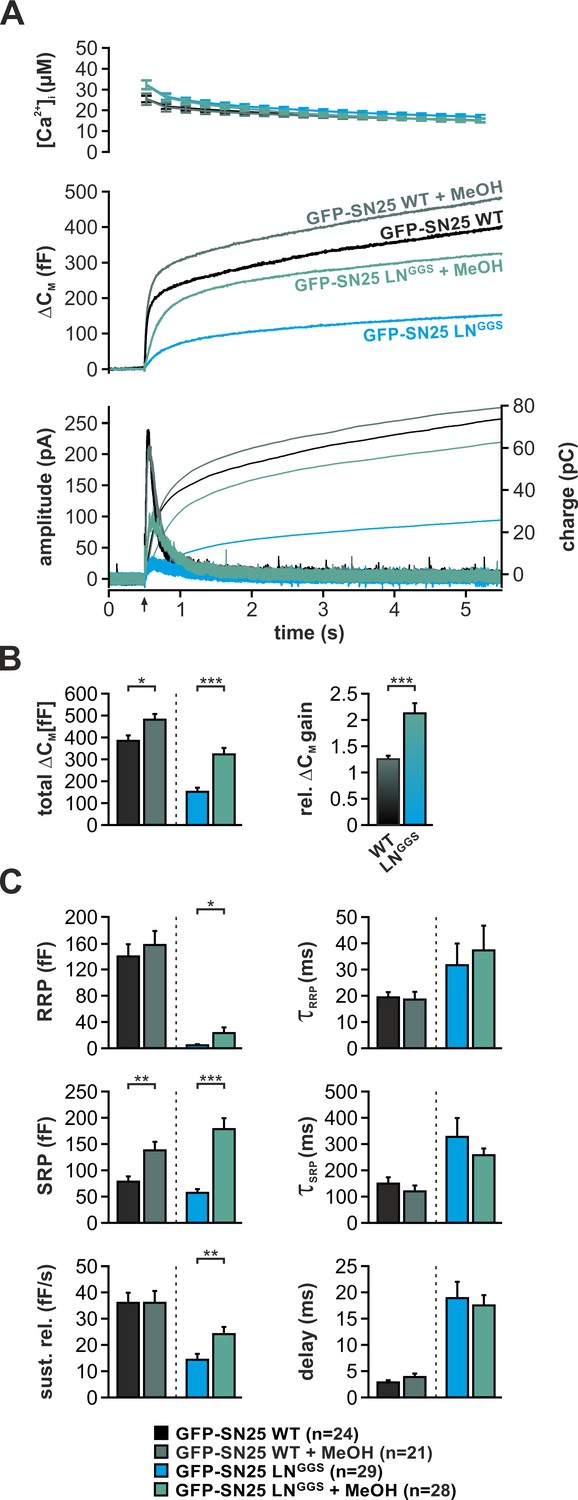
Intracellular application of methanol (MeOH) compensates for release deficits of GFP-SN25 LNGGS.
(A) The effect of low amounts of MeOH (2%) on secretion was tested in KO cells expressing either GFP-SN25 WT (dark green; untreated: black) or GFP-SN25 LNGGS (bright green; untreated: cyan) using Ca2+-uncaging. Averaged [Ca2+]i measurements (top), capacitance traces (middle) and amperometric recordings (bottom) are shown. UV flash is indicated by arrow. (B) Total ΔCM was quantified 5 s after flash application (left) and the relative gain in secretion in the presence of MeOH was calculated. Note the significantly stronger effect of MeOH on GFP-SN25 LNGGS-mediated release. (C) Analysis of kinetic parameters for secretion in presence and absence of MeOH. RRP and SRP size, time constants of release components, sustained release rate, and exocytotic delay were quantified. Data are shown as mean ± SEM; n is indicated at the bottom. Statistical comparisons between treated and untreated conditions were done using Student’s t-test.
-
Figure 7—source data 1
Extended statistical data as Microsoft Excel spreadsheet.
- https://doi.org/10.7554/eLife.41720.031
Figure 8
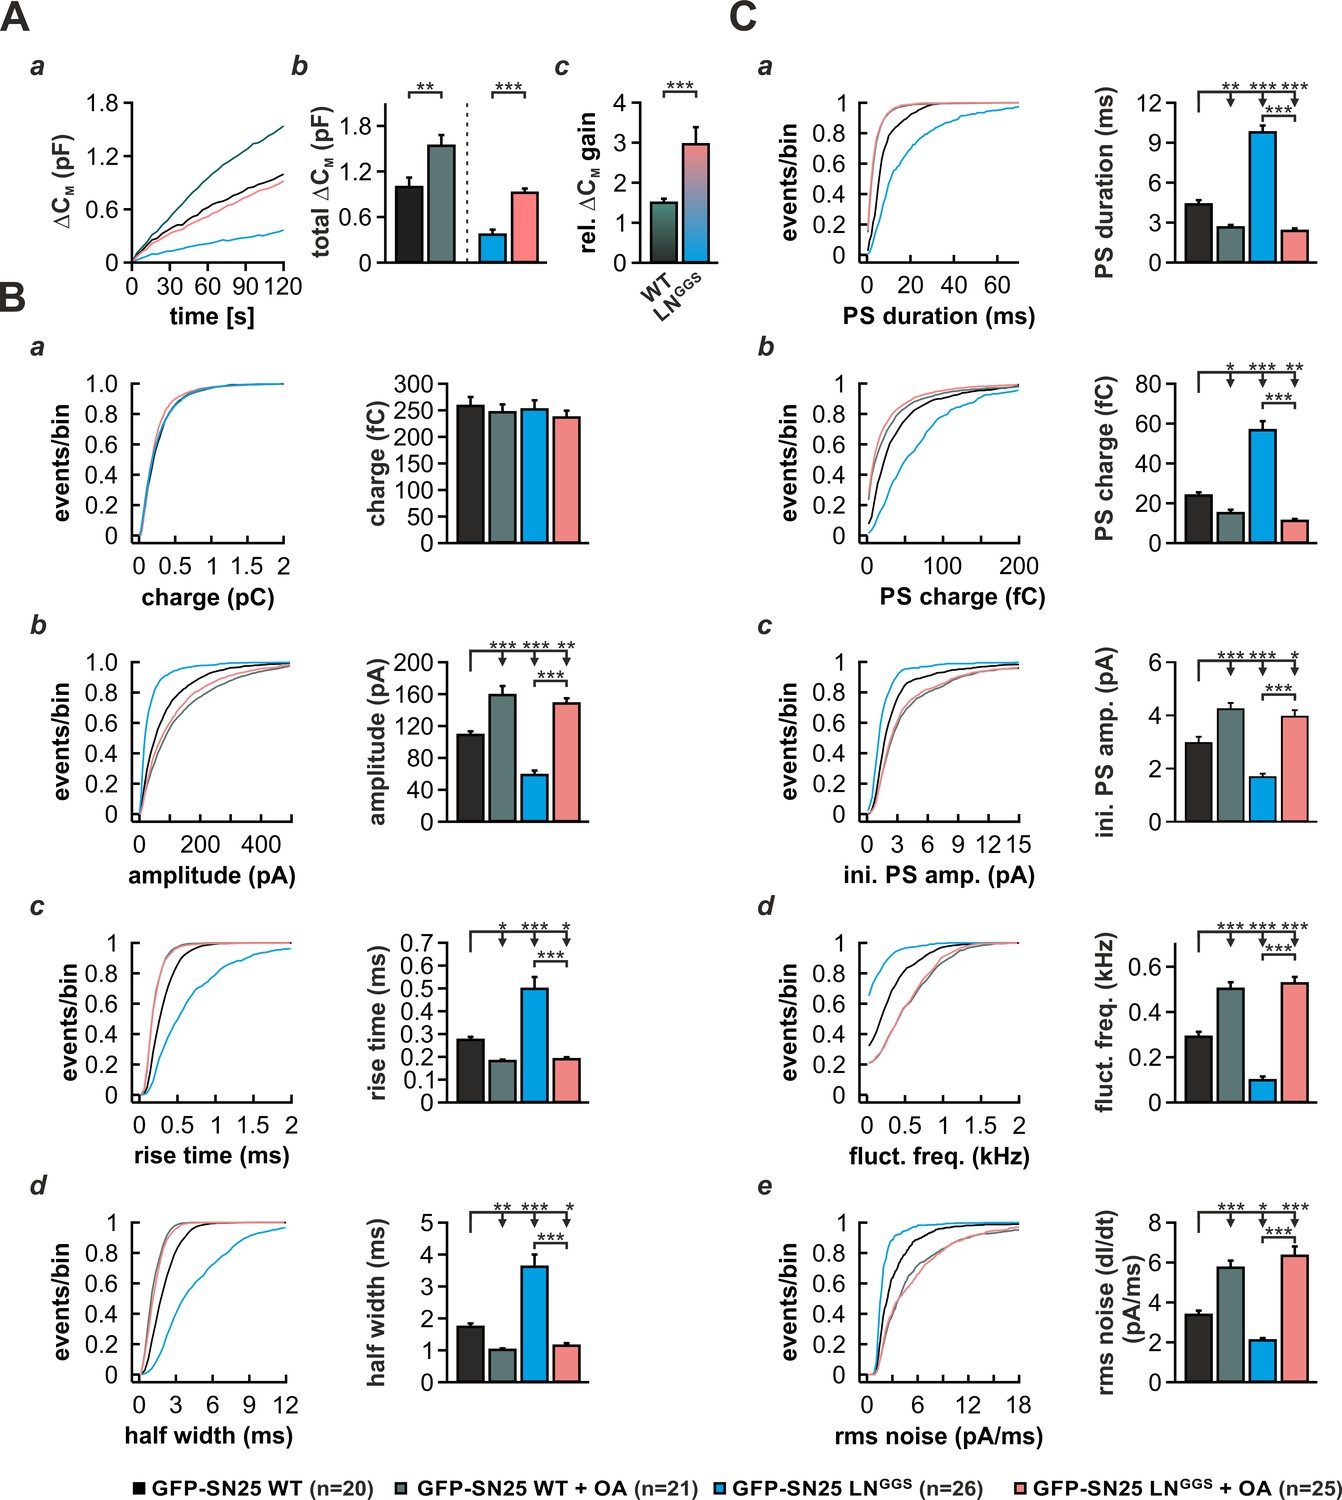
Intracellular infusion of oleic acid (OA) partially rescues exocytosis and reverses the kinetic delay of amperometric spikes induced by GFP-SN25 LNGGS.
(A) Characterization of secretion from KO cells expressing SN25 LNGGS or WT protein during infusion of solution containing 19 µM free Ca2+ together with either OA (5 µM) or vehicle (DMSO). (a) Depicted is the mean capacitance change (∆CM) over 120 s for each condition. (b) Total ∆CM after 120 s was averaged from the indicated number of cells. (c) The relative gain in ∆CM with OA over vehicle infusion was significantly higher in SN25 LNGGS expressing cells compared to WT controls. (B) Properties of the main amperometric spike, displayed as cumulative frequency distribution (left panel) and as cell weighted averages for the indicated parameters (right panel, a–d). (C) Properties of the prespike foot signal (PS) displayed as cumulative frequency distribution (left panel) and as cell weighted averages (right panel) for the indicated parameters (a–e). Values are given as mean of median determined from the parameter’s frequency distribution for each cell. Data are represented as mean ± SEM and were collected for the following conditions (# of events/ # of cells): WT protein (black, 1969/20), WT + OA (dark green, 2640/21), GFP-SN25 LNGGS (cyan, 968/26) and GFP-SN25 LNGGS+ OA (pastel pink, 2296/25). Statistical testing was done by ANOVA and Tukey’s post-hoc test.
-
Figure 8—source data 1
Extended statistical data as Microsoft Excel spreadsheet.
- https://doi.org/10.7554/eLife.41720.033
Figure 9
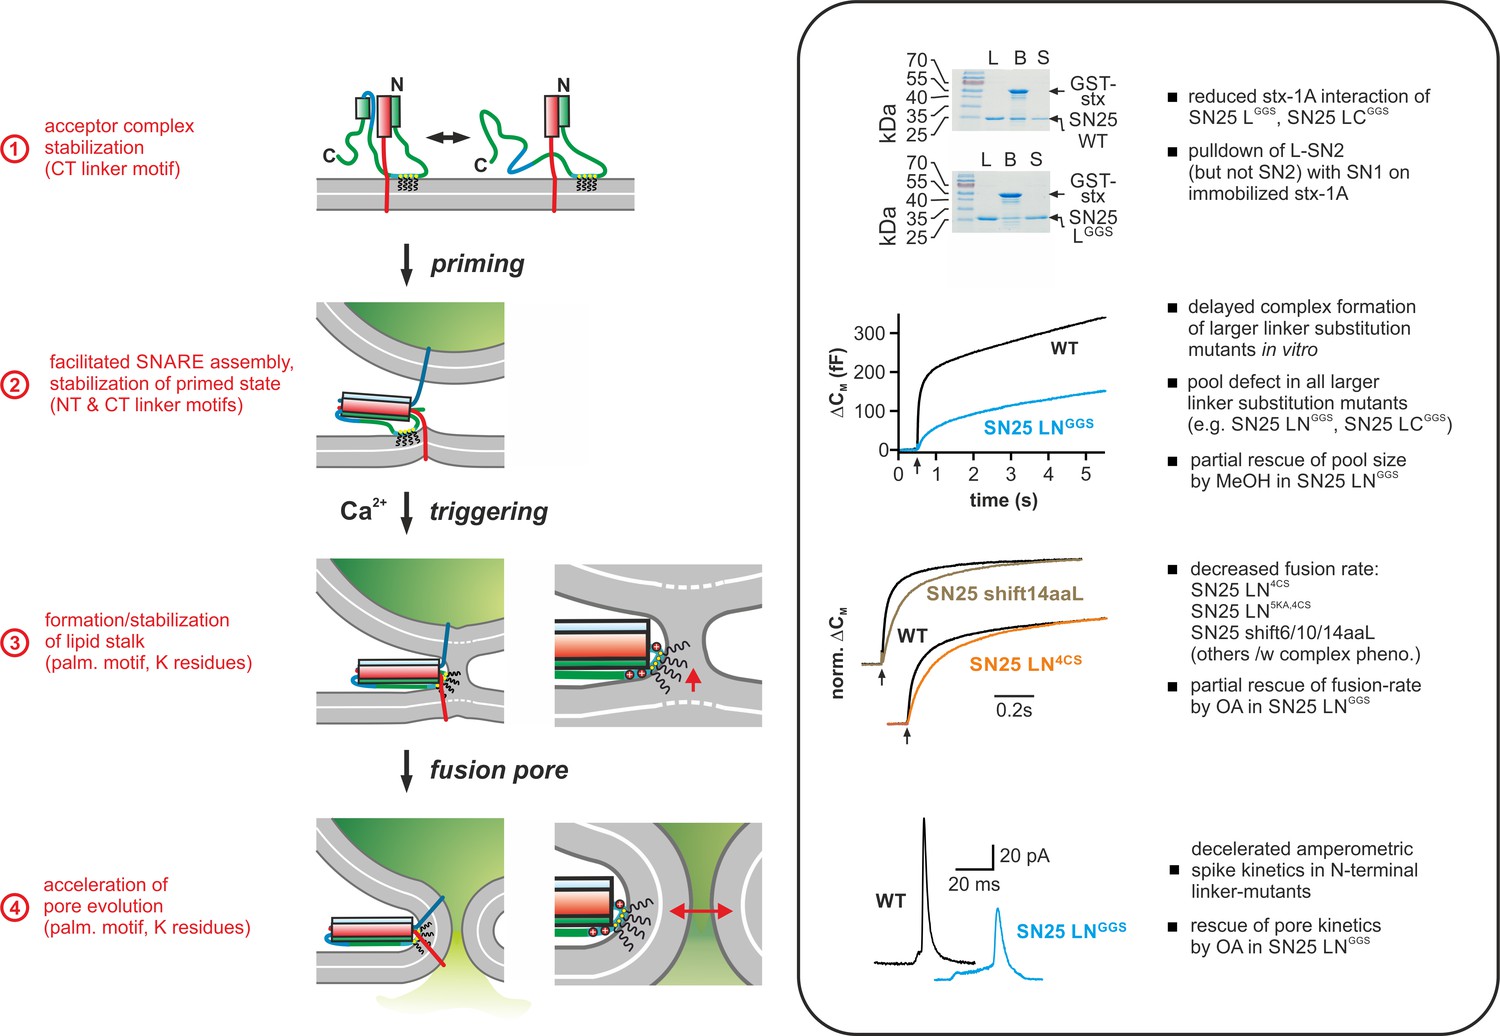
Mechanistic model of the role of the SNAP-25 linker domain in exocytosis.
Overview of the putative mechanistic functions of the SNAP-25 linker (cartoon, left side) with reference to the phenotypic features of linker mutants analyzed in this work (right side, box). The cartoon depicts key assembly states of a SNARE complex and potential correlated interactions of the SNAP-25 linker with core complex and/or plasma membrane. Syb-2 is shown in blue, stx-1A in red, and SNAP-25 in green. The acylated N-terminal (NT) linker segment is indicated by the cyan region; the blue section represents the backfolding C-terminal (CT) loop of SNAP-25. Helical segments are shown as boxes. Yellow circles indicate cysteine residues that were modified by acylation (black wavy lines). Positively charged lysine residues are indicated by red circles in the magnified view (for simplicity, only the SNARE motifs of syb-2 and stx-1A are shown in the close-up). Box contains original data (taken from Figure 2B, Figure 3A, Figure 5B/C, and Figure 6) in simplified form.
Author response image 1

Effect of intracellular Methanol (MeOH, 2%) application on the properties of amperometric spikes elicited by infusion of 19 µM Ca2+.
(a) Representative amperometric spikes recorded in WT chromaffin cells in the absence (black) or presence (red) of MeOH. (b) Superimposition of averaged spike waveforms from two successively recorded cells, one untreated (113 spikes), the other infused with MeOH (138 spikes). (c) Detailed kinetic analysis of the prespike foot signals: Shown are mean foot amplitude, charge, and duration (WT: 2308 events, 20 cells; WT+MeOH: 3730 events, 25 cells). (d) Quantitative analysis of main spike parameters: Depicted are mean amplitude, charge, rise time (50-90%), and half-width. No significant differences were observed. Error bars represent SEM.
Tables
Key resources table
| Reagent type (species) or resource | Designation | Source or reference | Identifiers | Additional information |
|---|---|---|---|---|
| Strain, strain background (Mus Musculus) | C57BL/6 | |||
| Genetic reagent (Mus Musculus) | Snap25 null allele | Washbourne et al., 2001, Genetic ablation of the t-SNARE SNAP-25 distinguishes mechanisms of neuroexocytosis. Nat Neurosci. 5 (1):19–26. PMID:11753414 | Snap25tm1Mcw, MGI:2180178 | |
| cDNA (Rattus Norvegicus) | Snap25a WT | Sorensen et al., 2002 , The SNARE protein SNAP-25 is linked to fast calcium triggering of exocytosis.Proc Natl Acad Sci U S A 99(9):6449. PMID: 11830673 | amino acid sequence identical to murine Snap25a | |
| Antibody | mouse anti-SNAP-25, SySy 71.1 | Synaptic Systems | Cat# 111 011 | WB 1:1000 |
| Antibody | HRP-conjugated goat-anti mouse | Bio-Rad Laboratories | Cat# 170–5047 | WB 1:5000 |
| Antibody | rabbit anti-SNAP-25, AB1762 | Sigma Adrich | AB1762 | WB 1:1000 |
| Antibody | HRP-conjugated goat-anti rabbit | Bio-Rad Laboratories | Cat# 170–5046 | WB 1:5000 |
| Transfected construct (Mus Musculus) | pSFV1 GFP-SNAP-25 WT | Sorensen et al., 2002, The SNARE protein SNAP-25 is linked to fast calcium triggering of exocytosis.Proc Natl Acad Sci U S A 99(9):6449. PMID: 11830673 | contains rat Snap25a WT cDNA; also abbreviated as pSFV1 GFP-SN25 WT | |
| Transfected construct (Mus Musculus) | pSFV1 GFP-SN25 LGGS | this paper | derived from pSFV1 GFP-SNAP-25 WT, substitution of the linker by varied G/S sequence | |
| Transfected construct (Mus Musculus) | pSFV1 GFP-SN25 LNGGS | this paper | derived from pSFV1 GFP-SNAP-25 WT, substitution of the NT linker (aa 83–118) by varied G/S sequence | |
| Transfected construct (Mus Musculus) | pSFV1 GFP-SN25 LCGGS | this paper | derived from pSFV1 GFP-SNAP-25 WT, substitution of the CT linker (aa 119–141) by varied G/S sequence | |
| Transfected construct (Mus Musculus) | pSFV1 GFP-SN25 LC4G | this paper | derived from pSFV1 GFP-SNAP-25 WT, CT substitution F133G, I134G, V137G, A141G | |
| Transfected construct (Mus Musculus) | pSFV1 GFP-SN25 LC9G | this paper | derived from pSFV1 GFP-SNAP-25 WT, substitution of F133-A141 by glycine residues | |
| Transfected construct (Mus Musculus) | pSFV1 GFP-SN25 LN4CS | this paper | derived from pSFV1 GFP-SNAP-25 WT, substitution of 4x cysteine by serine | |
| Transfected construct (Mus Musculus) | pSFV1 P-GFP-SN25 WT | this paper | derived from pSFV1 GFP-SNAP-25 WT, insertion of the minimal SNAP-25 palmitoylation sequence (aa 83–120) NT of GFP | |
| Transfected construct (Mus Musculus) | pSFV1 P-GFP-SN25 LN4CS | this paper | derived from pSFV1 GFP-SN25 LN4CS, insertion of the minimal SNAP-25 palmitoylation sequence (aa 83–120) NT of GFP | |
| Transfected construct (Mus Musculus) | pSFV1 GFP-SN25 shift6aaL | this paper | derived from pSFV1 GFP-SNAP-25 WT, insertion of a six aa G/S spacer after G82 | |
| Transfected construct (Mus Musculus) | pSFV1 GFP-SN25 shift10aaL | this paper | derived from pSFV1 GFP-SNAP-25 WT, insertion of a 10 aa G/S spacer after G82 | |
| Transfected construct (Mus Musculus) | pSFV1 GFP-SN25 shift14aaL | this paper | derived from pSFV1 GFP-SNAP-25 WT, insertion of a 14 aa G/S spacer after G82 | |
| Transfected construct (Mus Musculus) | pSFV1 GFP-SN25 Lext7aa | this paper | derived from pSFV1 GFP-SNAP-25 WT, NT insertion of 7 aa analogous to linker of SNAP-23 | |
| Transfected construct (Mus Musculus) | pSFV1 GFP-SN25 Lext14aa | this paper | derived from pSFV1 GFP-SN25 Lext7aa, insertion of a 7aa G/S spacer after A119 | |
| Transfected construct (Mus Musculus) | pSFV1 GFP-SN25 shift14aaLN4CS | this paper | derived from pSFV1 GFP-SN25 shift14aaL, substitution of 4x cysteine by serine | |
| Transfected construct (Mus Musculus) | pSFV1 GFP-SN25 LN5KA,4CS | this paper | derived from pSFV1 GFP-SN25 LN4CS, substitution K83A, K94A, K96A, K102A, K103A | |
| Transfected construct (Mus Musculus) | pSFV1 GFP-SN1-L IRES SN2 | this paper | bicistronic expression vector (emcv IRES), newly cloned from pSFV1 and Snap25 cDNA fragments (SN1-L: aa 1–141; SN2: aa 138–206) | |
| Transfected construct (Mus Musculus) | pSFV1 mCherry-SN2 IRES SN1-L | this paper | bicistronic expression vector (emcv IRES), newly cloned from pSFV1 and Snap25 cDNA (SN1-L: aa 1–141; SN2: aa 138–206) | |
| Transfected construct (Mus Musculus) | pSFV1 mCherry-SN2 IRES SN25Δ26 | this paper | bicistronic expression vector (polio virus IRES), newly cloned from pSFV1 and Snap25 cDNA fragments (SN25Δ26: aa 1–180; SN2: aa 138–206) | |
| Recombinant DNA reagent | pET28 SN25WT | this paper | 6xHis-tagged SNAP-25a WT for protein expression | |
| Recombinant DNA reagent | pET28 SN25 LGGS | this paper | 6xHis-tagged SN25 LGGS for protein expression | |
| Recombinant DNA reagent | pET28 SN25 LNGGS | this paper | 6xHis-tagged SN25 LNGGS for protein expression | |
| Recombinant DNA reagent | pET28 SN25 LCGGS | this paper | 6xHis-tagged SN25 LCGGS for protein expression | |
| Recombinant DNA reagent | pET28 SN1 | this paper | 6xHis-tagged SN1 (aa 1–82) fragment for protein expression | |
| Recombinant DNA reagent | pET28 SN2 | this paper | 6xHis-tagged SN2 (aa 142–206) fragment for protein expression | |
| Recombinant DNA reagent | pET28 SN1-L | this paper | 6xHis-tagged SN1-L (aa 1–142) fragment for protein expression | |
| Recombinant DNA reagent | pET28 L-SN2 | this paper | 6xHis-tagged L-SN2 (aa 83–206) fragment for protein expression | |
| Software, algorithm | IgorPro | WaveMetrics Software | ||
| Software, algorithm | AutesP | NPI electronics | ||
| Software, algorithm | ImageJ | NIH software |
Additional files
-
Transparent reporting form
- https://doi.org/10.7554/eLife.41720.035
Download links
A two-part list of links to download the article, or parts of the article, in various formats.
Downloads (link to download the article as PDF)
Open citations (links to open the citations from this article in various online reference manager services)
Cite this article (links to download the citations from this article in formats compatible with various reference manager tools)
The SNAP-25 linker supports fusion intermediates by local lipid interactions
eLife 8:e41720.
https://doi.org/10.7554/eLife.41720


