A conserved major facilitator superfamily member orchestrates a subset of O-glycosylation to aid macrophage tissue invasion
- Institute of Science and Technology Austria, Austria
- University of Warwick, United Kingdom
- University of Copenhagen, Denmark
Figures
Figure 1 with 1 supplement

T antigen is enriched on Drosophila macrophages prior to and during their invasion of the extended germband.
(A) Schematic of T antigen modification of serine (S) and threonine (T) on proteins within the Golgi lumen, through successive addition of GalNAc (yellow) by GalNAcTs and Gal (blue) by C1GalTs. Ugalt transports Gal into the Golgi. Glycosylation is shown at a much larger scale than the protein. (B) Schematic of an early Stage 12 embryo and a magnification of macrophages (red) entering between the germband ectoderm (dark grey), and mesoderm (light grey). (C) Schematic showing macrophages (red) disseminating from the head mesoderm in Stage 9. By Stage 10, they migrate towards the extended germband, the dorsal vessel and along the ventral nerve cord (vnc). At late Stage 11 germband invasion (arrow) begins and continues during germband retraction. Arrowhead highlights migration along the vnc in late Stage 12. (D) Table summarizing a screen of glycosylation-binding lectins for staining on macrophages invading the germband in late Stage 11 embryos. The listed binding preferences are abbreviated summaries of the specificities defined with mammalian glycans or simple saccharides which may have only incomplete relevance to insect glycomes. Enrichment was seen for PNA which recognizes T antigen and UEA-I which can recognize fucose. (E) Quantification of T antigen fluorescence intensities on wild type embryos shows upregulation on macrophages between Stage 9/10 and Stage 11/12. Arbitrary units (au) normalized to one for Stage 11. p<0.0001. (F–H) Confocal images of fixed lateral wild type embryos from (F) Stage 9 and (G–H) early Stage 12 with T antigen visualized by antibody staining (green) and macrophages by srpHemo-3xmCherry expression (red). Schematics at left with black boxes showing the imaged regions. (I) Quantification of control shows T antigen enrichment on macrophages when normalized to whole embryo. RNAi in macrophages against C1GalTA by srpHemo(macrophage)>C1 GalTA RNAi vdrc2826 significantly decreases this T antigen staining (n = 8 embryos, p=0.011). (J) Representative confocal images of Stage 12 embryos from control and the aforementioned C1GalTA RNAi. Macrophages marked with cytoplasmic GFP (red) and nuclear RFP (green). (K,L) Quantification of macrophages in the germband in Stage 12 embryos for (K) control and two independent RNAis against C1GalTA (vdrc110406 or vdrc2826) expressed in macrophages by the srpHemo-Gal4 driver (n = 21–31 embryos, p<0.0001 and 0.017) or (L) in control and the C1GalTA[2.1] excision mutant (n = 23–24, p=0.0006). Macrophages labeled with srpHemo-H2A::3xmCherry. The RNAis and the mutant significantly decreased the macrophage number, arguing that T antigen is required in macrophages for germband entry. (M) Quantification of germband macrophages in early Stage 12 embryos in control and GlcAT-PMI05251 embryos shows no defect in macrophage invasion in the mutant (n = 17–20, p=0.962). (E) analyzed by Kruskal-Wallis test I, K-M analyzed by Student’s t-test. ns = p > 0.05, *p<0.05; **p<0.01; ***p<0.001. Scale bars represent 10 μm in F–H, and 50 μm in J. See also Figure 1—figure supplement 1.
-
Figure 1—source data 1
Source data on the quantification of T antigen levels shown in Figure 1E and Figure 1I, the number of macrophages in the germband shown in Figure 1K–M, and the number on the yolk shown in Figure 1—figure supplement 1N–O,Q and on the vnc (Figure 1—figure supplement 1P).
- https://doi.org/10.7554/eLife.41801.005
Figure 1—figure supplement 1

Lectin screen reveals enriched staining for PNA and UEA-1 on macrophages.
(A–L) Confocal images of fixed late Stage 11/early Stage 12 wild type embryos (schematic above) stained with different lectins (visualized in green) indicated in green type in the lower left corner. Macrophages are detected through srpHemo-3xmCherry expression (red). Boxed area in schematic shows area of merged overview image at left. Boxed area in merged overview corresponds to the images shown magnified at right. (M) Confocal images of the germband from fixed early Stage 12 embryos from the control and ones in which UAS-C1GalTA RNAi is expressed in macrophages under srpHemo-GAL4 control. Macrophages visualized with an antibody against GFP expressed in macrophages (srpHemo >GFP) (red) and T antigen by antibody staining (green). Boxed area in schematic at left indicates embryo region imaged. (N,O) Quantification of macrophages on the yolk in fixed early Stage 12 embryos in (N) srpHemo >UAS-C1GalTA RNAi (vdrc 2826) and (O) the C1GalTA[2.1] excision mutant shows an increase in both compared to the control (n = 14–24, p=0.00004 for N, p=0.0007 for O). (P) Quantification of macrophage numbers in the vnc segments shown in the schematic in fixed mid Stage 12 embryos detects no significant difference between control and srpHemo >UAS-C1GalTA RNAi embryos (n = 10–20). (Q) Quantification of macrophages on the yolk in fixed early Stage 12 embryos in GlcAT-PMI05251 shows a 20% increase compared to the control (n = 17–20, p=0.04). Significance was assessed by Mann-Whitney test in N and Student’s t-test in O–Q, ns = p > 0.05, *=p < 0.05, ***=p < 0.001. Scale bars are 30 μm in overview images and 5 μm in magnifications in A–L, 10 μm in M.
Figure 2 with 1 supplement
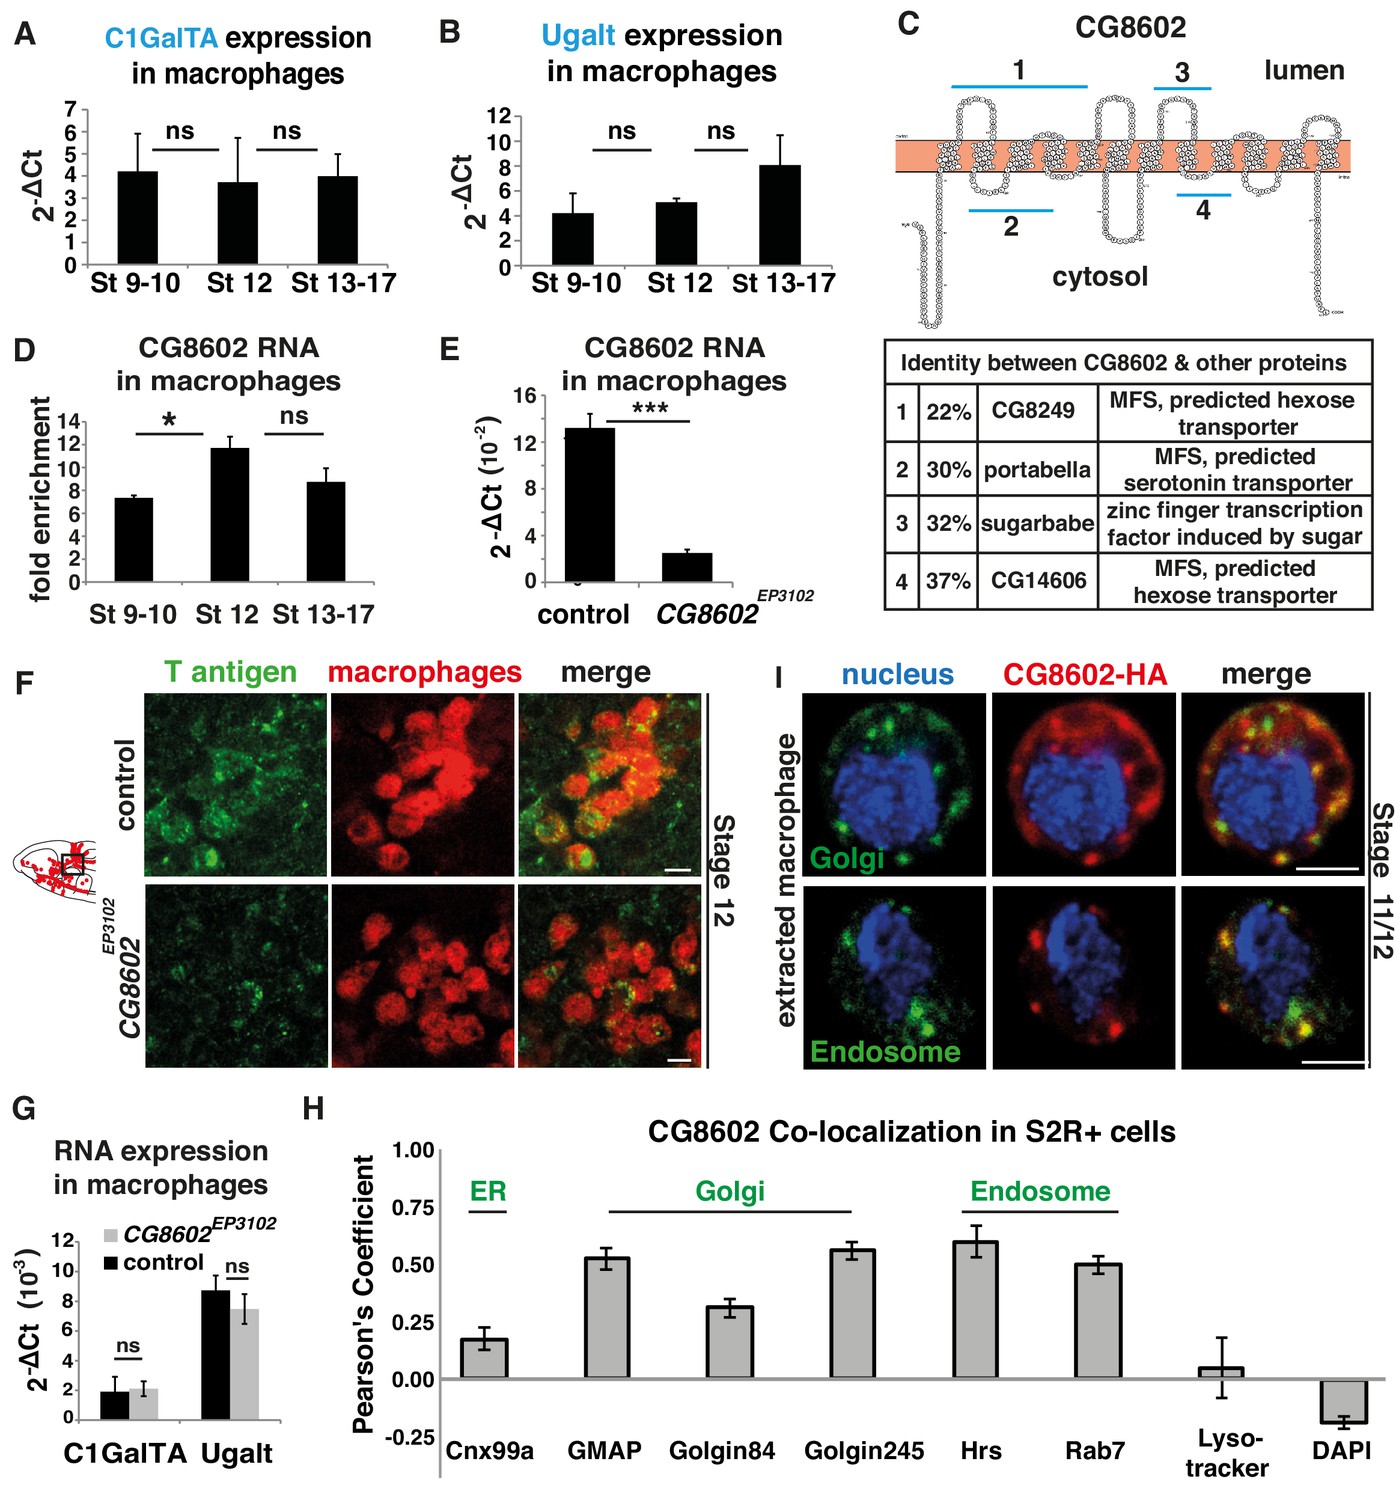
An atypical MFS family member, CG8602, located in the Golgi and endosomes, is required for T antigen enrichment on invading macrophages.
(A,B) qPCR quantification (2-ΔCt) of RNA levels in mCherry+ macrophages FACS sorted from srpHemo-3xmCherry wild type embryos reveals no significant change in the expression of (A) the C1GalTA galactose transferase or (B) the Ugalt Gal transporter during Stage 9–17 (n = 7 biological replicates, three independent FACS sorts). (C) Schematic made with Protter (Omasits et al., 2014) showing the predicted 12 transmembrane domains of CG8602. Blue lines indicate regions displaying higher than 20% identity to the correspondingly numbered Drosophila protein indicated below, along with the homologous protein’s predicted or determined function. (D) Quantification by qPCR of CG8602 RNA levels in FACS sorted mCherry+ macrophages compared to other mCherry- cells obtained from srpHemo-3xmCherry wild type embryos at Stage 9–10, Stage 12 and Stage 13–17. CG8602 macrophage expression peaks at Stage 12, during macrophage germband entry (n = 3–7 biological replicates, four independent FACS sorts, p=0.036). (E) qPCR quantification in FACS sorted srpHemo-3xmCherry labeled macrophages from control and CG8602EP3102 mutant Stage 12 embryos shows an extremely strong decrease in CG8602 RNA expression in the P element insertion mutant used in this study (n = 7 biological replicates, three independent FACS sorts, p=0.0024). (F) Confocal images of Stage 12 control and CG8602EP3102 mutant embryos with macrophages (red) visualized by srpHemo-mCherry expression and T antigen by antibody staining (green). Schematic at left depicts macrophages (red) entering the germband. Black box indicates the region next to the germband imaged at right. We observe decreased T antigen staining on macrophages in the CG8602EP3102 mutant compared to the control. (G) qPCR quantification (2-ΔCt) of C1GalTA and Ugalt RNA levels in FACS sorted macrophages from Stage 12 embryos from control and CG8602EP3102 mutant embryos shows no significant change in expression of the Gal transferase, or the Gal and GalNAc transporter in the mutant compared to the control (n = 7 biological replicates, three independent FACS sorts). (H) Quantitation using Fiji of the colocalization of transfected MT-CG8602::FLAG::HA in fixed S2R+ cells with markers for the ER (Cnx99a), the Golgi (Golgin 84, Golgin 245, and GMAP), the early endosome (Hrs), the late endosome (Rab7), and live S2R+ cells transfected with srp-CG8602::3xmCherry with dyes that mark the lysosome (Lysotracker) and the nucleus (DAPI). Representative images are shown in Figure 2—figure supplement 1 B-J. n = 24, 23, 23, 17, 6, 22, 6 and 13 cells analyzed per respective marker. (I) Macrophages near the germband extracted from srpHemo >CG8602 HA Stage 11/12 embryos show partial colocalization of the HA antibody labeling CG8602 (red) and a Golgin 84 or Hrs antibody marking the Golgi or endosome respectively (green). Nucleus is stained by DAPI (blue). For all qPCR experiments values are normalized to expression of a housekeeping gene RpL32. Scale bars are 5 μm in F, 3 μm in I. Significance was assessed by Kruskal-Wallis test in A, B, One way Anova in D and Student’s t-test in E, G. ns = p > 0.05, *p<0.05, ***p<0.001. See also Figure 2—figure supplement 1.
-
Figure 2—source data 1
Source data on the quantification of C1GalTA, Ugalt, and CG8602 expression in macrophages by qPCR (shown in Figure 2A–B,D–E,G) and the Pearson’s coefficient for CG8602 colocalization with different markers (Figure 2H).
- https://doi.org/10.7554/eLife.41801.008
Figure 2—figure supplement 1
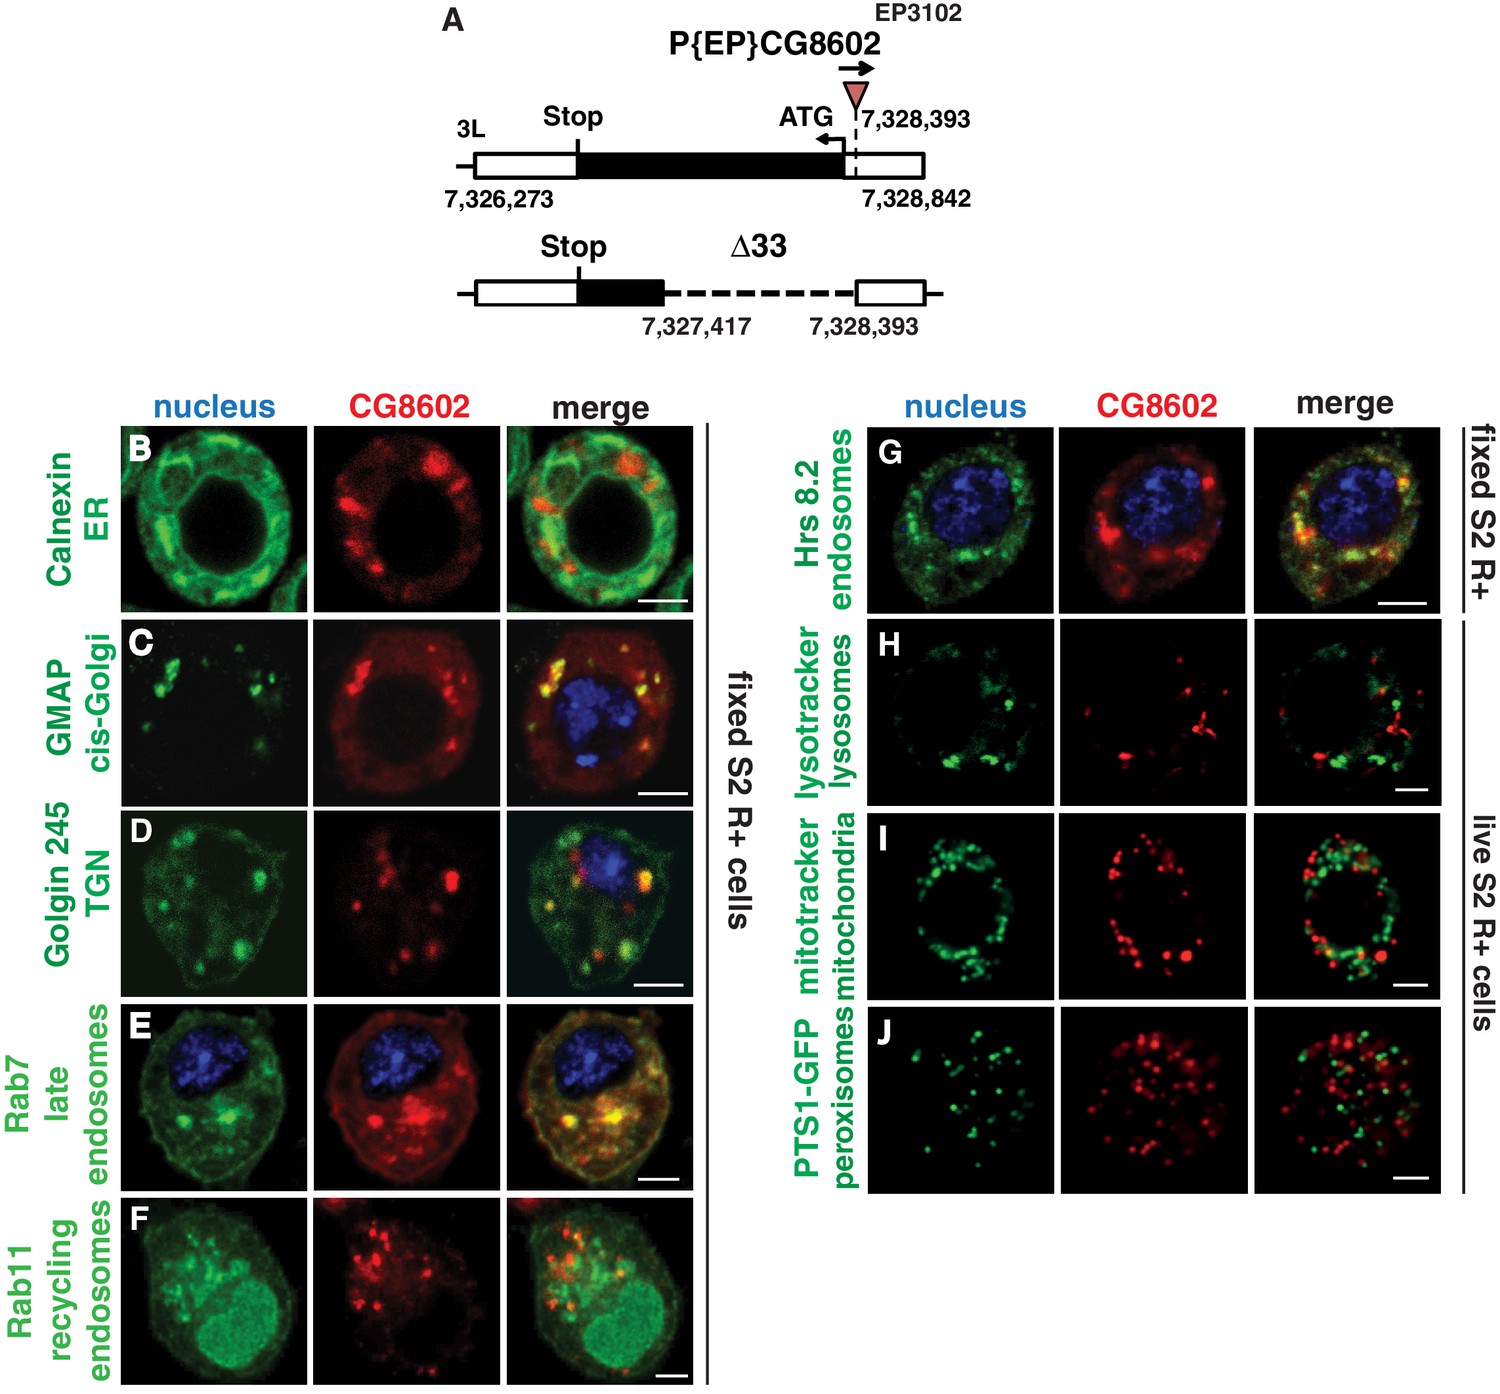
CG8602 expression and localization.
(A) Schematic depicting the CG8602 gene and the insertion site of the EP3102 P element and the Δ33 excision mutant induced by P element mobilization which removes 914 bp of the ORF. (B–J) Confocal images of S2R+ cells transfected with (B–G) MT-CG8602::FLAG::HA and then fixed and visualized by HA antibody staining (red) or (H–J) srpHemo-CG8602::3xmCherry (red) with different parts of the endomembrane system visualized by live markers as indicated (green). DAPI (blue) marks the nucleus. CG8602 showed (B) no colocalization with the ER marker Calnexin, partial colocalization with the (C,D) Golgi markers GMAP and Golgin 245, (E) late endosomal marker Rab7, (F) recycling endosome marker Rab11-YFP, and (G) endosomal marker Hrs8.2, no colocalization with the (H) lysosome marker lysotracker, (I) mitochondrial marker mitotracker and (J) peroxisomal marker PTS1-GFP in fixed (B–G) or live (H–J) S2R+ cells. Scale bar is 3 μm in B-J.
Figure 3 with 4 supplements
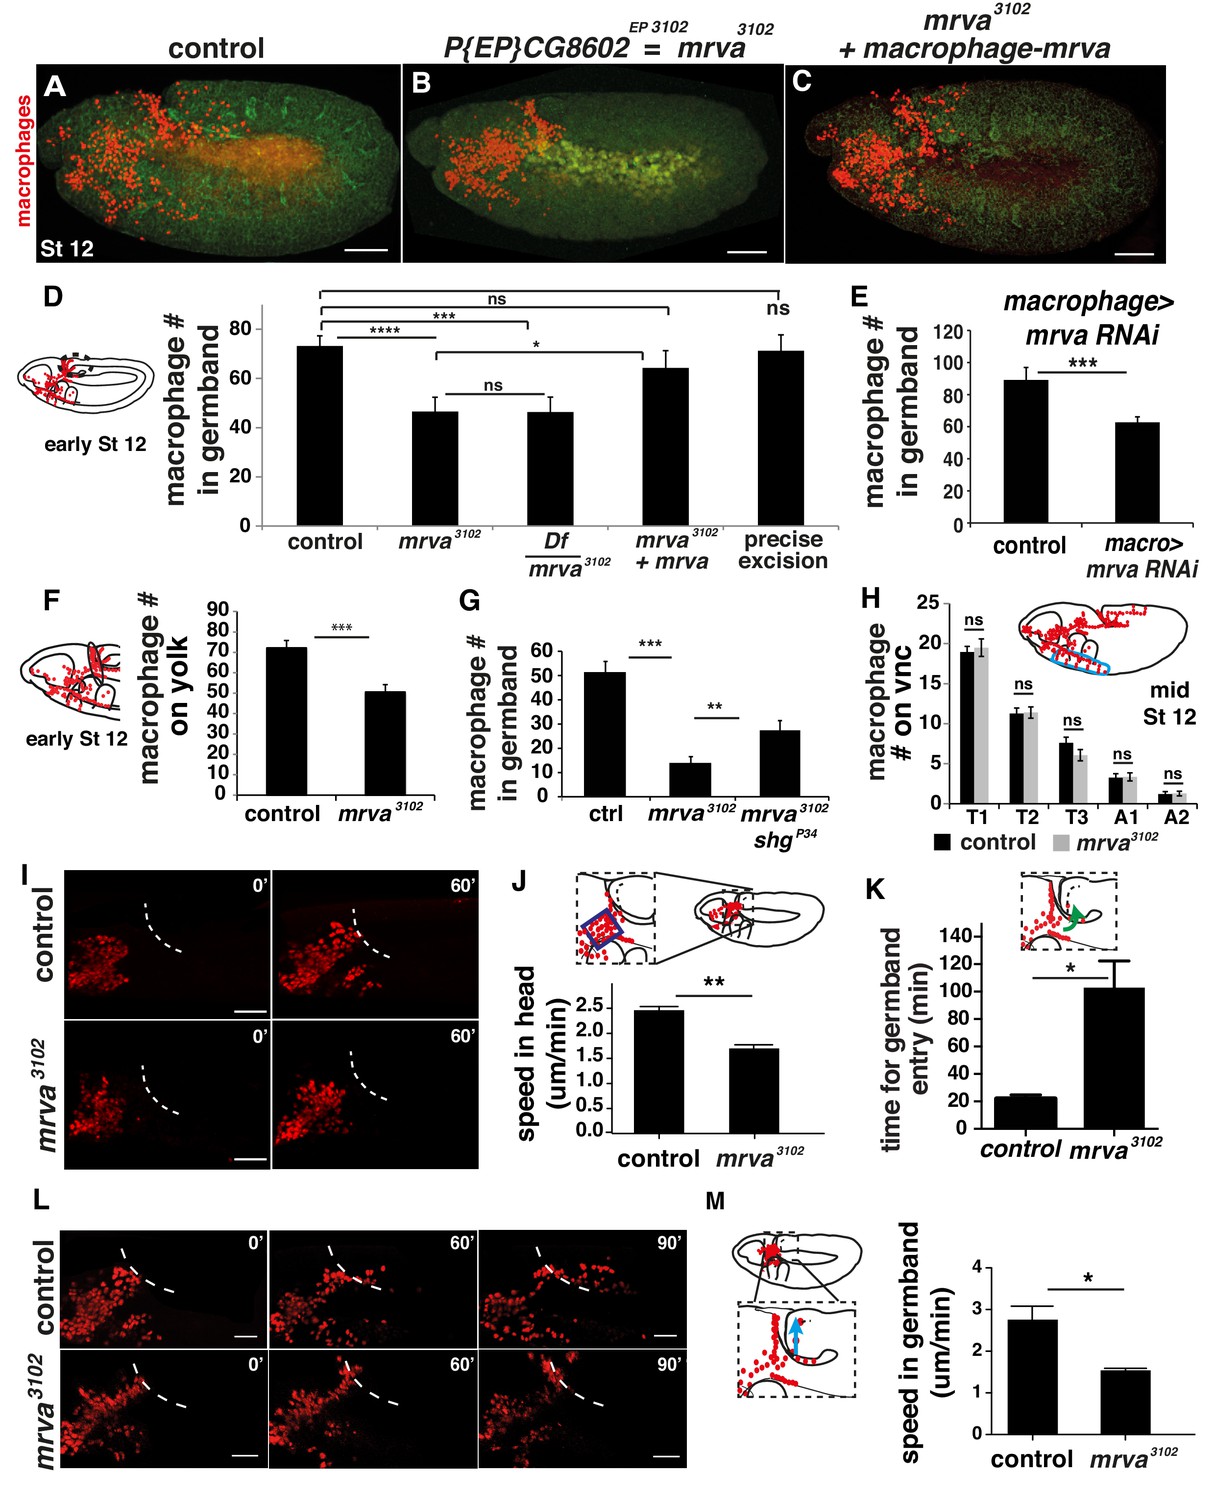
CG8602, which we name Minerva, is required in macrophages for their efficient invasion of the germband.
(A–C) Representative confocal images of early Stage 12 embryos from (A) control, (B) P{EP}CG8602EP3102 = minerva (mrva)3102 mutant, and (C) mrva3102 mutants with macrophage expression of the gene rescued by srpHemo(macro)-mrva. Macrophages express srpHemo-3XmCherry (red) and the embryo autofluoresces (green). In the mutant, macrophages remain in the head and fail to enter the germband, hence we name the gene minerva. (D) Dashed ellipse in schematic at left represents the germband region in which macrophages (red) were counted throughout the study. Comparison of the control (n= 38), mrva3102 mutants (n = 37) and mrva3102 mutant/Df(3L)BSC117 that removes the gene (n = 23) shows that the mutant significantly decreases migration into the extended germband (p<0.0001 for control vs mutant, p=-0002 for control vs Df cross). This defect can be partially rescued by expression in macrophages of srpHemo >mrva::FLAG::HA (n = 18, p=0.222 for control vs rescue, p=0.036 for mutant vs rescue) and completely rescued by precise excision (mrvaΔ32) of the P element (n = 16, p=0.826). srpHemo >mCherry nls labeled the macrophages. (E–G) Macrophage quantification in early Stage 12 embryos. (E) Fewer germband macrophages upon expression of mrva RNAi v101575 only in macrophages under the control of srpHemo (n = 28–35 embryos, p<0.0001). (F) Fewer macrophages found on the yolk neighboring the germband (oval in schematic) in the mrva3102 mutant compared to control embryos (n = 14–16 embryos, p=0.0003). (G) Increased germband macrophage numbers in shgP34; mrva3102 compared to the mrva3102 mutant indicates a partial rescue from reducing DE-Cadherin which is expressed in the germband ectoderm (n = 19–29, p<0.0001, p=0.005). (H) No significant difference in number of macrophages labeled with srpHemo-3xmCherry in vnc segments (area in blue oval in schematic) between control and mrva3102 mutant embryos in fixed mid Stage 12 embryos (n = 23–25, p=0.55). Images from two-photon movies of (I) Stage 10 and (L) late Stage 11-early Stage 12 embryos in which macrophage nuclei (red) are labeled with srpHemo-H2A::3xmCherry. (I) Stills at 0 and 60 min and (J) quantification of macrophage speed reveal 33% slower macrophage migration in the head towards the yolk neighboring the germband in the mrva3102 mutant compared to the control, n = 3 movies for each, #tracks: control = 329, mutant = 340, p=0.002. Blue box in magnification in schematic indicates region analysed in J. (K) The first macrophage in mrva3102 mutants is much slower to enter the germband after macrophages reach the germband edge (control = 22.00 ± 1.53 min, n = 3, mrva3102 mutant = 102.0 ± 20.35 min, n = 4. p-value=0.021). (L) The time when macrophages reached the germband in each genotype was defined as 0’. Stills at 60 and 90 min and (M) quantification of macrophage speed reveal 43% slower macrophage migration in the germband in the mrva3102 mutant compared to the control. Blue arrow in schematic indicates route analyzed. n = 3 movies for each, #tracks: control = 21, mutant = 14, p=0.022. Significance was assessed by Kruskal-Wallis test with Conover post test comparison in D, G, Student’s t-test in E, F, H, J-K, M. ns = p > 0.05, *p<0.05, **p<0.01, ***p<0.001, ***p<0.0001. Scale bars are 50 μm in A-C, 40 μm in I, 30 μm in L. See also Figure 3—figure supplement 1 and Figure 3—video 1–3.
-
Figure 3—source data 1
Source data on the quantification of macrophages in the germband shown in Figure 3D–E,G and Figure 3—figure supplement 1A, on the yolk (Figure 3F) on the vnc (Figure 3H, Figure 3—figure supplement 1C) and in the whole embryo (Figure 3—figure supplement 1D–E).
Source data on the xyz position of macrophages from the tracks that form the basis of the analysis shown in Figure 3J–K,M and Figure 3—figure supplement 1F,G. Source data on the mismigration of germ cells, the levels of mrva expression in the ovary, and the migration of border cells (Figure 3—figure supplement 1I,J and L, respectively). Source data on the xyz position of macrophages in the movies of the mrva3102 mutant and the control underlying the analysis shown in Figure 3J-K,M and Figure 3—figure supplement 1F-G.
- https://doi.org/10.7554/eLife.41801.011
Figure 3—figure supplement 1
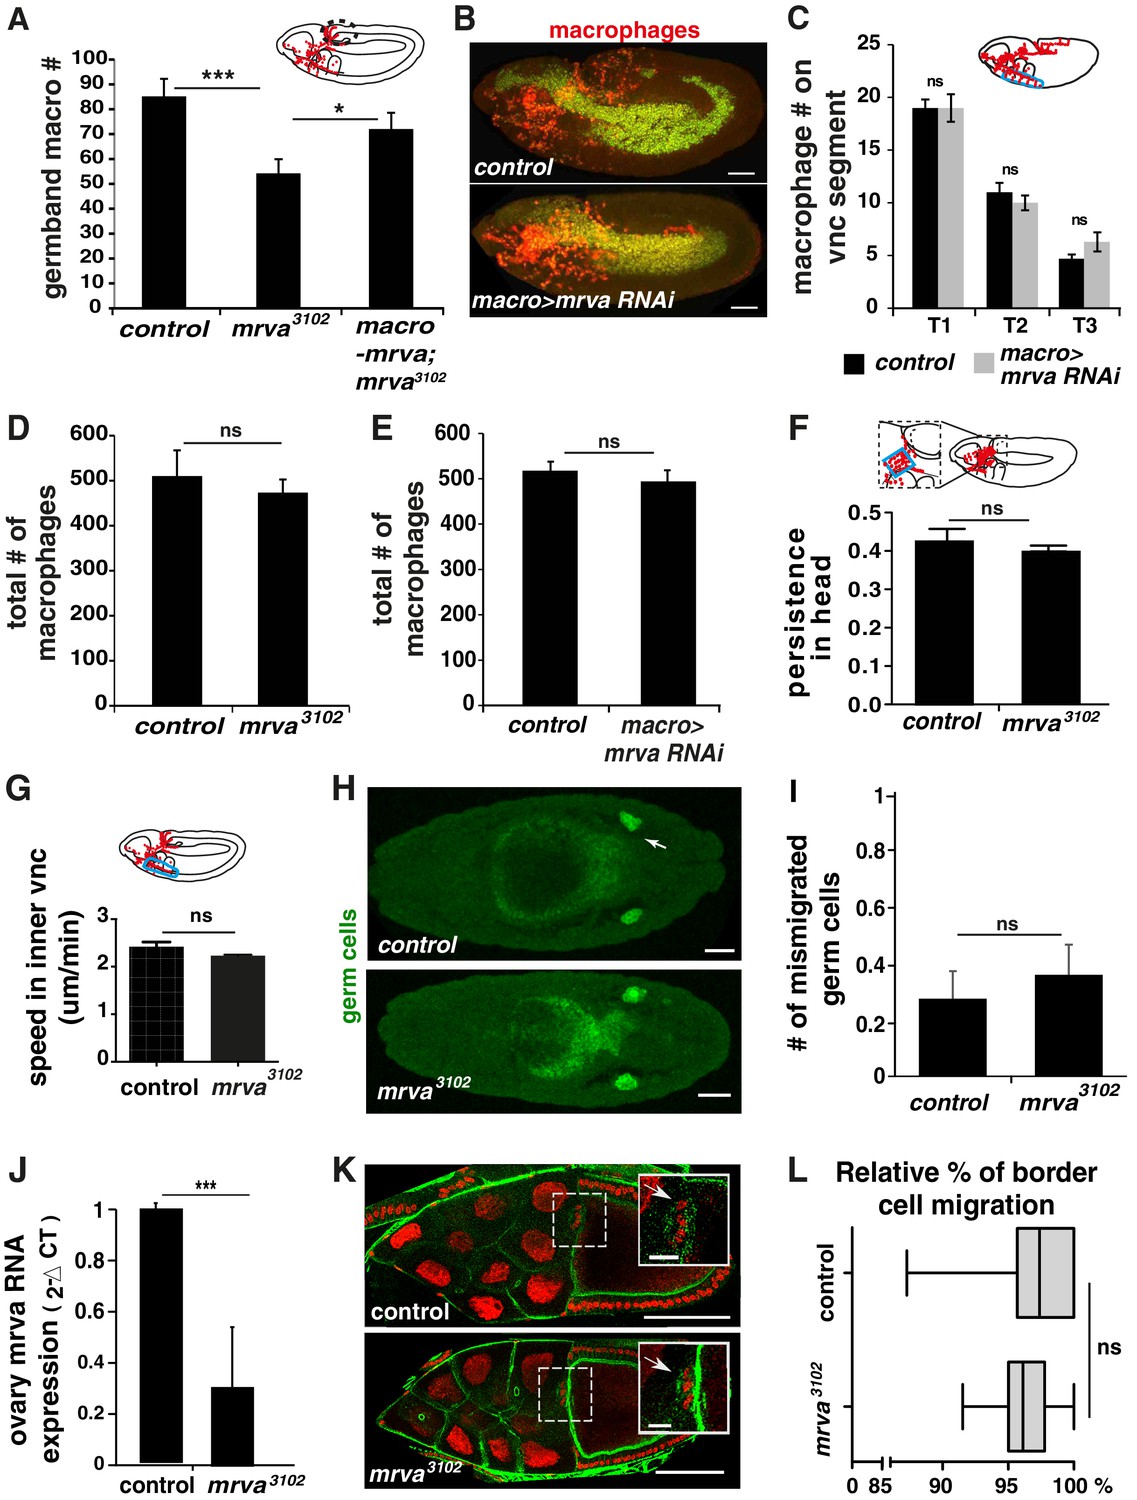
CG8602 (Minerva) affects macrophage migration into the germband but not along the vnc and does not alter border cell or germ cell migration.
(A) Quantification of the number of macrophages in the germband (dotted circle in schematic) in embryos from control, mrva23102, and mrva3102 srpHemo(macro)-mrva::HA showing Mrva is required in macrophages for germband invasion. Macrophages visualized by srpHemo-H2A::3xmCherry. (n = 25–28, p=0.001 for mutant vs control, 0.14 for control vs rescue, 0.05 for mutant vs rescue). (B) Representative confocal images of early Stage 12 embryos from control and srpHemo(macro)-Gal4 driving UAS-minerva RNAi (v101575) expression in macrophages labeled by H2A-RFP (green) and cytoplasmic GFP (red). (C) Quantification of the number of macrophages in vnc segments (area circled in blue in schematic) reveals no significant difference in macrophage migration along the vnc between control embryos and those expressing an RNAi against mrva (v101575) in macrophages under srpHemo(macro)-GAL4 control (n = 19–20, p=0.5). (D, E) Quantification of the total number of macrophages visualized with (D) srpHemo>mCherry::nls or (E) srpHemo>H2A::RFP GFP reveals no significant difference between (D) control and mrva3102 mutant embryos (n = 15, p>0.05) and (E) control and srpHemo(macro)>mrva RNAi embryos (n = 26, p=0.1439). (F) Quantification of persistence in the head from 2-photon movies with srpHemo-H2A::3xmCherry labeling macrophages shows no change in the mrva3102 compared to the control. n = 3. # tracks: control = 329, mutant = 340, p=0.2182. The area analyzed is indicated with the blue box in the schematic above. (G) Macrophage speed in the inner vnc in early Stage 12 embryos (see area circled in blue in schematic above) shows no significant change in the mrva3102 mutant compared to the control (n = 3 movies for each, #tracks: control = 180, mutant = 180, p=0.113). (H) Dorsal confocal images of representative Stage 14 control and mrva3102 embryos stained with Vasa antibody to visualize primordial germ cells (PGCs) (green). White arrow in control image indicates one of the two gonads. (I) Quantitation of the number of mismigrated PGCs per control and mrva3102 embryo revealed no significant difference (n = 22,28, p=0.57). (J) Quantification by qPCR of mrva RNA levels in ovaries from mrva3102 mutant adult females compared to the control (n = 3, p=0.0001). (K) Representative confocal images of border cells in stage 10 oocytes from control and mrva3102 adult females. DNA was labeled using DAPI (red) and actin was detected by phalloidin-A488 (green). Insets at upper right show enlargements of the dotted boxed area in the main images. Border cells are indicated with arrows. (L) Quantitation of border cell migration in stage 10 oocytes. Box plots show the relative percentages of migration measured for control (n = 37) and mrva3102 (n = 40) compared to complete migration to the edge of the oocyte. Whiskers in the box plot represent the distribution maximum and minimum. We observe no significant difference in the mutant (p=0.05). Significance was assessed by One-way Anova in A and Student’s t-test in C-G, I-J, L. ns = p > 0.05, *p<0.05, ***p<0.001. Scale bars are 50 μm in B,H, 20 μm in inset and 100 um in main image in J.
Figure 3—video 1
Representative movie of macrophage migration into the germband in the control.
Macrophages (red) are labeled with srpHemo-H2A::3xmCherry. The time interval between each acquisition is 40 s and the display rate is 15 frames/sec. Scale bar represents 30 μm.
Figure 3—video 2
Representative movie of macrophage migration into the germband in the mrva3102 mutant.
Macrophages (red) are labeled with srpHemo-H2A::3xmCherry. The time interval between each acquisition is 40 s and the display rate is 15 frames/sec. Scale bar represents 30 μm.
Figure 3—video 3
Representative movies of macrophage migration on the vnc in the control and mrva3102 mutant.
Macrophages (red) are labeled with srpHemo-H2A::3xmCherry. The time interval between each acquisition is 40 s and the display rate is 15 frames/sec. Scale bar represents 30 μm.
Figure 4 with 1 supplement
Glycoproteomic analysis reveals Minerva is required for higher levels of T-antigen on a subset of proteins.
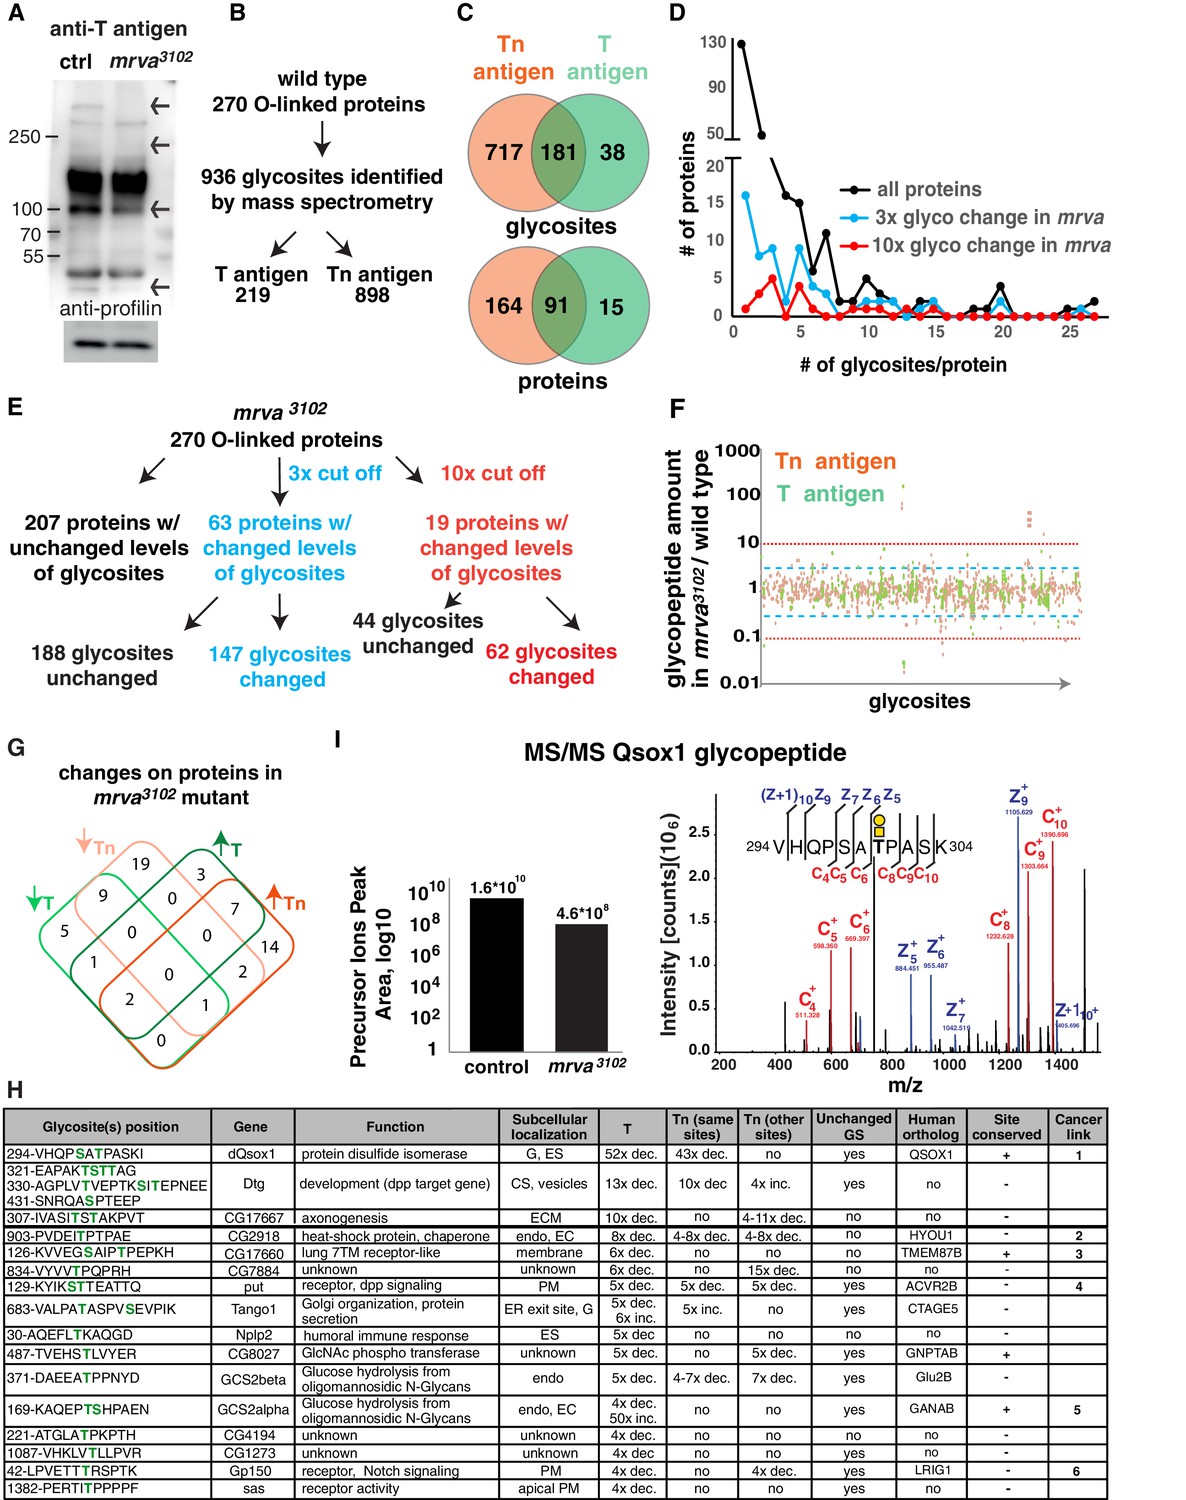
(A) Representative Western blot of protein extracts from Stage 11/12 control and mrva3102 mutant embryos probed with T antigen antibody. Arrows indicate decreased/missing bands in the mutant compared to the control. Profilin serves as a loading control (n = 10 biological replicates). (B) Summary of glycomics results on wild type embryos. (C) Venn diagram indicating number of glycosites or proteins found with T, Tn or T and Tn antigen modifications in the wild type. (D) Plot showing the number of T and Tn antigen glycosites per protein in the total glycoproteome and on proteins that show three (blue) and ten-fold (red) altered glycopeptides in the mrva3102 mutant. Proteins strongly affected by Minerva have a higher number of glycosites (p=0.005). (E) Summary of glycomics on mrva3102 embryos showing the numbers of proteins and glycosites exhibiting three (blue) or ten (red) fold changes in T and Tn antigen levels. (F) T antigen (in green) and Tn antigen (orange) occupied glycosites plotted against the ratio of the levels of glycopeptides found for each glycosite in the mrva3102 mutant/control. Higher positions on the plot indicate a lower level of glycosylation in the mutant. Blue dashed line represents the cut off for 3x changes in glycosylation, and the red dotted line the 10x one. (G) Venn diagram of the number of proteins with at least three fold change in the T antigen (T, green) or Tn antigen (Tn, orange) glycosylation in the mrva3102 mutant. Up arrows denote increase, down arrows indicate decrease in levels. (H) Proteins with at least a three fold decrease in T antigen levels in the mrva3102 mutant. Glycan modified amino acids are highlighted in bold green font. Unchanged/Higher GS column indicates if any other glycosite on the protein is unchanged or increased. Table does not show the two chitin and chorion related genes unlikely to function in macrophages. G: Golgi, ES: Extracellular space, Endo: Endosomes, ER: Endoplasmic reticulum, ECM: Extracellular Matrix, PM: Plasma Membrane, GS: Glycosite. Cancer links as follows. 1) QSOX1: Promotes cancer invasion in vitro, overexpression worse patient outcomes (Katchman et al., 2013; Katchman et al., 2011). 2) HYOU1: Overexpression associated with vascular invasion, worse patient outcomes (Stojadinovic et al., 2007) (Zhou et al., 2016). 3) TMEM87B: translocation breakpoint in cancer, (Hu et al., 2018). 4) ACVR2B: over expressed in renal cancer (Senanayake et al., 2012). 5) GANAB: inhibits cancer invasion in vitro (Chiu et al., 2011). 6) LRIG1: inhibits cancer invasion in vitro, and in mice (Sheu et al., 2014), (Mao et al., 2018). (I) Annotated ETD MS2 spectra of the VHQPSATPASK glycopeptide from Qsox1 with T antigen glycosylation at position T7. See schematic in which the yellow square represents GalNAc and the yellow circle Gal. Assigned fragment ions in MS2 spectra are highlighted by red for ‘c’ type fragments (those retaining the original N terminus) and blue for ‘z’ type fragments (those retaining the original C terminus). The graph at the left shows the relative quantification of the glycopeptide precursor ion’s peak area in the control and mrva3102 mutant plotted on a logarithmic scale. See also Figure 4—figure supplement 1, Figure 4-Dataset 1, Supplementary file 1–3.
Figure 4—figure supplement 1
Related to Supplementary file 1: Further information on the mass spectrometry results.
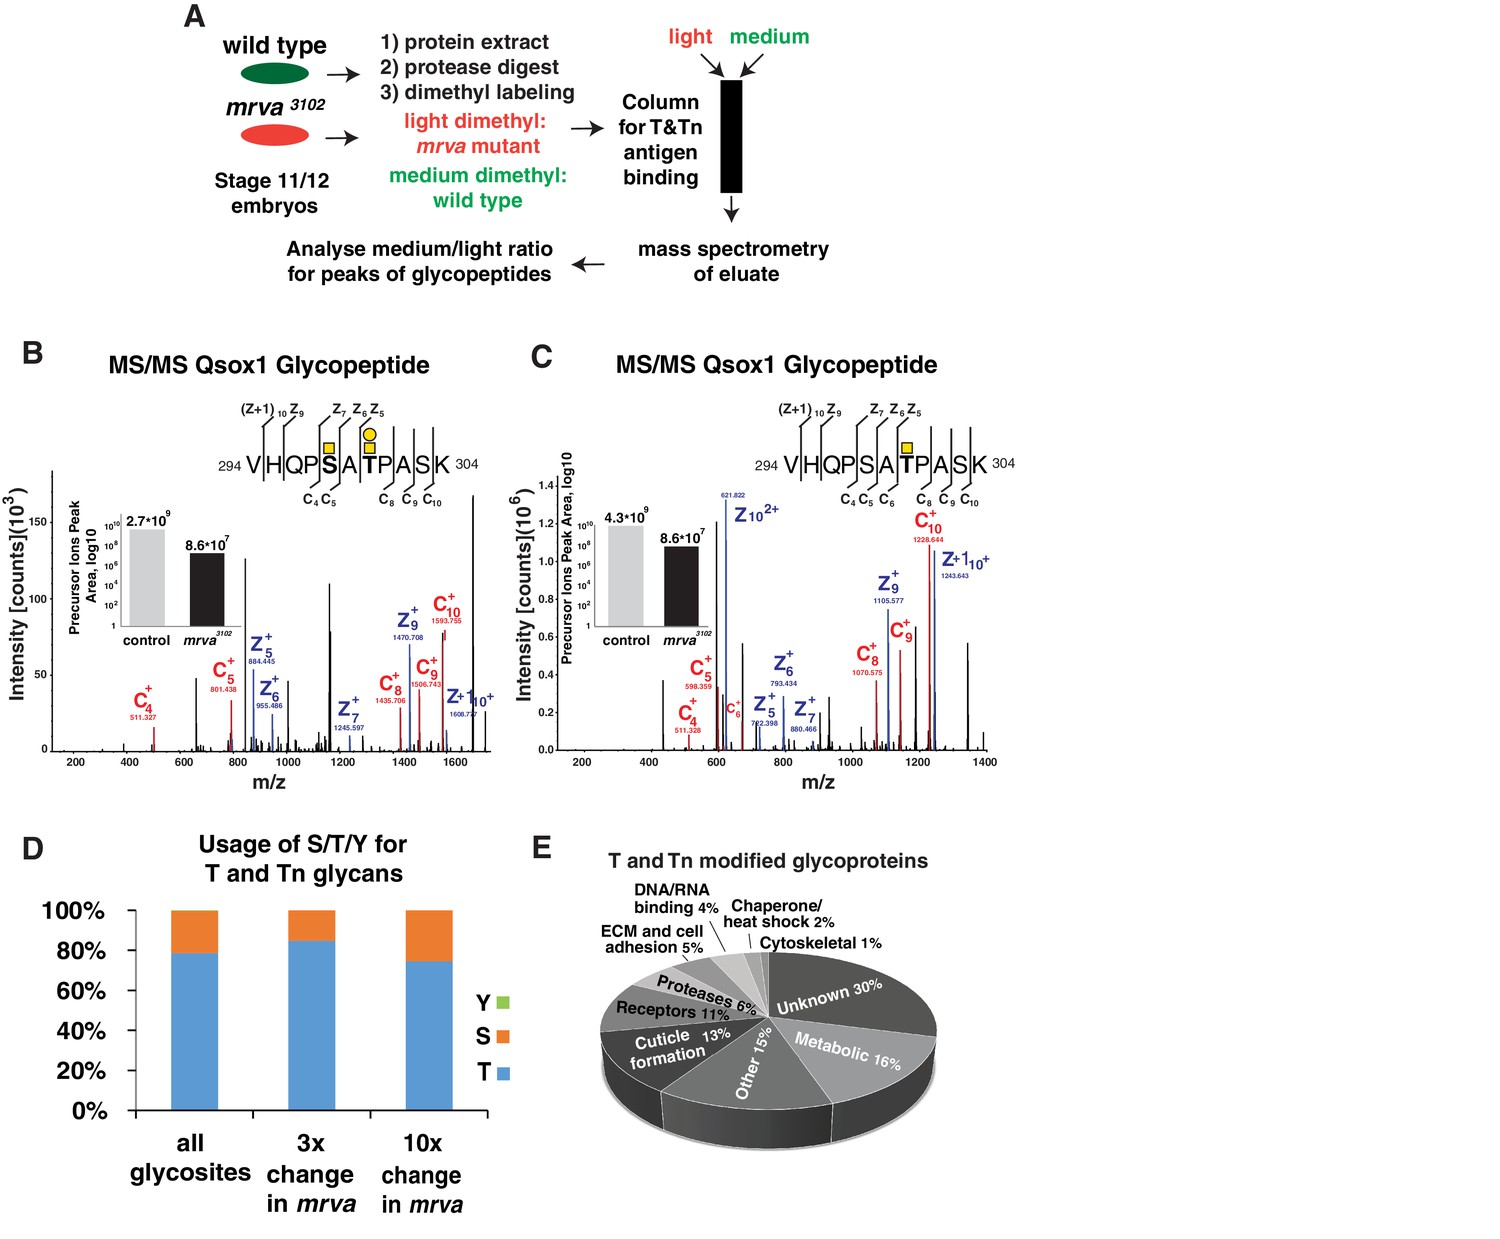
(A) Work flow for mass spectrometry analysis of T and Tn antigen modifications on proteins in Stage 11/12 control and mrva3102 mutant embryos. (B, C) Annotated ETD MS2 spectra of the VHQPSATPASK glycopeptides from Qsox1 in its different glycosylation forms in the control. Assigned fragment ions in MS2 spectra are highlighted by red for ‘c’ type fragments (those retaining the original N terminus) and blue for ‘z’ type fragments (those retaining the original C terminus). See schematics in upper right in which the yellow squares represent GalNAc and the yellow circles Gal. The insets show the relative quantification, based on the corresponding glycopeptide precursor ion’s peak area, in the control and mrva3102 mutant plotted on a logarithmic scale. (B) Glycopeptide with Tn antigen glycosylation at position S5 and T antigen glycosylation at the position T7. (C) Glycopeptide with Tn antigen glycosylation at position T7. (D) Similar usage of serine (S), threonine (T) and tyrosine (Y) for glycosylation in all modified proteins in the control and at glycosites that showed at least three fold and ten fold changes in the mrva3102 mutant. (E) Analysis of the fractional representation of various functions among all T and Tn antigen modified glycoproteins in Stage 11/12 Drosophila embryos.
Figure 5 with 2 supplements
Qsox1 is required for macrophage dissemination and entry into the germband tissue.
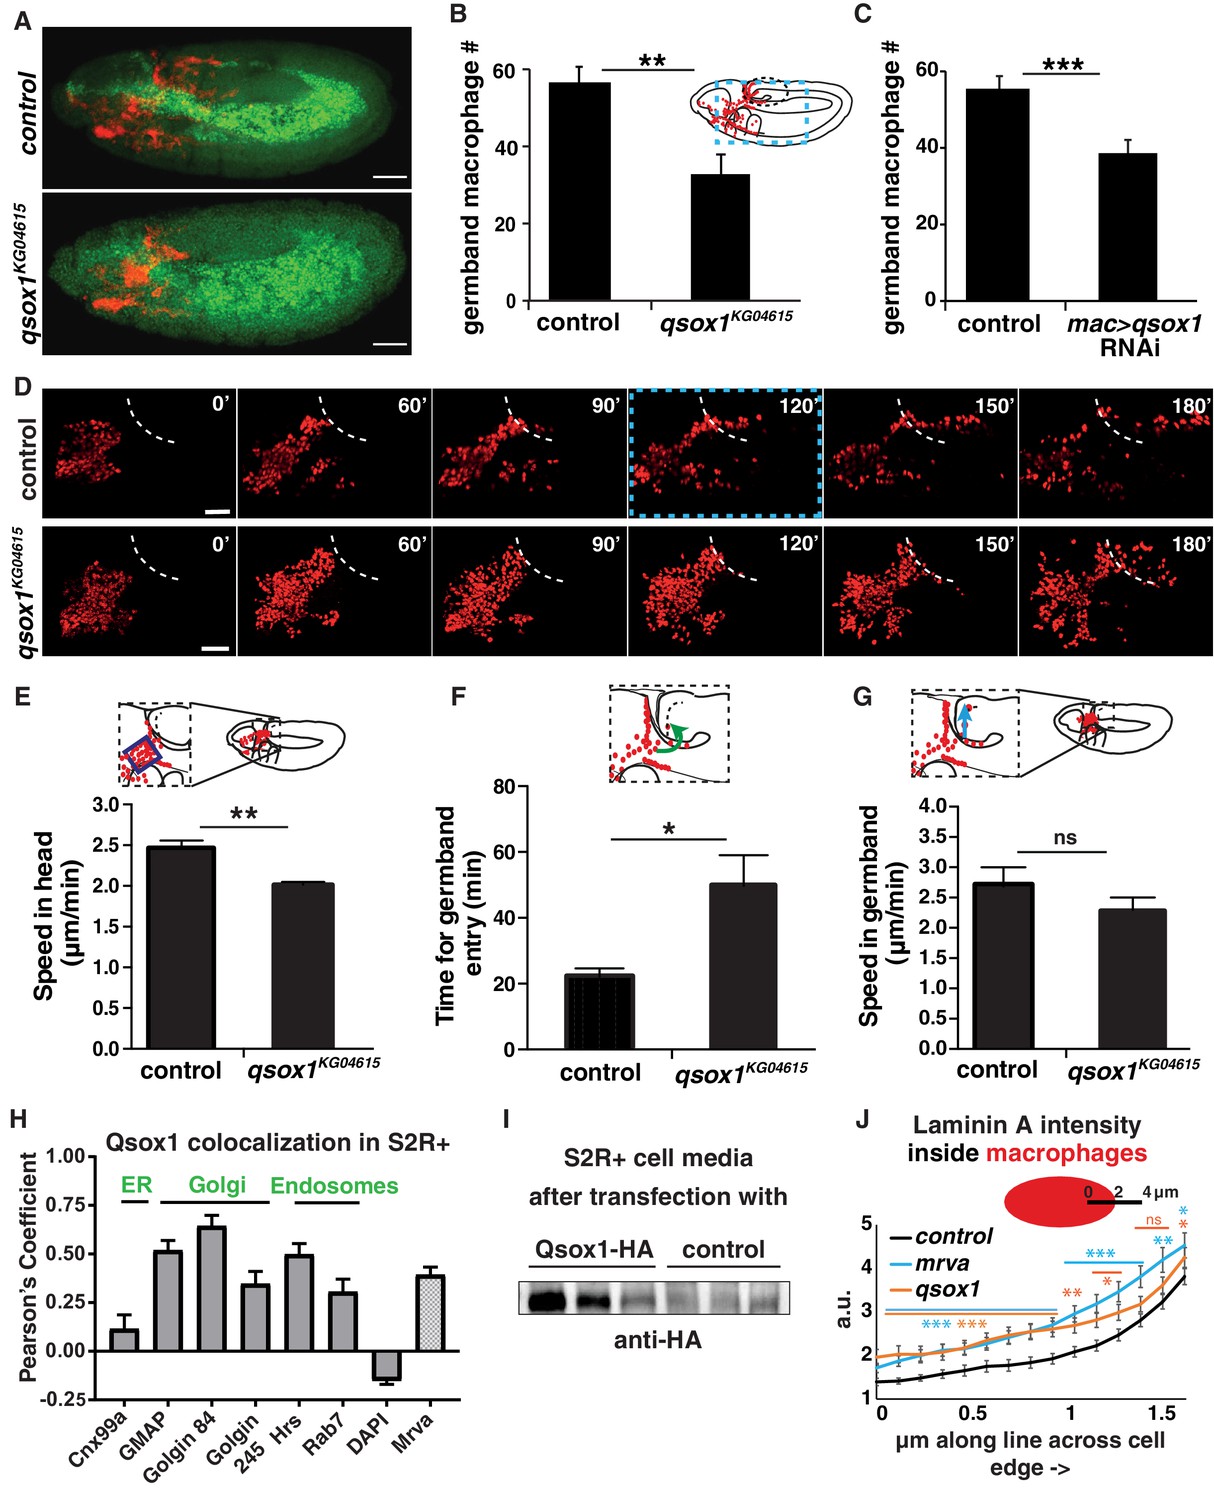
(A) Representative confocal images of early Stage 12 embryos from control and P{SUPor-P}Qsox1KG04615 = qsox1KG04615. (B–C) Quantification in early Stage 12 embryos showing a significant reduction in germband macrophages (B) in the P-element mutant qsox1KG04615 located in the Qsox1 5’UTR (n = 18, p=0.0012) and (C) upon the expression in macrophages under srpHemo-GAL4 control of an RNAi line (v108288) against Qsox1 (n = 24, 23 embryos, p=0.001). (D) Images from two-photon movies from control and qsox1KG04615. Macrophage nuclei (red) are labeled with srpHemo-H2A::3xmCherry. Stills at 0, 60, 90, 120, 150 and 180 min. (E) Quantification of macrophage speed reveals 18% slower macrophage migration in the head towards the yolk neighboring the germband in the qsox1KG04615 mutant compared to the control (n = 3 movies for each, #tracks: control = 329, mutant = 396, p=0.0056). (F) Quantification of the time required for macrophage entry into the germband in qsox1KG04615 compared to the control. n = 3 movies for each, p=0.043. (G) Quantification of macrophage speed in the germband in the qsox1KG04615 mutant compared to the control (n = 3 movies for each, #tracks: control = 21, mutant = 19, p=0.300). (H) Pearson’s Coefficient analysis indicating the level of colocalisation of a MT-Qsox1::FLAG::HA construct transfected into S2R+ cells visualized with an HA antibody and antibodies against markers for the ER (Cnx99a), the Golgi (Golgin 84, Golgin 245, and GMAP), the early endosome (Hrs), the late endosome (Rab7) and the nucleus (DAPI) (n = 11–15) as well as with a srpHemo-mrva::3xmCherry construct (n = 18). (I) Western blot of concentrated supernatant collected from S2R+ cells transfected with srpGal4 UAS-qsox1::FLAG::HA (first three lines) and S2R+ cells that are untransfected. (J) Quantification of intracellular LanA intensity along a 4 μm line in macrophages (as indicated in schematic) from the control (black), minerva3102 (blue) and the qsox1KG04615 mutants (orange) (n = 4–5 embryos, 80–100 cells, 240–300 lines). For the whole graph see Figure 5—figure supplement 1G–J. Scale bars 50 μm for A, 30 μm in D. B-C, E-G and J were analyzed with Student’s test. ns = p > 0.05, *p<0.05, **p<0.01, ***p<0.001. See also Figure 5—figure supplement 1.
-
Figure 5—source data 1
Source data on the quantification of macrophages in the germband shown in Figure 5B-C, on the yolk shown in Figure 5—figure supplement 1A,1D, on the vnc shown in Figure 5—figure supplement 1B,1E, and in the whole embryo shown in Figure 5—figure supplement 1C.
Source data on the xyz position of macrophages from the tracks that form the basis of the analysis shown in Figure 5E-G. Source data on the quantification of the Pearson's coefficient for Qsox1 colocalization with different markers shown in Figure 5H and the quantification of LanA intensity shown in Figure 5J and Figure 5—figure supplement 1L-N. Source data on the xyz position of macrophages in the movies of the qsox1KG04615 mutant underlying the analysis shown in Figure 5E-G and Figure 5—figure supplement 1F.
- https://doi.org/10.7554/eLife.41801.020
Figure 5—figure supplement 1
Qsox1 affects germband entry and Laminin A.
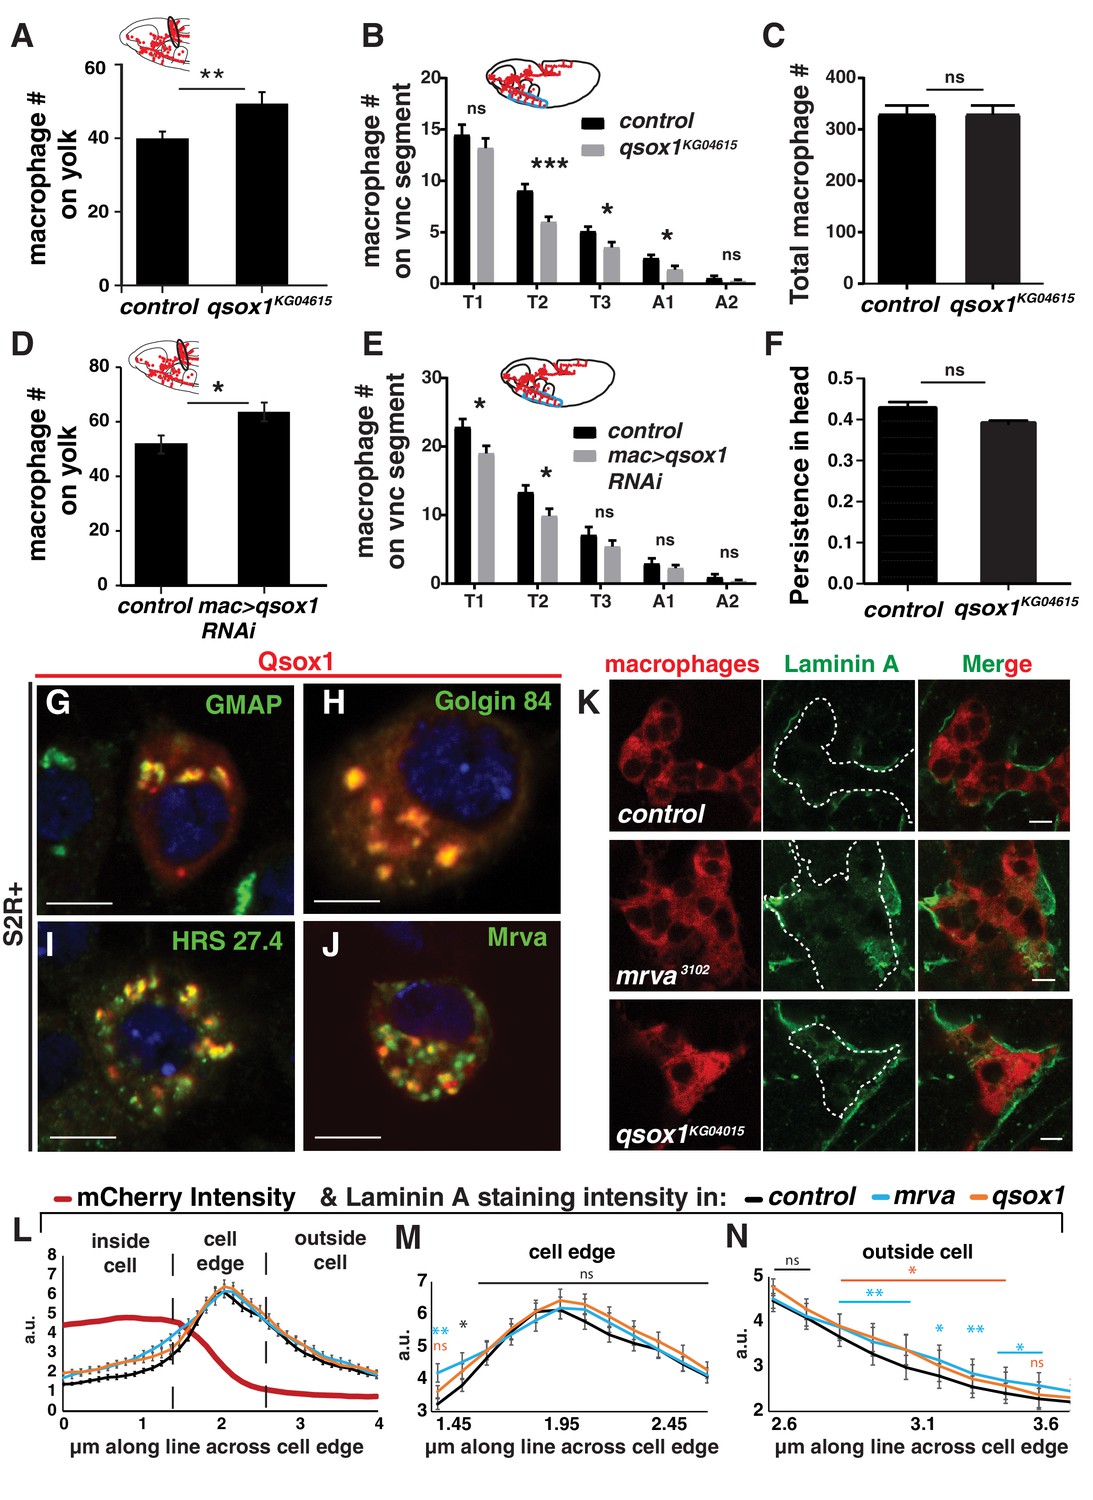
(A–B) Quantification of macrophages in fixed mid-Stage 12 embryos in control and qsox1KG04615 mutants reveals that in the mutant there are (A) increased numbers of macrophages on the yolk neighboring the germband (n = 18, p=0.002) and (B) reduced numbers on some vnc segments (n = 21; p value T1 = 0.357, T2 = 0.0006, T3 = 0.031, A1 = 0.034, A2 = 0.329). (C) Quantification of macrophages in the whole embryo in the qsox1 KG04615 mutant compared to the control (n = 12–14, p value=0.999) shows no change. (D–E) Quantification of macrophages in fixed mid-Stage 12 embryos from the control and upon knockdown in macrophages of Qsox1 with RNAi (v108288) driven by srpHemo-GAL4 reveals that in the mutant there are (D) increased numbers of macrophages on the yolk neighboring the germband (n = 23,24, p=0.02) and (E) reduced numbers on some vnc segments (n = 13–15; p value T1 = 0.024, T2 = 0.030, T3 = 0.258, A1 = 0.445, A2 = 0.233). (F) Analysis of the persistence of macrophages in the head in the qsox1KG04615 mutant compared to the control shows no significant difference (n = 3 movies for each, p=0.126). (G–J) Qsox1::FLAG::HA produced from an MT promoter visualized by HA-antibody staining (green) with (G–I) different parts of the endomembrane system as indicated visualized by antibody staining (green) and (J) Mrva::3xmCherry from the srpHemo promoter visualized by mCherry fluorescence. (K) Confocal images of LanA (green) staining in control, mrva3102 and qsox1KG04615 mutant embryos expressing cytoplasmic 3xmCherry (red) in macrophages from the srpHemo promoter. Dotted white lines in the LanA channel correspond to an outline traced from the mCherry channel. (L–N) Quantification of LanA and mCherry (red) intensity along a 4 μm line in macrophages from control (black line), mrva3102 (blue) and qsox1KG04615 mutant (orange) (n = 4–5 embryos, 80–100 cells, 240–300 lines). (M–N) Magnified view of LanA quantification from (M) the cell edge and (N) outside the cell. Scale bar is 5 μm in G-K. A-F and L-N were analyzed with Student’s t test. ns = p > 0.05, *p<0.05, **p<0.01, ***p<0.001.
Figure 5—video 1
Representative movie of macrophage migration into the germband in the qsox1KG04615 mutant.
Macrophages (red) are labeled with srpHemo-H2A::3xmCherry. The time interval between each acquisition is 40 s and the display rate is 15 frames/sec. Scale bar represents 30 μm.
Figure 6 with 1 supplement
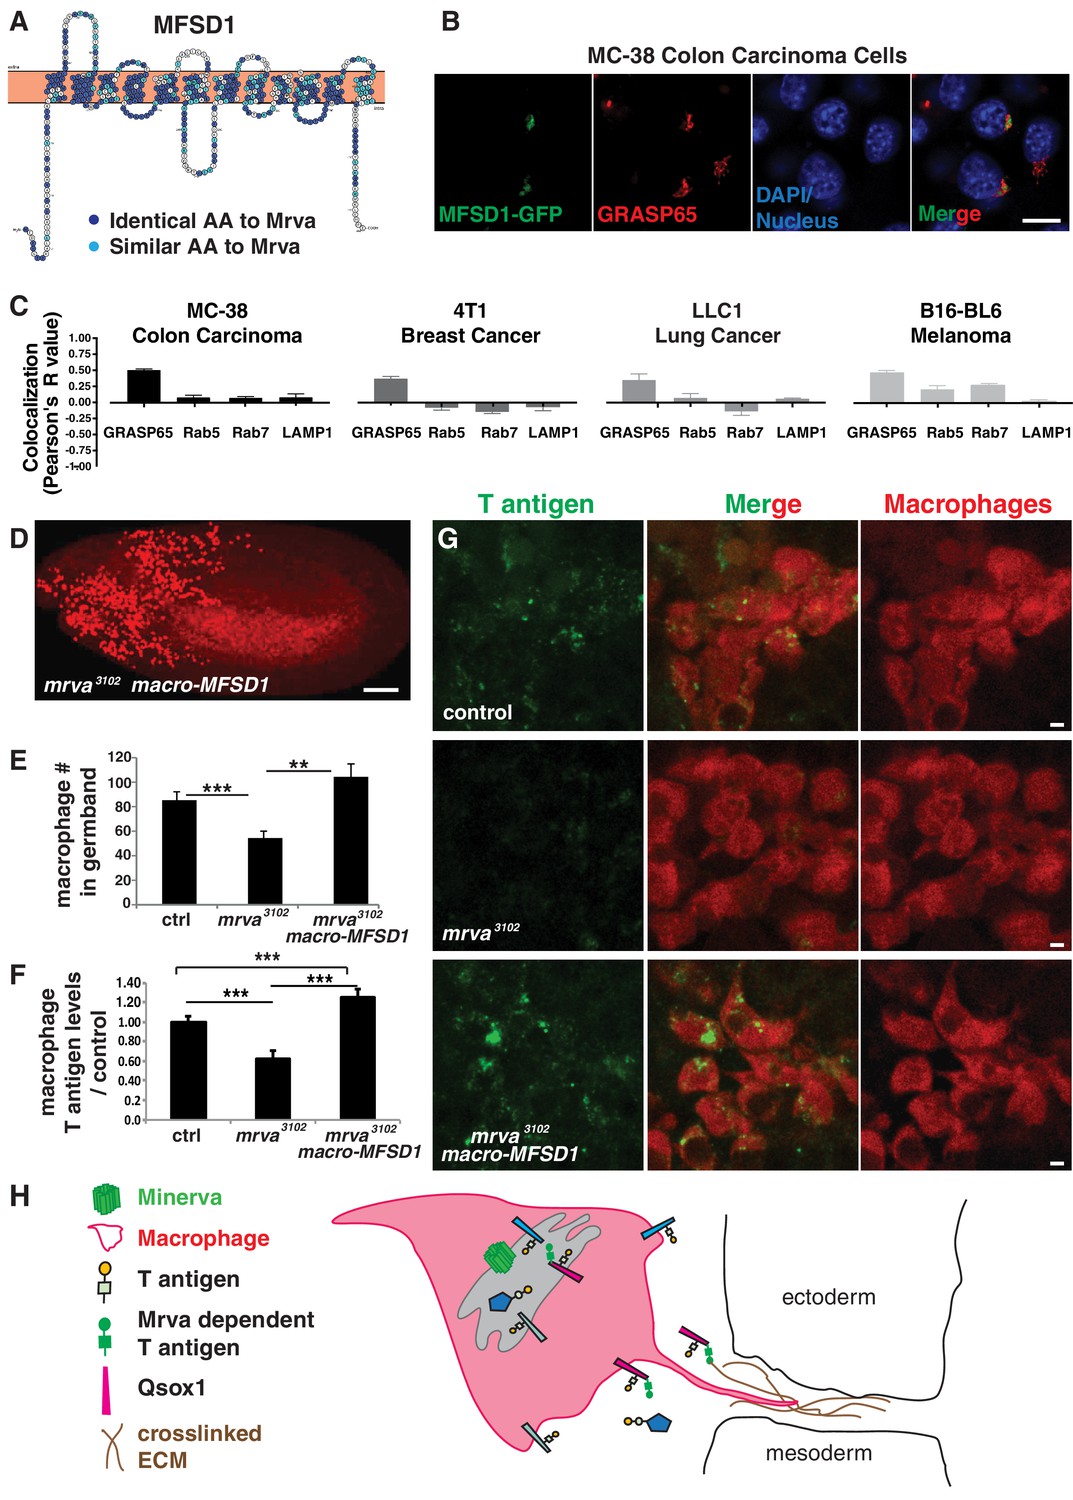
Minerva’s murine ortholog, MFSD1, can substitute for Minerva’s functions in migration and T-antigen glycosylation.
(A) Topology prediction of mouse MFSD1 (NP_080089.1) using the online tools TMPred (Hofman and Stoffel, 1993) and Protter (Omasits et al., 2014). 50% of amino acids are identical between the M. musculus MFSD1 and D. melanogaster sequence of mrva (CG8602) (NP_648103.1) and are highlighted in dark blue, similar amino acids are in light blue. (B) Confocal images of MC-38 colon carcinoma cells showing colocalization of MFSD1-eGFP (green) with the Golgi marker GRASP65 (red). DAPI labels the nucleus (blue). (C) Quantitation using Fiji of the colocalization of MFSD1-eGFP with the Golgi marker (GRASP65), early endosome marker (Rab5), late endosome marker (Rab7), and lysosome marker (LAMP1) in MC-38 colon carcinoma, B16-BL6 melanoma, LLC1 Lewis lung carcinoma, and 4T1 breast carcinoma cells. Representative images are shown in Figure 6—figure supplement 1C–F (n = 8–15, 5–9, 4–9, 5–10 cells per condition within the respective cancer types). (D) Confocal image of a Stage 12 fixed embryo showing that expression of mmMFSD1 in macrophages under the direct control of the srpHemo(macro) promoter in the mrva3102 mutant can rescue the defect in macrophage migration into the germband. Compare to Figure 3A,B. Macrophages visualized with srpHemo-H2A::3xmCherry for D-E. (E) Quantitation of the number of macrophages in the germband of early Stage 12 embryos from the control (n = 25), mrva3102 mutants (n = 29), and mrva3102 srpHemo(macro)-mmMFSD1 (n = 13, p=0.0005 for mutant vs control, p<0.0001 for mutant vs rescue). (F) Quantification of T antigen levels on macrophages in late Stage 11 embryos from control, mrva3102mutant and mrva3102 srpHemo(macro)-mmMFSD1 embryos. T antigen levels normalized to those observed in the control (n = 8–9 embryos, 280, 333, and 289 cells quantified respectively, p<0.0001 for both). (G) Confocal images of macrophages (red) on the germband border stained with T antigen antibody (green) in the control, the mrva3102 mutant, and mrva3102 srpHemo(macro)-mmMFSD1 shows that mmMFSD1 expression in macrophages can rescue the decrease of macrophage T antigen observed in the mrva3102 mutant. Macrophages visualized with srpHemo-3xmCherry for F-G. (H) Model for Minerva’s function during macrophage invasion based on our findings and the literature: Minerva in the Golgi (grey) leads to increases in T antigen levels on a subset of proteins that aid invasion, including Qsox1 which regulates protein folding through disulfide bond formation and isomerization. We propose that increased T antigen on Qsox1 facilitates its sulfhydryl oxidase activity that aids the formation of a robust crosslinked ECM which macrophages utilize during tissue entry. Significance was assessed by Kruskal-Wallis test with Conover post test analysis in E,F). ***p<0.001, ****p<0.0001. Scale bars are 10 μm in B, 50 μm in D, and 3 μm in G. See also Figure 6—figure supplement 1.
-
Figure 6—source data 1
Source data on the quantification of Pearson’s coefficient for MFSD1 colocalization with different markers (Figure 6C), the number of macrophages in the germband (Figure 6E) and the level of T antigen in macrophages (Figure 6F).
- https://doi.org/10.7554/eLife.41801.024
Figure 6—figure supplement 1
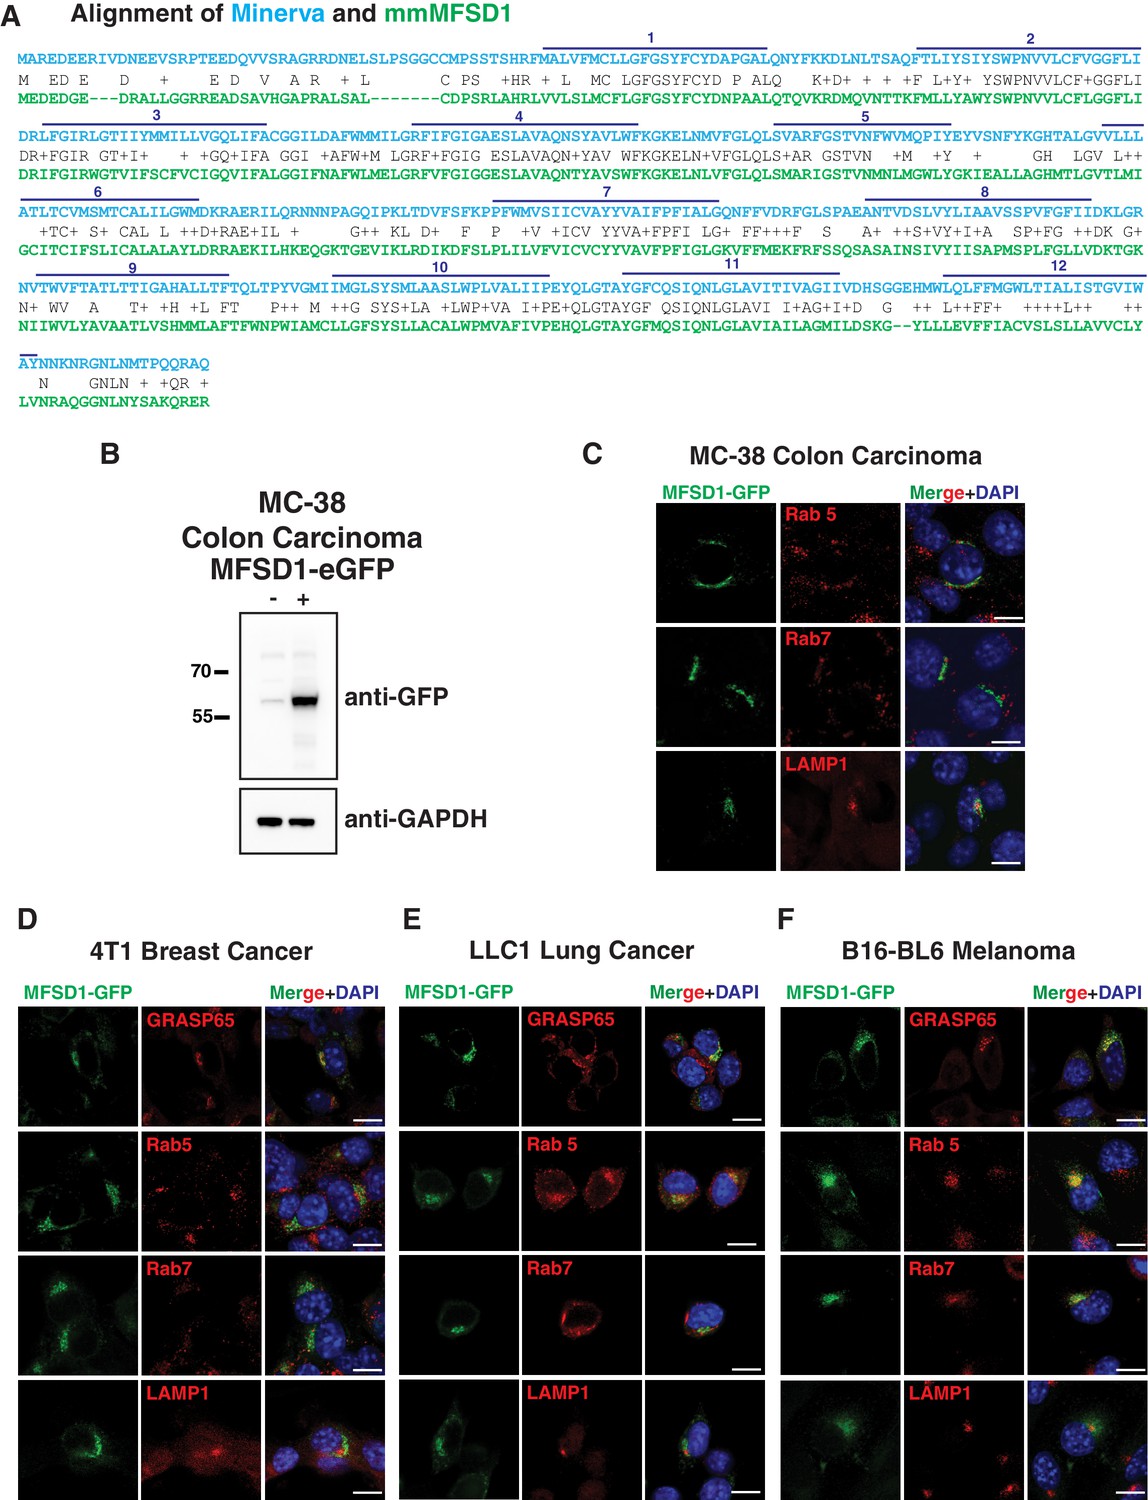
MFSD1-eGFP localization in colon, breast, lung and skin cancer cells.
(A) Alignment of Minerva and mmMFSD1 by BLAST. The first row shows the Minerva sequence in blue type, the second identical (one letter symbol) or similar (+) amino acids in black, and the third the mmMFSD1 sequence in green. Gaps are marked with ‘-‘. The predicted twelve transmembrane domains of Minerva are shown with dark blue lines and numbered above. (B) Western blot of control (-) and Doxycycline induced (+) MFSD1-eGFP expression in MC-38 colon carcinoma cells. MFSD1-eGFP was detected with an anti-GFP antibody. GAPDH serves as a loading control. (C–F) Representative images from co-immunofluorescence of mouse MFSD1-eGFP (green) and the Golgi marker GRASP65, early endosome marker Rab5 or late endosome marker Rab7 (red) in (C) MC-38 colon carcinoma, (D) 4T1 breast cancer, (E) LLC1 Lewis lung carcinoma, and (F) B16 BL6 cells. Nuclei are labeled with DAPI (blue). Scale bars indicate 10 μm in C-F.
Tables
Key resources table
| Designation | Source or reference | Identifiers | Additional information |
|---|---|---|---|
| mrva | NA | FlyBase:FBgn0035763 | |
| qsox1 | NA | FlyBase: FBgn0033814 | |
| C1GalTA | NA | FlyBase: FBgn0032078 | |
| srp-Gal4 | PMID: 15239955 | ||
| srp-3xmCherry | PMID: 29321168 | RRID:BDSC_78358 and 78359 | |
| srp-H2A::3xmCherry | PMID: 29321168 | RRID:BDSC_78360 and 78361 | |
| UAS-CG8602::FLAG::HA | PMID: 22036573 | ||
| mrva3102 | Bloomington Drosophila Stock Center (BDSC), RRID:SCR_006457 | RRID:BDSC_17262 | |
| Df(3L)BSC117 | BDSC, RRID:SCR_006457 | RRID:BDSC_8976 | |
| UAS-mCherry.NLS | BDSC, RRID:SCR_006457 | RRID:BDSC_38425 | |
| C1GalTA2.1 | BDSC, RRID:SCR_006457 | RRID:BDSC_28834 | |
| C1GalTA RNAi 1 | Vienna Drosophila Resource Centre (VDRC), RRID:SCR_013805 | VDRC: 2826 | |
| C1GalTA RNAi 2 | VDRC, RRID:SCR_013805 | VDRC: 110406 | |
| CG8602 RNAi | VDRC, RRID:SCR_013805 | VDRC: 101575 | |
| qsox1RNAi | VDRC, RRID:SCR_013805 | VDRC: 108288 | |
| qsox1 KG04615 | BDSC, RRID:SCR_006457 | RRID:BDSC_13824 | |
| MC-38 | Other | Gift from Borsig lab, Univ of Zurich (UZH) | |
| 4T1 | Other | ATCC Cat# CRL-2539, RRID:CVCL_0125 | Gift from Borsig lab, UZH |
| LLC1 | Other | ATCC Cat# CRL-1642, RRID:CVCL_4358 | Gift from Borsig lab, UZH |
| B16-BL6 | Other | NCI-DTP Cat# B16BL-6, RRID:CVCL_0157 | Gift from Borsig lab, UZH |
| S2R+ | Other | Gift from Frederico Mauri of the Knoblich lab at IMBA, Vienna | |
| srpHemo-CG8602::3xmCherry | this paper | CG8602 amplified from genome cloned into DSPL172 (PMID: 29321168) | |
| MT-CG8602::FLAG::HA | Drosophila Genomic Resource Center (DGRC), RRID:SCR_002845 | DGRC: FMO06045 | |
| MT-Qsox1::FLAG::HA | DGRC, RRID:SCR_002845 | DGRC: FMO06379 | |
| PTS1-GFP | Other | Gift from Dr. McNew | |
| MFSD1-eGFP | this paper | MFSD1 amplified from dendritic cell cDNA library, inserted into Doxycycline inducible expression vector pInducer20 | |
| Anti-GFP clone 2B6 | Other | Gift from Ogris lab, MFPL Vienna; (1:100) for WB | |
| Anti-GFP clone 5G4 | Other | Gift from Ogris lab, MFPL Vienna; (1:50) for immunochemistry | |
| Anti-T-antigen (mouse monoclonal) | PMID: 23584533 | (1:5 for immunochemistry; 1:10 for WB) | |
| Anti-profilin (mouse monoclonal) | Developmental Studies Hybridoma Bank (DSHB), RRID:SCR_013527 | DSHB Cat# chi 1J, RRID:AB_528439 | (1:50) |
| Anti-GAPDH (rabbit monoclonal) | Abcam, RRID:SCR_012931 | Abcam Cat# ab181603, RRID:AB_2687666 | (1:10000) for WB |
| Anti-GRASP65 (rabbit polyclonal) | Thermo Fisher Scientific, RRID:SCR_008452 | ThermoFischer Cat# PA3-910, RRID:AB_2113207 | (1:200) for immunochemistry |
| Anti-Rab5 (rabbit monoclonal) | Cell Signaling Technology (CST), RRID:SCR_004431, Clone C8B1 | CST Cat# 3547, RRID:AB_2300649 | (1:200) for immunochemistry |
| Anti-Rab7 (rabbit monoclonal) | CST, RRID:SCR_004431, Clone D95F2 | CST Cat# 9367, RRID:AB_1904103 | (1:200) for immunochemistry |
| Anti-LAMP1 (rabbit polyclonal) | Abcam, RRID:SCR_012931 | Abcam Cat# ab24170, RRID:AB_775978 | (1:200) for immunochemistry |
| Anti- Cnx99a (mouse monoclonal) | DSHB, RRID:SCR_013527 | DSHB Cat# Cnx99A 6-2-1, RRID:AB_2722011 | (1:5) |
| Anti- Hrs 27.4 (mouse monoclonal) | DSHB, RRID:SCR_013527 | DSHB Cat# Hrs 27–4, RRID:AB_2618261 | (1:5) |
| Anti- Golgin 84 (mouse monoclonal) | DSHB, RRID:SCR_013527 | DSHB Cat# Golgin8412–1, RRID:AB_2722113 | (1:5) |
| Anti Rab7 (mouse monoclonal) | DSHB, RRID:SCR_013527 | DSHB Cat# Rab7, RRID:AB_2722471 | (1:5) |
| Anti-GMAP (goat polyclonal) | DSHB, RRID:SCR_013527 | DSHB Cat# GMAP, RRID:AB_2618259 | (1:50) |
| Anti- Golgin 245 (goat polyclonal) | DSHB, RRID:SCR_013527 | DSHB Cat# Golgin245, RRID:AB_2618260 | (1:50) |
| Anti- HA (rat monoclonal) | Roche, RRID:SCR_001326 | Roche Cat# 3F10, RRID:AB_2314622 | (1:50) |
| Anti-LanA (rabbit polyclonal) | PMID:9257722 | gift from Stefan Baumgartner (1:500) | |
| Anti-Vasa (rat monoclonal) | DSHB, RRID:SCR_013527 | DSHB Cat# anti-vasa, RRID:AB_760351 | (1:25) |
| Alexa 488- or 557- or 633- secondaries | Thermo Fisher Scientific, RRID:SCR_008452 | (1:500 for 488 and 557; 1:100 for 633) | |
| Goat-anti-rabbit IgG (H + L)-HRP | BioRad | Bio-Rad Cat# 170–6515, RRID:AB_2617112 | (1:10000) |
| Goat-anti-mouse IgG (H/L):HRP | BioRad | Bio-Rad Cat# 170–6516, RRID:AB_11125547 | (1:10000) |
| LysoTracker Green DND-26 | Invitrogen, RRID:SCR_008410 | L7526 | 75 nM |
| Alexa Fluor 488 Phalloidin | Invitrogen, RRID:SCR_008410 | A12379 | (1:500) |
| Vectashield mounting medium | Vector Laboratories, RRID:SCR_000821 | VectorLabs: H-1000 | |
| Vectashield mounting medium with DAPI | Vector Laboratories, RRID:SCR_000821 | VectorLabs: H-1200 | |
| Halocarbon Oil 27 | Sigma-Aldrich, RRID:SCR_008988 | Sigma Aldrich: Cat# H8773 | |
| srpHemo-mrva | this paper | CG8602 amplified from genome cloned into srpHemo plasmid | |
| srpHemo-MFSD1 | this paper | mmMFSD1 amplified from dendritic cell cDNA library cloned into srpHemo plasmid | |
| Mrva fw | Fly Primer Bank | qPCR; 5'TGTGCTTCGTGGGAGGTTTC | |
| Mrva rv | Fly Primer Bank | qPCR; 5'GCAGGCAAAGATCAACTGACC | |
| C1GalTA fw | Fly Primer Bank | qPCR; 5'TGCCAACAGTCTGCTAGGAAG | |
| C1GalTA rv | Fly Primer Bank | qPCR: 5'CTGTGATGTGCATCGTTCACG | |
| Ugalt fw | Fly Primer Bank | qPCR; 5'GCAAGGATGCCCAGAAGTTTG | |
| Ugalt rv | Fly Primer Bank | qPCR; 5'GATATAGACCAGCGAGGGGAC | |
| RpL32 fw | Fly Primer Bank | qPCR; 5'AGCATACAGGCCCAAGATCG | |
| RpL32 rv | Fly Primer Bank | qPCR; 5'TGTTGTCGATACCCTTGGGC | |
| Lectin staining kit #2 | EY Laboratories | EYLabs:FLK-002 | |
| FIJI | http://fiji.sc/ RRID:SCR_002285) | ||
| Imaris | http://www.bitplane.com/imaris/imaris, RRID:SCR_007370 | ||
| Matlab | https://www.mathworks.com/products/matlab.html, RRID:SCR_001622 | ||
| FlowJo | https://www.flowjo.com/RRID:SCR_008520 | ||
| LaVision ImSpector | http://www.lavisionbiotec.com/, RRID:SCR_015249 | ||
| Proteome Discoverer 1.4 | https://www.thermofisher.com/order/ catalog/product/OPTON-30795, RRID:SCR_014477 | ||
| LightCycler 480 software | https://lifescience.roche.com/en_at/products/lightcycler14301-480 -software-version-15.html | ||
| GraphPad Prism | https://www.graphpad.com/scientific-software/prism/ RRID:SCR_002798 |
Additional files
-
Supplementary file 1
Mass spectrometric analysis of the T and Tn antigen containing O-glycoproteome from wild type and mrva3102 mutant Stage 11–12 Drosophila melanogaster embryos.
Each row lists an individually identified tryptically processed peptide. The 2nd–4th columns describe the analyzed peptide. The 5th, 6th, 7th and 12th are the names and accessions to Uniprot. The 8th indicates the position of the modified amino acid. The 9th indicates the number and 10th the type of glycosylation. The 11th lists the exact position and the 13th the exact description of glycosylation. The 14th is the ratio of the amount of the particular glycopeptide in the control samples (medium) over the amount in the mrva3102 (light). The 15th is the number of missed cleavages after the tryptic digest. The 16th is the measured intensity. The 17th column shows the mass to charge ratio.
- https://doi.org/10.7554/eLife.41801.025
-
Supplementary file 2
All candidate proteins from the O-glycoproteome with at least 3-fold changes in T and Tn antigen in the mrva3102 mutant.
Columns list the gene name, the predicted or known function of the gene, if other T or Tn glycosites on the protein are unchanged or changed in the opposite direction, any known human ortholog (identified by BLAST), references for links to cancer and cancer invasion for the mammalian orthologs, the precise site altered, the T and Tn antigen changes observed at a particular glycosylation site, the number of glycosites on the peptide, the peptide sequence and if the glycosylation site is conserved. The site is considered conserved if the human ortholog has a serine or threonine ±5 amino acids from the Drosophila glycosite. References: 1 (Göhrig et al., 2014); 2. (Fan et al., 2018); 3. (Webb et al., 1999); 4. (C.-C. Chiu et al., 2011); 5. (Huang et al., 2016); 6. (Matos et al., 2015); 7. (Cawthorn et al., 2012); 8. (Cao et al., 2015) 9. (Walls et al., 2017); 10.(Zhou et al., 2017); 11. (Linton et al., 2008); 12. (Bian et al., 2016) 13. (Zhang et al., 2016); 14. (Gonias et al., 2017); 15. (Katchman et al., 2013; Katchman et al., 2011); 16. (Stojadinovic et al., 2007); 17. (Zhou et al., 2016); 18. (Hu et al., 2018); 19. (Li et al., 2008); 20. (Senanayake et al., 2012); 21. (Sheu et al., 2014); 22. (Mao et al., 2018); 23.(Yokdang et al., 2016).
- https://doi.org/10.7554/eLife.41801.026
-
Supplementary file 3
T or Tn antigen modified receptors from the wild-type St 11–12 Drosophila melanogaster embryo O-glycoproteome.
Columns list the gene name for the receptor, its reported function, what kind of glycosylation we identified to be present on the receptors in the wild type sample, and what kind of glycosylation change we observed in the mrva3102 mutant.
- https://doi.org/10.7554/eLife.41801.027
-
Transparent reporting form
- https://doi.org/10.7554/eLife.41801.028
Download links
A two-part list of links to download the article, or parts of the article, in various formats.
Downloads (link to download the article as PDF)
Open citations (links to open the citations from this article in various online reference manager services)
Cite this article (links to download the citations from this article in formats compatible with various reference manager tools)
A conserved major facilitator superfamily member orchestrates a subset of O-glycosylation to aid macrophage tissue invasion
eLife 8:e41801.
https://doi.org/10.7554/eLife.41801


