OSCA/TMEM63 are an evolutionarily conserved family of mechanically activated ion channels
- The Scripps Research Institute, United States
- The Scripps Research Institute, Howard Hughes Medical Institute, United States
Figures
Figure 1 with 3 supplements
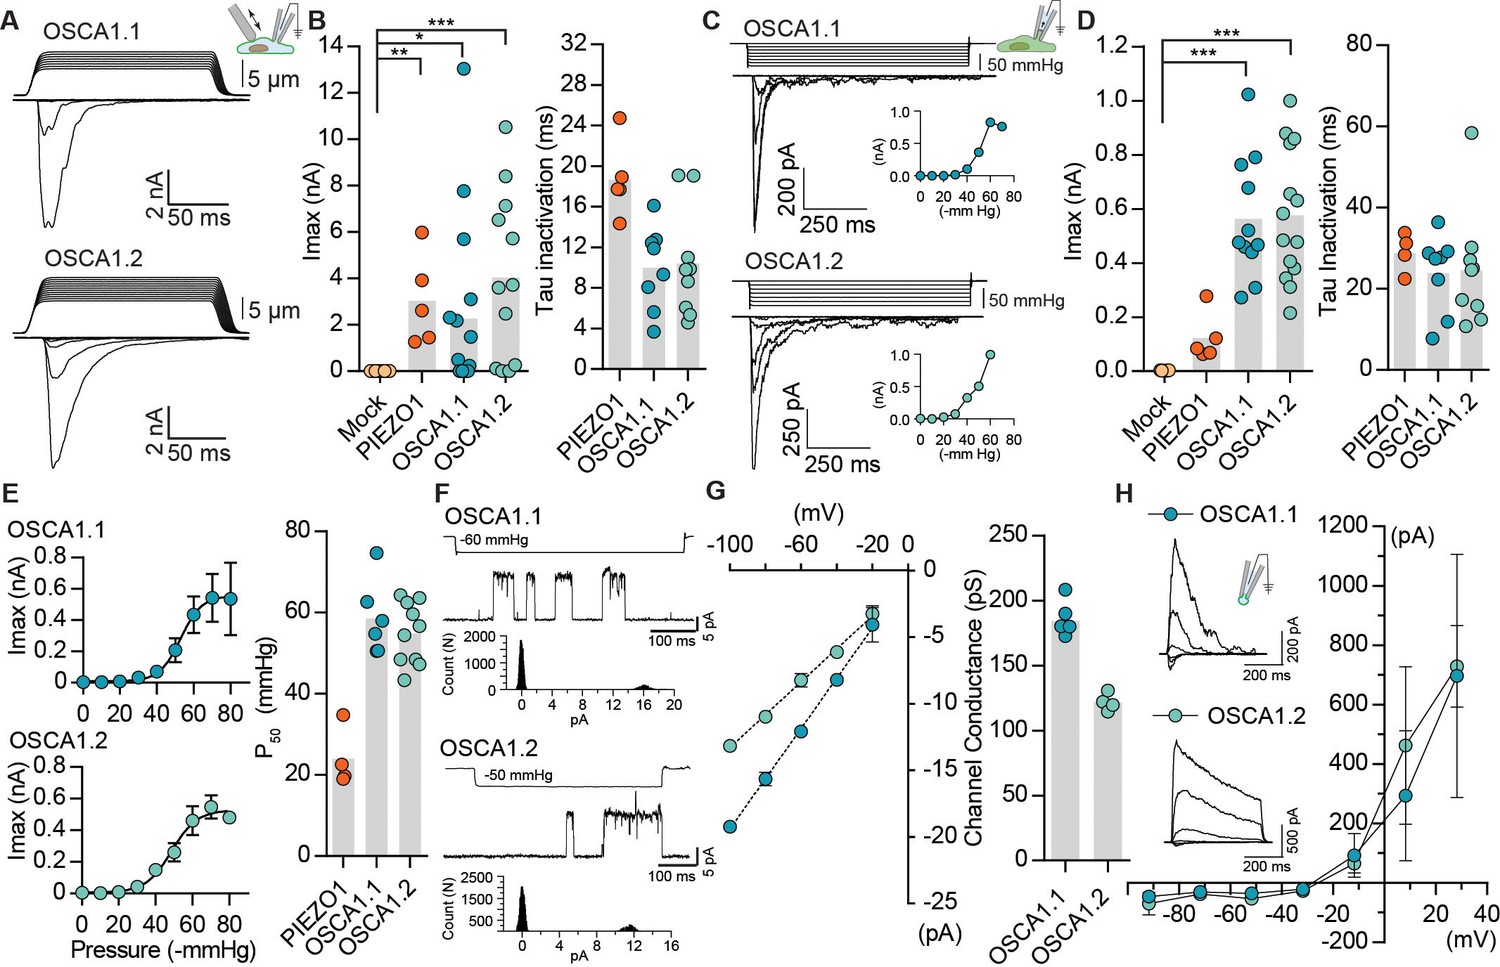
OSCA1.1 and 1.2 induce MA currents in HEK-P1KO cells.
(A) Representative traces of MA whole-cell currents (−80 mV) from OSCA1.1- and OSCA1.2-expressing cells. The corresponding probe displacement trace is illustrated above the current trace. (B) Left, indentation-induced maximal currents recorded, before the patch is lost, from HEK-P1KO cells expressing mock plasmid (N = 10), MmPIEZO1 (N = 5), OSCA1.1 (N = 16, nine gave responses), or OSCA1.2 (N = 12, 10 gave responses). Right, inactivation time constant (ms) for individual cells across MmPIEZO1 (N = 5), OSCA1.1 (N = 8), and OSCA1.2 (N = 9) (*p=0.013, **p=0.005, ***p<0.0001, Dunn’s multiple comparison test). (C) Representative traces of stretch-activated macroscopic currents (−80 mV) from OSCA1.1- and OSCA1.2-expressing cells. The corresponding pressure stimulus trace is illustrated above the current trace. Inset represents pressure-response curve for the representative cell. (D) Left, maximal currents recorded from HEK-P1KO cells expressing mock plasmid (N = 7), MmPIEZO1 (N = 5), OSCA1.1 (N = 11), or OSCA1.2 (N = 14). Right, inactivation time constant (ms) for individual cells across MmPIEZO1 (N = 5), OSCA1.1 (N = 8), and OSCA1.2 (N = 9) (OSCA1.1: ***p=0.0005, OSCA1.2: ***p=0.0001, Dunn’s multiple comparison test). (E) Average pressure-response curves (fit with a Boltzman equation) for stretch-activated currents from MmPIEZO1- (N = 4), OSCA1.1- (N = 6), or OSCA1.2- (N = 10) expressing cells. Bar graph on the right represents P50 values for individual cells across the two genes. (F) Representative single-channel currents (−80 mV) recorded in response to negative pipette pressure as indicated. Amplitude histogram for the trace is illustrated below. Channel openings are upward deflections. (G) Left, average I-V relationship of stretch-activated single-channels from OSCA1.1- and OSCA1.2-transfected cells. Right, mean channel conductance for individual cells across OSCA1.1 (N = 5) and OSCA1.2 (N = 4). (H) Average I-V of stretch-activated currents recorded from outside-out patches excised from cells expressing OSCA1.1 (Erev:−24.5 ± 3.3, N = 4) or OSCA1.2 (Erev:−25.7 ± 0.7, N = 5). Inset: representative current traces.
Figure 1—figure supplement 1
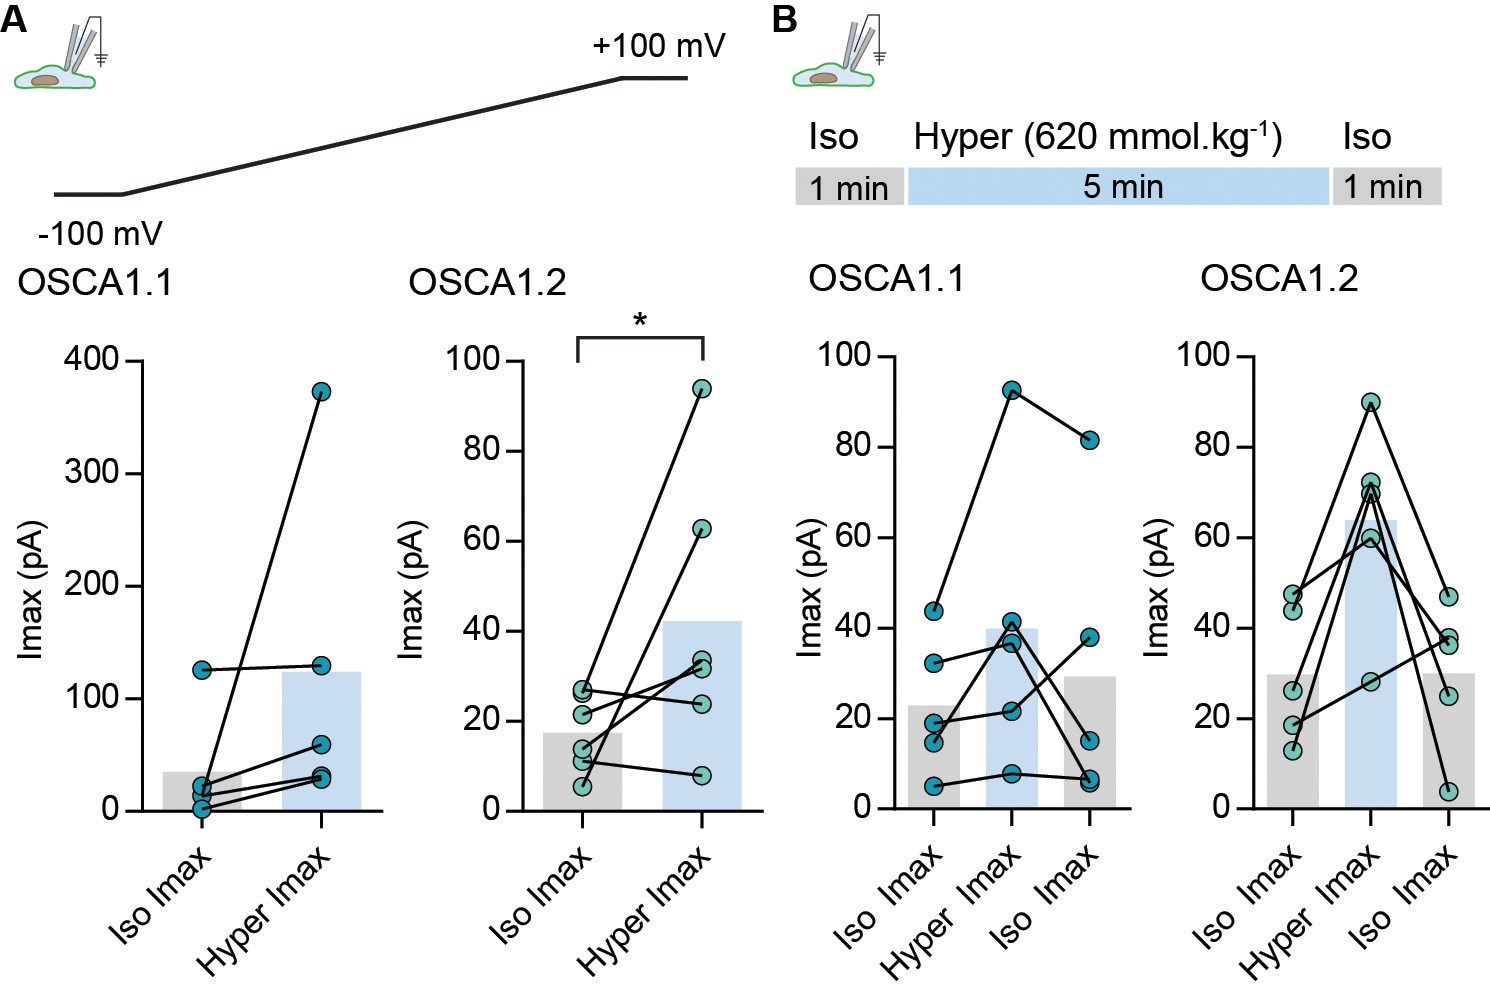
Hyperosmolarity-evoked currents from OSCA1.1- and OSCA1.2-transfected HEK-P1KO cells.
(A) Maximal current (inward current) response recorded at −100 mV from cells expressing OSCA1.1 or OSCA1.2 in iso-osmotic (300 mmol.kg-1) or hyperosmotic solutions (620 mmol.kg−1). In the whole-cell patch clamp mode currents were recorded in response to voltage ramps between −100 mV and +100 mV. Maximal response from each cell in iso- and hyper-osmotic solution is represented as scatter plot, bars represent population mean. OSCA1.1: Iso = 35 ± 22 pA; Hyper = 124 ± 64 pA (N = 6), OSCA1.2: Iso = 17 ± 3 pA; Hyper = 42 ± 10 pA (N = 6) (*p=0.0317, Mann-Whitney test). (B) Hyperosmotic currents were induced by applying a 5 min stimulus of hypertonic solution (620 mmol.kg−1) solution. Currents were continuously recorded at −80 mV. Maximal current for individual cells in the indicated condition is represented as scatter plot, bars represent population mean. OSCA1.1: Iso = 23 ± 6.8 pA; Hyper = 40 ± 14 pA; Iso = 30 ± 14 pA (N = 5), OSCA1.2: Iso = 30 ± 6.8 pA; Hyper = 64 ± 10 pA; Iso = 30 ± 7 pA (N = 5).
Figure 1—figure supplement 2
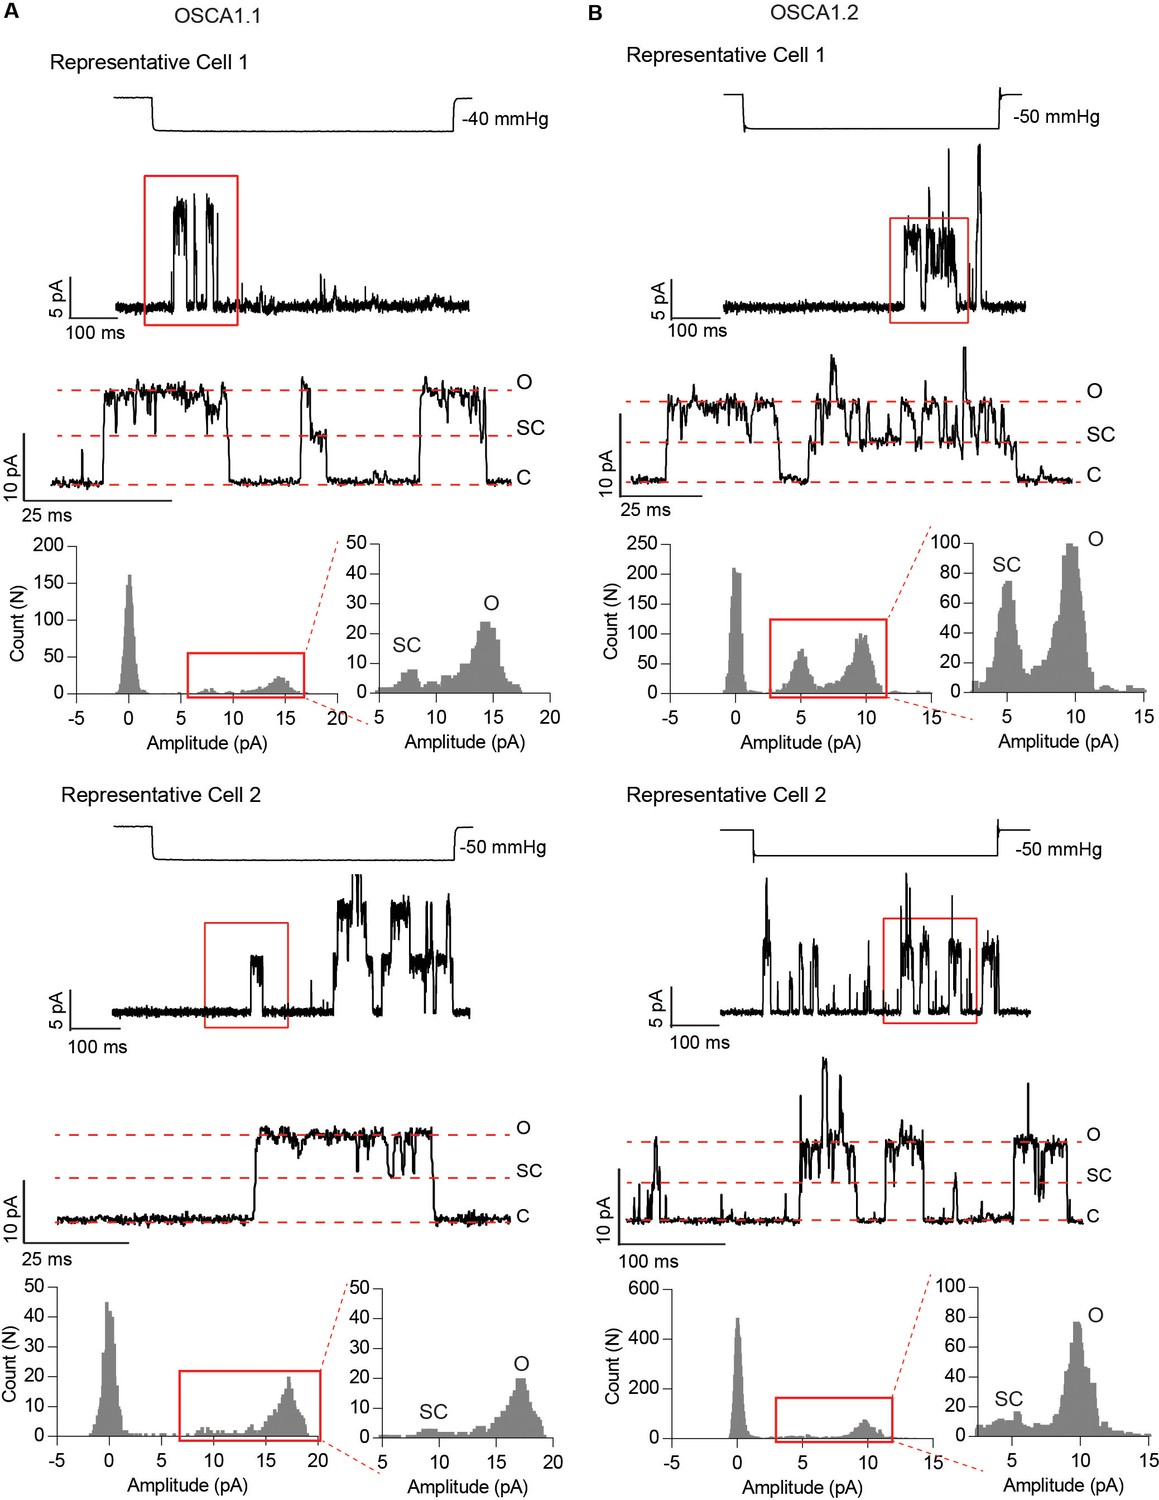
Subconductance states in OSCA1.1- and OSCA1.2-dependent stretch-activated single-channel traces.
Representative traces from two different cells for OSCA1.1 (A) and OSCA1.2 (B). Channel openings are upward deflections, and currents were recorded at −80 mV but are illustrated as upward currents. For each representative cell, top trace illustrates a longer time scale and channel opening in response to stretch. The corresponding pressure-stimulus is illustrated above. The bottom trace highlights the subconductance state. Red box indicates the expanded region in the bottom trace. C: closed, SC: subconductance, O: open. Amplitude histograms for the region of the trace in the red box is represented at the bottom. To highlight the frequency of sub-conductance state, the amplitude histogram is enlarged on the right.
Figure 1—figure supplement 3
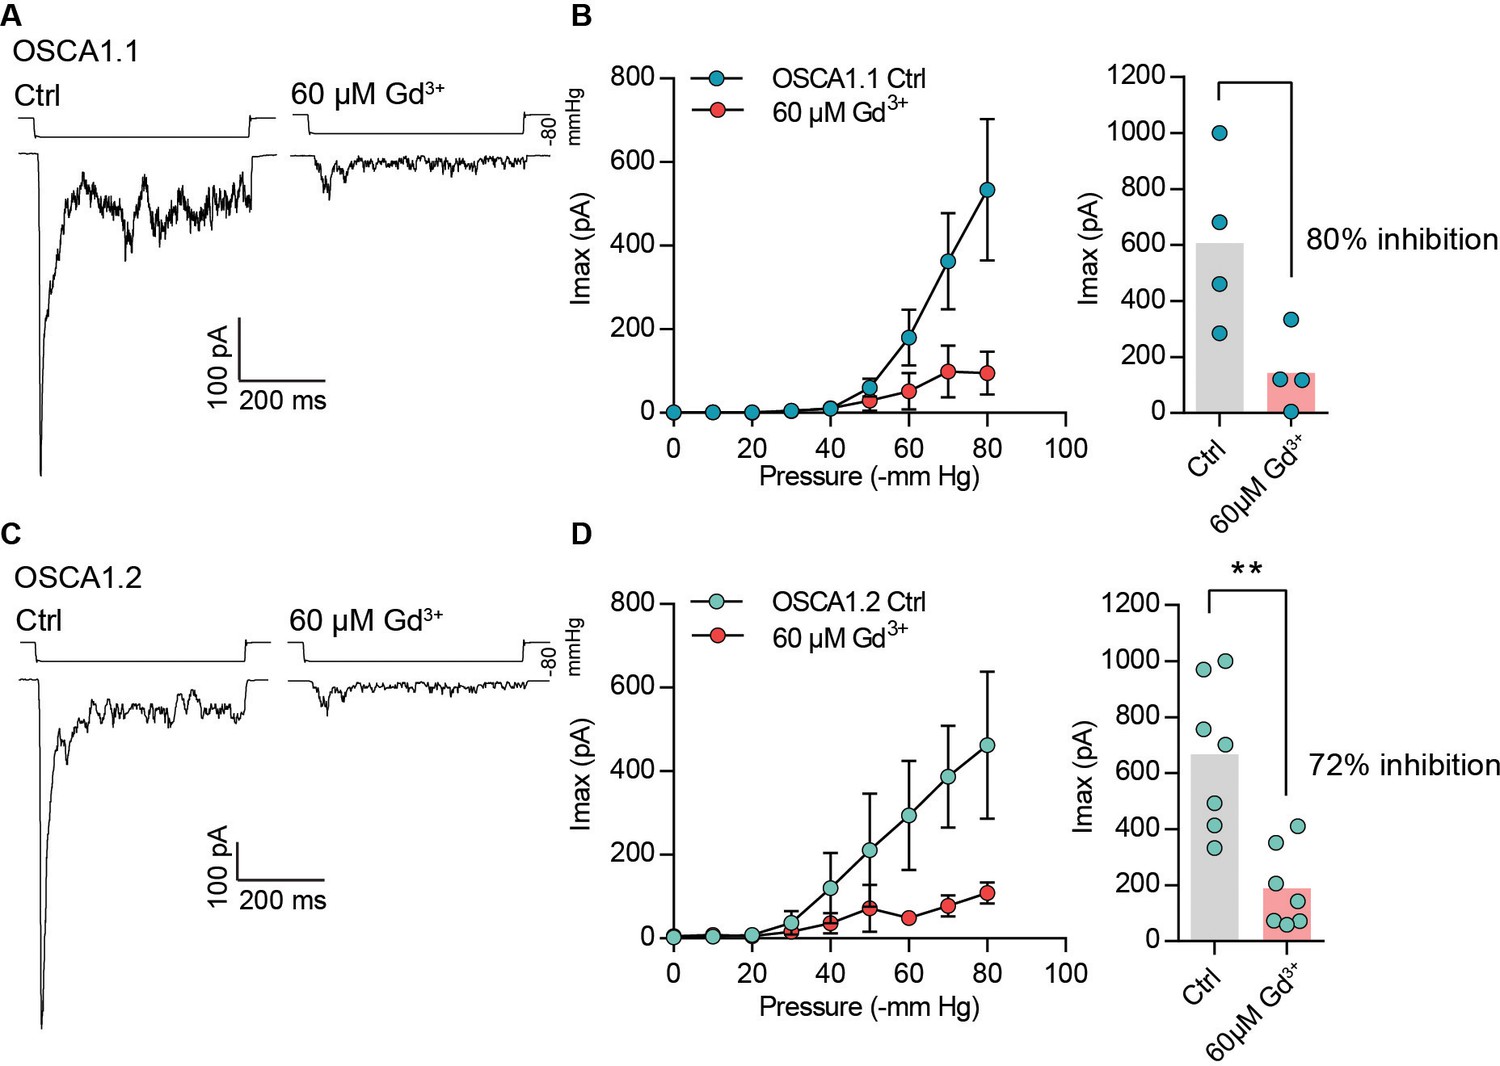
Gadolinium block of OSCA1.1- and OSCA1.2-dependent MA currents.
(A and C) Representative trace of stretch-activated currents at −80 mV in the cell-attached patch clamp mode. Currents were evoked by −80 mmHg of pressure in the presence of physiological pipette solution (Ctrl) or physiological pipette solution with 60 µM Gd3+ from cells expressing OSCA1.1 (A) or OSCA1.2 (C). Traces on left and right are from two independent cells. (B and D) Left, average pressure-response curves of stretch-activated currents recorded from OSCA1.1- (N = 4) (B) or OSCA1.2- (N = 7) (D) expressing cells in Ctrl solution or Ctrl +60 µM Gd3+. Currents plotted at each pressure is mean ± s.e.m. Right, average maximal current across individual cells without (OSCA1.1: Imax = 606 ± 154 pA (N = 4); OSCA1.2: Imax = 666 ± 100 pA (N = 7)) or with Gd3+ (OSCA1.1: Imax = 144 ± 68 pA (N = 4); OSCA1.2: Imax = 187 ± 54 pA (N = 7)). Bars represent population mean. Gd3+ blocks OSCA1.1 and OSCA1.2 maximal current responses by 80% and 72%, respectively (**p=0.0023, Mann-Whitney test).
Figure 2 with 1 supplement
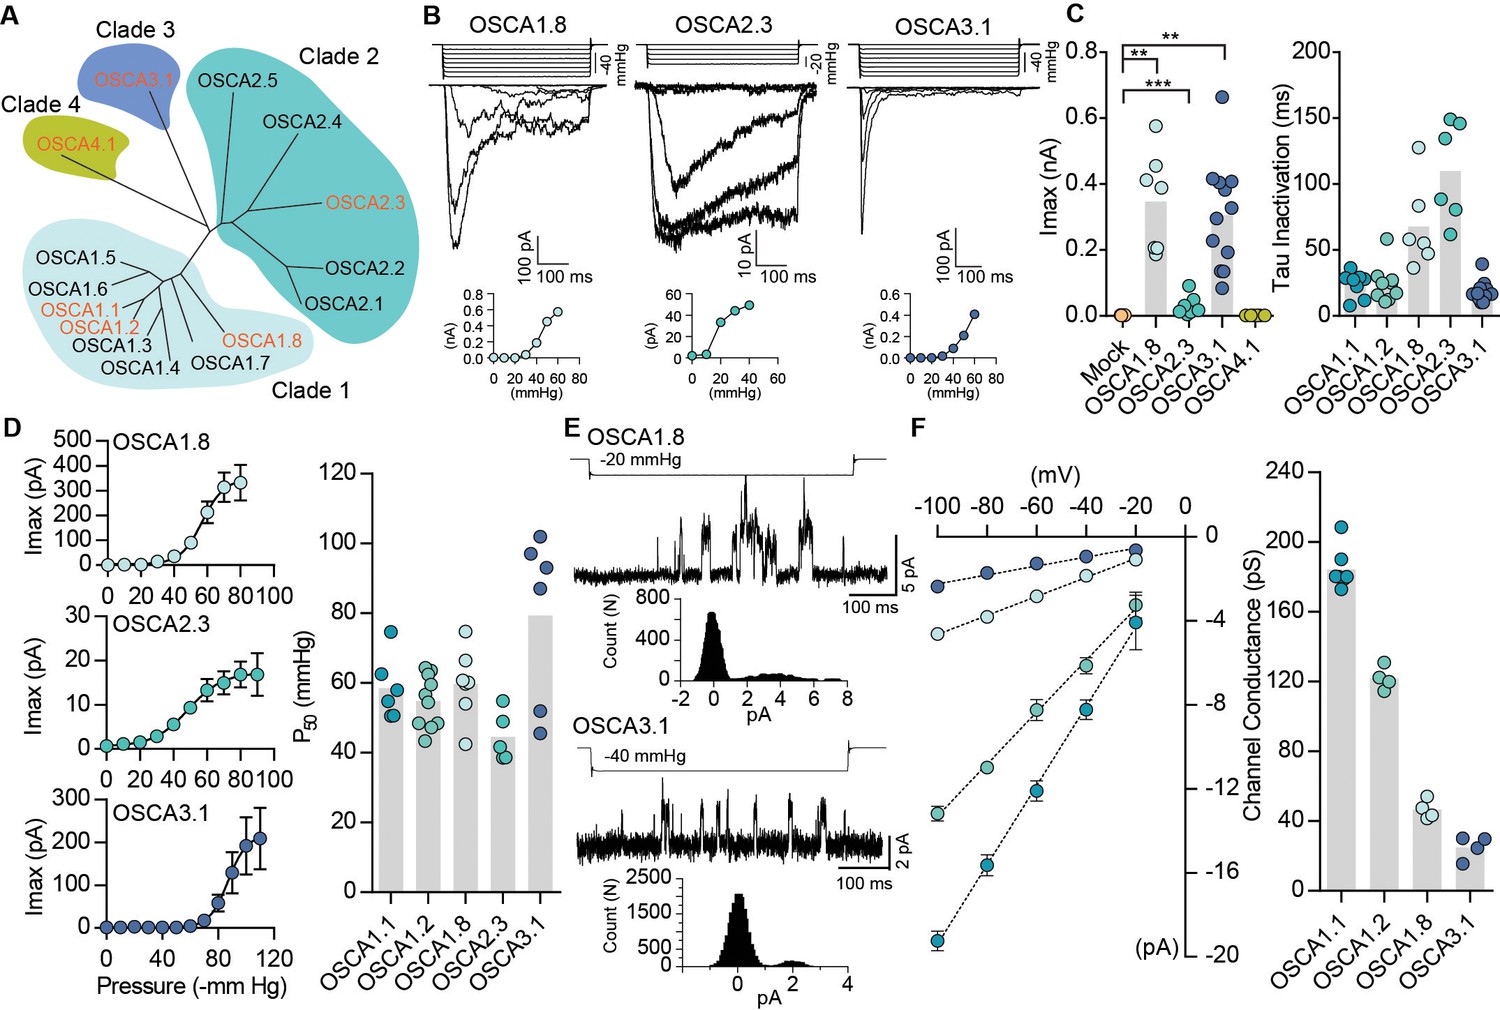
Distinct subclasses of OSCA family members induce MA currents in HEK-P1KO cells.
(A) Phylogenetic tree describing sequence relationship between the 15 OSCA family members. Protein sequences were aligned using MegAlign Pro and tree was generated using DrawTree. Genes in orange were selected for characterization of mechanically-induced biophysical properties of the channel. (B) Representative traces of stretch-activated macroscopic currents recorded from cells expressing OSCA1.8, OSCA2.3, or OSCA3.1. The corresponding stimulus trace is illustrated above the current traces. Pressure-response curve for the representative cell is illustrated below the current traces. (C) Left, maximal current recorded from individual cells expressing mock plasmid (N = 7), OSCA1.8 (N = 7), OSCA2.3 (N = 7), OSCA3.1 (N = 12), or OSCA4.1 (N = 6). Right, inactivation time constant for individual cells expressing OSCA1.1 (N = 8), OSCA1.2 (N = 9), OSCA1.8 (N = 6), OSCA2.3 (N = 6), or OSCA3.1 (N = 11) (OSCA1.8: **p=0.004, OSCA3.1: **p=0.003, OSCA2.3:***p=0.0006, Dunn’s multiple comparison or Mann-Whitney tests). (D) Average pressure-response curves fit with the Boltzmann equation for OSCA1.8, OSCA 2.3, and OSCA3.1. Individual P50 values for cells expressing each protein are plotted on the right (OSCA1.1 (N = 6), OSCA1.2 (N = 10), OSCA1.8 (N = 7), OSCA2.3 (N = 5), and OSCA3.1 (N = 6)). (E) Representative stretch-activated single-channel currents recorded at −80 mV from cells expressing OSCA1.8 or OSCA3.1. Channel openings are upward deflections. The stimulus trace for the current is illustrated above. Amplitude histogram for the trace is depicted below. (F) Average single-channel I-V curves and slope conductance for the indicated protein. OSCA1.1: N = 5, OSCA1.2: N = 4, OSCA1.8: N = 4, and OSCA3.1: N = 4. OSCA1.1 and OSCA1.2 data from Figure 1 is replotted in this figure for comparison.
Figure 2—figure supplement 1
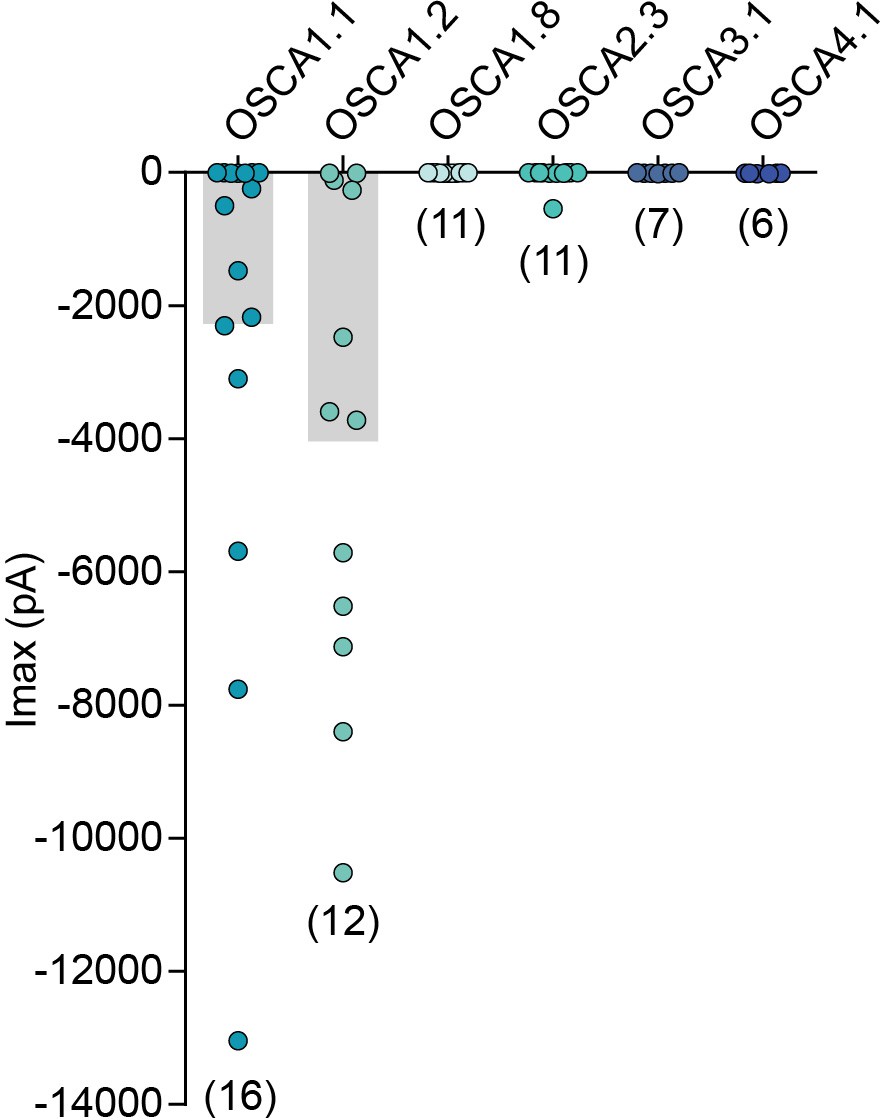
Membrane indentation-induced MA currents in HEK-P1KO cells transfected with different genes from the OSCA family.
MA whole-cell maximal inward currents from individual cells transfected with the indicated gene. The last current response before losing the cell is reported. Currents were elicited at −80 mV membrane potential. Numbers in parenthesis indicate number of cells tested per gene. Bars represent population mean.
Figure 3 with 1 supplement
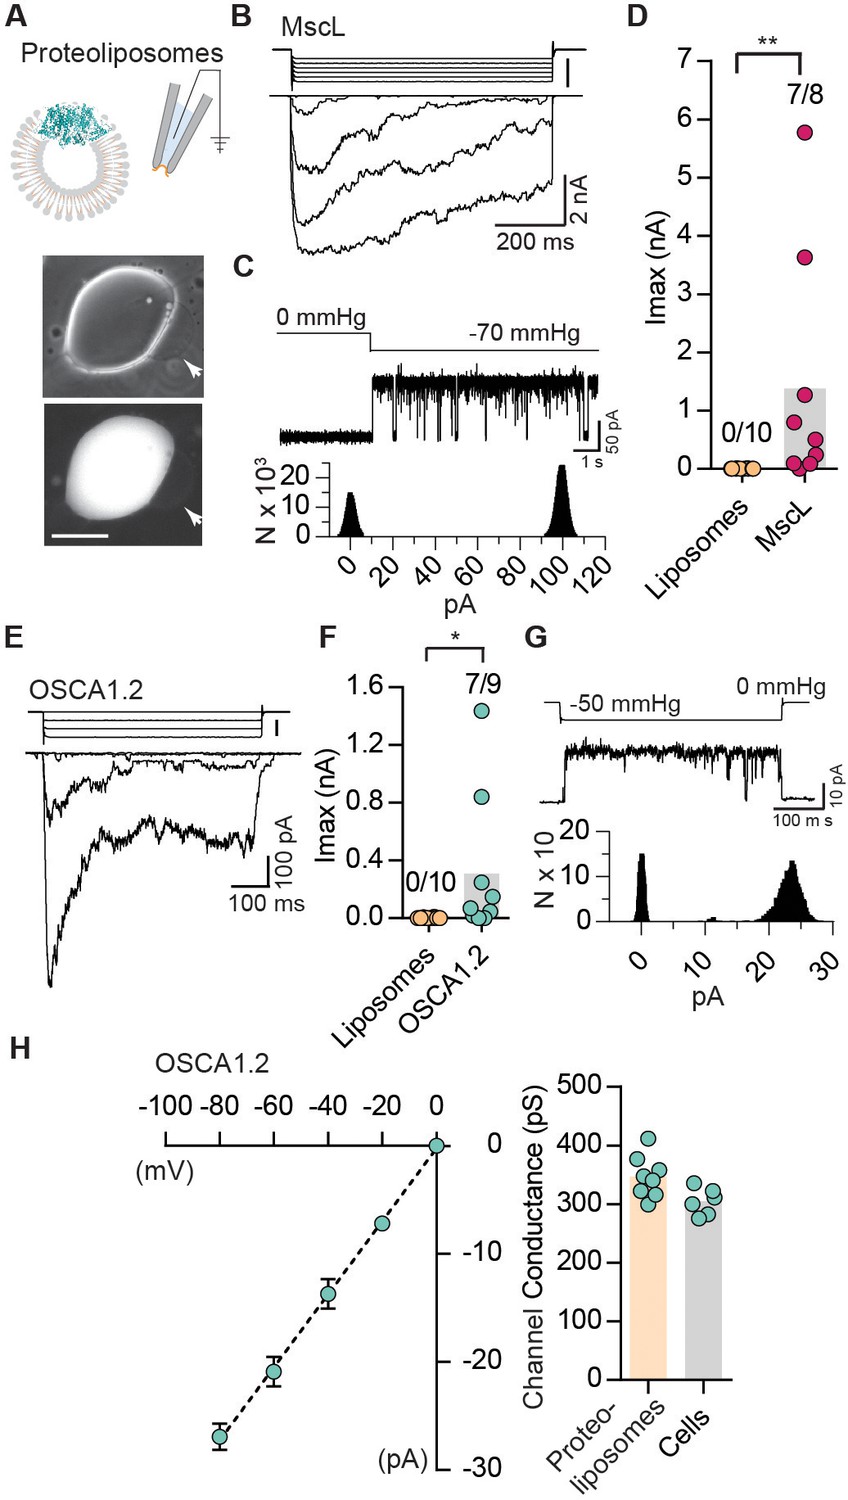
Reconstituted OSCA1.2 in liposomes form MA ion channels.
(A) Illustration to depict that patches were pulled from liposomes reconstituted with purified MscL or OSCA1.2 proteins. Channels in patch were activated by negative pipette pressure. Brightfield (top) and GFP (bottom) images of proteoliposomes reconstitutes with OSCA1.2-EGFP protein. Patches were pulled from unilamellar vesicles (indicated by arrows). Scale bar: 50 µm. (B) Representative traces of macroscopic stretch-activated currents recorded from unilamellar liposomes reconstituted with EcMscL. The corresponding negative pipette pressure-stimulus is illustrated above the current traces. (C) Representative single-channel trace recorded in response to −70 mmHg pressure. Channel openings are upward deflections. Currents were filtered at 10 kHz. Amplitude histogram of the full-trace is depicted below. (D) Maximal stretch-activated currents recorded from empty liposomes or EcMscL reconstituted liposomes. Fractions indicate attempts that resulted in currents/total number of attempts (**p=0.003, Mann-Whitney test). (E) Representative traces of macroscopic stretch-activated currents recorded from liposomes reconstituted with OSCA1.2-EGFP protein. (F) Maximal stretch-activated currents recorded from empty liposomes or OSCA1.2-EGFP (*p=0.04, Mann-Whitney test). (G) Representative trace and amplitude histogram of stretch-activated OSCA1.2-EGFP single-channel currents recorded from proteoliposomes. Currents were filtered at 2 kHz. (H) Left, average I-V relationship of stretch-activated single-channels in liposomes reconstituted with OSCA1.2-EGFP. Right, single-channel conductance in 200 mM KCl solution from individual proteoliposome patches (N = 8) or cells expressing OSCA1.2 (N = 6). In (C) and (G), N represents count or number of events.
Figure 3—figure supplement 1
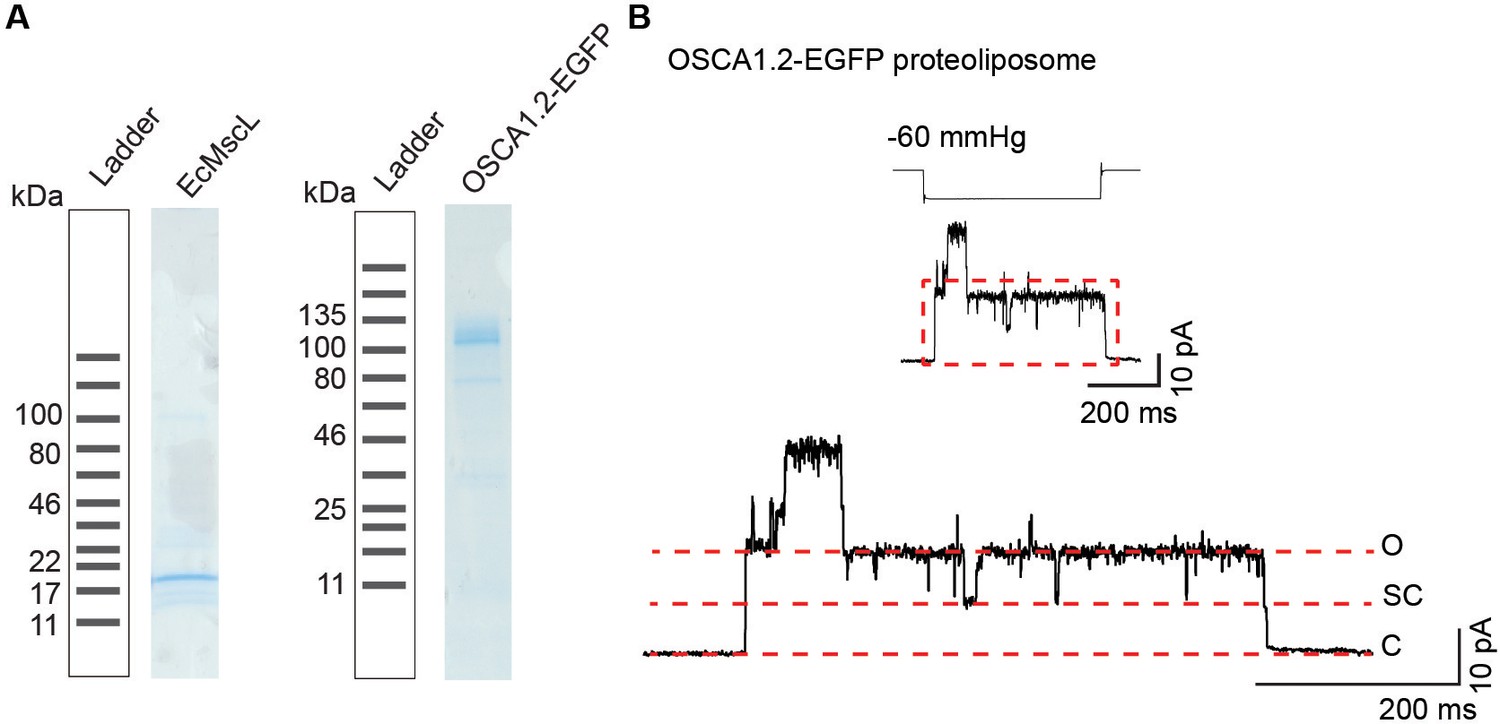
Purified OSCA1.2 induces stretch-activated single-channel currents with subconductance states when reconstituted in liposomes.
(A) SDS-PAGE showing purification of EcMscL and OSCA1.2. Samples are taken after eluting protein from resin and before concentrating it for further steps (proteoliposome reconstitution for EcMscL or after size exclusion chromatography for OSCA1.2). Expected monomer size: EcMscL 17 kDa and OSCA1.2-EGFP 117 kDa. (B) Top, representative stretch-activated single-channel currents (−80 mV) from OSCA1.2-EGFP reconstituted in liposomes. Stimulus trace is depicted above the current trace. Bottom, enlarged current trace to illustrate sub-conductance states. Channel openings are upward deflections. C: closed, SC: sub-conductance, O: open.
Figure 4 with 3 supplements
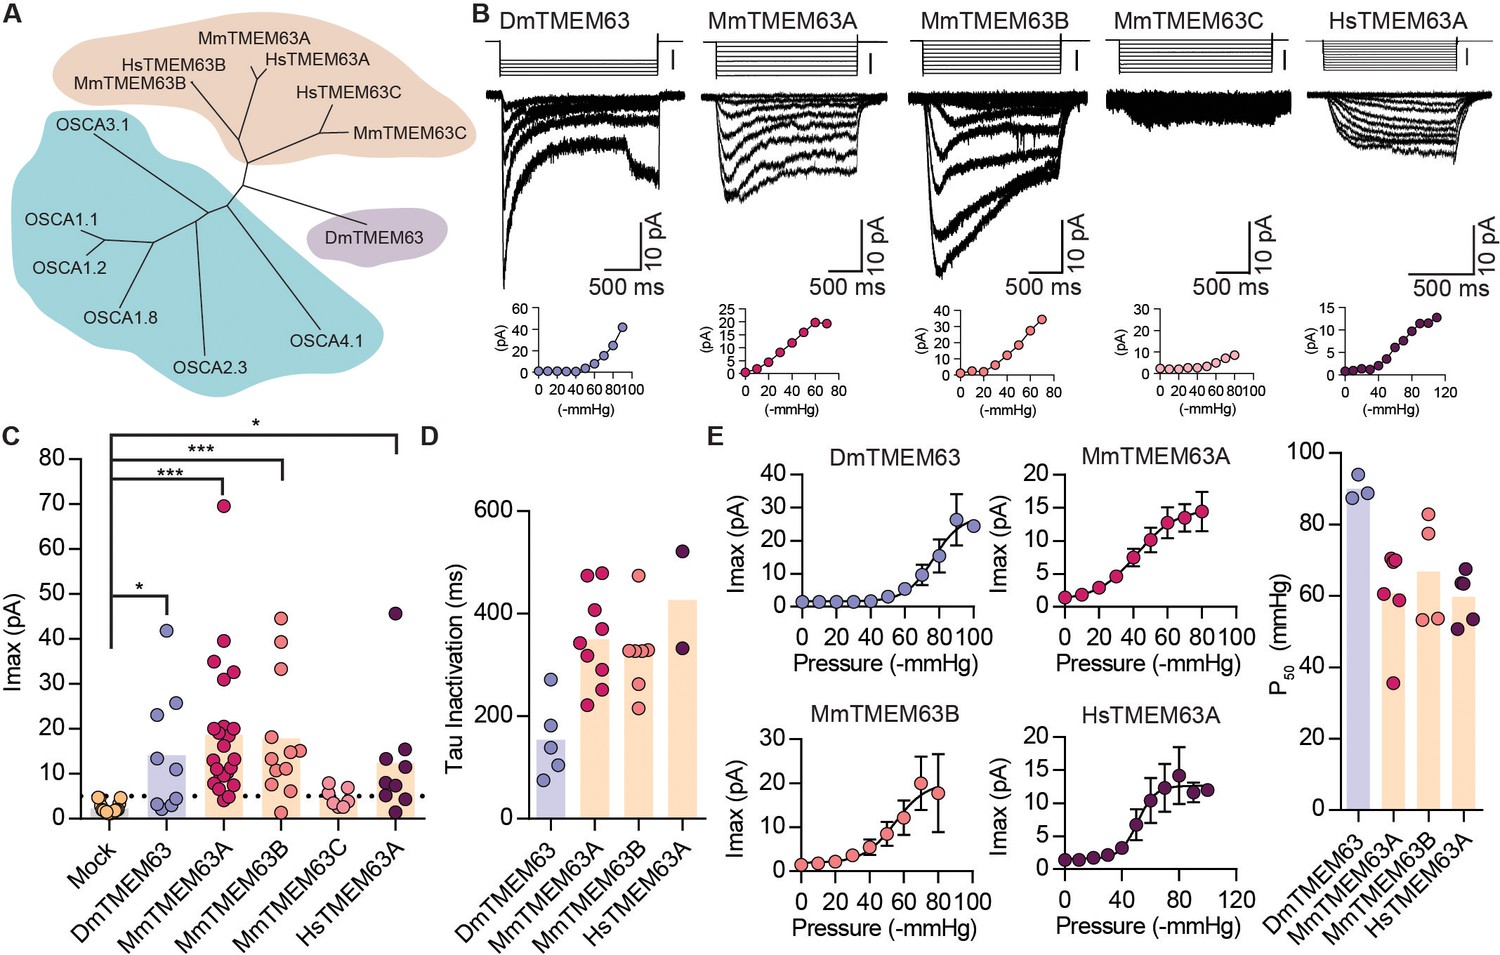
OSCA orthologues in flies and in mammals induce MA currents in HEK-P1KO cells.
(A) Phylogenetic tree illustrating the relationship between OSCA proteins across Arabidopsis thaliana (teal clade), Drosophila melanogaster (purple clade), and Mus musculus and Homo sapiens (orange clade). Sequences were aligned in MegAlign Pro and tree was generated in DrawTree. (B) Representative stretch-activated currents induced by negative pipette pressure from cells transfected with the indicated gene. Corresponding pressure stimulus is illustrated above the current trace. Vertical scale bar: −50 mmHg. Pressure-response curve for the representative cell is illustrated below the trace. (C) Maximal stretch-activated currents recorded from cells expressing mock plasmid (N = 17) or the indicated TMEM63 homologue (DmTMEM63 (N = 7), MmTMEM63A (N = 23), MmTMEM63B (N = 12), MmTMEM63C (N = 7), and HsTMEM63A (N = 6). DmTMEM63: *p=0.023, HsTMEM63A: *p=0.015, ***p<0.0001, Dunn’s multiple comparison test relative to mock plasmid). (D) Inactivation time constant (ms) across individual cells for each transfected gene. Owing to the non-inactivating nature of HsTMEM63A currents, only 2 out of 9 cells could be reliably fit with an exponential curve (DmTMEM63 (N = 5), MmTMEM63A (N = 9), MmTMEM63B (N = 7), and HsTMEM63A (N = 2)). (E) Left, average pressure-response curves fit with the Boltzmann equation for the indicated transfected gene. Right, P50 values for individual cells across the four different TMEM63 homologues (DmTMEM63 (N = 3), MmTMEM63A (N = 6), MmTMEM63B (N = 4), and HsTMEM63A (N = 5)).
Figure 4—figure supplement 1
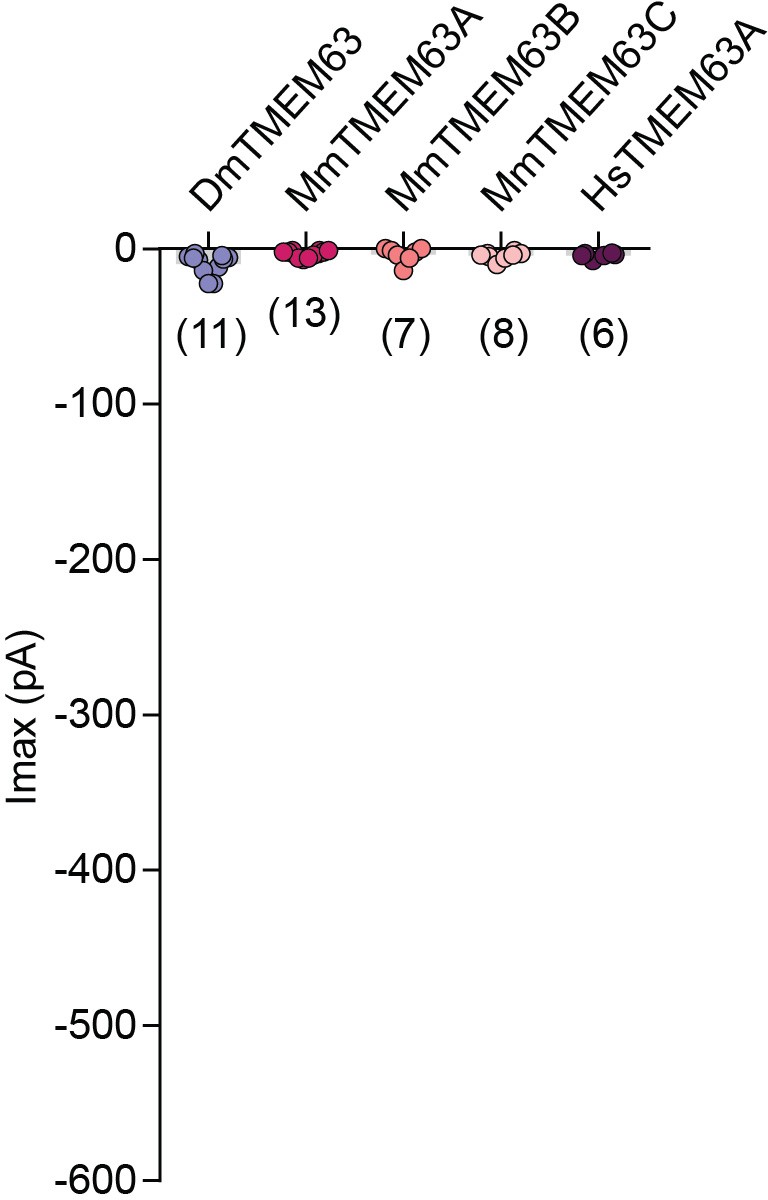
Membrane indentation-induced MA currents in HEK-P1KO cells transfected with TMEM63 homologues.
MA whole-cell maximal inward currents from individual cells transfected with the indicated gene. The last current response before losing the cell is reported. Currents were elicited at −80 mV membrane potential. Numbers in parenthesis indicate number of cells tested per transfected gene. Bars represent population mean.
Figure 4—figure supplement 2
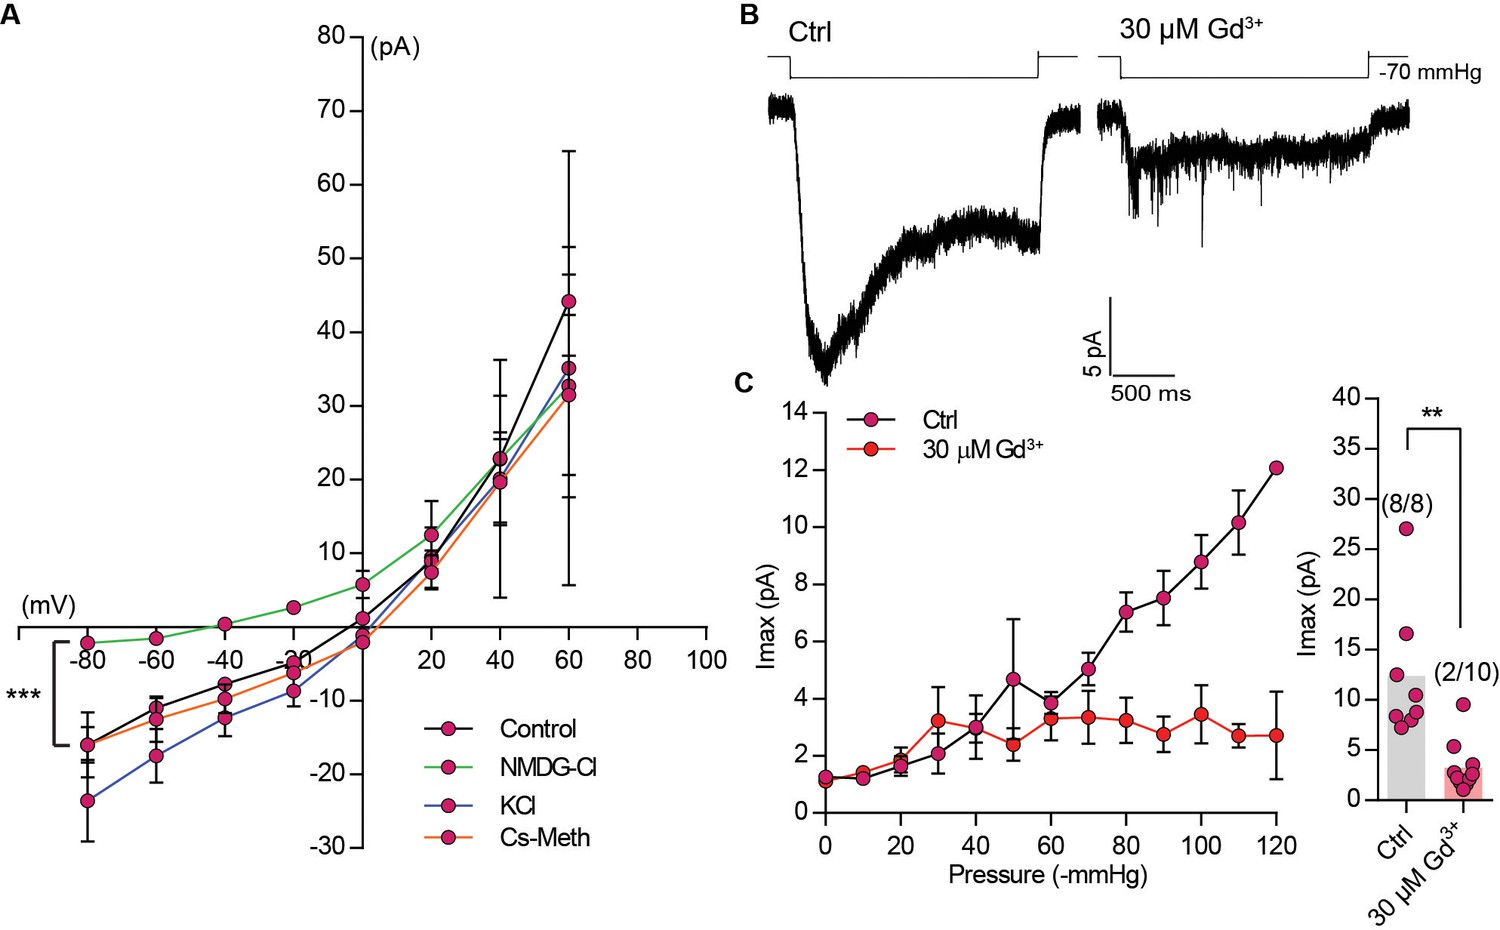
Ion selectivity and gadolinium block of MmTMEM63A-induced MA currents.
(A) I-V relation curves for stretch-activated currents recorded in the cell-attached patch clamp mode from cells expressing MmTMEM63A in the indicated ion solution (Control: N = 11, NMDG-Cl: N = 10, KCl: N = 4, and Cs-Meth: N = 7, ***p<0.0001, Two-way ANOVA, not repeated measures, between control and NMDG-Cl). (B) Representative trace of stretch-activated current evoked by −70 mmHg of pressure in the presence of physiological pipette solution (Ctrl) or physiological pipette solution with 30 µM Gd3+. Traces on left and right are from two independent cells. (C) Left, average pressure-response curves of stretch-activated currents recorded from MmTMEM63A expressing cells in Ctrl solution (N = 8) or Ctrl +30 µM Gd3+ (N = 10). Right, average maximal current across individual cells with or without Gd3+. Bars represent population mean (**p=0.0005, Mann Whitney test). Numbers in parenthesis denote cells with a response/total number of cells tested. In (A) and (C) currents plotted at each voltage and pressure, respectively, is mean ±s.e.m.
Figure 4—figure supplement 3
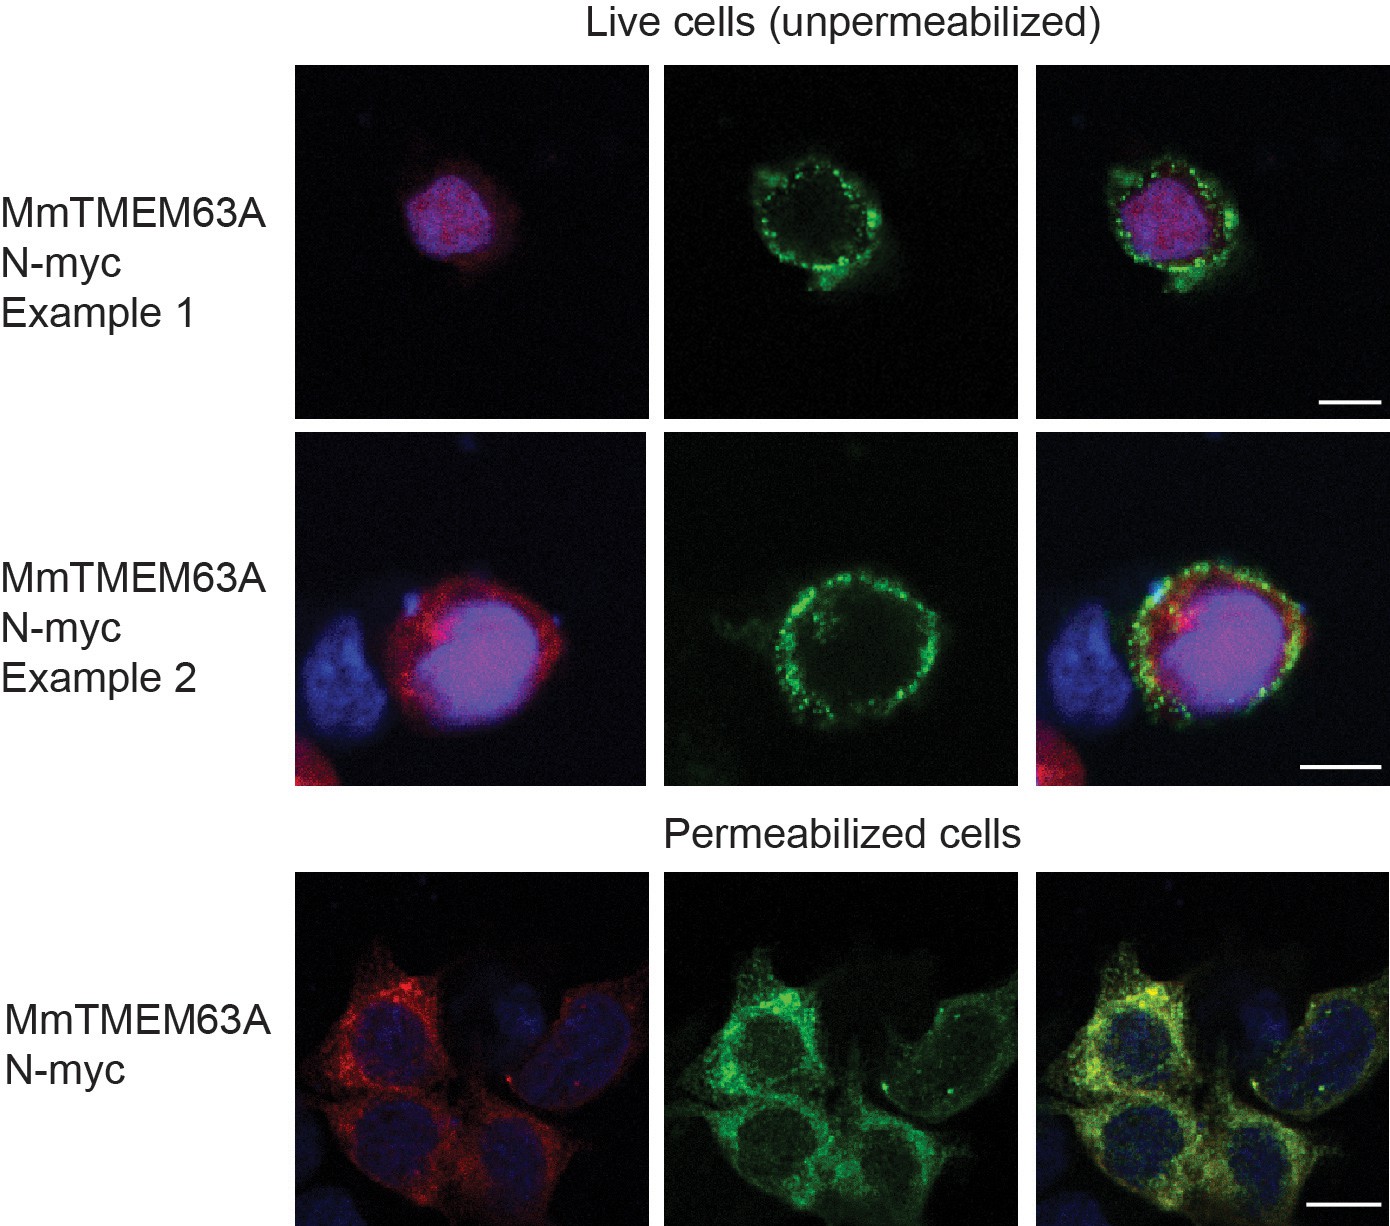
Surface expression of MmTMEM63A.
Representative images of Myc labeling in MmTMEM63A-IRESmCherry transfected HEK-P1KO cells. Myc tag was inserted at the N terminal of the protein which was predicted to be on the extracellular side of the cellular membrane. Immunostaining was performed before (top two panels, two representative cells) or after (bottom panel) cell permeabilization. Secondary antibody to Myc tag is conjugated to Alexa Fluor 488. MmTMEM63A is labeled at the surface of live cells indicating that the protein is correctly trafficked to the membrane. Scale bar: 10 µm.
Tables
Table 1
Biophysical properties of OSCA and TMEM63 proteins.
https://doi.org/10.7554/eLife.41844.006| Gene | Whole-cell/Poke | Cell-attached/Stretch | ||||||
|---|---|---|---|---|---|---|---|---|
| Imax (pA) | Inactivation tau (ms) | Threshold (µm) | Imax (pA) | Activation tau (ms) | Inactivation tau (ms) | P50 (-mmHg) | Channel conductance (pS) | |
| Mock | 4.2 ± 0.5 (10) | - | - | 2.32 ± 0.3 (17) | - | - | - | - |
| Mm PIEZO1 | 3045 ± 875 (5) | 18.7 ± 1.7 (5) | 4.0 ± 0.6 (5) | 122 ± 40 (5) | 9.0 ± 1.0 (5) | 28.8 ± 2.0 (5) | 24.0 ± 3.6 (4) | 27.3 ± 0.3 (4)* |
| OSCA1.1 | 2271 ± 918 (16) | 10.0 ± 1.3 (8) | 8.6 ± 0.9 (9) | 563 ± 68 (11) | 6.7 ± 1.0 (11) | 24.0 ± 3.0 (8) | 58.5 ± 2.4 (6) | 184.4 ± 4.4 (5) |
| OSCA1.2 | 4039 ± 1046 (12) | 10.4 ± 1.7 (9) | 6.3 ± 0.7 (10) | 576 ± 65 (14) | 5.5 ± 0.5 (14) | 24.6 ± 4.7 (9) | 54.5 ± 2.2 (10) | 121.8 ± 3.4 (4) |
| OSCA1.8 | 7.1 ± 0.7 (11) | - | - | 347 ± 56 (7) | 14.0 ± 2.4 (7) | 67.0 ± 13.0 (6) | 79.3 ± 9.9 (6) | 46.6 ± 2.8 (4) |
| OSCA2.3 | 54.34 ± 48.9 (11) | - | - | 31.3 ± 11 (7) | 18.8 ± 3.2 (6) | 110.0 ± 70.0 (6) | 59.7 ± 3.8 (7) | n.d. |
| OSCA3.1 | 9.7 ± 1.4 (7) | - | - | 306 ± 47 (12) | 5.6 ± 1.4 (8) | 18.5 ± 2.5 (11) | 44.5 ± 3.2 (5) | 24.9 ± 3.4 (4) |
| OSCA4.1 | 13.3 ± 2.0 (6) | - | - | 1.2 ± 0.05 (6) | - | - | - | - |
| Dm TMEM63 | 9.8 ± 2.0 (11) | - | - | 14.2 ± 4.5 (9) | 22.6 ± 4.3 (5) | 154 ± 34 (5) | 90 ± 2 (3) | n.d. |
| Mm TMEM63A | 2.0 ± 1.2 (13) | - | - | 18.75 ± 3.0 (23) | 126 ± 19 (8) | 323 ± 30 (9) | 60 ± 5.4 (6) | n.d. |
| Mm TMEM63B | 3.8 ± 1.8 (7) | - | - | 17.97 ± 3.9 (12) | 245 ± 38 (7) | 323 ± 30 (7) | 66 ± 7.8 (4) | n.d. |
| Mm TMEM63C | 4.5 ± 0.9 (8) | - | - | 4.73 ± 0.8 (7) | - | - | - | - |
| Hs TMEM63A | 4.2 ± 0.7 (6) | - | - | 12.4 ± 4.4 (9) | 188 ± 18 (5) | 427 ± 94 (2) | 59.7 ± 3.2 (5) | n.d. |
-
Note: n.d.: not determined. Ns are indicated in parenthesis. Imax value is reported for the last indentation or stretch stimulus before losing the cell. Activation is reported as 10–90% rise of stretch-activated current at saturating stimulus. Inactivation time constant for stretch-activated currents are reported in the range of −60 to −80 mmHg stimulus-pressure. All values are mean ± s.e.m. * values as indicated in Saotome et al., 2018
Table 2
Percent identity in protein sequence among OSCA and TMEM63 family of genes.
https://doi.org/10.7554/eLife.41844.009| Gene | Osca 1.1 | Osca 1.2 | Osca 1.8 | Osca 2.3 | Osca 3.1 | Osca 4.1 | Dm TMEM63 | Mm TMEM63A | Mm TMEM63B | Mm TMEM63C | Hs TMEM63A |
| OSCA 1.1 | 100 | 84.81 | 58 | 32.76 | 29.09 | 18.82 | 18.07 | 19.19 | 19.32 | 17.55 | 20.11 |
| OSCA 1.2 | - | 100 | 58.39 | 34.47 | 28.95 | 19.42 | 18.40 | 20.09 | 19.52 | 17.75 | 20.43 |
| OSCA 1.8 | - | - | 100 | 32.24 | 31.79 | 18.00 | 18.32 | 19.26 | 19.06 | 19.15 | 19.46 |
| OSCA 2.3 | - | - | - | 100 | 23.80 | 17.30 | 17012 | 19.57 | 18.17 | 17.88 | 19.41 |
| OSCA 3.1 | - | - | - | - | 100 | 18.39 | 18.92 | 22.36 | 20.33 | 19.79 | 21.75 |
| OSCA 4.1 | - | - | - | - | - | 100 | 18.97 | 21.27 | 21.30 | 19.68 | 21.42 |
| Dm TMEM63 | - | - | - | - | - | - | 100 | 32.58 | 32.79 | 30.78 | 32.59 |
| Mm TMEM63A | - | - | - | - | - | - | - | 100 | 57.16 | 41.28 | 90.05 |
| Mm TMEM63B | - | - | - | - | - | - | - | - | 100 | 44.46 | 57.58 |
| Mm TMEM63C | - | - | - | - | - | - | - | - | - | 100 | 40.73 |
| Hs TMEM63A | - | - | - | - | - | - | - | - | - | - | 100 |
Key resources table
| Reagent type (species) or resource | Designation | Source or reference | Identifiers | Additional information |
|---|---|---|---|---|
| Cell line (Piezo1 knockout HEK293T cells) | HEK-P1KO cells | PMID: 28426961 | Patapoutian Lab (Scripps Research) | |
| Antibody | 9E11 anti- Myc antibody (primary) | Santa Cruz Biotechnology | Cat# sc-47694, RRID:AB_627266 | 1:50 |
| Antibody | Alexa Fluor 488 (secondary) | Invitrogen | Cat# A-21121, RRID:AB_141514 | 1:200 |
| Transfected construct (Arabidopsis thaliana) | OSCA1.1 | this paper | NM_178966.1, At4g04340 | Human codon optimized, Gene synthesized from Genewiz |
| Transfected construct (Arabidopsis thaliana) | OSCA1.2 | this paper | NM_118333.5, At4g22120 | Human codon optimized, Gene synthesized from Genewiz |
| Transfected construct (Arabidopsis thaliana) | OSCA1.8 | this paper | NM_102943.6, At1g32090 | Human codon optimized, Gene synthesized from Genewiz |
| Transfected construct (Arabidopsis thaliana) | OSCA2.3 | this paper | NM_110975.5, At3g01100 | Human codon optimized, Gene synthesized from Genewiz |
| Transfected construct (Arabidopsis thaliana) | OSCA3.1 | this paper | NM_102773.3, At1g30360 | Human codon optimized, Gene synthesized from Genewiz |
| Transfected construct (Arabidopsis thaliana) | OSCA4.1 | this paper | NM_119753.3, At4g35870 | Human codon optimized, Gene synthesized from Genewiz |
| Transfected construct (Drosophila melanogaster) | DmTMEM63 | this paper | Dmel_CG11210 | Human codon optimized, Gene synthesized from Genewiz |
| Transfected construct (Mus musculus) | MmTMEM63A | ORIGENE | NM_144794, Cat No. MR210748 | |
| Transfected construct (Mus musculus) | MmTMEM63B | ORIGENE | NM_198167, Cat No. MR221527 | |
| Transfected construct (Mus musculus) | MmTMEM63C | ORIGENE | NM_172583, Cat No. MR210738 | |
| Transfected construct (Homo sapiens) | HsTMEM63A | ORIGENE | NM_014698, Cat No. RC206992 |
Additional files
-
Transparent reporting form
- https://doi.org/10.7554/eLife.41844.016
Download links
A two-part list of links to download the article, or parts of the article, in various formats.
Downloads (link to download the article as PDF)
Open citations (links to open the citations from this article in various online reference manager services)
Cite this article (links to download the citations from this article in formats compatible with various reference manager tools)
OSCA/TMEM63 are an evolutionarily conserved family of mechanically activated ion channels
eLife 7:e41844.
https://doi.org/10.7554/eLife.41844


