Vocal and locomotor coordination develops in association with the autonomic nervous system
- Princeton Neuroscience Institute, Princeton University, United States
- Princeton University, United States
Figures
Figure 1
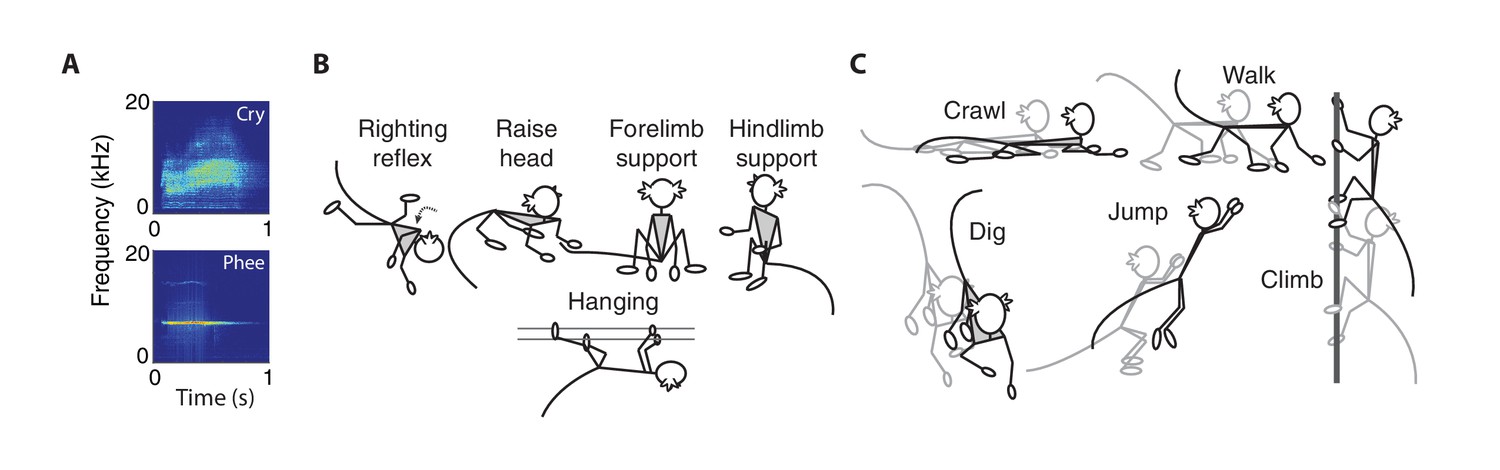
Vocal, postural and locomotor behaviors in developing marmosets.
(A) Spectrograms of immature (cries) and mature (phees) contact calls produced by infant marmosets in an isolated social context. (B) Cartoons representing the five types of posture behaviors. (C) Cartoons representing the five types of locomotor behaviors.
Figure 2
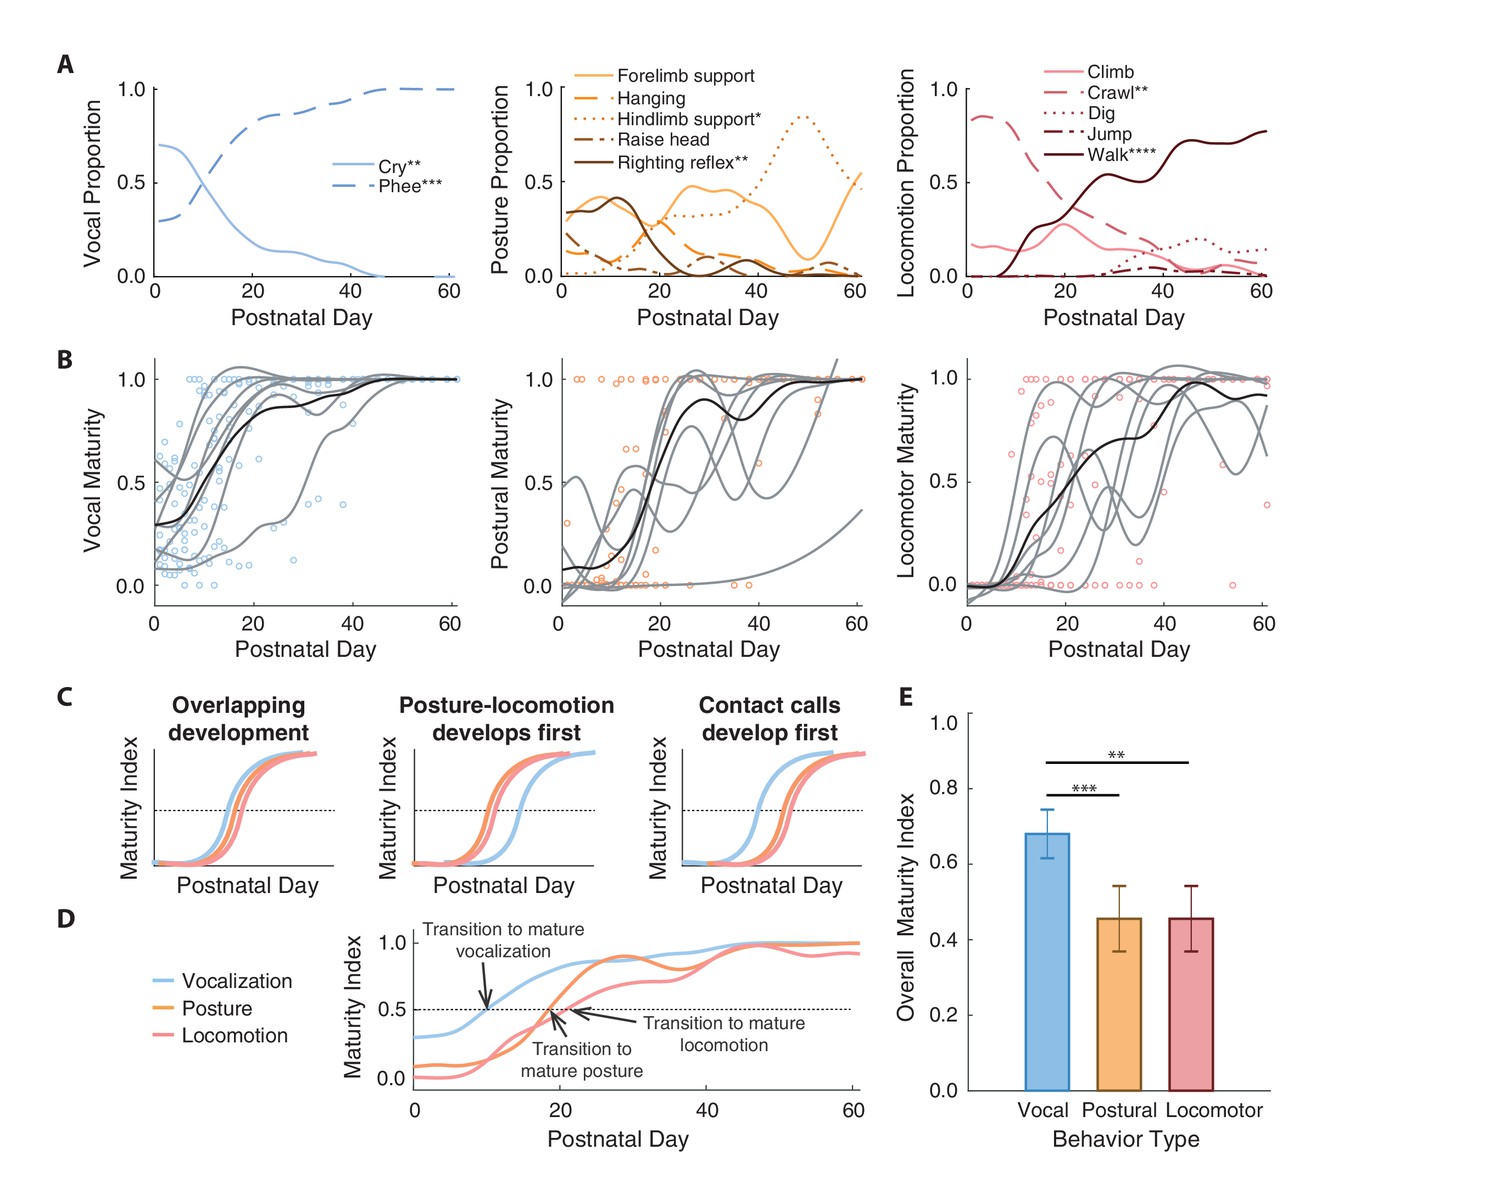
Contact calls mature before postural and locomotor behaviors.
(A) Changes in the proportion of time spent in specific vocal, postural, and locomotor behaviors across development. Behaviors that increase or decrease are denoted with asterisks to represent significance values. (B) Developmental trajectories of contact call maturation (i.e., mature phee calls relative to immature cries), postural maturation (i.e., hindlimb support relative to righting reflex), and locomotor maturation (i.e., walking relative to crawling). Points represent session values, gray curves represent the cubic spline fits for individual marmosets, and black curves represent the population cubic spline fits. (C) Illustration of hypothesized sequences between contact call and postural/locomotor developmental trajectories and (D) an overview of the observed developmental trajectories. (E) Comparison of the different developmental time courses. Bars and whiskers represent mean ±2 SE. Significance values are represented by ‘*' (p<0.05), ‘**' (p<0.01), ‘***' (p<0.001) and ‘****' (p<0.0001).
Figure 3 with 1 supplement
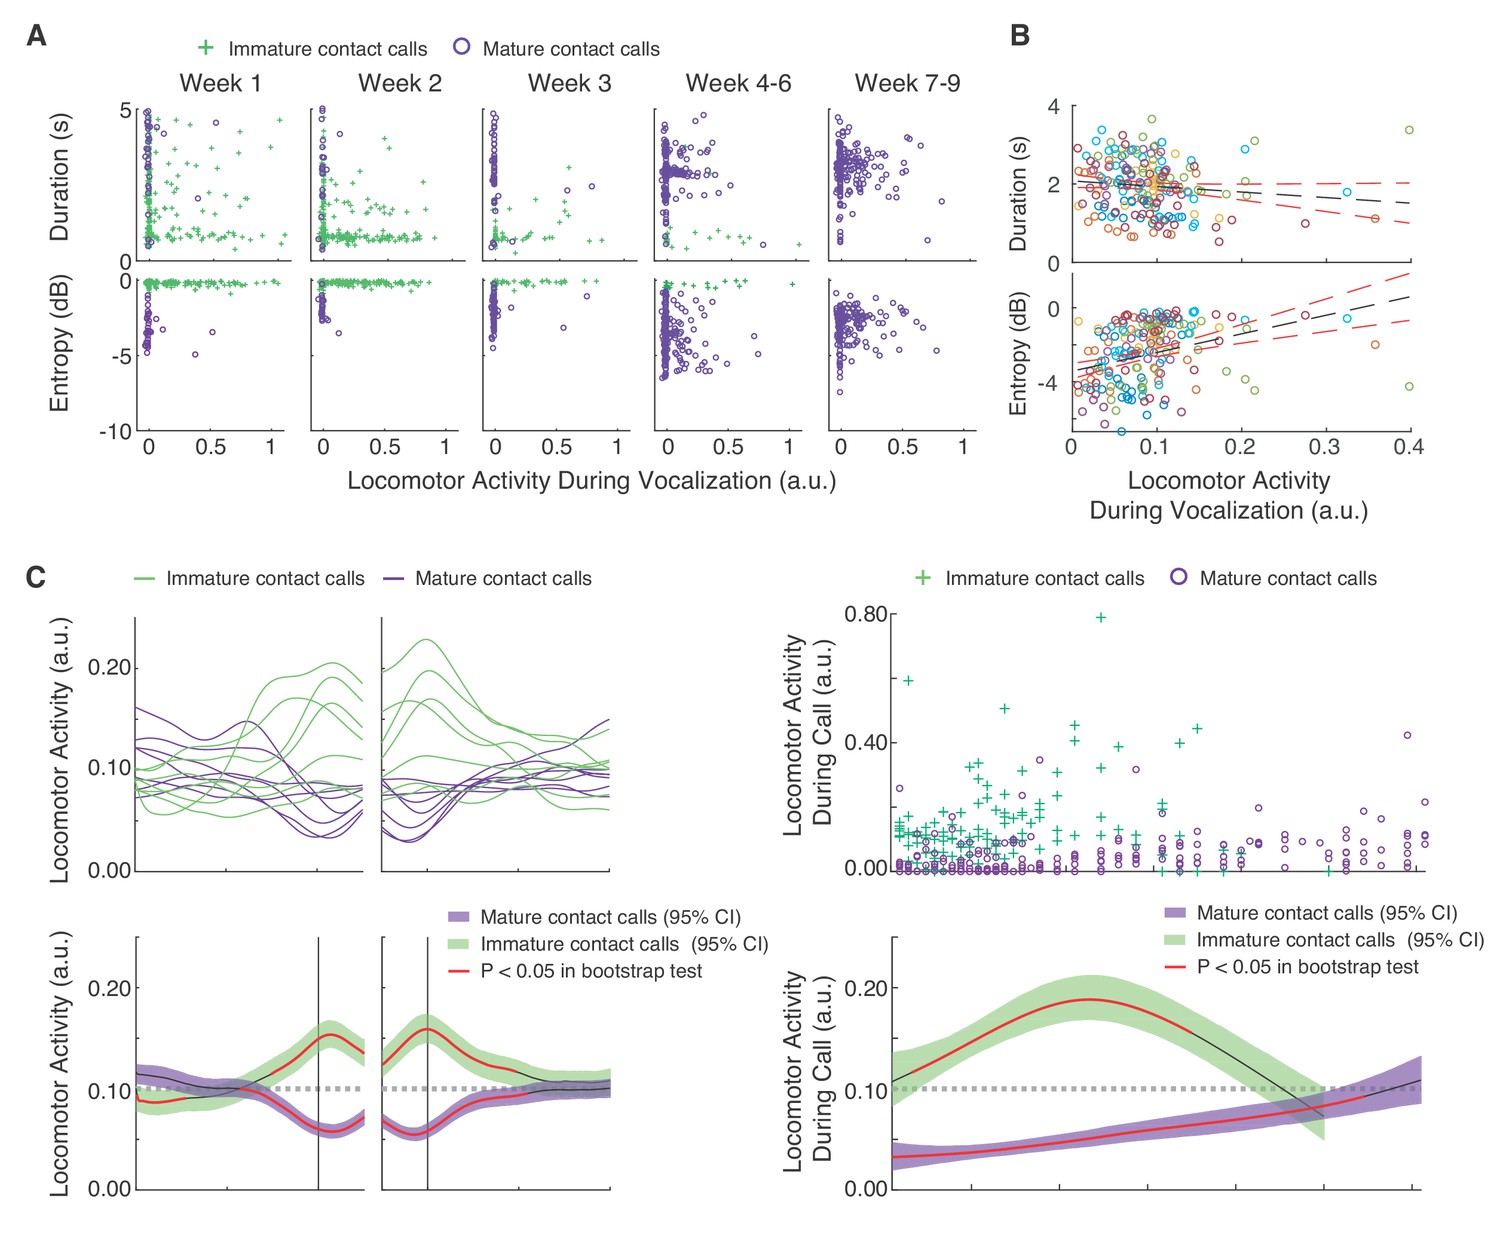
Mature contact calls and locomotor activity become increasingly coordinated across development.
(A) Plots of contact call acoustic parameters and corresponding locomotor activity in one infant. Green pluses represent immature contact calls (cries), and purple circles represent mature contact calls (phees). (B) Plots of contact call acoustic parameters and locomotor activity levels during contact calls. Points represent subject averages (one color per subject) per day and fit with a linear regression (black dotted line) with 95% confidence intervals (red dotted lines). (C) Locomotor activity from 20 s before to 20 s after contact call production. (C, top) Subject averages (one line per subject) of cubic splines fit to locomotor activity fluctuations surrounding cries (green lines) and phees (purple lines). (C, bottom) Colored cubic splines fit to population data are plotted with a 95% bootstrapped confidence interval (green – cries, purple – phees). Red line indicates observed values outside of the 95% threshold of the bootstrapped significance test. (D) Fluctuations in locomotor activity during contact calls across development. (D, top) Locomotor activity during cries (green pluses) and phees (purple circles) for all observation sessions. (D, bottom) Colored cubic splines fit to population data are plotted with a 95% bootstrapped confidence interval (green – cries, purple – phees). A red line indicates observed values outside of the 95% threshold of the bootstrapped significance test, and a black line indicates observed values inside the 95% threshold.
Figure 3—figure supplement 1
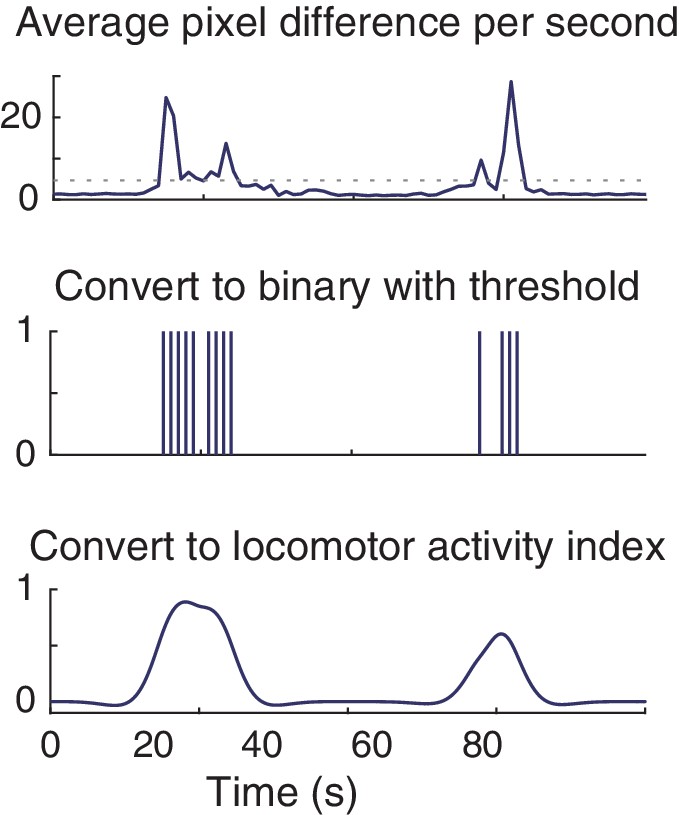
Measurement of locomotor activity.
Illustration showing how the continuous measure of body movement, or ‘locomotor activity’, was calculated for each session. Average pixel differences were taken between adjacent video frames in each observational session. A 90% threshold was used to convert average pixel differences to binary immobile-mobile values and smoothed with a spline (smoothing parameter of 0.10).
Figure 4 with 1 supplement
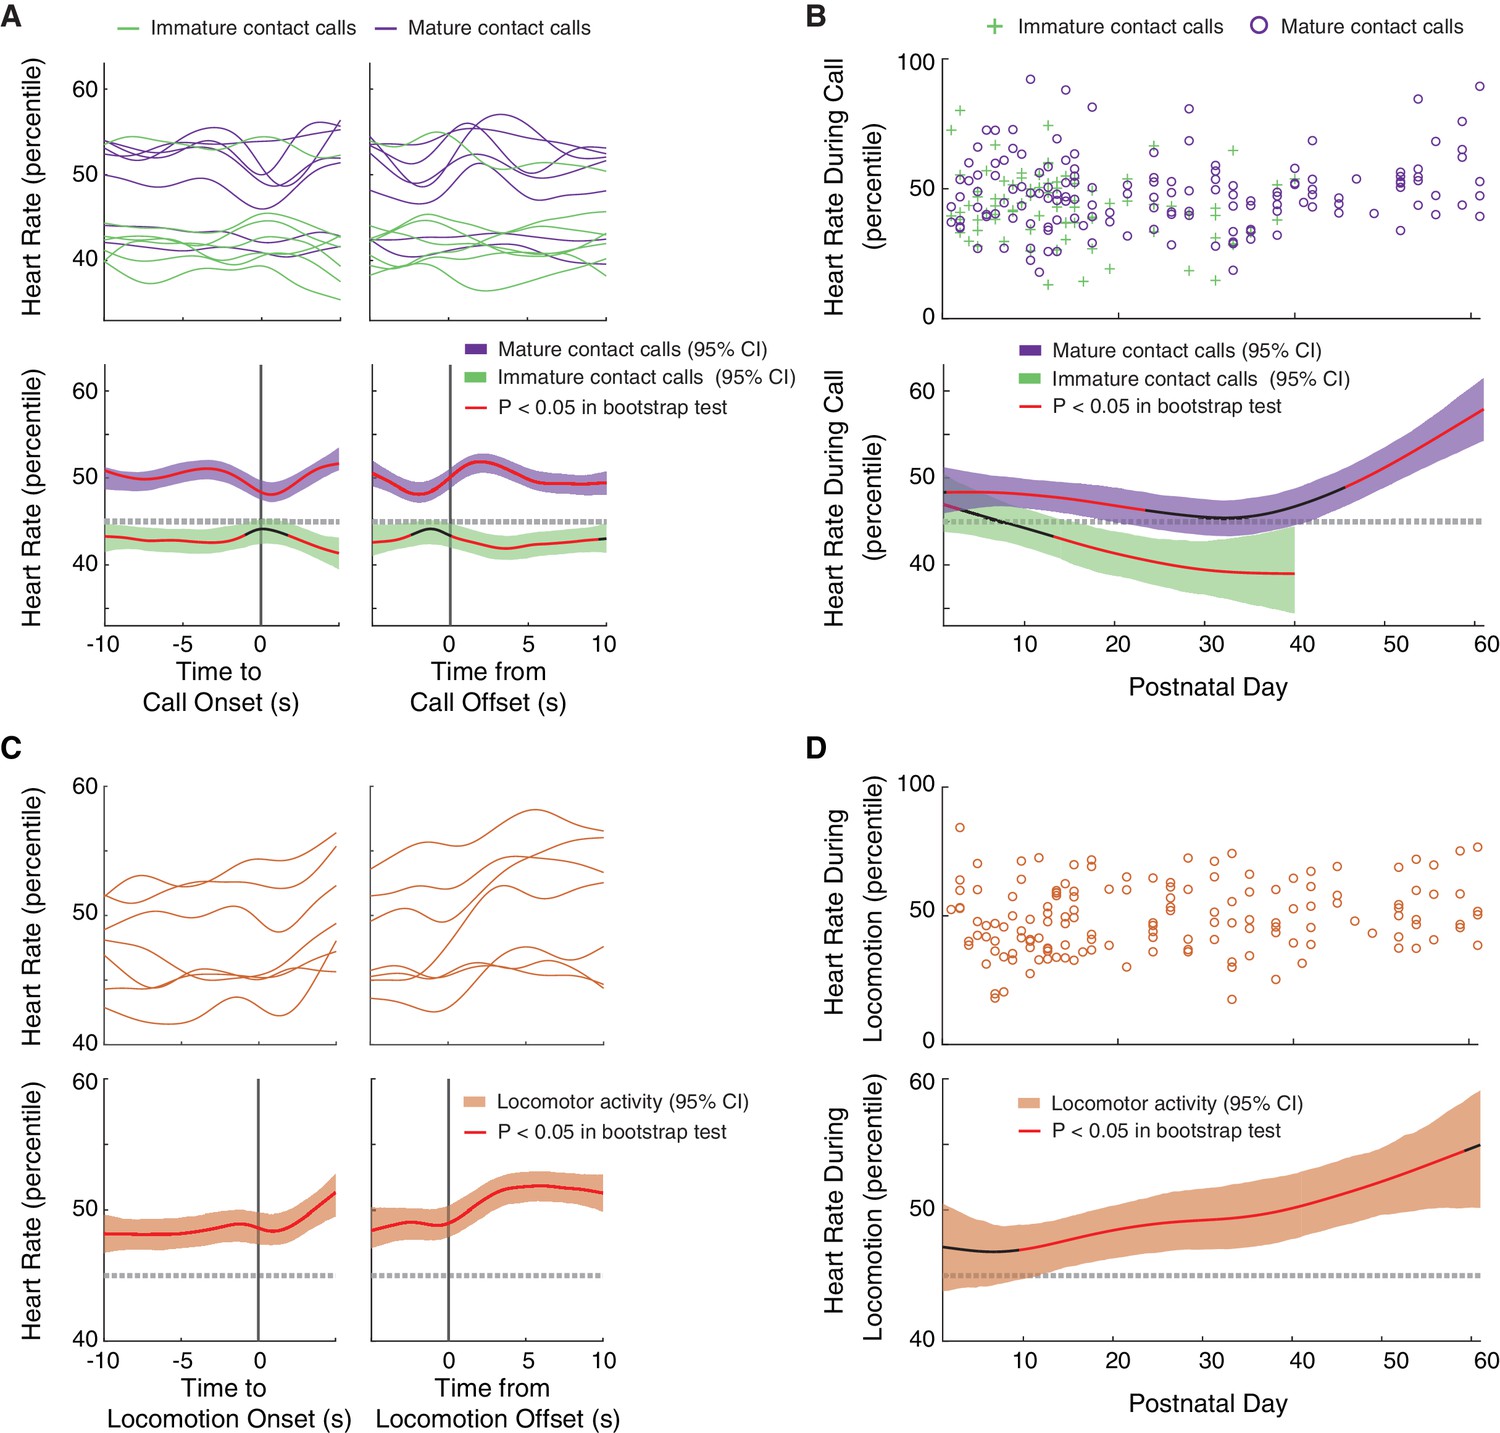
Mature contact calls and locomotor activity are more likely to occur during elevated arousal levels later in development.
(A) Arousal fluctuations from 10 s before to 10 s after contact call production. (A, top) Subject averages (one line per subject) of cubic splines fit to arousal level fluctuations surrounding cries (green lines) and phees (purple lines). (A, bottom) Colored cubic splines fit to population data are plotted with a 95% bootstrapped confidence interval (green – cries, purple – phees). Red line indicates observed values outside of the 95% threshold of the bootstrapped significance test. (B) Fluctuations in arousal levels during contact calls across development. (B, top) Arousal levels during cries (green pluses) and phees (purple circles) for all observation sessions. (B, bottom) Colored cubic splines fit to population data are plotted with a 95% bootstrapped confidence interval (green – cries, purple – phees). Red line indicates observed values outside of the 95% threshold of the bootstrapped significance test. (C) Arousal fluctuations from 10 s before to 10 s after locomotor activity. (C, top) Subject averages (one line per subject) of cubic splines fit to arousal level fluctuations surrounding locomotor events (orange lines). (C, bottom) A colored cubic spline (orange) fit to population data is plotted with a 95% bootstrapped confidence interval. Red line indicates observed values outside of the 95% threshold of the bootstrapped significance test. (D) Fluctuations in arousal levels during locomotor activity across development. (D, top) Arousal levels during locomotor events (orange circles) for all observation sessions. (D, bottom) A colored cubic spline (orange) fit to population data is plotted with a 95% bootstrapped confidence interval. A red line indicates observed values outside of the 95% threshold of the bootstrapped significance test, and a black line indicates observed values inside of the 95% threshold.
Figure 4—figure supplement 1
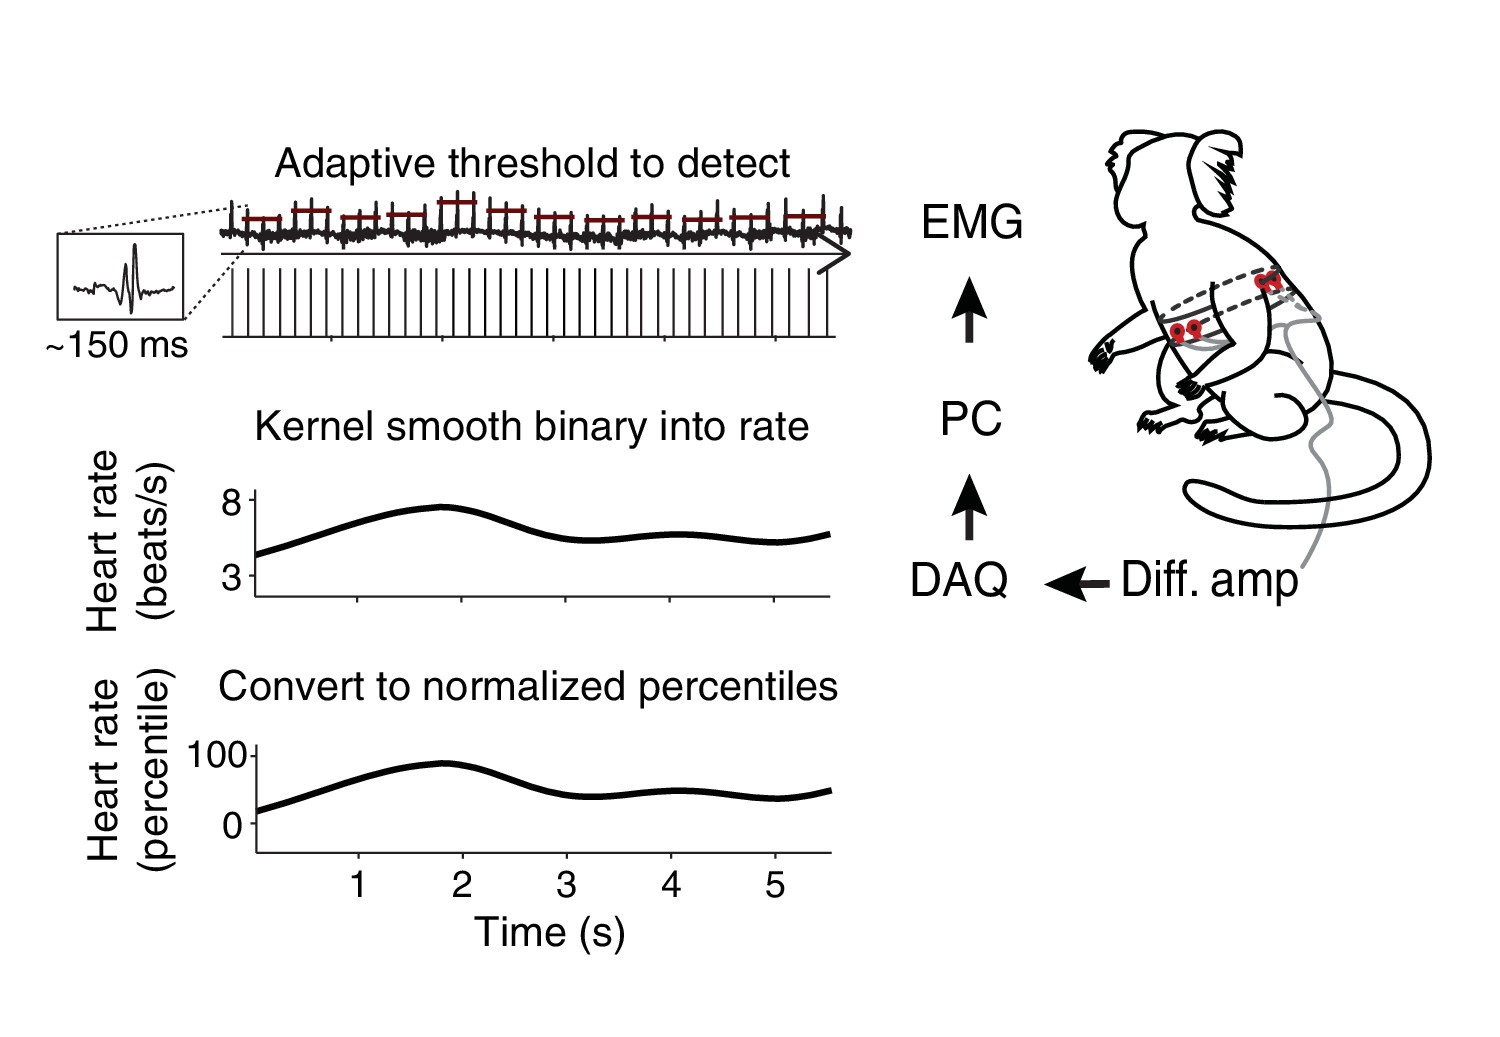
Measurement of arousal state.
Illustration showing how heart rate signal was measured from electrocardiographic (ECG) signal. Surface electrodes were applied to the dorsal and ventral thorax of infant marmosets. Signals were process through a differential amplifier (Diff. amp) before being sent to the data acquisition (DAQ) system and the personal computer (PC). The cardiac signal output was isolated (exemplar shown), filtered, and an adaptive threshold was used to detect spikes exceeding the 95% percentile of the signal. Spikes are converted in a binary signal and smoothed with a 1 s Gaussian kernel to extract ongoing heart rate.
Figure 5
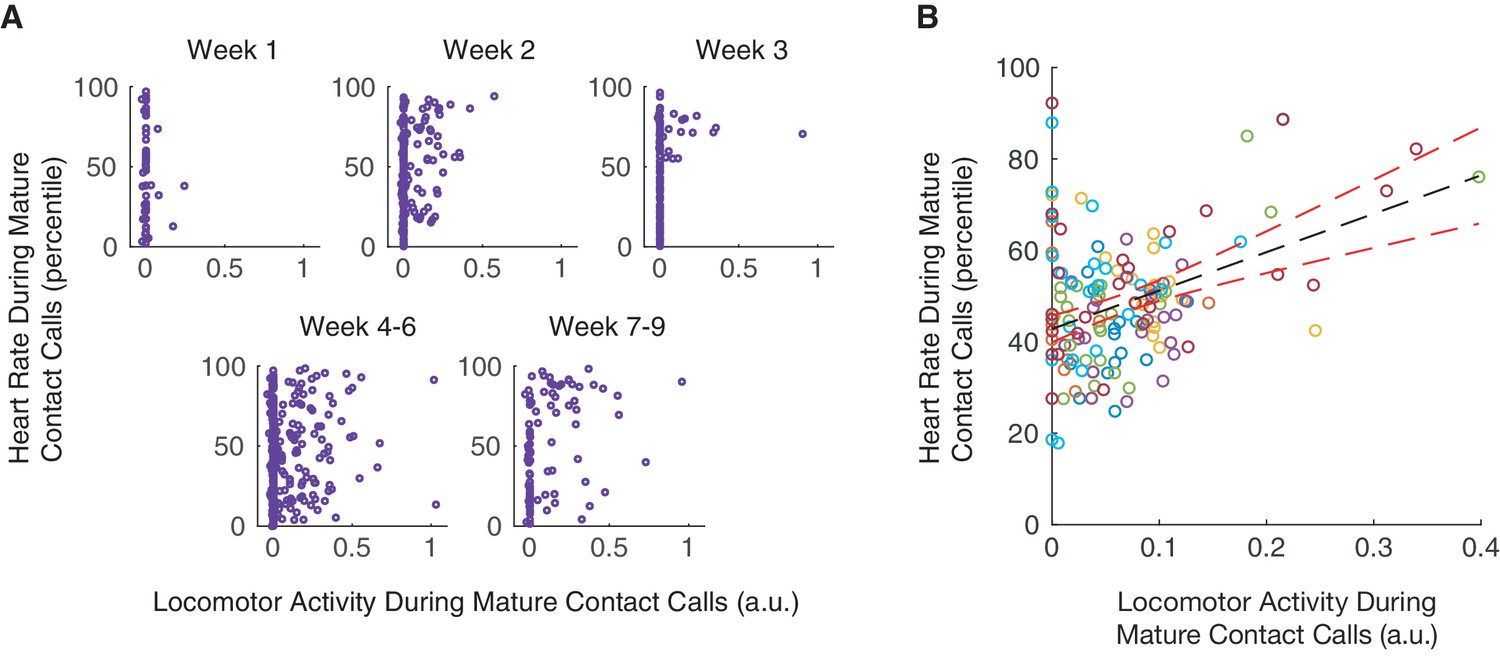
Coordination of mature contact calls with locomotor activity occurs during elevated arousal levels.
(A) Plots of locomotor activity and heart rate percentiles during contact calls in one infant. Purple circles represent mature contact calls (phees). (B) Plot of heart rate percentiles and locomotor activity during mature contact calls (phees). Points represent subject averages (one color per subject) per day and fit with a linear regression (black dotted line) with 95% confidence intervals (red dotted lines).
Tables
Table 1
Results of linear mixed models (LMMs) to test whether proportion of time spent in vocal-postural-locomotor behaviors changes with postnatal day.
For each model, the proportion of vocal, postural, or locomotor time (per postnatal day) spent engaged in a behavior is the dependent variable, postnatal day is the fixed effect, and infant identity is the random effect. For each behavior category, a Bonferroni-Holmes correction was applied to adjust p-values.
| Behavior | β (SE) | T value | Adjusted P | Classification |
|---|---|---|---|---|
| Vocal behaviors (n = 192 observation days) | ||||
| Cry | −0.0128 (0.0019) | 6.88 | 0.0011 | immature |
| Phee | 0.0129 (0.0017) | 7.43 | 0.0004 | mature |
| Postural behaviors (n = 201 observation days) | ||||
| Forelimb support | −0.0010 (0.0020) | 0.51 | >0.05 | NA |
| Hanging | −0.0018 (0.0011) | 1.67 | >0.05 | NA |
| Hindlimb support | 0.0130 (0.0034) | 3.78 | 0.0373 | mature |
| Raising head | −0.0021 (0.0009) | 2.32 | >0.05 | NA |
| Righting reflex | −0.0081 (0.0015) | 5.54 | 0.0020 | immature |
| Locomotor behaviors (n = 191 observation days) | ||||
| Climbing | −0.0023 (0.0011) | 2.10 | >0.05 | NA |
| Crawling | −0.0160 (0.0019) | 8.35 | 0.0019 | immature |
| Digging | 0.0033 (0.0011) | 3.03 | >0.05 | NA |
| Jumping | 0.0005 (0.0002) | 2.37 | >0.05 | NA |
| Walking | 0.0147 (0.0012) | 11.95 | <0.0001 | mature |
Additional files
-
Transparent reporting form
- https://doi.org/10.7554/eLife.41853.010
Download links
A two-part list of links to download the article, or parts of the article, in various formats.
Downloads (link to download the article as PDF)
Open citations (links to open the citations from this article in various online reference manager services)
Cite this article (links to download the citations from this article in formats compatible with various reference manager tools)
Vocal and locomotor coordination develops in association with the autonomic nervous system
eLife 8:e41853.
https://doi.org/10.7554/eLife.41853


