Absence of TGFβ signaling in retinal microglia induces retinal degeneration and exacerbates choroidal neovascularization
- National Eye Institute, National Institutes of Health, United States
Figures
Figure 1
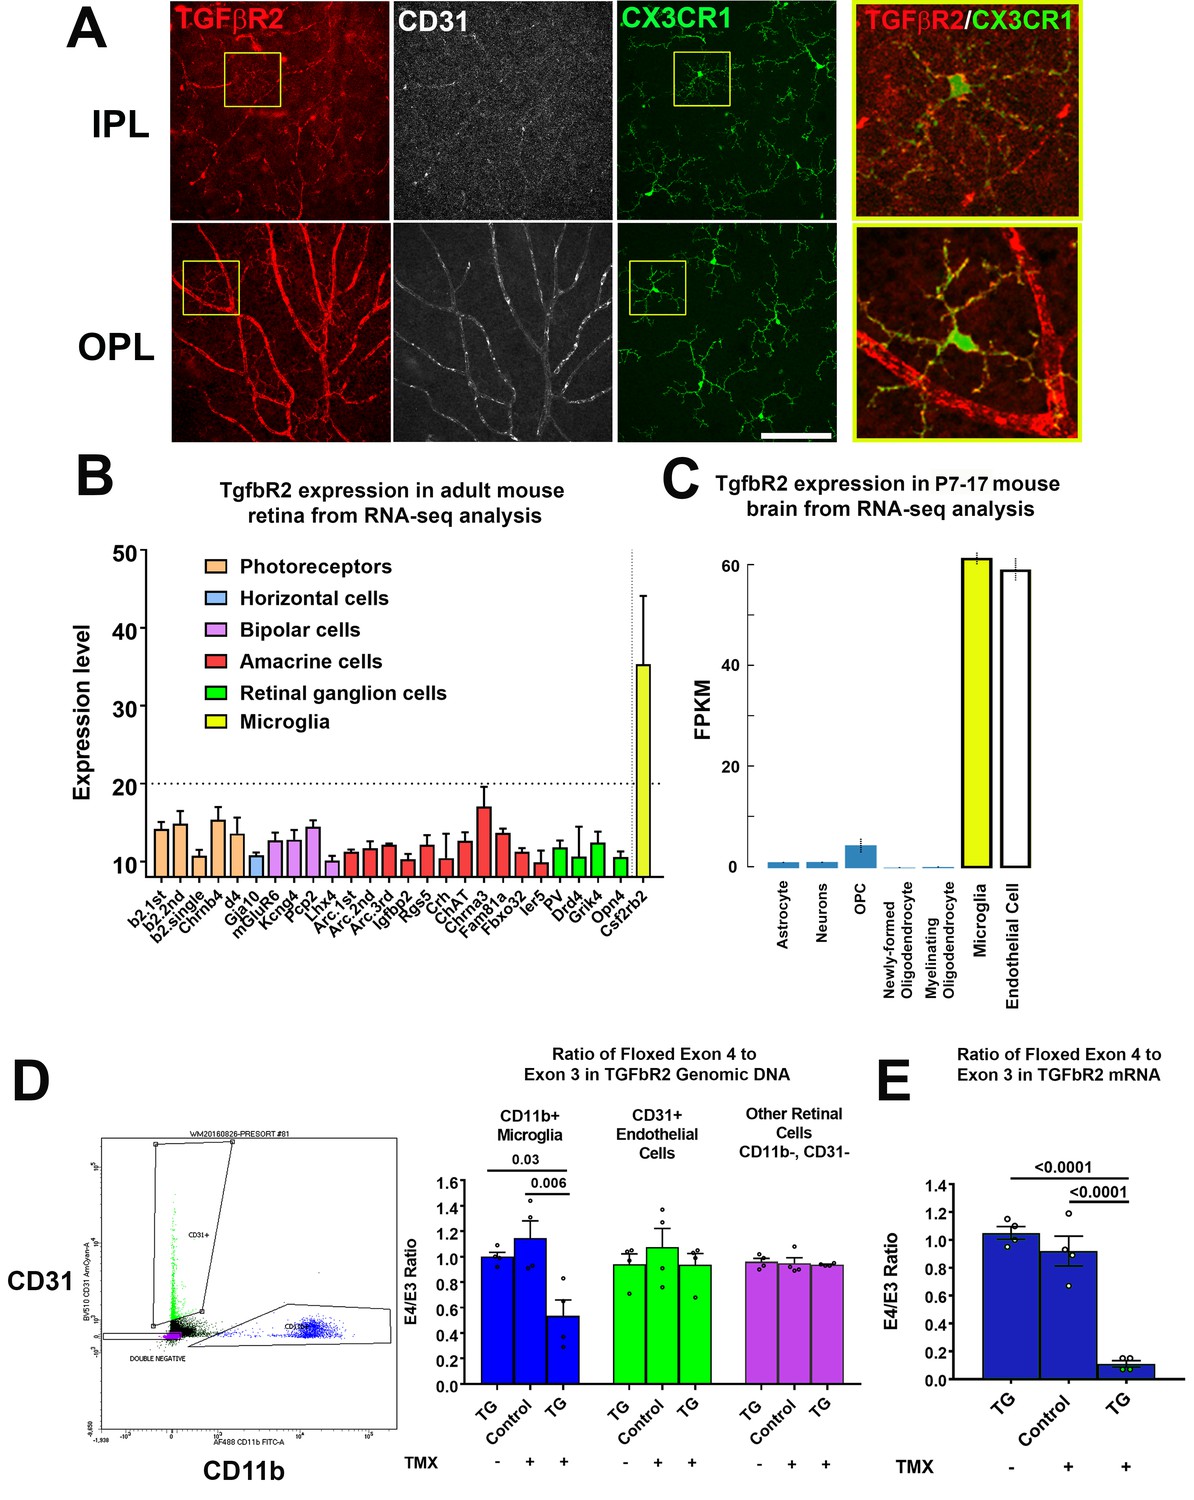
TGFBR2 is constitutively expressed in adult mouse retinal microglia and is specifically ablated in retinal microglia of adult Cx3Cr1CreER/+,Tgfbr2flox/flox (TG) mice upon tamoxifen induction.
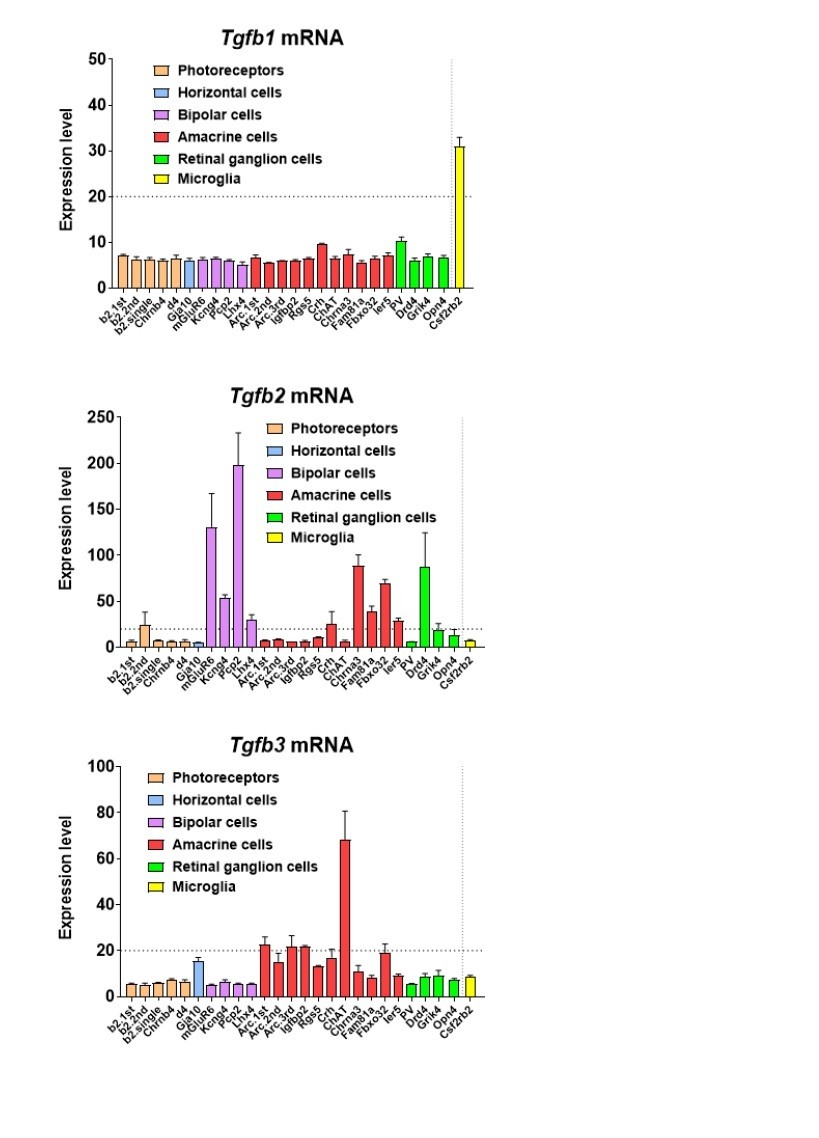
(A) Immunohistochemical labeling for TGFBR2 (red) in the adult CX3CR1+/GFP mouse retina was localized prominently to CD31-immunopositive vascular endothelial cells (white) and to CX3CR1-expressing, GFP+ microglia cells (green) in both the inner and outer plexiform layers (IPL, OPL). Insets (yellow boxes) show microglia demonstrating colocalization of microglial marker CX3CR1 with TGFBR2. Scale bar = 100 µm. (B) Reference to an atlas of specific cell type transcriptomes from the adult mouse retina highlighted constitutive expression of Tgfbr2 mRNA in retinal microglia, with very low or no expression in different classes of retinal neurons (expression levels >20 correspond to significant expression). (C) Reference to an atlas of specific cell type transcriptomes from the neonatal (P7-17) mouse brain indicated significant levels of constitutive expression in microglial and endothelial cell populations, with considerably lower expression in other brain neuronal and glial cell types. (D) Specific ablation of Tgfbr2 expression from retinal microglia of Cx3Cr1 CreER /+,TGFbR2flox/flox (TG) mice was enabled by tamoxifen (TMX)-induced Cre recombinase activity in CX3CR1-expression microglia, resulting in the genetic excision of exon 4 of the Tgfbr2 gene. CD11b+ microglia (blue points) and CD31+ endothelial cells (green points) were sorted from retinas of untreated TG mice, and from control and TG mice 3 weeks after tamoxifen administration using flow cytometry and analyzed. Cre recombinase-mediated excision of exon 4 of the Tgfbr2 gene from the genomic DNA in microglial, endothelial, and the remaining retinal cell types (purple points) was assessed using qPCR; CD11b+ microglia demonstrated a significant loss of exon 4 relative to the exon 3 in TMX-treated TG animals, but not in untreated TG or TMX-treated control animals. Exon 4 excision was not observed in non-microglial cell types. (E) Quantitative rtPCR analysis demonstrated a corresponding reduction in the transcription of exon 4 of Tgfbr2 mRNA from flow-sorted CD11b+ retinal microglia of TMX-treated TG animals relative to those of TMX-treated control animals and TG animals not treated with TMX. (Graphical data in (D) an (E) are presented as means ± SEM; p values are from one-way analysis of variance (ANOVA) and Sidak’s multiple comparison test, n = 4 animals of mixed sex for each group).
Figure 2
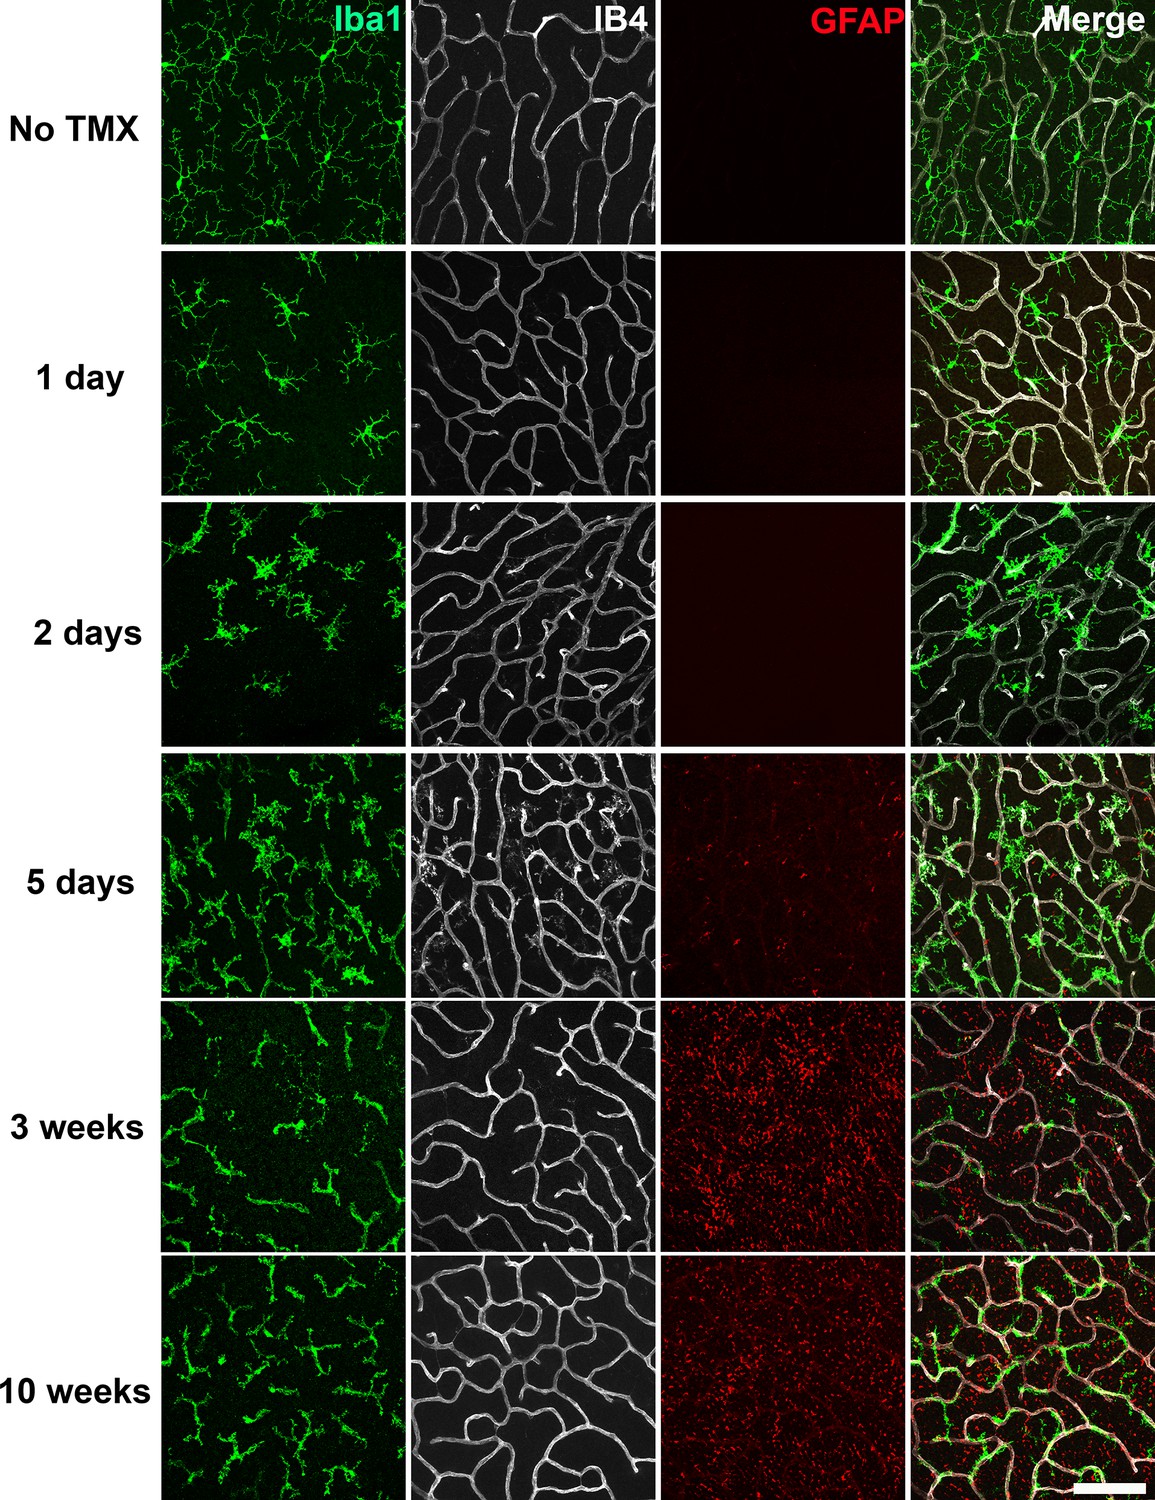
Specific TGFBR2 ablation in retinal microglia induces rapid and progressive changes in microglial morphology and distribution.
The time course of morphological changes in retinal microglia following tamoxifen (TMX)-induced ablation of TGFBR2 expression was followed using immunohistochemical analysis in retinal flat-mounts. Panels show changes at the level of the OPL; microglia were labeled using an antibody to IBA1 and retinal vessels labeled with IB4. Gliotic changes in radial Müller glia processes were marked using an antibody to GFAP. At 1 day following TMX administration, a slight reduction in ramification in microglia processes was observed. From 2–5 days post-TMX, a further decrease in microglial ramification and an increase in microglia numbers were detected. From 3–10 weeks post-TMX, retinal microglia transitioned to a branched morphology, demonstrating a close fasciculation with the retinal vasculature. GFAP immunopositivity in Müller glia was prominently upregulated at this time. Scale bar = 100 µm.
Figure 3 with 2 supplements
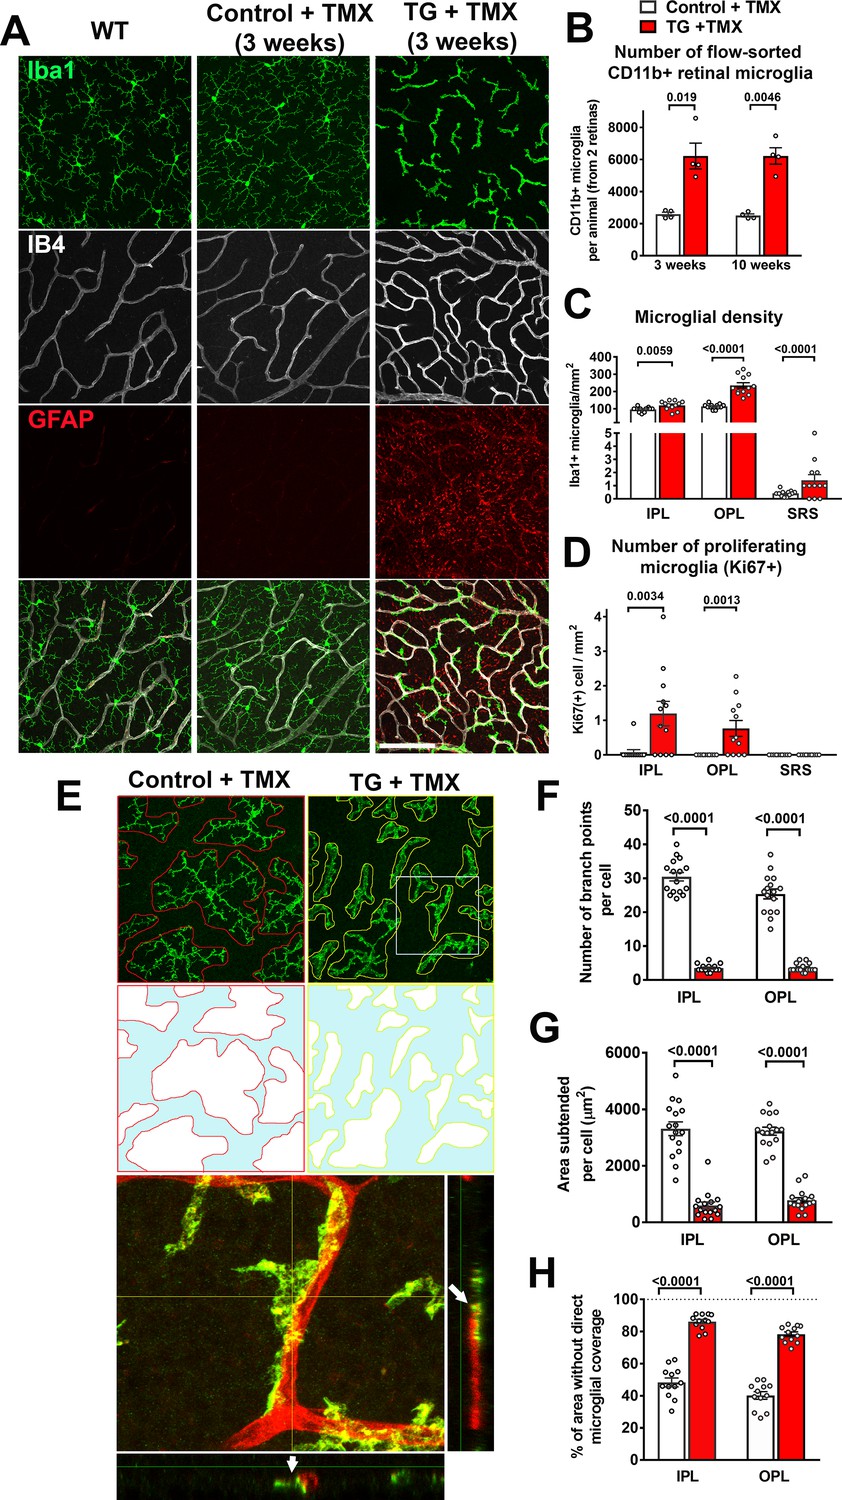
Specific TGFBR2 ablation in retinal microglia induces abnormalities in microglial density, distribution, and morphology.
(A) TG animals administered tamoxifen (TMX) 3 weeks prior, relative to wild type (WT) mice and control mice, demonstrated that TGFBR2 ablation resulted in increased microglial numbers and decreased ramification in the OPL. Scale bar = 100 µm. (B) Analysis of CD11b+ microglia numbers in each animal (two retinas combined) using flow-cytometry showed a significant increase in microglial numbers in TG vs. control animals at 3- and 10 weeks post-TMX. Manual counts of Iba1 +microglia numbers (C) and proliferating Ki67+, Iba1 +microglia (D) in retinal flat-mounts from animals 4 weeks post-TMX demonstrated increases at the levels of the IPL, OPL, and subretinal space (SRS) in TG vs. control retina. (E) TGFBR2-ablated microglia 4 weeks post-TMX showed reduced process ramification and decreased dendritic area (as highlighted in outlines of individual microglial dendritic arbors). TGFBR2-ablated microglia demonstrated branched morphologies (example shown in yellow box, expanded in inset) that showed close adherent contact with IB4-labelled (red) retinal vessels (arrows indicating points of contact). Scale bar = 100 µm. Morphological analysis of individual microglia showed significant decreases in the number of branch points (F) and in the areas of individual arbors (G) of microglia in both IPL and OPL in TGFBR2-ablated microglia. Despite having increased numbers of total microglia, TMX-treated TG retinas have a greater proportion of retinal area not directly occupied by microglial processes (H, areas highlighted in blue), indicating decreased microglial coverage. Graphical data are presented as means ± SEM; p values are from unpaired t-test with Welch’s correction, data points in (C), (D), and (H) represent four individual imaging fields from three animals in each group, those in (F) and (G) represent 16 individual microglia cells from four animals in each group).
Figure 3—figure supplement 1
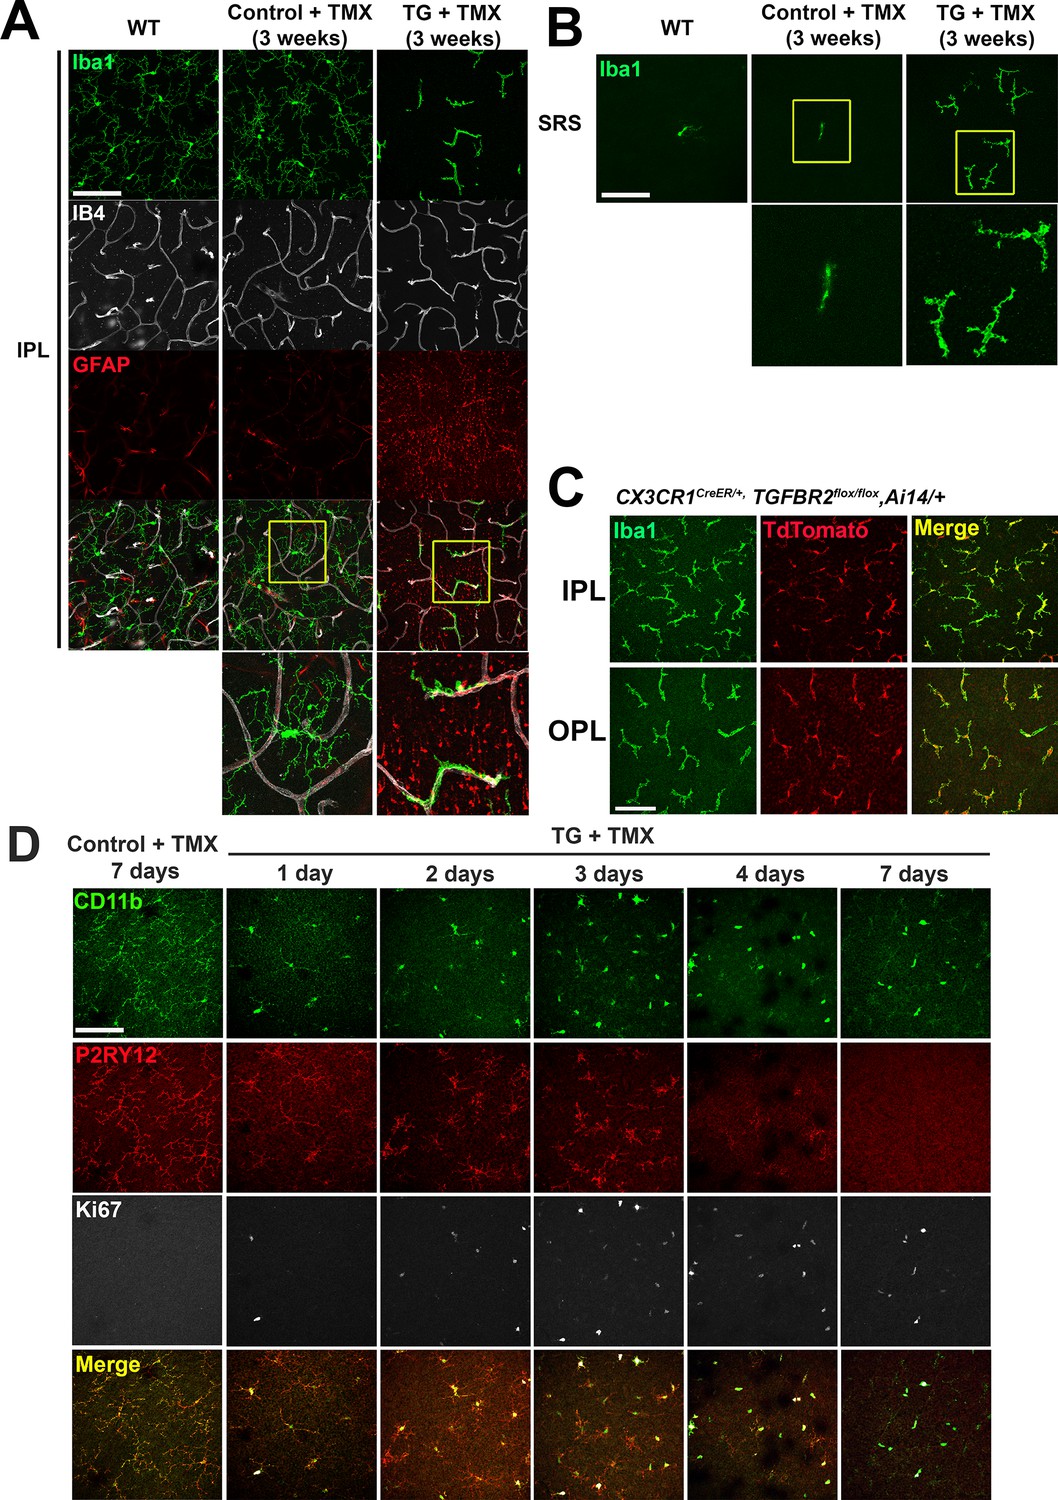
Specific TGFBR2 ablation in retinal microglia induces alterations in microglial morphology in the IPL and SRS.
(A, B) Comparison of retinal flat-mounts from untreated wild type animals, control and TG animals administered tamoxifen (TMX) at the 3 week post-TMX time point demonstrated a transition from a ramified to a branched morphology in TG animals, but in control animals. Images of microglia at the level of the inner plexiform layer (IPL) (A) and subretinal space (SRS) (B) are shown. Microglia in TG animals in the IPL transitioned to a branched morphology, adhering closely to retinal vessels but those in WT and TMX-treated control animals remained unchanged. Insets (yellow boxes) show examples at higher magnification. (C) Cx3cr1CreER/+, TGFBR2flox/flox, Ai14/+ mice, in which tamoxifen-induced Cre recombination induced specific ablation of TGFBR2 and expression of tdTomato in CX3CR1-expressing microglia and monocytes, were analyzed 4 months after tamoxifen to allow sufficient time for systemic monocytes to be turned over and become tdTomato-negative. All IBA1+ microglia in both the IPL and OPL demonstrated tdTomato labeling, indicating that ongoing monocyte infiltration did not contribute to the population of TGFBR2-deficient myeloid cells in the retina. (D) Comparison of retinal flat-mounts from control and TG animals administered tamoxifen (TMX) at the level of the OPL revealed that P2RY12 immunopositive endogenous microglia in TG animals all demonstrated a progressive loss of ramification and an acquisition of Ki67-immunopositivity in the first 3 days following TMX administration, indicating that morphological transformation and cellular proliferation occurred in resident microglia. Infiltrating monocytes, (which would have been CD11b+, P2RY12-) were not detected at any timepoint. Deramified microglia gradually decreased in P2RY12 immunopositivity at 4 days and was undetectable by 7 days following TMX. Scale bars = 100 µm.
Figure 3—figure supplement 2
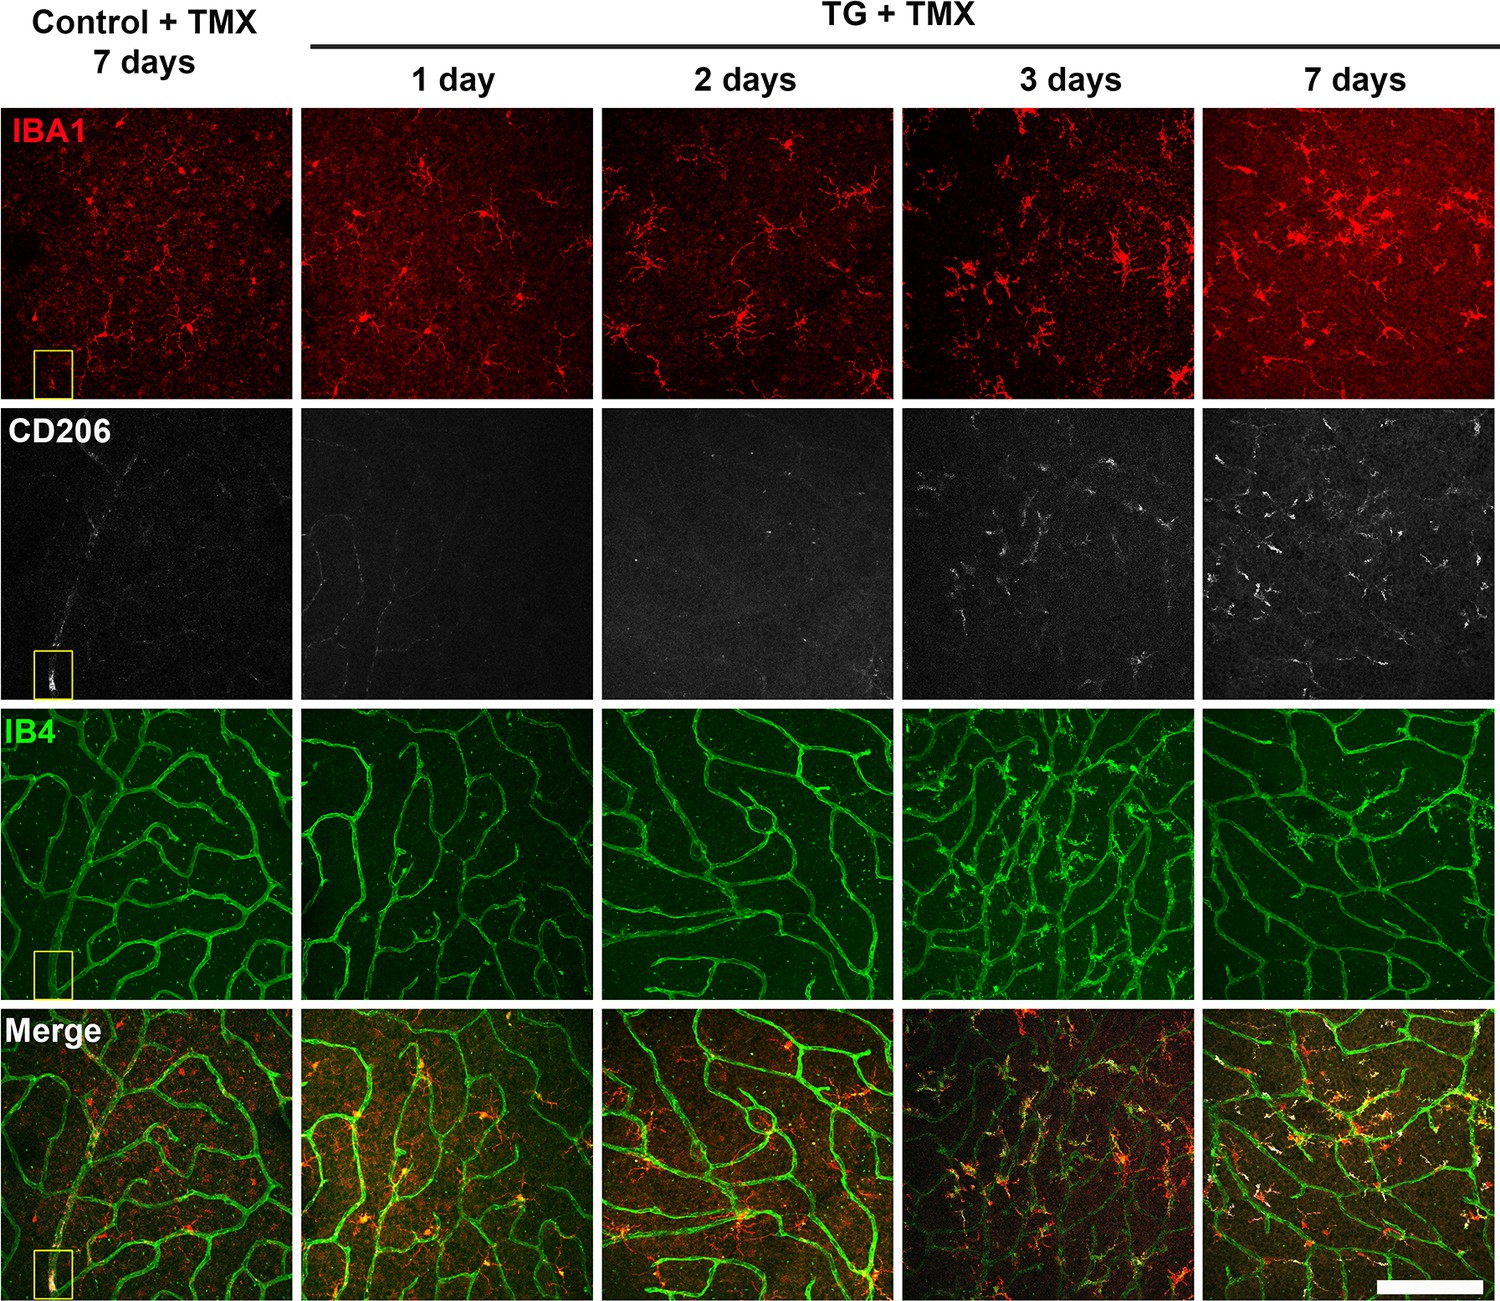
TGFBR2 ablation in retinal microglia induces expression of CD206, a marker associated with perivascular macrophages.
Flat-mounted retinas from tamoxifen (TMX)-administered control and TG mice were isolated within 7 days of TMX administration and analyzed with IBA1 and CD206 immunohistochemistry and IB4 staining. Panels show images taken in the OPL of retinas analyzed. In control retina, no immunohistochemical changes were noted following TMX; sparse numbers of CD206+ perivascular microglia (yellow box) were observed around the larger retinal vessels. In TG animals, TMX-mediated TGFBR2 ablation induced progressive deramification changes in retinal microglia beginning at 1–2 post-TMX; beginning at 3 days, retinal microglia become increasingly immunopositive for CD206 and IB4 (a marker of vascular endothelial cells and activated microglia). Scale bar = 100 µm.
Figure 4 with 1 supplement

Constitutive expression of microglial ‘sensome’ genes are downregulated upon TGFBR2 ablation in retinal microglia.
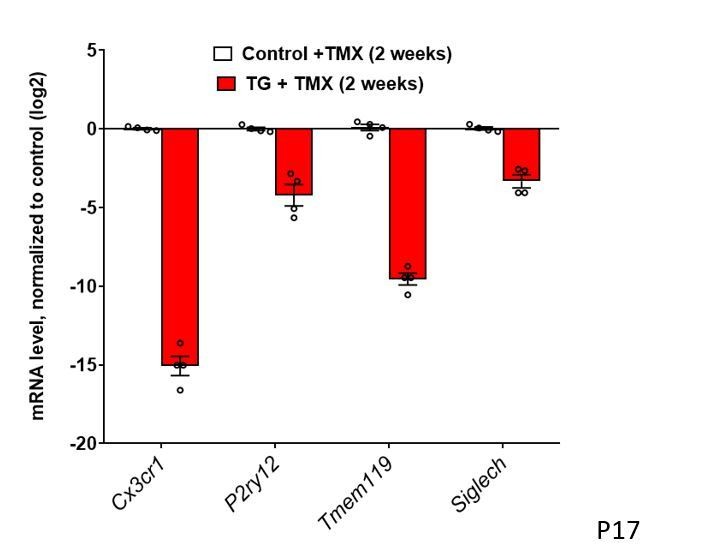
(A) Retinal microglia from control and TG mice were isolated by flow-cytometry 2 weeks following tamoxifen (TMX) administration and mRNA levels of microglial ‘sensome’ genes compared using qPCR. mRNA levels of Cx3cr1, P2yr12, Tmem119, and Siglech were all significantly decreased in microglia from TG vs. control mice. (B) Microglia from the retinas of WT mice were cultured and exposed to media containing TGFB1 (10 or 20 ng/ml), or TGFB2 (10 ng/ml) (media containing 10 ng/ml of BSA served as a control), and mRNA levels of microglial ‘sensome’ genes compared following 24 hr of exposure. mRNA levels of Tmem119 and Siglech were increased by TGFBR2 ligands (TGFB1 or TGFB2), indicating positive regulation of microglial ‘sensome’ genes via TGFBR2-mediated signaling. (C, D) As TG animals contained an IRES-EYFP cassette 3’ to CreERT recombinase in the Cx3cr1 locus, EYFP expression, as regulated by the Cx3cr1 promoter, could be constitutively detected in IBA1-immunopositive retinal microglia in control animals. In TG animals at 3 weeks post-TMX, Cx3cr1-driven EYFP fluorescence was diminished in Iba1+ microglia, indicating downregulation of Cx3cr1 promoter activity. (E, G) Immunohistochemical analysis of TMEM119 showed strong colocalization with Iba1 in microglia of control animals but decreased immunopositivity in TGFBR2-ablated microglia in TG animals. Scale bars = 100 µm. Graphical data in (A), (B), (D) and (F) are presented as means ± SEM; p values in (A), (D), and (F) are from multiple t-tests, while that in (B) are from 2-way ANOVA analysis with Sidak’s multiple comparisons test, * indicate p<0.05 for comparisons relative to control, data points indicate individual biological repeats in (A) and (B), and four imaging fields from three animals in each group in (D) and (F).
Figure 4—figure supplement 1
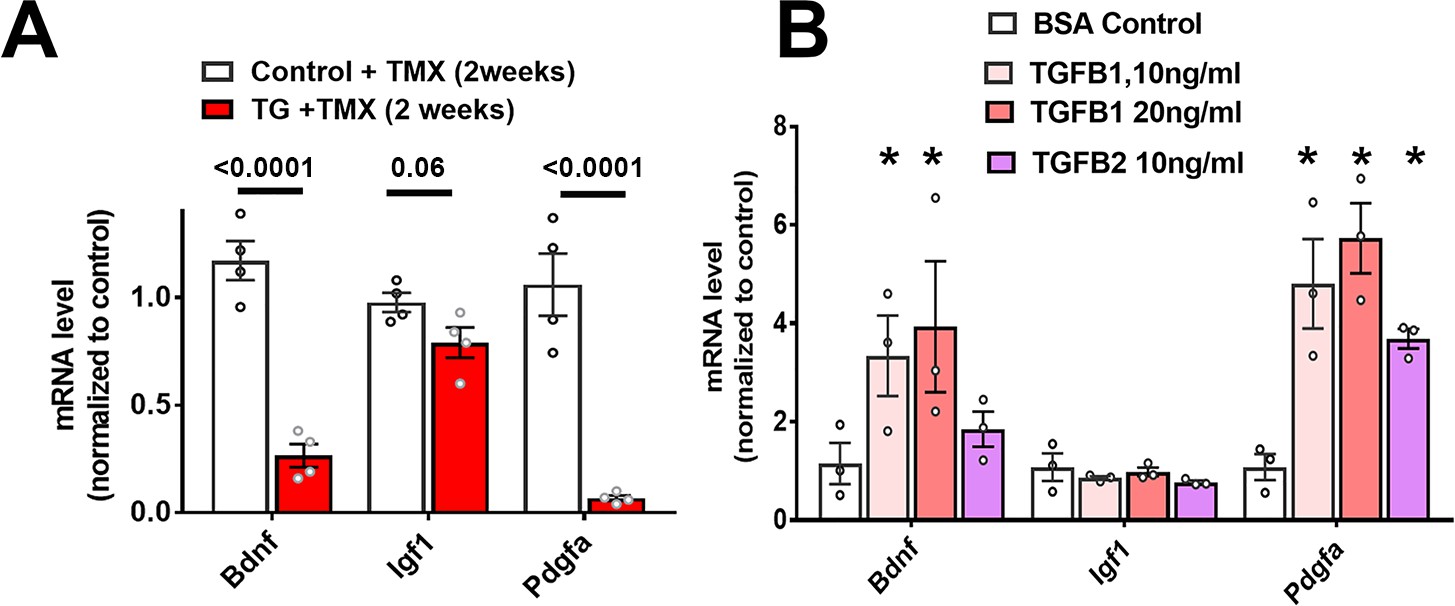
Expression of growth factors genes are downregulated in microglia upon TGFBR2 ablation.
(A) Retinal microglia from tamoxifen (TMX)-administered control and TG mice were isolated by flow-cytometry 2 weeks post-TMX and mRNA levels of growth factors analyzed and compared using qPCR. mRNA levels for Bdnf and Pdgfa, but not Igf1, were significantly decreased in microglia from TG vs. control mice. (B) Microglia from the retinas of WT mice were cultured and exposed to media containing TGFB1 (10 or 20 ng/ml), or TGFB2 (10 ng/ml) (media containing 10 ng/ml of BSA served as a control), and mRNA levels of microglial-expressed genes compared following 24 hr of exposure. mRNA levels of Bdnf and Pdgfa were increased by TGFBR2 ligands (TGFB1 or TGFB2). Graphical data are presented as means ± SEM; p values are from 2-way ANOVA analysis with Sidak’s multiple comparisons test, * indicate p<0.05 for comparisons to control, data points indicate three biological repeats in each group.
Figure 5 with 1 supplement
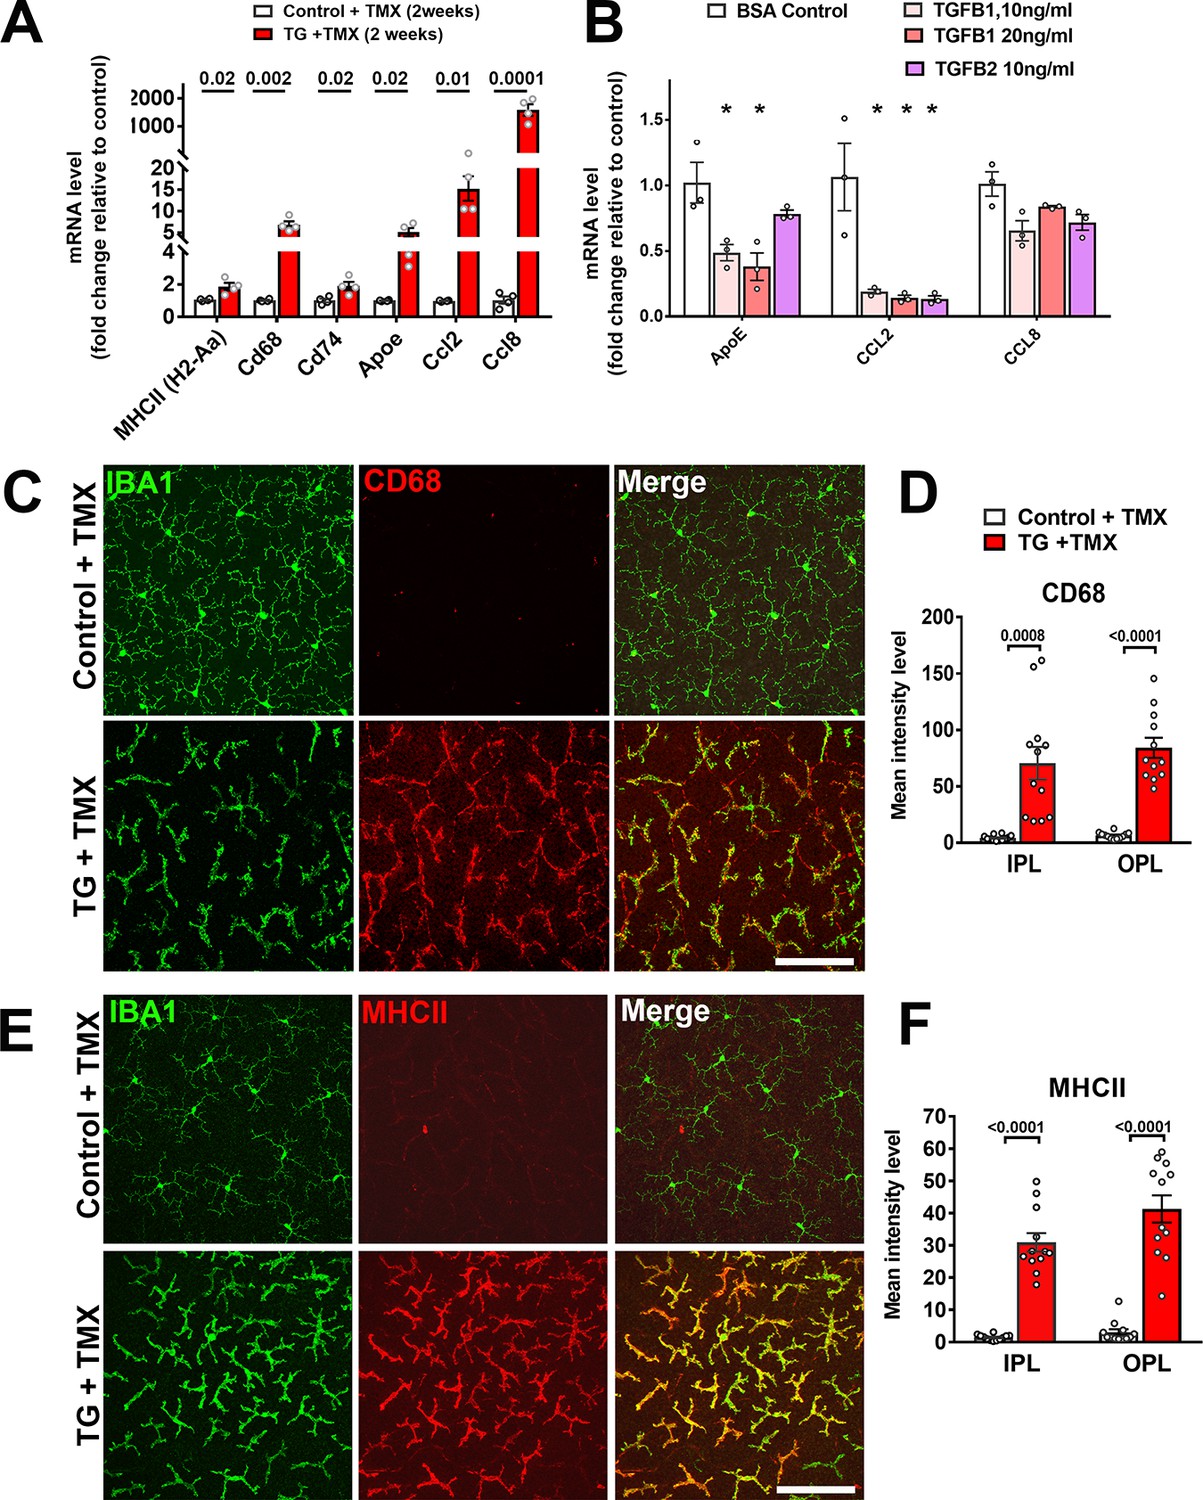
Expression of genes associated with microglial activation are upregulated on TGFBR2 ablation in retinal microglia.
(A) Retinal microglia from control and TG mice were isolated by flow-cytometry 2 weeks following tamoxifen (TMX) administration and mRNA levels of genes associated with microglial activation and inflammatory chemokines were analyzed and compared using qPCR. mRNA levels for H2-Aa (MHCII), Cd68, Cd74, Apoe, Ccl2, and CCl8 were all significantly increased in microglia from TG vs. control mice. (B) Microglia from the retinas of WT mice were cultured and exposed to media containing TGFB1 (10 or 20 ng/ml), or TGFB2 (10 ng/ml) (media containing 10 ng/ml of BSA served as a control), and mRNA levels of microglial-expressed genes compared following 24 hr of exposure. mRNA levels of Apoe and Ccl2 were decreased by TGFBR2 ligands (TGFB1 or TGFB2), indicating negative regulation of microglial activation genes via TGFBR2-mediated signaling. Immunohistochemical analysis of control vs. TG microglia in retinal flat-mounts showed prominent and significant upregulation of activation markers CD68 (C, D) and MHCII (E, F) in Iba1+ microglia in both the IPL and OPL. Scale bars = 100 µm. (Graphical data in (A), (B), (D) and (F) are presented as means ± SEM; p values in (A), (D), and (F) are from multiple t-tests, while that in (B) are from 2-way ANOVA analysis with Sidak’s multiple comparisons test, * indicate p<0.05 for comparisons to control, data points indicate individual biological repeats in (A) and (B), and four imaging fields from 3 to 4 animals in each group in (D) and (F)).
Figure 5—figure supplement 1
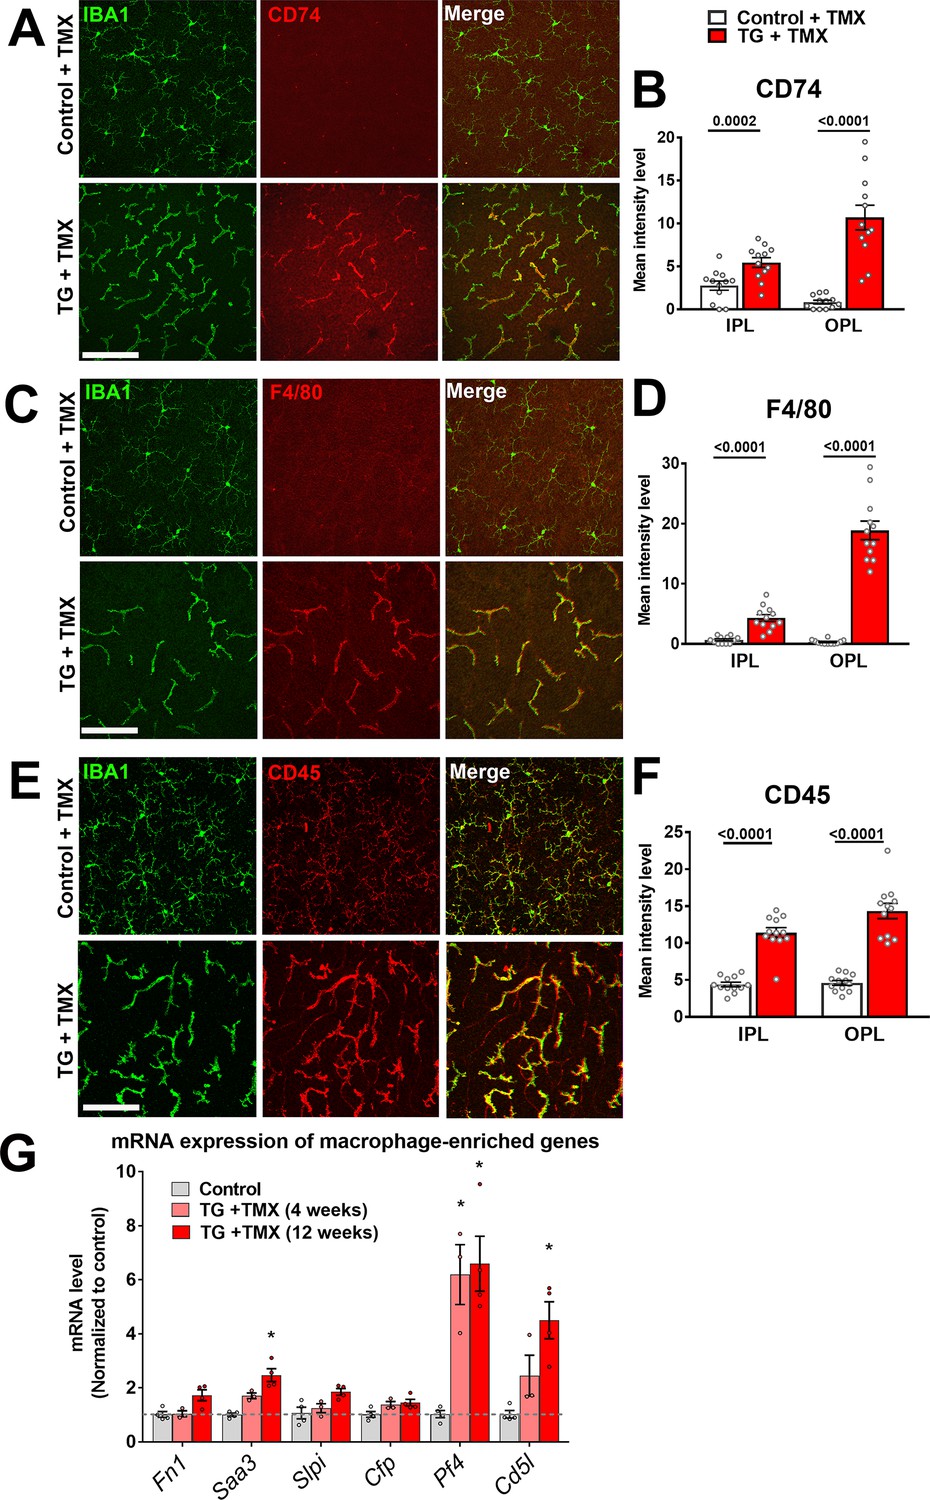
Specific TGFBR2 ablation in microglia induces expression of markers of microglial activation.
Immunohistochemical analysis of control vs. TG microglia in retinal flat-mounts showed prominent and significant upregulation of activation markers CD74 (A, B), F4/80 (C, D) and CD45 (E, F) in Iba1 +microglia in both the IPL and OPL following TGFBR2 ablation (2 weeks following TMX administration). Scale bars = 100 µm. (G) RT-PCR analysis of mRNA expression found that following TGFBR2 ablation, transcripts that are selectively enriched in peripheral macrophages over homeostatic microglia under progressive upregulation. (Graphical data in (B), (D), (F) and (G) are presented as means ± SEM; * indicates p<0.05; 2-way ANOVA analysis with Sidak’s multiple comparisons test, data from 3 to 4 animals in each group).
Figure 6
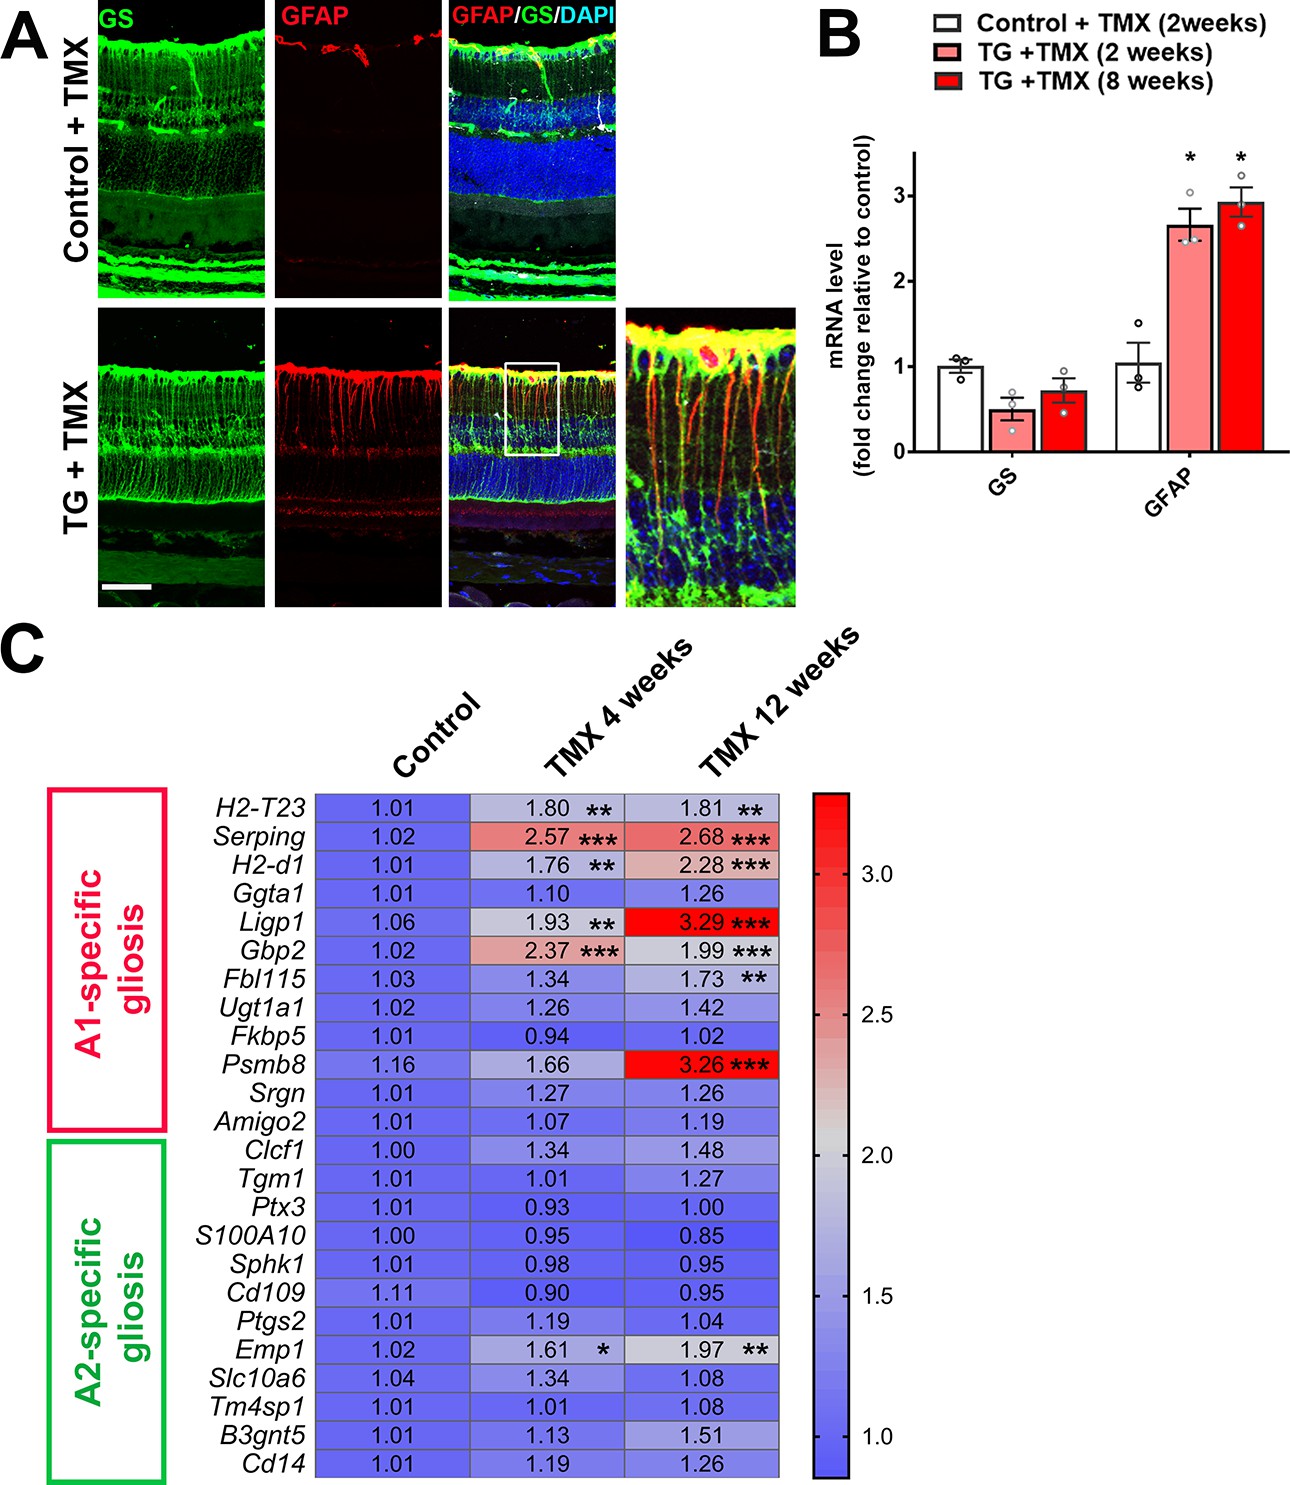
TGFBR2 ablation in retinal microglia induces Müller cell gliosis in the retina.
(A) Immunohistochemical analysis demonstrates upregulation of immunopositivity to GFAP 3 weeks post-TMX in TG animals relative to control animals. GFAP immunopositivity was localized to glutamine synthetase (GS)-labeled Müller cell processes, indicating the induction of Müller cell gliosis. Scale bar = 50 µm. (B) qPCR analysis of retinas isolated from control and TG animals 2 and 8 weeks post-TMX demonstrates a significant upregulation of GFAP mRNA expression following TGFBR2 ablation in retinal microglia. Graphical data are presented as means ± SEM; p values are from one-way analysis of variance (ANOVA) and Sidak’s multiple comparison test, n = 3 animals of mixed sex in each group.(C) RT-PCR analysis of retinal expression of genes associated with A1- and A2-specific astrocytic gliosis following microglial TGFBR2 ablation found progressive upregulation of A1-associated transcripts relative to control, while A2-associated transcripts were relatively unchanged (numbers indicate means, *, **, *** indicate p values < 0.05,<0.01,<0.001 respectively, 2-way ANOVA analysis with Sidak’s multiple comparisons test, data from 3 to 4 animals in each group.).
Figure 7 with 1 supplement
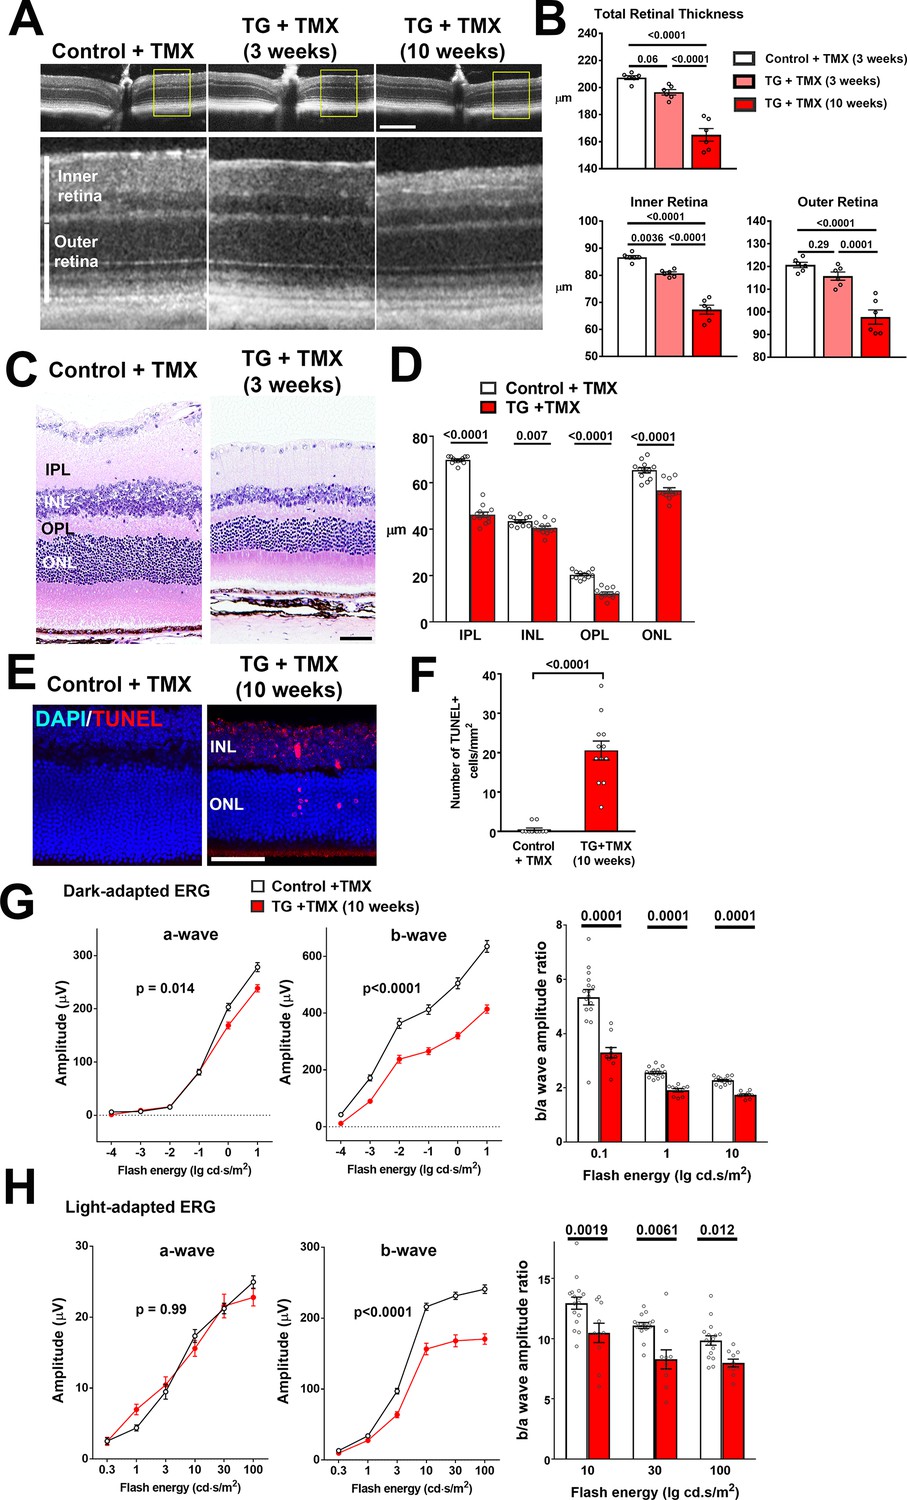
TGFBR2 ablation in retinal microglia induces degenerative changes in the retina.
(A, B) In vivo evaluation of retinal structure by optical coherence tomography (OCT) in control animals and in TG animals 3 and 10 weeks following tamoxifen (TMX)-administration showed a preserved lamination in TG animals (insets at higher magnification in yellow boxes) but a progressive and significant reduction in the total retinal thickness relative to controls. Scale bar = 300 µm. Significant reductions in overall thickness were contributed to by reductions in both the inner (measured from vitreal surface to the outer plexiform layer) and the outer retinal layers (measured from the outer plexiform layer to the apical surface of the RPE layer) (p values are from 1-way ANOVA analysis with Tukey’s multiple comparisons test, data points are from 6 eyes of 3 animals). (C, D) Histological analysis of retinal lamina thicknesses in paraffin-embedded sections show significant decreases in the thickness of the inner plexiform layer (IPL), inner nuclear layer (ONL), outer plexiform layer (OPL), and outer nuclear layer (ONL) in TG animals 3 weeks post-TMX relative to controls (p values are from unpaired t-tests with Welch’s correction, data points are from 3 sections from four animals). Scale bar = 50 µm. (E, F) Evaluation for apoptotic retinal cells using TUNEL labeling demonstrated the emergence of apoptotic cells in both the INL and ONL in TG retinas 10 weeks post-TMX. (p values are from unpaired t-tests with Welch’s correction, data points are from 3 sections from four animals). Scale bar = 50 µm. (G, H) Comparison of electroretinographic (ERG) responses between control vs. TG animals 10 weeks post-TMX demonstrated in dark-adapted responses (G) a small but significant decrease in a-wave amplitude and a marked decrease in b-wave amplitudes in TG animals. Light-adapted responses (H) were similar for a-wave amplitude but significantly decreased in b-wave amplitude. The b-to-a amplitude ratios were significantly decreased in TG animals in both dark- and light-adapted responses for a range of flash intensities (p values are from 2-way ANOVA analysis, data points are both eyes of 8 control and 8 TG animals).
Figure 7—figure supplement 1
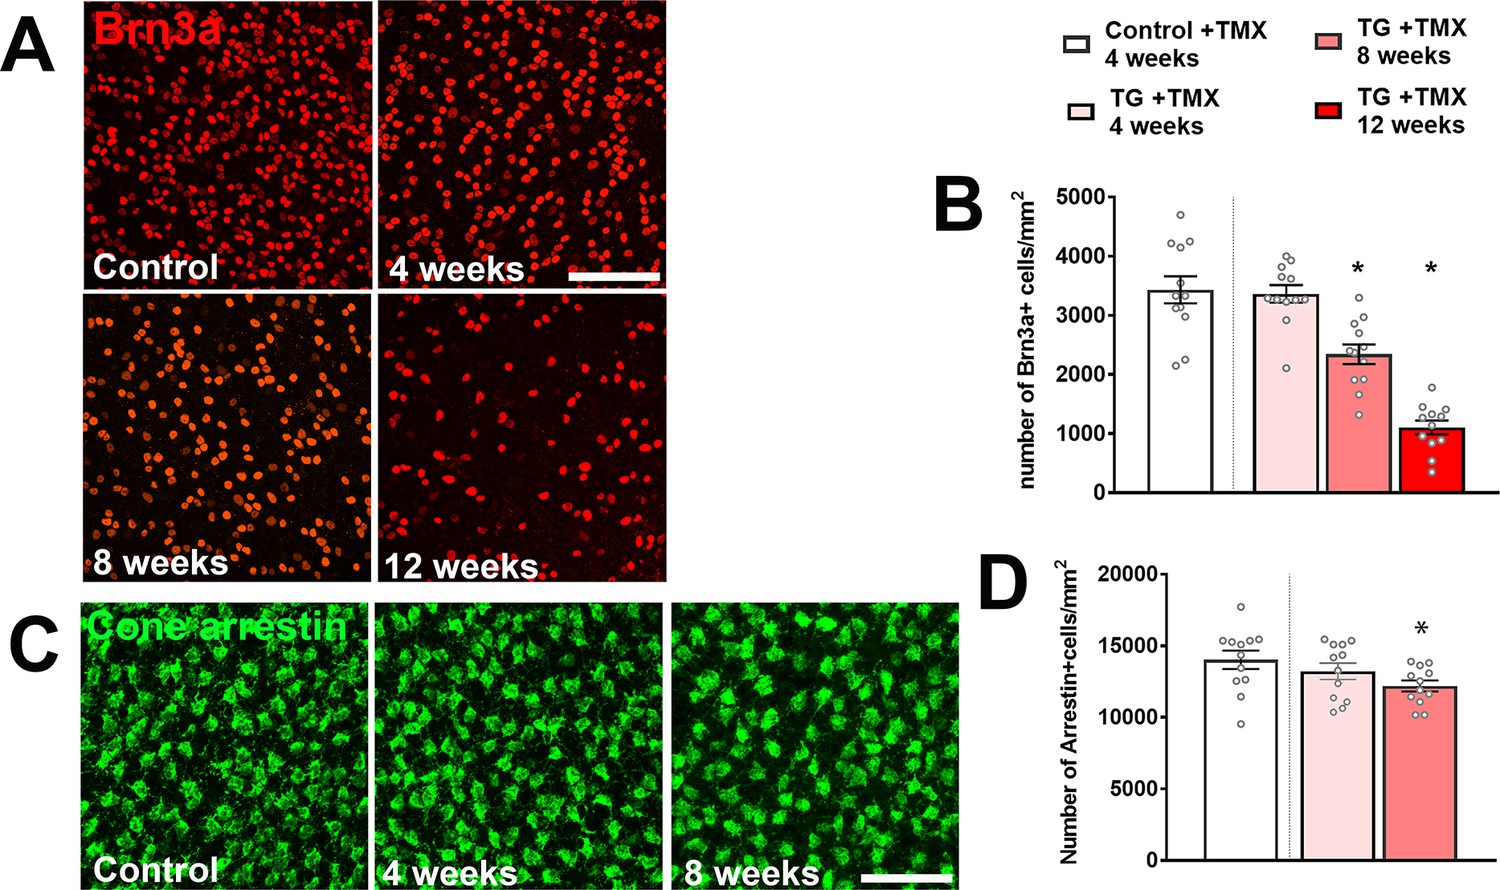
TGFBR2 ablation in retinal microglia induces degenerative loss of retinal neurons.
Changes in the numbers of neuronal cell classes were evaluated using immunohistochemical analysis in flat-mounted retinas from control and TG animals at various times following tamoxifen (TMX) administration. Cell densities for Brn3a-positive retinal ganglion cells (A, B) and for cone arrestin-positive cone photoreceptors (C, D) were significantly decreased following TGFBR2 ablation. Graphical data are presented as means ± SEM; p values are from one-way analysis of variance (ANOVA) and Dunnett’s multiple comparison test, four imaging fields from each of 3 animals of mixed sex were analyzed in each group. Scale bars = 100 µm.
Figure 8 with 1 supplement
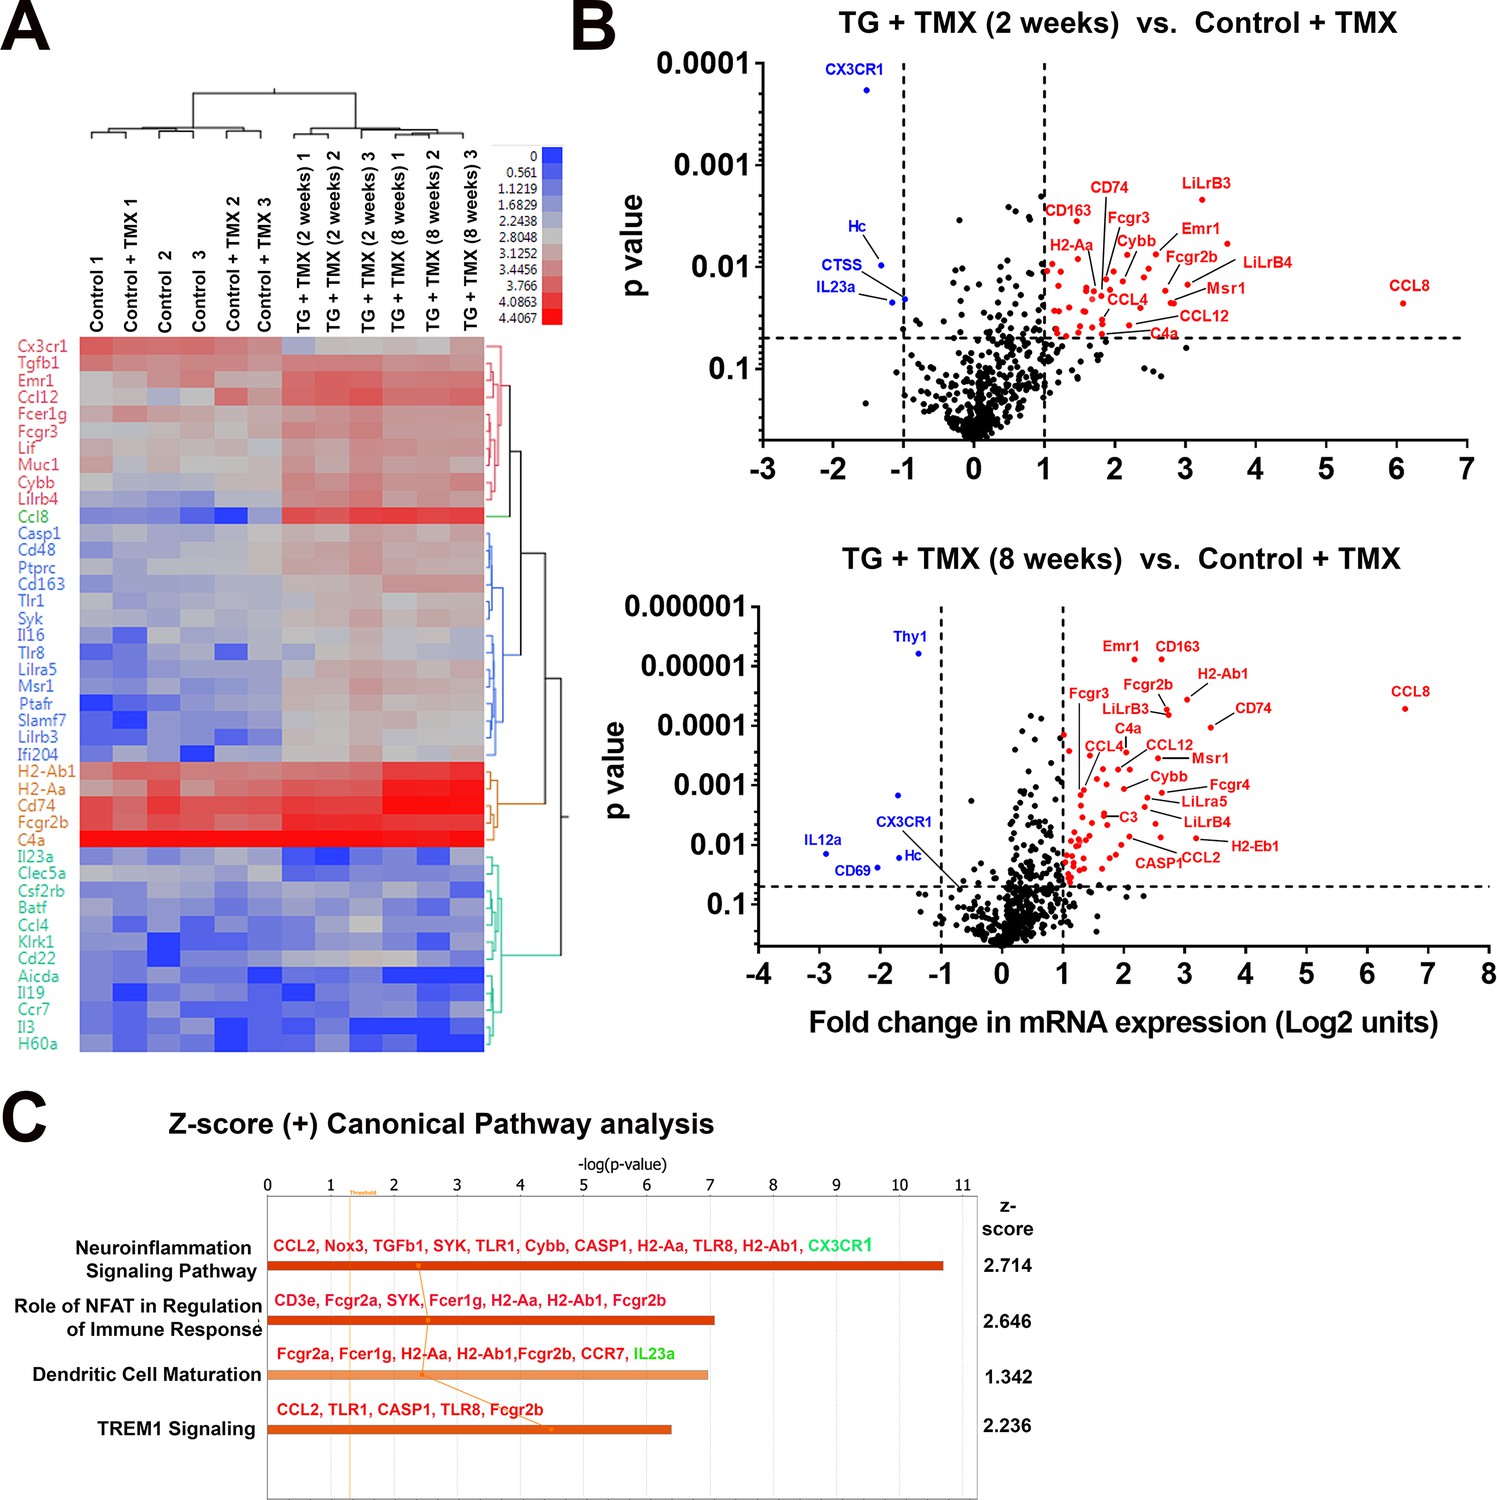
Changes in the mRNA expression of immune regulated genes in the retina following microglial TGFBR2 ablation using Nanostring-based profiling.
Four groups of animals (n = 3 animals per group) were analyzed: (1) Control animals not administered tamoxifen, (2) Control animals administered tamoxifen, (3) TG animals 2 weeks after tamoxifen administration, (4) TG animals 8 weeks after tamoxifen administration. (A) Hierarchical clustering of differentially expressed genes showed separate clustering of control and TG animals administered tamoxifen. (B) Volcano plots showing genes that were differentially expressed between control and TG animals administered tamoxifen at 2 and 8 weeks respectively. (C) Gene ontogeny (GO) analysis using IPA demonstrated a number of canonical pathways that were differentially represented between control and TG animals administered tamoxifen at 2 weeks reflecting the activation of neuroinflammatory pathways and pathways involved in immune cell activation and maturation.
Figure 8—figure supplement 1
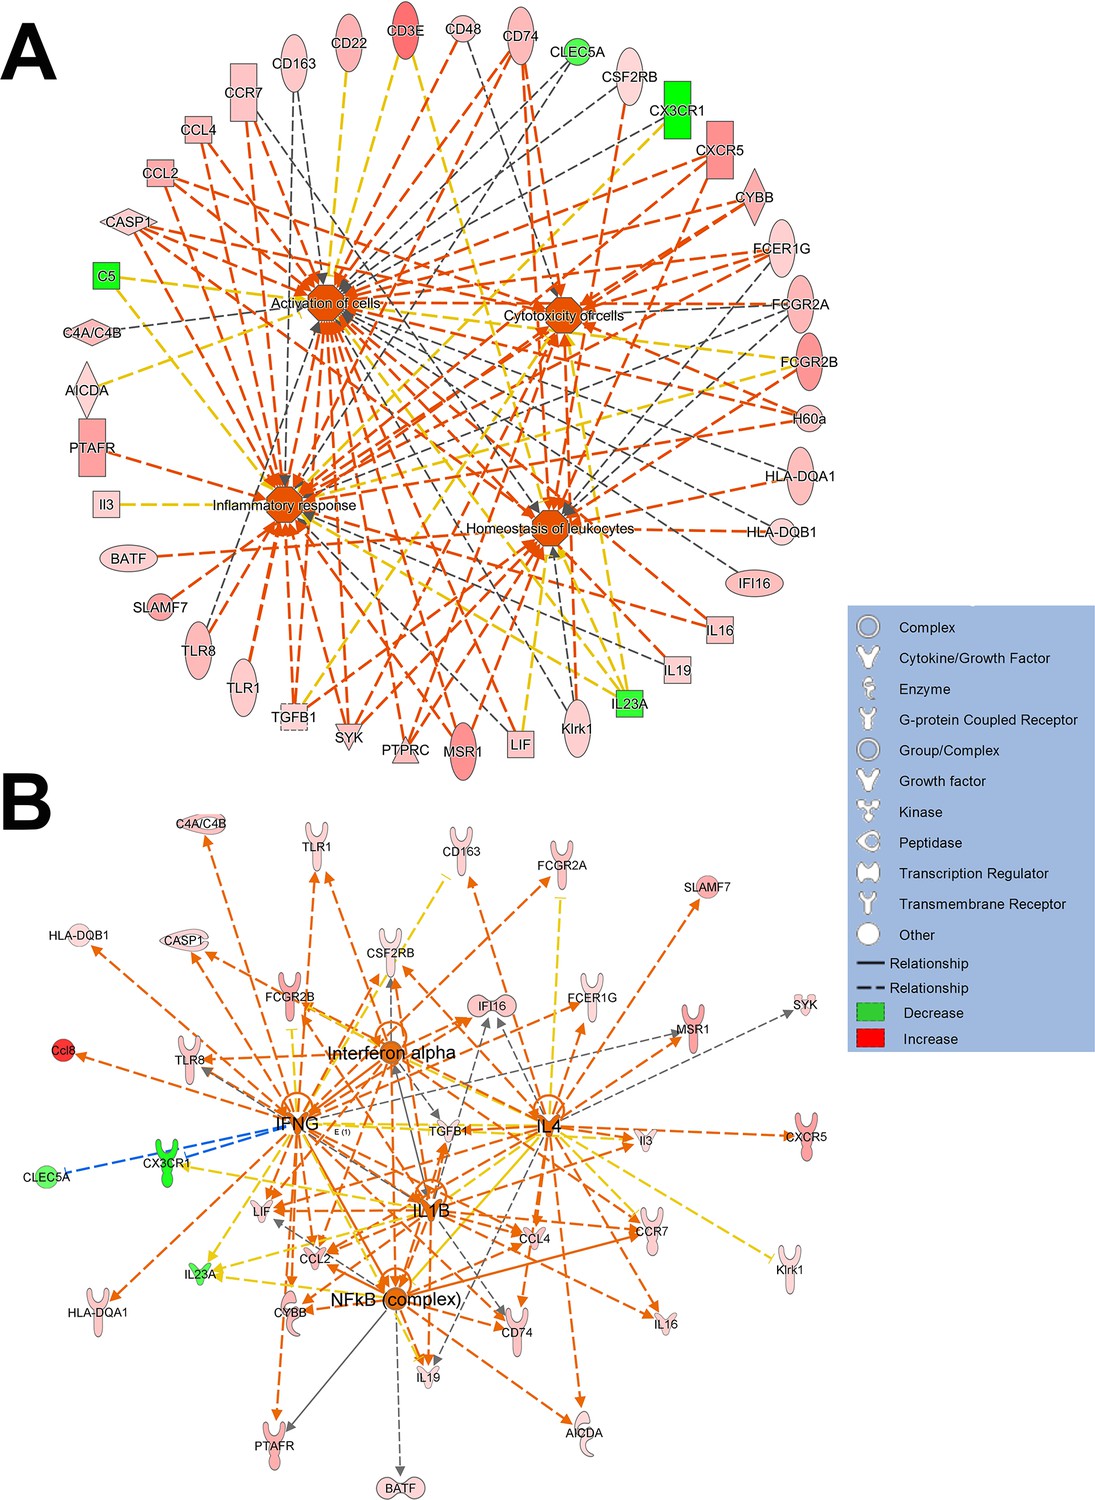
Gene ontology analysis of differentially expressed retinal genes induced by microglial TGFBR2 ablation in functional networks.
(A) Functional analysis indicated that retinal genes differentially expressed in TG vs. control retina 2 weeks following tamoxifen administration relate to various aspects of cell function including (1) homeostasis of leukocytes, (2) inflammatory response, (3) cytotoxicity, and (4) activation. (B) Analysis of upstream regulators of differentially expressed genes showed potential regulation by interferon-α, interferon-γ, IL1β signaling, and NFΚB-regulated transcription.
Figure 9
TGFBR2 ablation in retinal microglia increases pathological choroidal neovascularization (CNV) in an in vivo laser injury model.
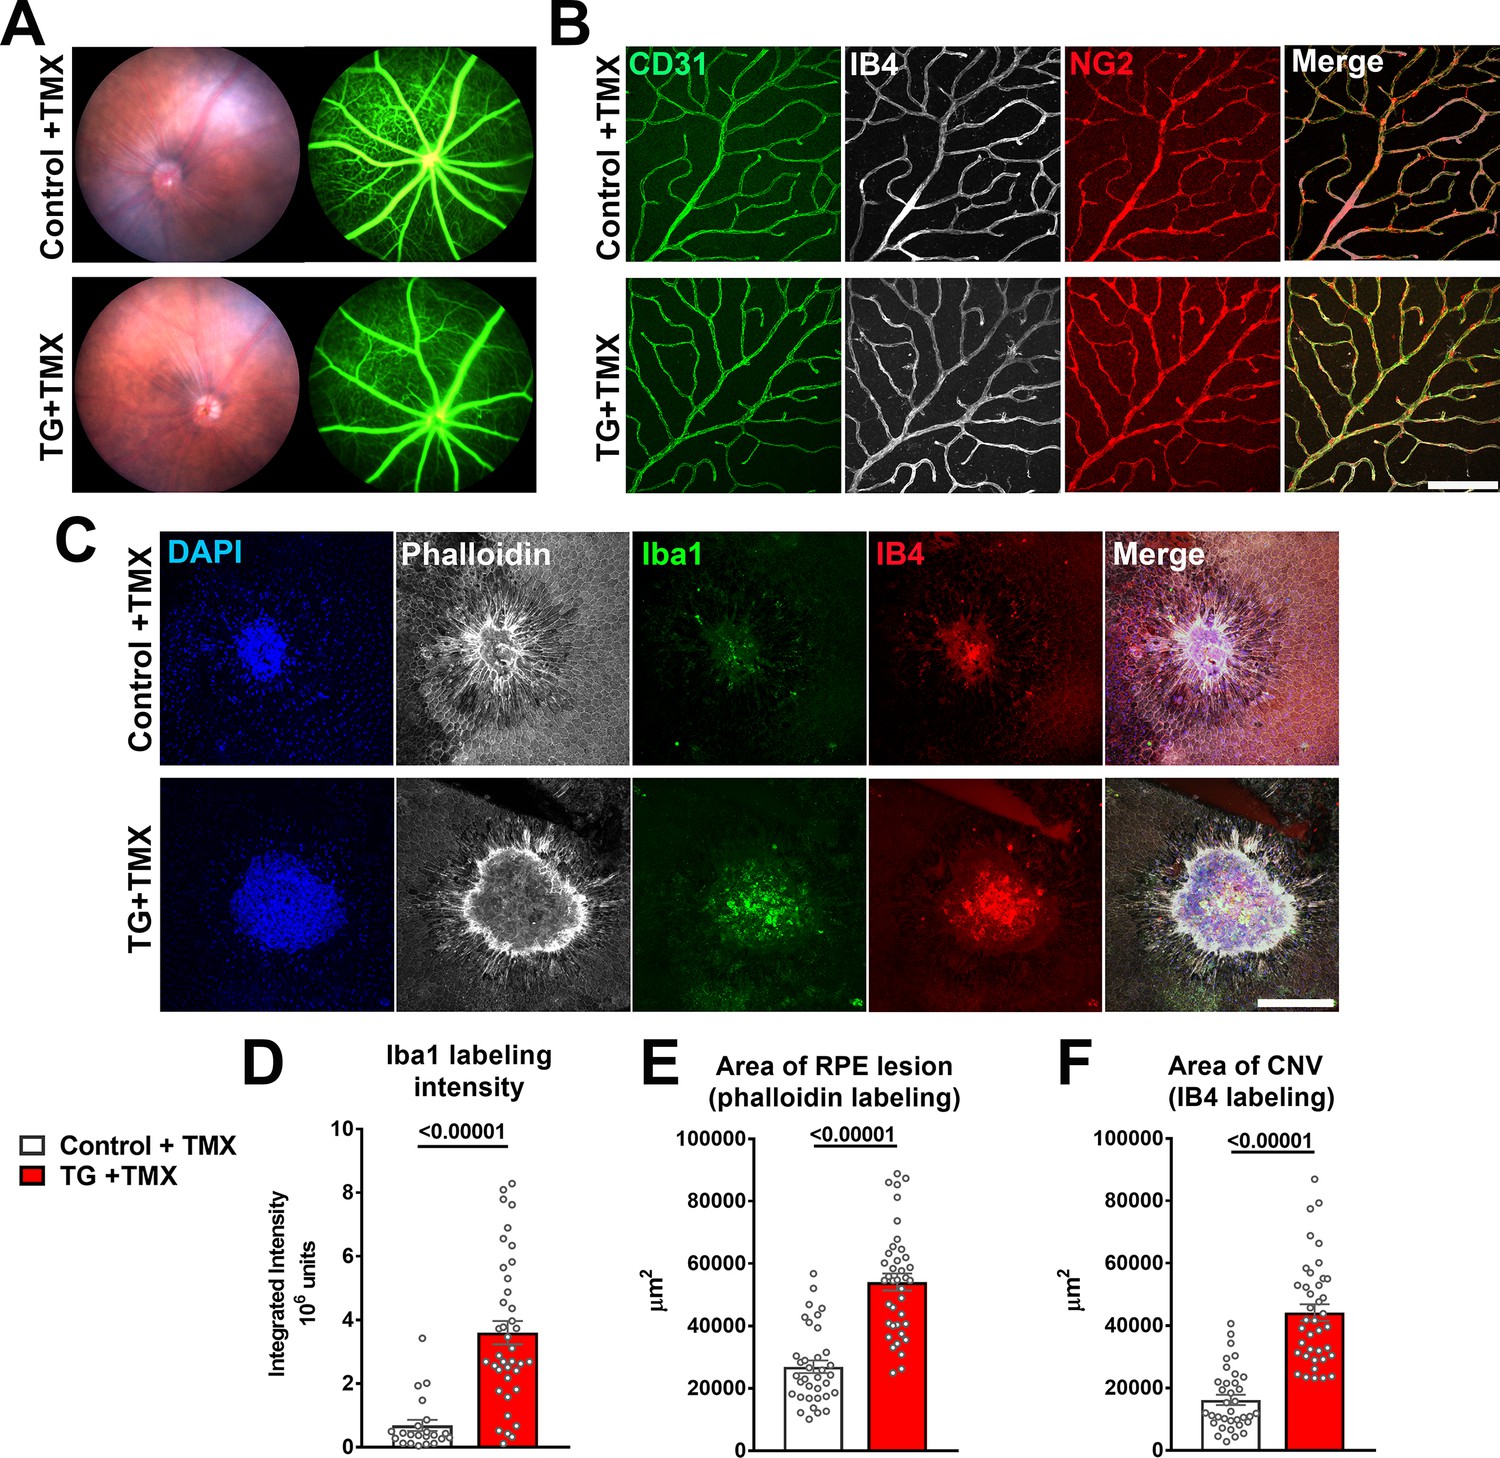
(A) In vivo evaluation for abnormalities in retinal vascular permeability using fluorescein angiography was performed in control and TG mice 12 weeks following tamoxifen (TMX) administration beginning at the age of 2 months. No abnormal leakage or vascular structure were detected. (B) Immunohistochemical analysis of endothelial cells (labeled with IB4 and an antibody to CD31) and retinal pericytes (labeled with an antibody to NG2) in retinal vasculature showed normal morphologies and distributions following TGFBR2 ablation in TG mice 12 weeks post-TMX. Scale bar = 100 µm. (C) Control and TG mice 3 weeks post-TMX were subjected to in vivo laser injury in a model of CNV formation. CNV complexes were analyzed in RPE flat-mounts using immunohistochemistry 7 days after laser injury and compared. Scale bar = 200 µm. TGFBR2-ablated TG animals demonstrated a higher recruitment of Iba1+ myeloid cells to the laser injury site (D), which was correlated with a larger laser lesion size (as labeled with phalloidin) (E) and a larger CNV area (F). (p values are from unpaired t-tests with Welch’s correction, data points are from 40 lesions from six animals in each group).
Figure 10

Schematic showing the role of TGFβ signaling in the regulation of retinal microglial physiology and the consequences of altered TGFβ signaling in the retina.
TGFβ ligands, expressed constitutively by retinal neurons (TGFβ−2 and −3) and retinal microglia (TGFβ−1), signal to TGFBR2-expressing microglia to promote their homeostatic phenotype and to suppress a pathologic phenotype. Conversion between these phenotypes, which are associated with corresponding patterns of gene expression, results in a loss of microglial organization and microglial trophic functions and increased pathological neurodegeneration and neovascularization.
Author response image 1
Author response image 2
Videos
Video 1
3D rotation depiction of the morphology and distribution of IBA1-immunolabelled retinal microglia (green) in the OPL with respect to IB4-labeled retinal vessels (white) in TG animals prior to the administration of tamoxifen.
https://doi.org/10.7554/eLife.42049.007
Video 2
3D rotation depiction of the morphology and distribution of IBA1-immunolabelled retinal microglia (green) in the OPL with respect to IB4-labeled retinal vessels (white) in TG animals 2 weeks following the administration of tamoxifen to induce TGFBR2 ablation in retinal microglia.
https://doi.org/10.7554/eLife.42049.008Additional files
-
Supplementary file 1
Sequences of oligonucleotide primers used in polymerase chain reaction (PCR) assays
- https://doi.org/10.7554/eLife.42049.020
-
Supplementary file 2
Key resources table.
- https://doi.org/10.7554/eLife.42049.021
-
Transparent reporting form
- https://doi.org/10.7554/eLife.42049.022
Download links
A two-part list of links to download the article, or parts of the article, in various formats.
Downloads (link to download the article as PDF)
Open citations (links to open the citations from this article in various online reference manager services)
Cite this article (links to download the citations from this article in formats compatible with various reference manager tools)
Absence of TGFβ signaling in retinal microglia induces retinal degeneration and exacerbates choroidal neovascularization
eLife 8:e42049.
https://doi.org/10.7554/eLife.42049


