Surface color and predictability determine contextual modulation of V1 firing and gamma oscillations
- Alina Peter

- Cem Uran
- Johanna Klon-Lipok
- Rasmus Roese
- Sylvia van Stijn
- William Barnes
- Pascal Fries
- Martin Vinck
- Ernst Strüngmann Institute (ESI) for Neuroscience in Cooperation with Max Planck Society, Germany
- Max Planck Institute for Brain Research, Germany
- Frankfurt Institute for Advanced Studies, Germany
- Donders Institute for Brain, Cognition and Behaviour, Radboud University Nijmegen, Netherlands
Figures
Figure 1 with 3 supplements
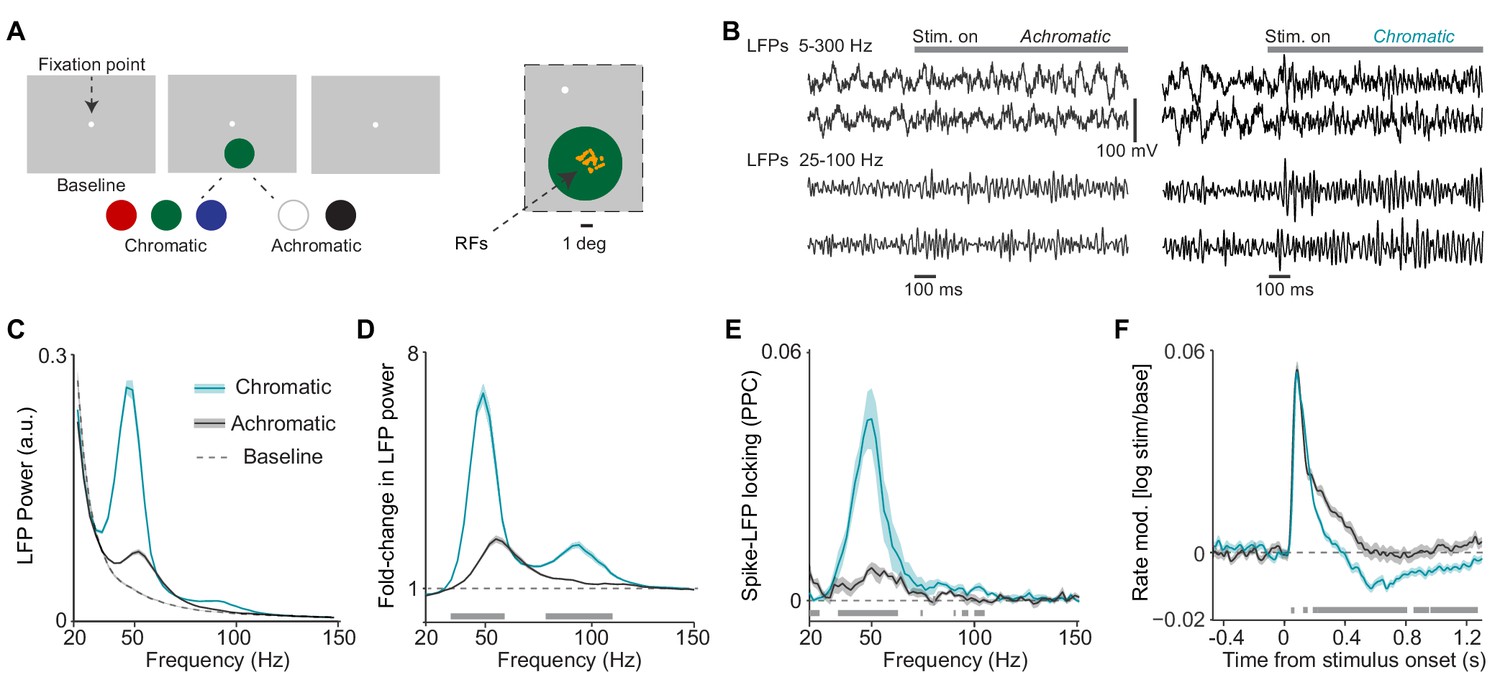
Analysis of LFP and multi-unit activity in response to large, uniform surfaces.
(A) Illustration of experimental paradigm with large, 6 deg diameter surfaces (Dataset 1, see Materials and methods; n = 5 sessions, 600 trials per session for chromatic and 400 trials per session for achromatic conditions. Trials numbers were equated by random subselection for statistics.). Trials were self-initiated by fixating on the fixation spot (enlarged for visibility), followed by a baseline period of 0.5–0.8 s with a gray background screen. Surfaces were either chromatic (red, blue, or green) or achromatic (black or white) and presented for 3.3 s, the first 1.3 s of which are analyzed here. Right panel shows the RF locations of analyzed sites in one session. (B) Representative trials of LFP signals for achromatic and chromatic conditions (having gamma power close to the median of the respective condition). (C) Average LFP power spectra for chromatic (turqoise), achromatic (black) and baseline (gray) conditions. LFP power was estimated using Discrete Fourier Transform of non-overlapping epochs of 500 ms, with multi-tapering spectral estimation (5 Hz). LFP spectra for all three conditions were normalized to the summed power (20 Hz) for the baseline (gray) condition (see Materials and methods). (D) Average change in LFP power, expressed as fold-change, relative to baseline. (E) Average MU-LFP locking, which was estimated using the pairwise phase consistency (PPC, see Materials and methods). (F) Modulation of firing rate relative to baseline, expressed as . (D–F) Shadings indicate standard errors of the means obtained with bootstrapping (see Materials and methods). Gray bars at bottom of figure indicate significant differences between chromatic and achromatic stimuli, obtained from permutation testing with multiple comparison correction across all frequencies and time points (see Materials and methods).
Figure 1—figure supplement 1
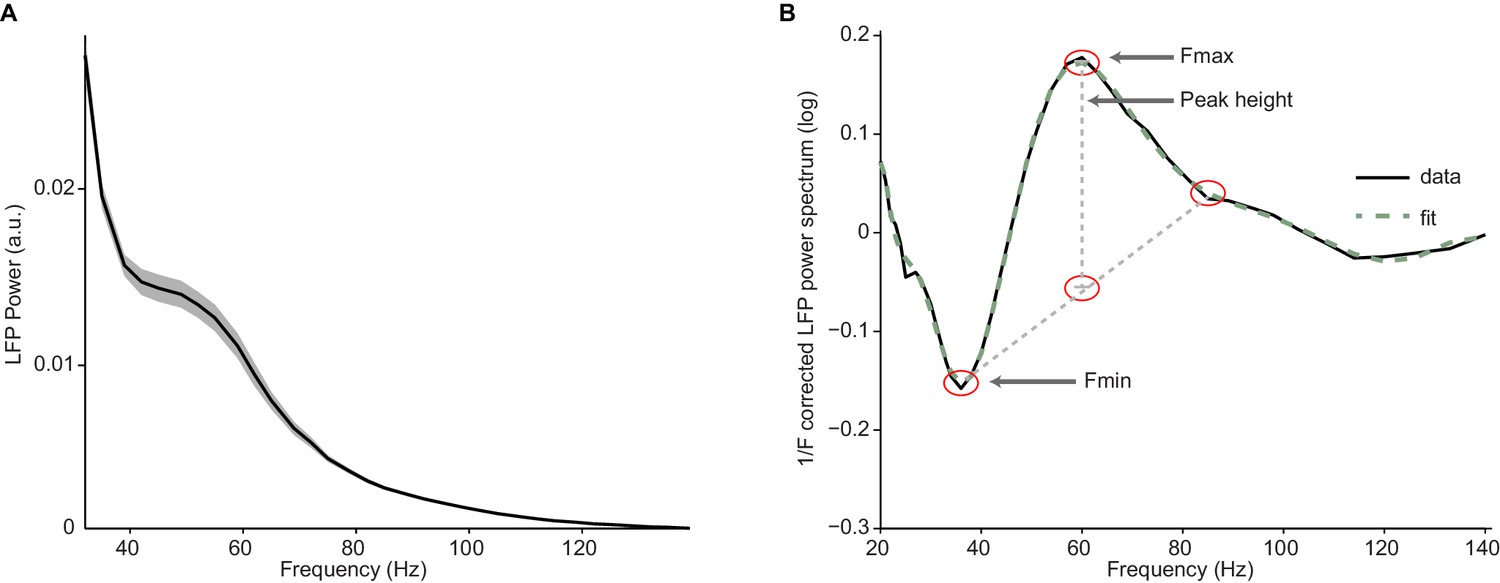
Illustration of fitting procedure.
(A) Average LFP power spectra for a large chromatic condition of an example session used in Figure 2. LFP spectra for all conditions were normalized to the summed power (20 Hz) for the baseline condition (see Materials and methods). (B) Log-transformed, 1/Fn corrected spectra (solid line) and their fit (dashed line). Peak height was determined as the difference between the peak value at location Fmax and a baseline estimate based on the average of the power at location Fmin and Fmin +2*(Fmax-Fmin), the estimate of peak width.
Figure 1—figure supplement 2
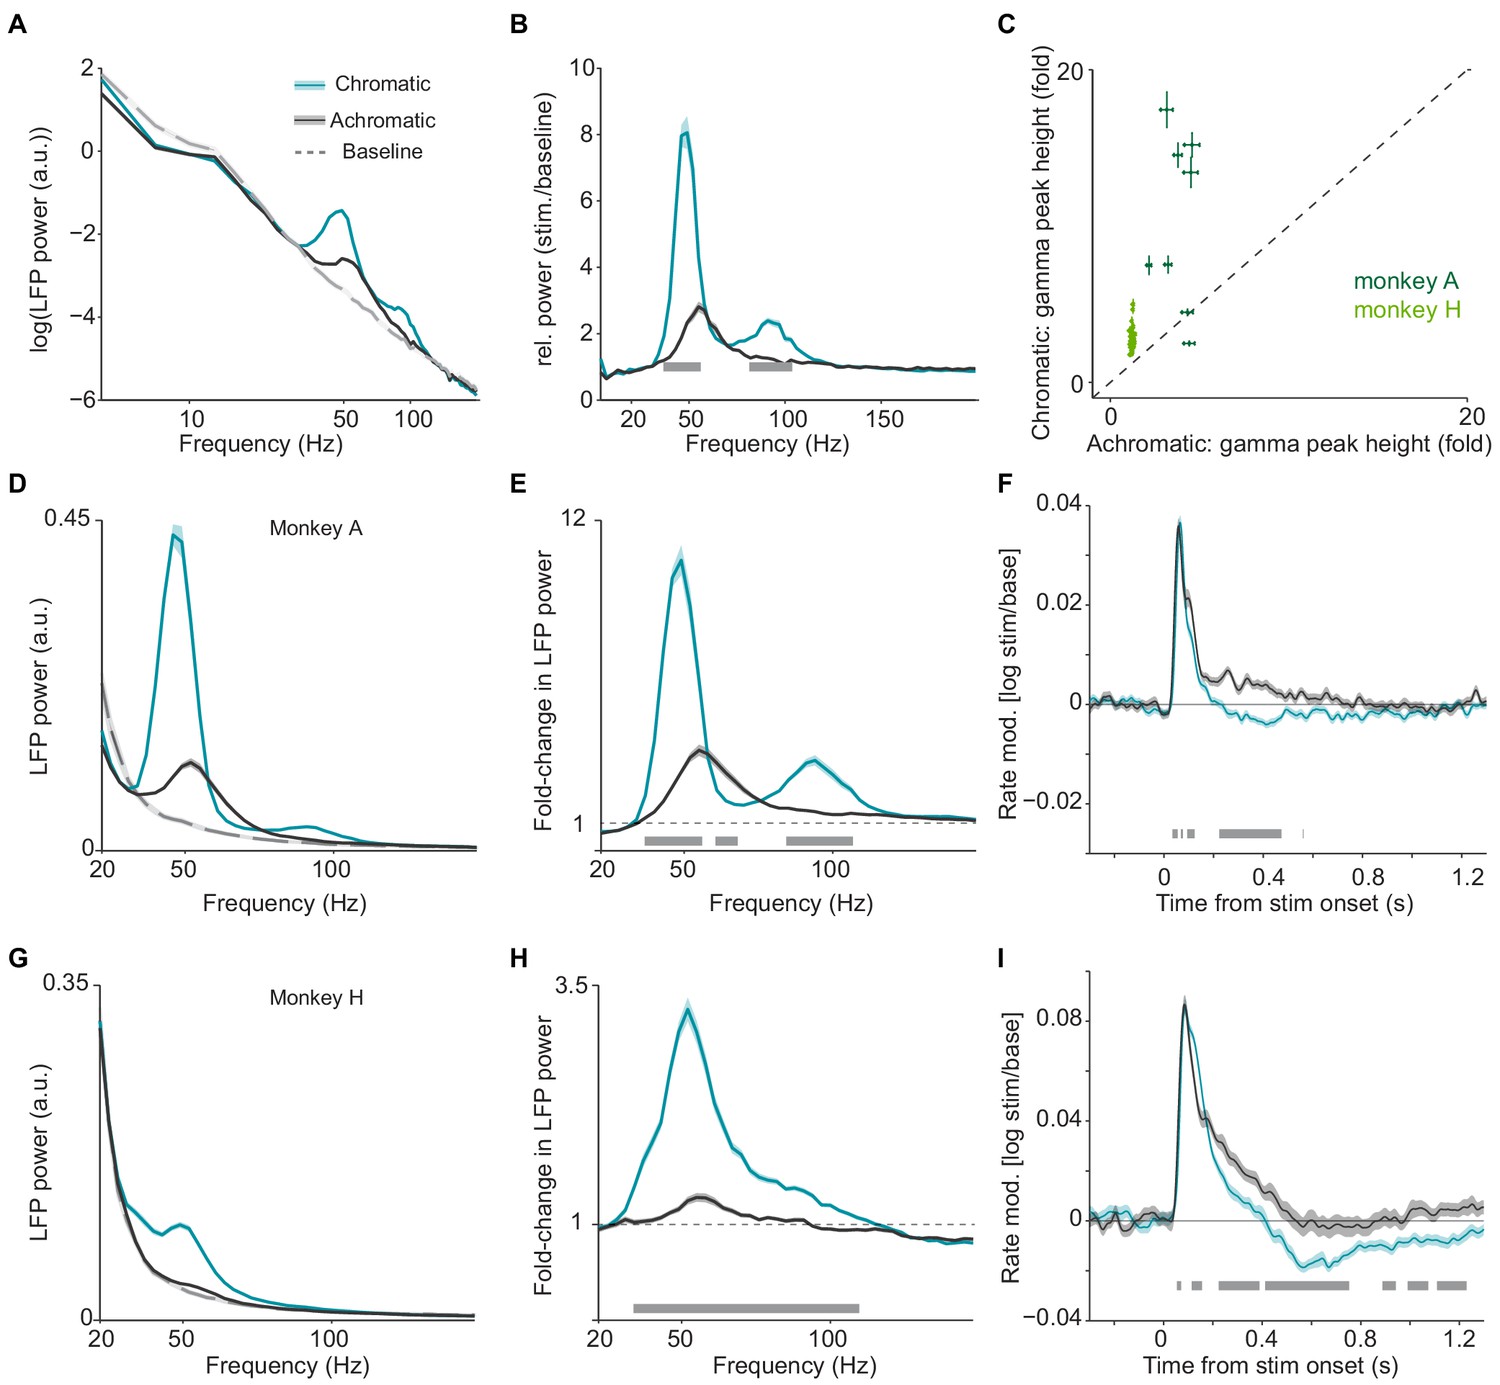
Analysis of LFP and multi-unit activity in response to large, uniform surfaces.
(A) Average LFP power spectra for chromatic (turquoise), achromatic (black) and baseline (gray) conditions. LFP power was estimated using Discrete Fourier Transform of non-overlapping snippets of 500 ms with a Hanning taper. LFP spectra for all three conditions were normalized to the summed power (20 Hz) for the baseline (gray) condition (see Materials and methods). (B) Average change in LFP power, expressed as fold-change, relative to baseline. (C) Scatter-plot for all the LFP recordings sites in two monkeys, showing the gamma-band amplitude (expressed as fold change) in chromatic and achromatic conditions. (D) Average LFP power spectra for chromatic (turquoise), achromatic (black) and baseline (gray) conditions for monkey A, using same estimation settings and normalization for power spectral density as in Figure 1 of main text. (E) Average change in LFP power, expressed as fold-change, relative to baseline. (F) Modulation of firing rate relative to baseline, expressed as (stim/base), for monkey A. (G–I) as (D–F), but now for monkey H. (A–I) Shadings and error bars indicate standard errors of the means (see Materials and methods). Gray bars at bottom of figure indicate significance bars, obtained from permutation testing with multiple comparison correction across all frequencies and time points.
Figure 1—figure supplement 3
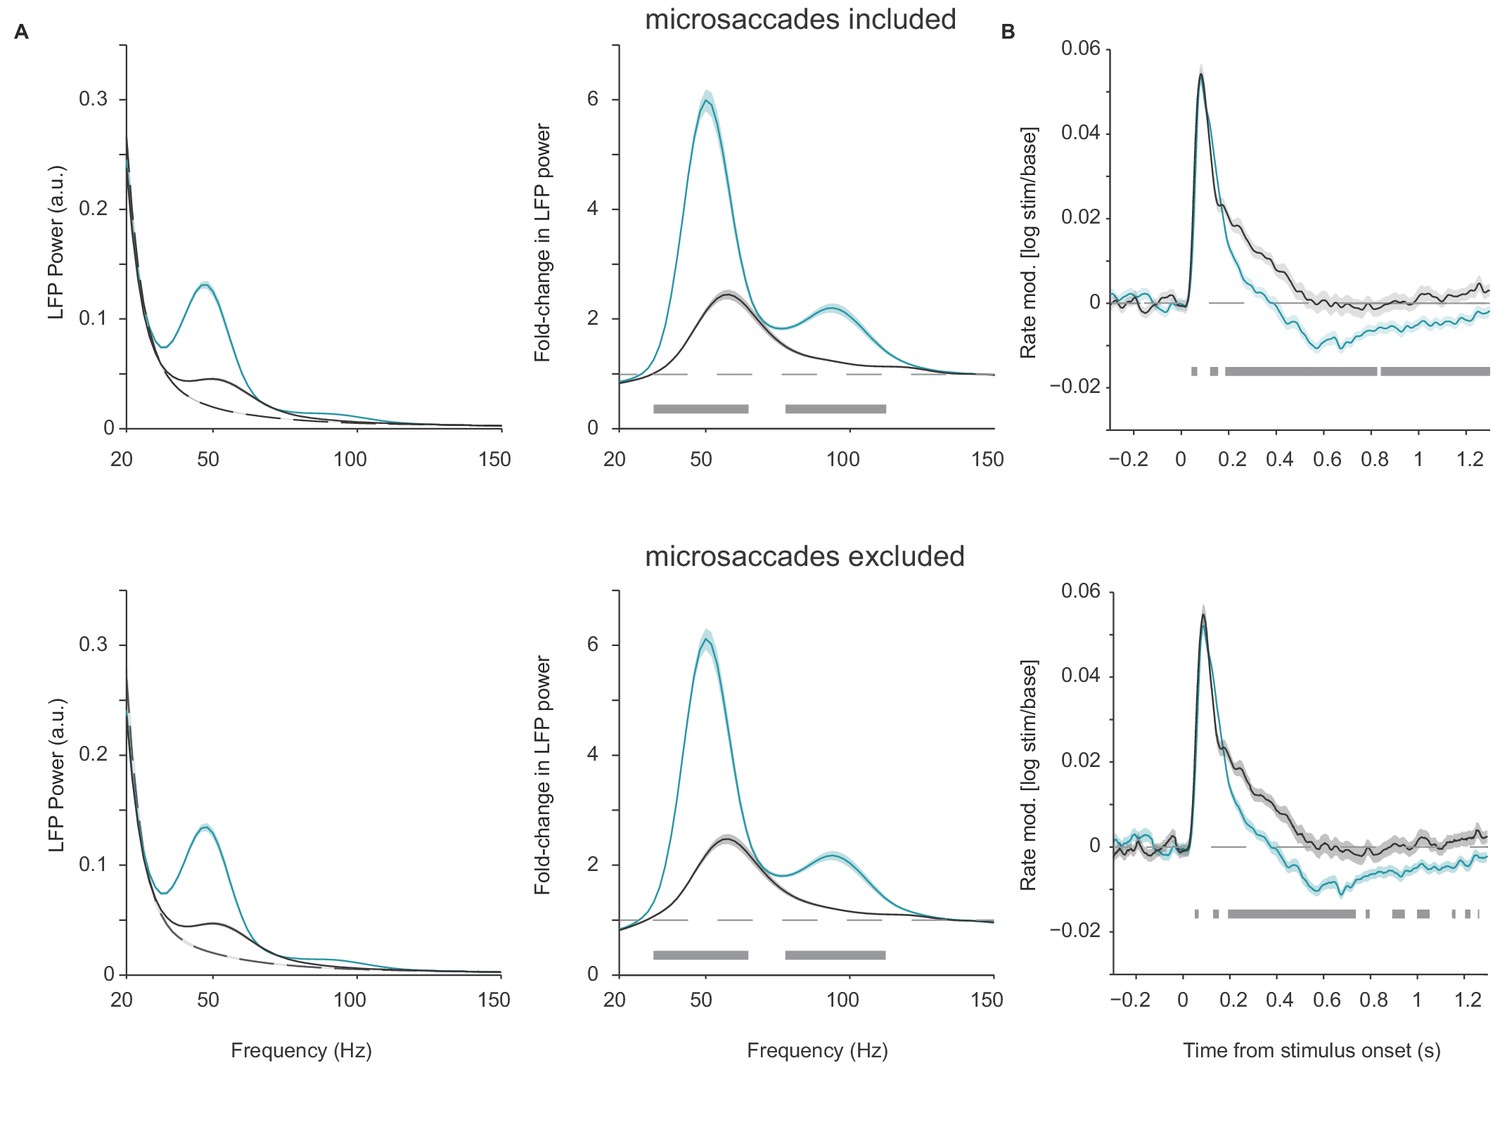
Control analysis for microsaccades.
(A) Average LFP power spectra and rate modulation for chromatic (turquoise), achromatic (black) and baseline conditions, separately for data epochs defined irrespective of microsaccades (top) and epochs excluding 100 ms after each microsaccade. Microsaccade detection was based on the algorithm of Engbert and Kliegl (2003) (see Materials and methods). Analysis was based on same dataset as in Figure 1. Analyses were performed as for Figure 1, except that the Fourier spectra were computed based on 100 ms epochs that were Hann-tapered and zero-padded to 1 s. (B) Modulation of firing rate relative to baseline, expressed as (stim/base), separately for data with microsaccade epochs included (top) and excluded (bottom).
Figure 2 with 1 supplement
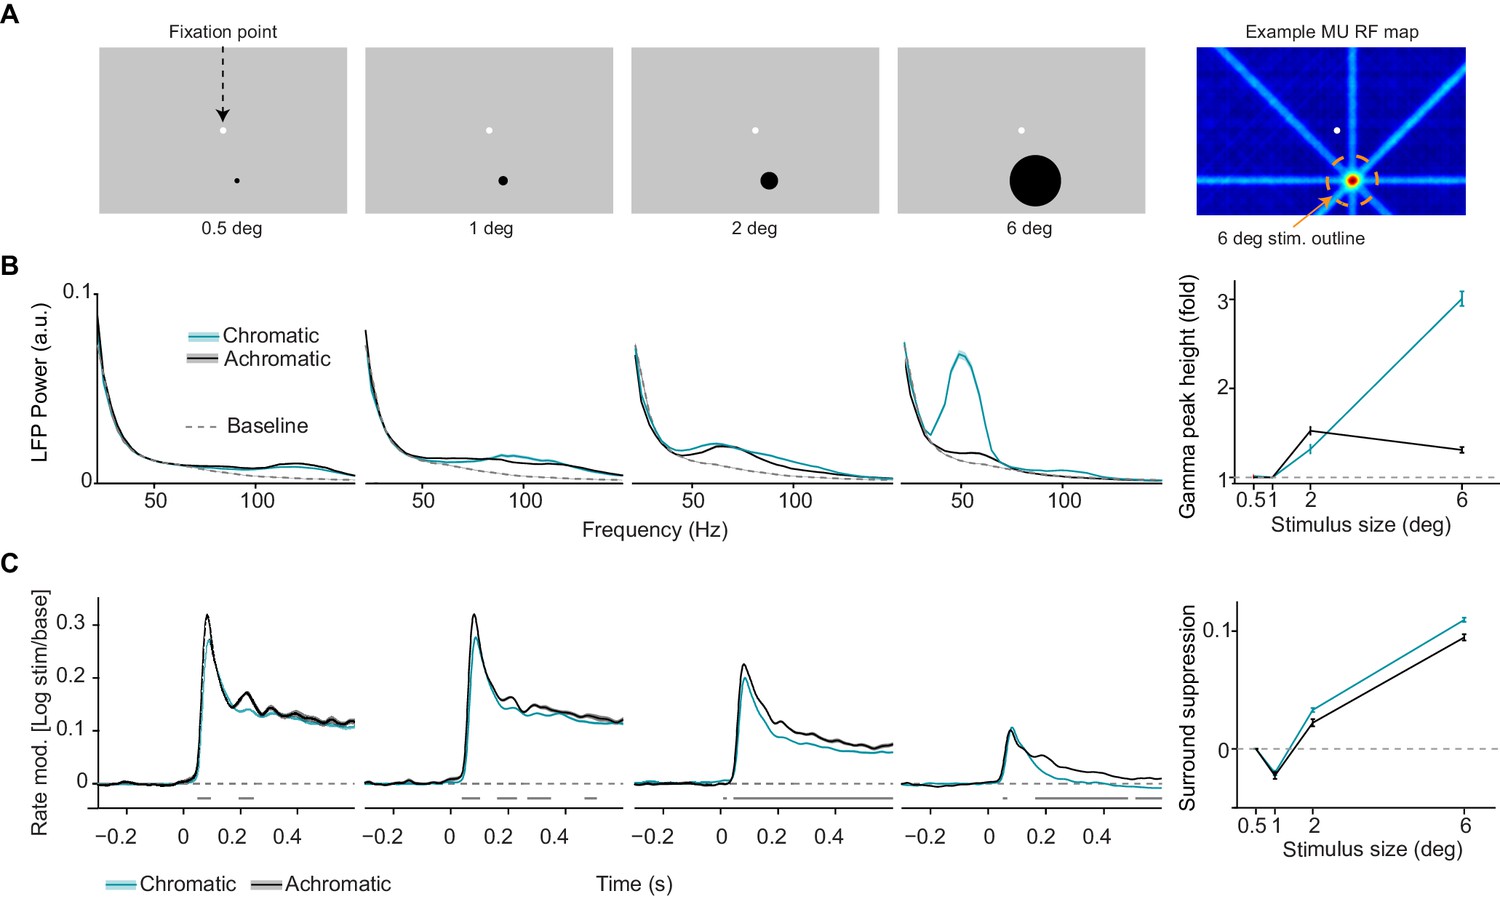
Dependence of LFP power spectra and MU firing activity on surface size.
(A) Illustration of experimental paradigm (Dataset 2, see Materials and methods; n = 9 sessions, 59.750.09/25.640.12 trials chromatic vs achromatic trials per condition in each session). Uniform surfaces of four different sizes were presented on a gray background screen. Fixation spot is enlarged for visibility. Right: Receptive field estimated with bar stimuli for a representative target channel, with the outline (orange dashed line) of the largest size stimulus (see Materials and methods). Note that the activation outside the RF is due to the use of large bar stimuli sweeping over the monitor. (B) LFP power spectra for different sizes and chromatic/achromatic conditions. LFP power spectrum estimated and normalized as in Figure 1C, but now using 300 ms epochs. Right panel shows the gamma-band amplitude as a function of size, estimated using a polynomial fitting procedure between 30 and 80 Hz (see Materials and methods). The difference between 6 and 0.5 deg stimuli was significantly larger for chromatic than achromatic condition (P0.05, bootstrap test, see Materials and methods). (C) Modulation of firing rate relative to baseline, expressed as , for different sizes and chromatic/achromatic conditions. Right panel shows surround suppression, which was defined as the difference in firing rate modulation between the 0.5 degree size and the other sizes.
Figure 2—figure supplement 1
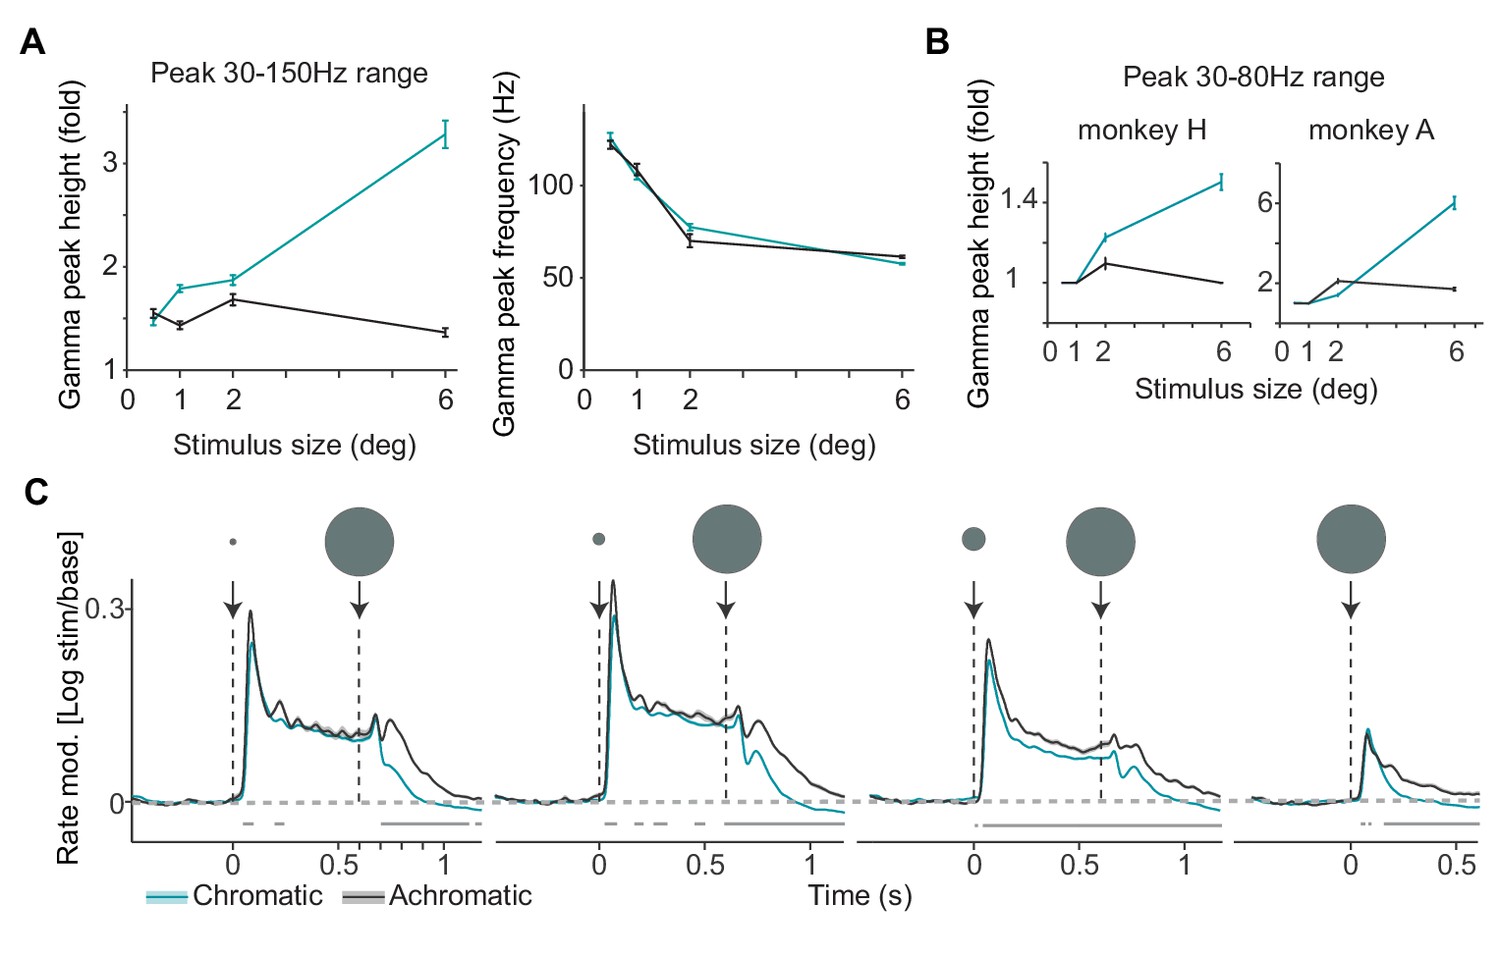
Analysis of LFP and multi-unit activity in response to stimuli of varying size.
(A) Gamma-band peak amplitude and peak-frequency as a function of size, estimated using a polynomial fitting procedure between 30 and 150 Hz. A wider range instead of the standard 30–80 Hz range was used here, to also capture peaks 100 Hz, which is far outside the typical range of classical visual gamma range. This activity may reflect spike bleed-through, which is beyond the scope of the present study. (B) Average gamma-band peak height in 30–80 Hz range, shown separately for the two monkeys. This figure panel corresponds to Figure 2B of the main text. The difference between 6 and 0.5 deg stimuli was significantly larger for the chromatic than achromatic condition for both animals (p0.05, bootstrap test). (C) Each trial contained a sequence of two stimuli, either the small stimulus first for 600 ms, or the large stimulus first for 600 ms (see Materials and methods). Here we show the first type of sequence to illustrate the onset of a surround when the stimulus covering the classical RF is already present. Modulation of firing rate relative to baseline, expressed as (stim/base), for different sizes and chromatic/achromatic conditions. Note rapid firing suppression after onset of the large stimulus following the 0.5 deg stimulus, with a significant difference arising already after 100 ms.
Figure 3 with 1 supplement
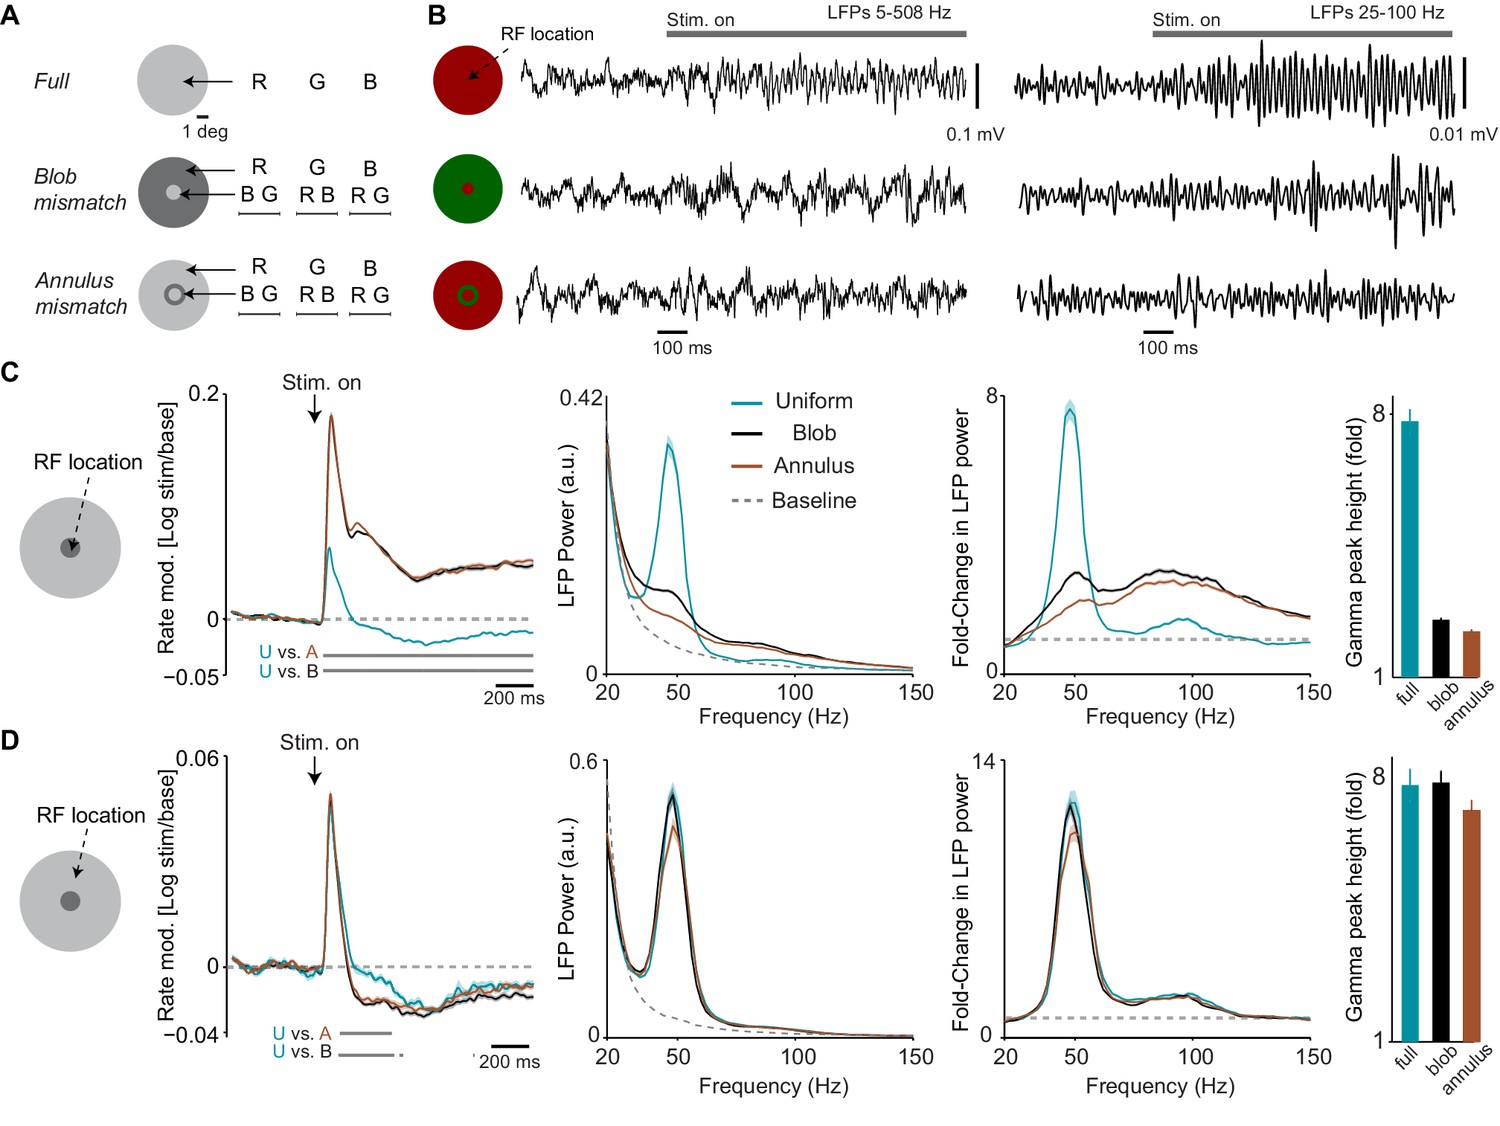
Dependence of LFP power spectra and firing rates on spatial predictability.
(A) Illustration of paradigm (Dataset 3, see Materials and methods; n = 8 sessions, 16.260.19 trials in each of the 15 conditions per session). We grouped stimuli intro three types. In the ‘Uniform surface’ group of conditions, stimuli of 6 deg diameter were presented with either a red, blue or green hue (R B G, equiluminant). In the second ‘blob mismatch’ group, the central 1 deg of the stimulus had a different (equiluminant) color than the rest of the stimulus. In the third ‘annulus mismatch’ group, we presented an annulus ring (of 0.25 deg) of another color on top of the uniform surface (at equiluminant intensity) around the inner one degree from the stimulus center. All combinations of hues and stimulus types were presented, yielding a total of 15 individual conditions. (B) Representative LFP traces (having gamma power close to the median of all trials for the respective condition) for the three stimulus types. (C) Analysis for target channels with RFs at the center of the stimulus. Shown from left to right are: (1) The change in MU firing activity relative to baseline expressed as . (2) LFP power spectra for the three stimulus conditions and the baseline. LFP power spectrum estimated and normalized as in Figure 1C. (3) The change in LFP power relative to baseline, expressed as a fold-change. (4) The gamma-band amplitude, estimated using a polynomial fitting procedure (see Materials and methods). Gamma-band amplitude was significantly higher for uniform surface than blob and annulus conditions (p0.05, bootstrap test, see Materials and methods). (D) Same as (C), but now for target channels with RFs between 1.5 and 2 deg from the stimulus center, that is close to the central region of the larger, uniform region of the stimulus. Gamma-band amplitude did not significantly differ between conditions (bootstrap test, all P0.08 ).
Figure 3—figure supplement 1
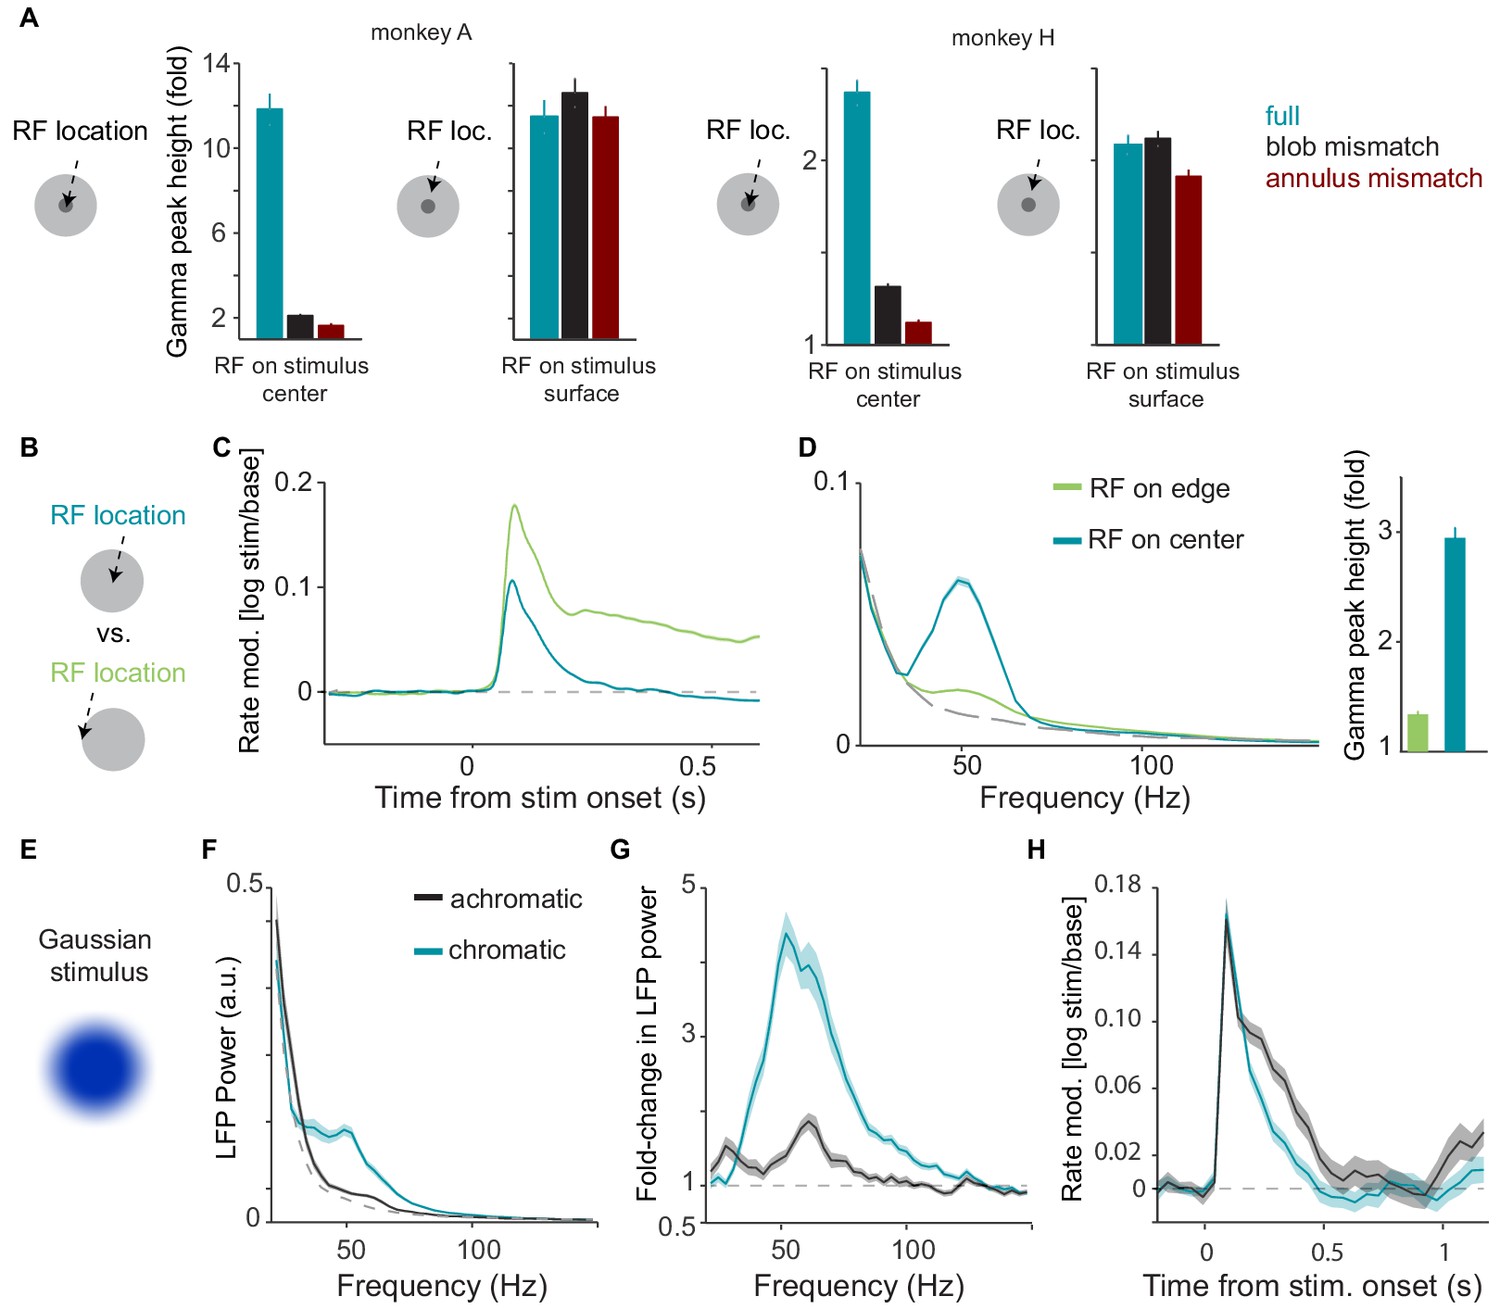
Additional analyses and experiments performed in relationship to Figure 3 in the main text.
(A) Comparison of gamma-band power between full surface and mismatch conditions, separately for the two monkeys. For both monkeys, gamma-band amplitude was significantly higher for uniform surface than blob and annulus conditions when the RF was at the center of the surface stimulus (P0.05, bootstrap test, see Materials and methods). (B) Illustration of paradigm (Dataset 2). Uniform surfaces were either centered on the unit’s RF, or the edge of the surface was centered on the unit’s RF. (C) Modulation of firing rate relative to baseline, expressed as (stim/base). (D) Average LFP power spectra, using the same analysis time window and spectral estimation parameters as in Figure 2 of the main text, comparing ‘RF-on-center’ and ‘RF-on-edge’ conditions. Dashed gray line corresponds to baseline (gray background screen). Right: Gamma-band amplitude (expressed as fold-change) for the two conditions. Gamma-band amplitude was significantly higher for ‘RF-on-center’ condition (p0.05, bootstrap test). (E)-(H): Single session (from monkey H) illustrating responses to Gaussian surface stimuli. Stimuli were otherwise the same as Dataset 1. Gamma oscillations were not abolished by removal of the sharp stimulus edge. (E) Example Gaussian stimulus that had a blurred edge. (F) Average LFP power spectra for chromatic (turquoise), achromatic (black) and baseline (gray) conditions, computed as in Figure S1. (G) Average change in LFP power, expressed as fold-change, relative to baseline. (H) Modulation of firing rate relative to baseline, expressed as (stim/base), for monkey A.
Figure 4 with 4 supplements
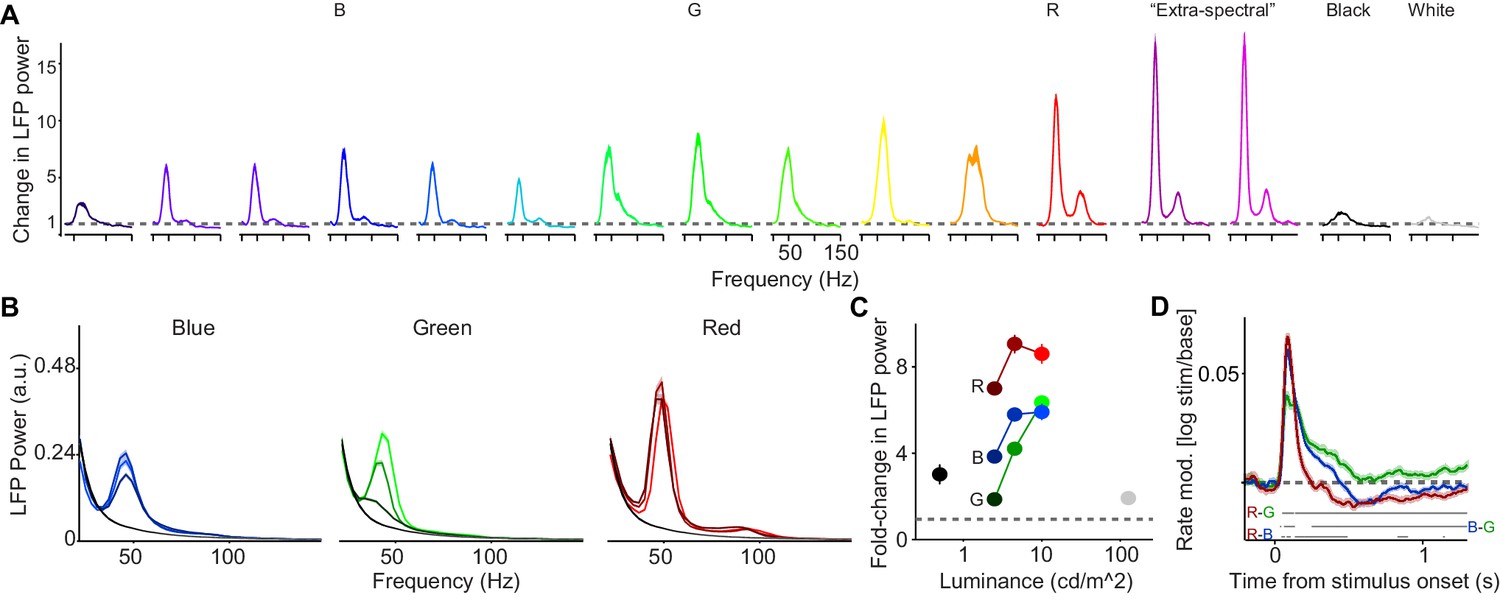
Dependence of LFP power spectra and MU firing activity on surface hue and luminance.
(A) We presented uniform surfaces of 6 deg at maximum possible luminance levels, sampling from the available spectrum of wavelengths (Dataset 4, see Materials and methods; n = 5 sessions, 15.240.1 trials per condition in each session ). In addition, we presented black and white surfaces. Shown is the change in LFP power relative to the baseline (gray screen), expressed as a fold-change. (B) Three hues (red, green and blue) were presented at three different luminance levels (approximately 2.5, 5 and 10 cd/m, Dataset 1, see Materials and methods; n = 5 sessions, 19.80.45 trials per condition in each session). Shown are LFP power spectra. LFP power spectrum estimated and normalized as in Figure 1C. (C) Average change in LFP power, expressed as a fold-change based on the fitting procedure, relative to the baseline (gray screen). The dependence of gamma amplitude on stimulus luminance was greater for G than for R or B (difference between high versus low: p0.05, bootstrap test). Gamma oscillations amplitude RB or G across all three luminance conditions, and BG surface stimuli for low and intermediate luminance conditions (P0.05, bootstrap test). (D) Modulation of firing rate relative to baseline, expressed as (stim/base). Horizontal bars at bottom of panel represent significant differences between stimuli at p0.05 (permutation test, multiple comparison corrected for time bins). (B–D) Color hues were adjusted for better discriminability, panel A of Figure 4—figure supplement 2 shows actual hues.
Figure 4—figure supplement 1
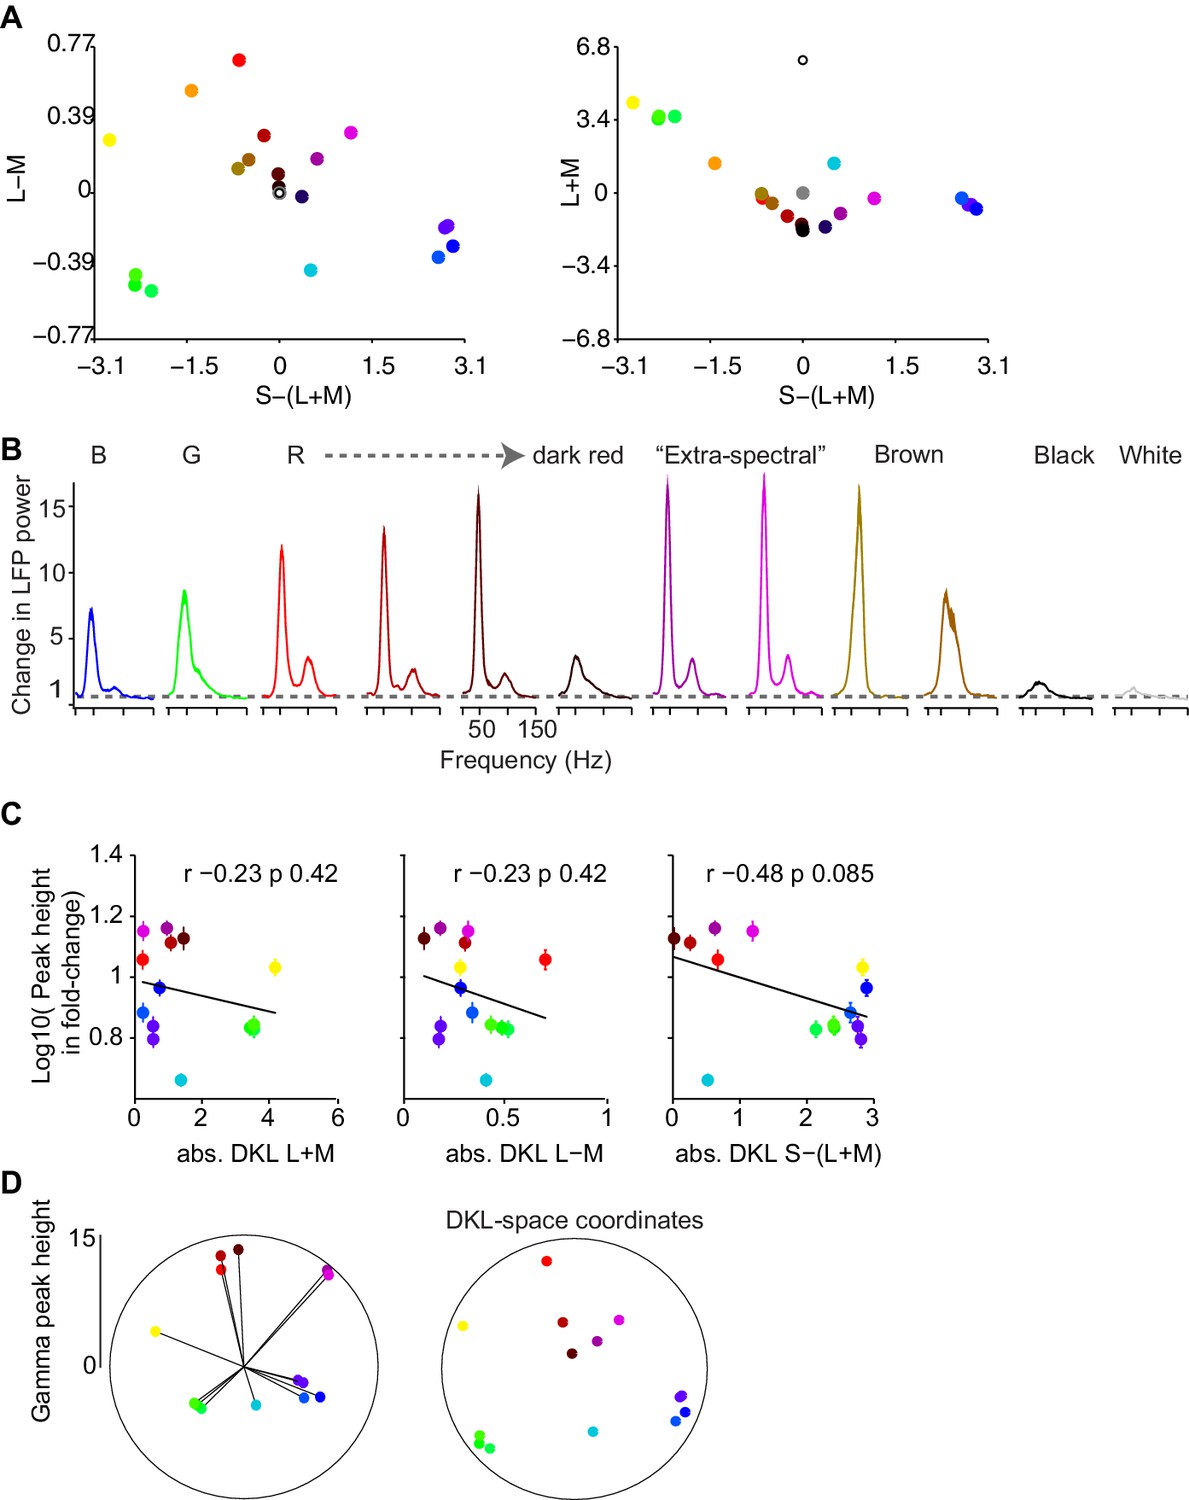
Dependence of gamma LFP power on the surface hue: additional analyses in relation to main Figure 4A.
(A) Representation of hues used for Figure 4A in DKL space. (B) LFP power spectra as in Figure 4A, for additional hues. The pure blue, green and red stimuli are shown for reference, followed by red surfaces of decreasing luminance and the brown surface stimuli. See Supplementary file 1 for CIE and luminance values. (C) Correlations of gamma-band amplitude (log10 of peak height estimate) with absolute cone contrasts in DKL space were not significant, with trends for negative correlation values. Log-transformed values were used to reduce the effects of outliers on correlations. The pattern was similar across monkeys, with monkey A showing a significant, negative correlation of absolute S-(L + M) value to peak height (p=0.039 corrected for multiple comparisons within but not across animals). (D) Gamma peak height as a function of angle in the DKL plane. Angles were obtained by normalizing the L-M and S-(L + M) axes to the maximum absolute value for each respective axis. The resultant vector length was at an angle of 73.95 deg (where 90 deg is defined as maximum L-M contrast and no S-(L + M) contrast) and significantly clustered (resultant length = 0.33, p0.001, permutation test). The panel on the right shows the DKL space coordinates of the colors used in the left panel.
Figure 4—figure supplement 2
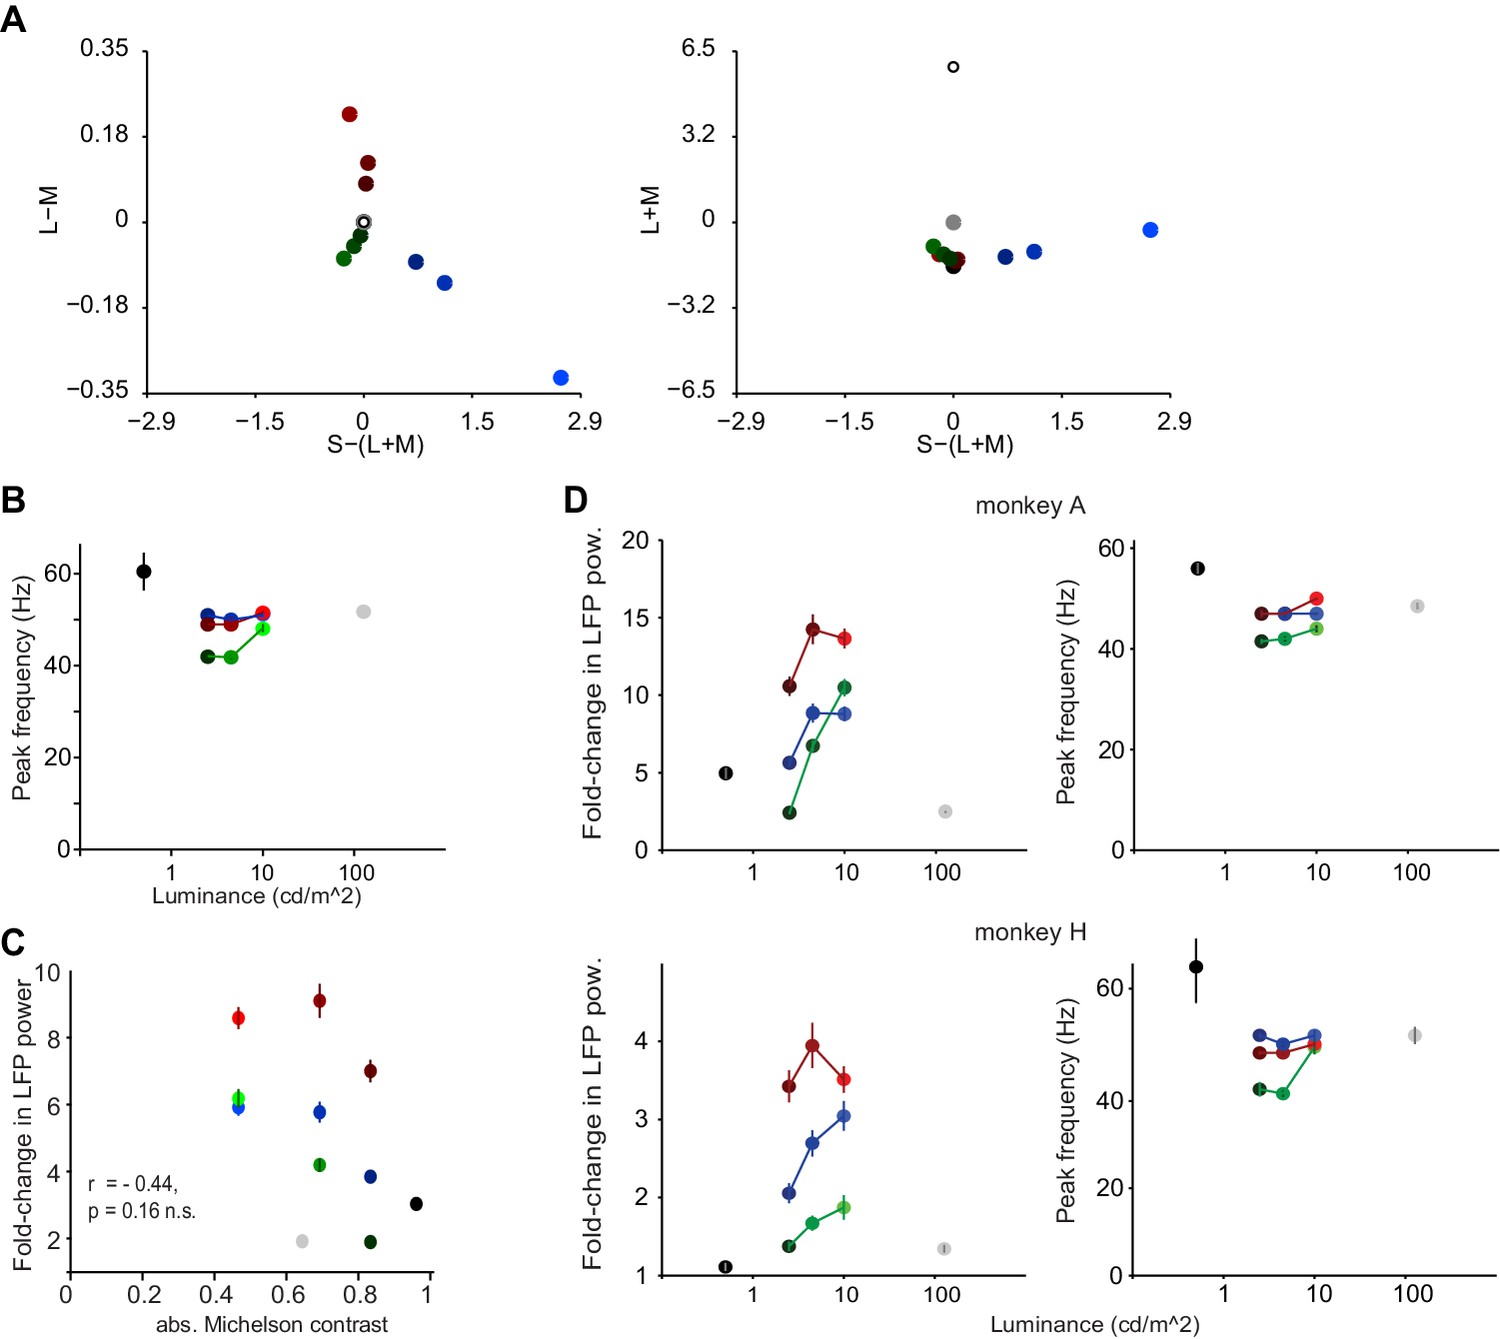
Dependence of gamma LFP power on the surface hue: further analyses in relation to main Figure 4B.
(A) Representation of hues used for Figure 4B in DKL space. (B) Peak frequency estimates (Hz) based on cross-validated fitting procedure (see Materials and methods) for the surface stimuli of Figure 4B. (C) A regression of absolute luminance contrast (Michelson contrast) against gamma peak height (fold-change) showed no significant relationship (p=0.23). Note that since there was relatively little gamma power for achromatic, high-contrast stimuli, if anything there would be a negative relationship between luminance contrast and gamma power, the very opposite of findings about gamma power for achromatic gratings. Also note that for red stimuli, gamma power appears to follow a U-shape with decreasing luminance and increasing contrast (see also Figure 4A). (D) Gamma power (fold change) and peak frequency estimates (Hz) for the surface stimuli of Figure 4B, per animal. For both animals, the brightest stimuli showed stronger gamma-responses than the darkest stimuli. The difference in fold-change gamma amplitude as a function of luminance was greater for green than for red for both animals and significantly greater than blue in monkey A. Moreover, red responses across luminances were stronger than green or blue responses, with the exception of the brightest blue responses in monkey H. (B-D) Color hues were adjusted for better discriminability given the small dot sizes, (A) shows actual hues.
Figure 4—figure supplement 3
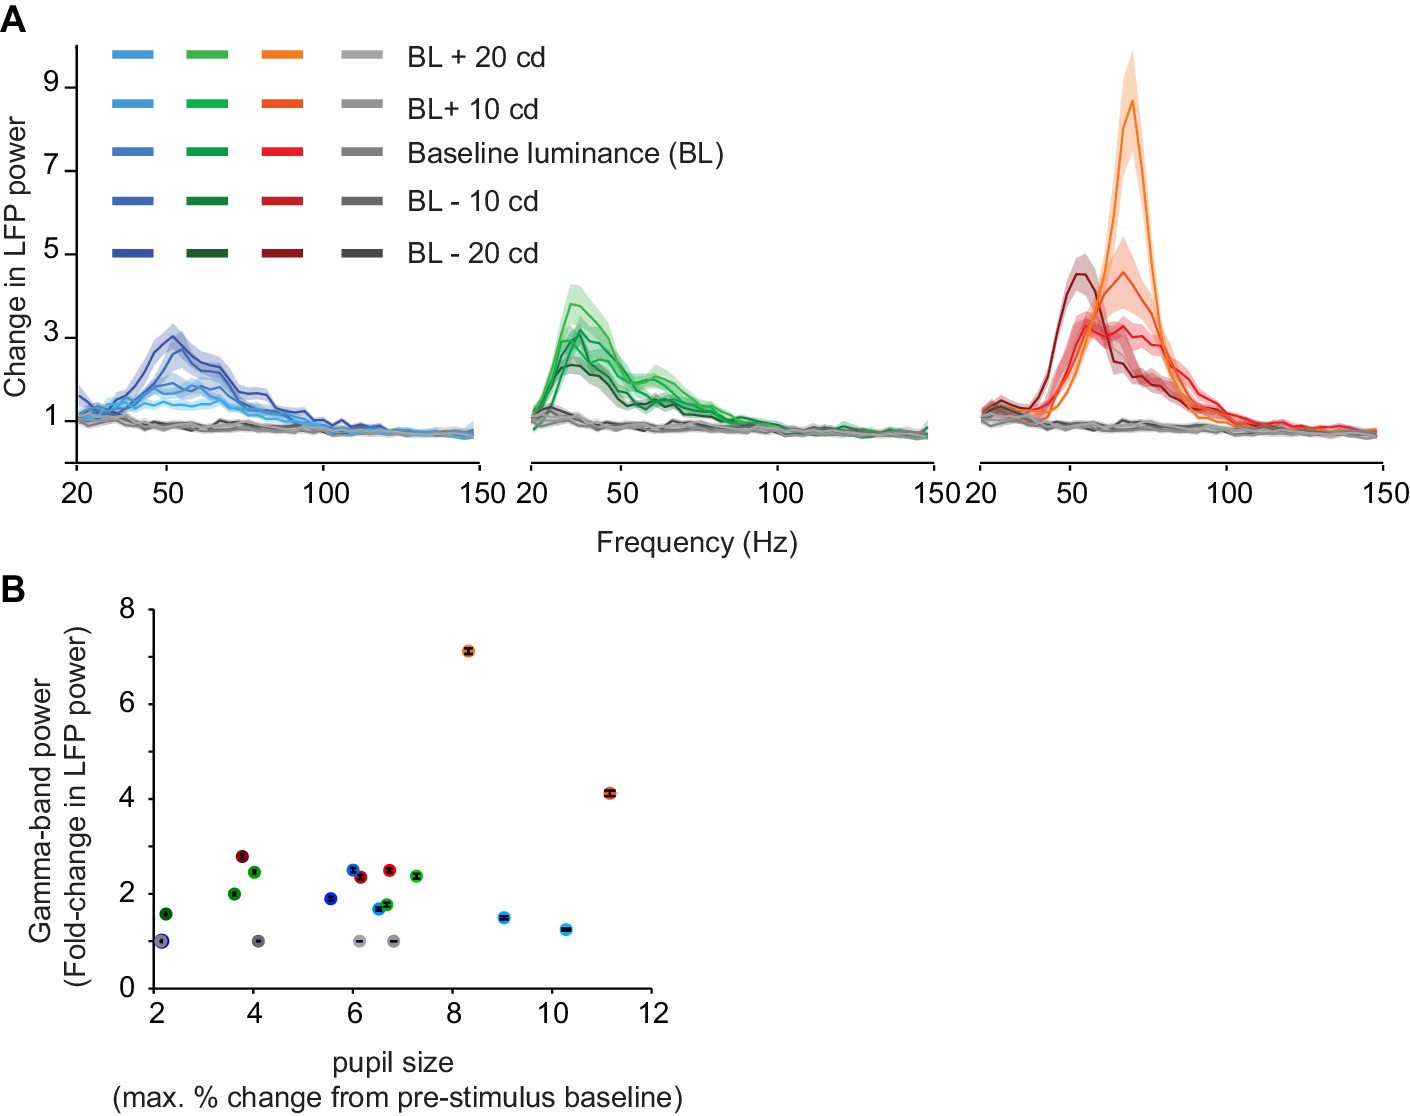
Dependence of gamma LFP power on the surface hue: control experiment for luminance-contrast.
(A) Single session from monkey H with luminance match between achromatic and chromatic surface stimuli. Each color, including gray, was shown at five luminance levels, namely equiluminant to the background grey, or in two steps of 10 cd/m2 brighter or darker than the background. Blue and red hues at higher luminances were obtained by adding luminance from the green channel to maximal blue or red output, respectively. Note that achromatic responses are weaker than chromatic responses also in this luminance-matched case. (B) Dependence of gamma-band power on pupil responses. Pupil responses represent the maximal percent change from baseline during the stimulus period. The correlation over all hues was not significant (r = 0.38, p=0.1). Note that gamma responses for achromatic stimuli were poor regardless of the degree of pupil change.
Figure 4—figure supplement 4
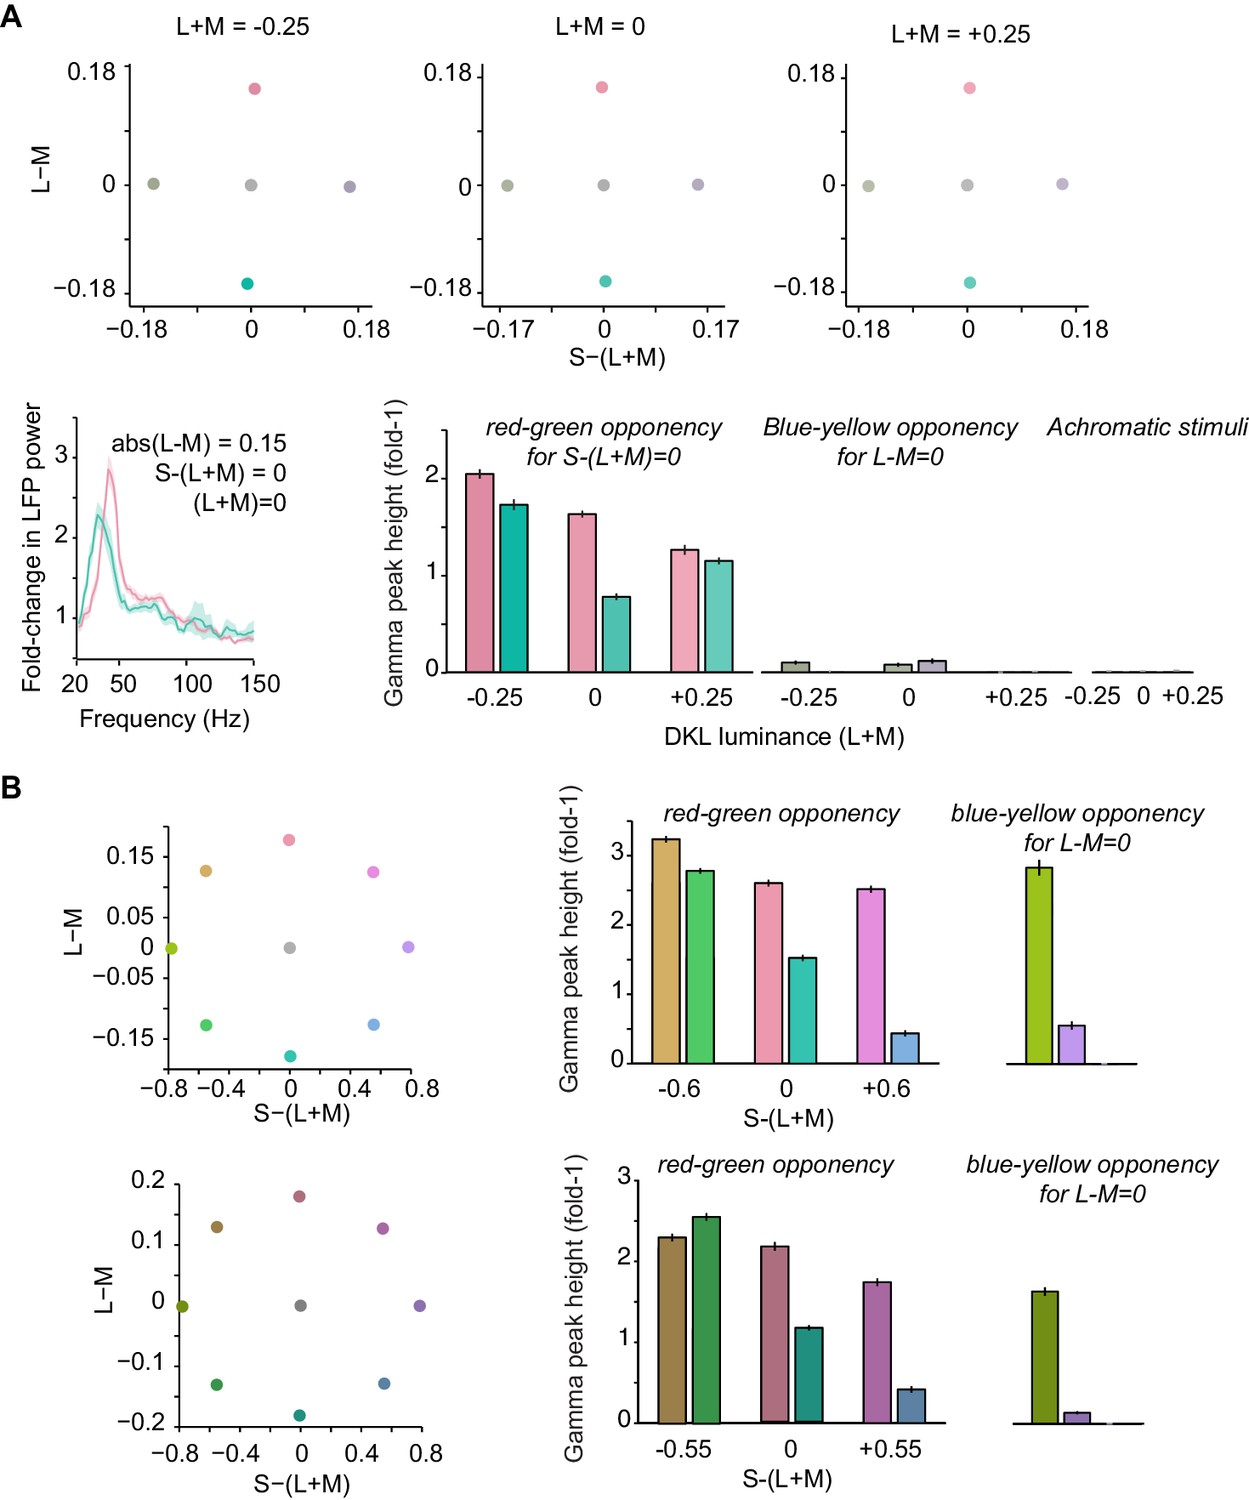
Gamma-band power for stimuli defined on equiluminant DKL planes, control experiment related to Figure 4 of main text.
(A) The DKL-space plots at the top illustrate the employed colors. They were designed to present stimuli with equal cone-contrast in L-M (red-green opponency) and S-(L + M) (blue-yellow opponency) directions, separately for three luminance (L + M) steps of −0.25, 0 and +0.25 relative to the gray background (having RGB values of 175, 175, 175) (N = 1 session in Monkey H). These luminance intensities corresponded to 54.77.9 cd/m2. The spectra and bar plots below show the resulting gamma-band responses. Gamma-band oscillations were stronger for reddish than greenish stimuli and very weak or non-detectable for the blue/yellow and achromatic stimuli. Note however that the blue/yellow components were perceptually very faint at these S-(L + M) values that were matched to the L-M cone-contrast values. In (B) we therefore used a normalization of the S-(L + M) axis to the most negative S-(L + M) value obtainable (along the L-M = 0 axis). (B) Top: Gamma-band activity for stimuli with equal cone-contrast in positive and negative L-M directions, and equal cone-contrast in positive and negative S-(L + M) directions (N = 1 session in monkey H). Stimuli were equiluminant relative to the gray background, which was the same as in (A). Gamma was stronger for reddish than greenish hues. In addition, with a stronger S-(L + M) cone-contrast as compared to panel (A), prominent gamma-band activity was now generated in the absence of a cone-contrast in the L-M direction. This gamma-band activity was stronger in the yellow (positive S-(L + M) values) than the blue direction. Bottom: Same as top, but now for a darker gray background (the same as used for Figure 1 in main text) and darker surface stimuli (of matched luminance to background) (N = 1 session in Monkey H).
Figure 5
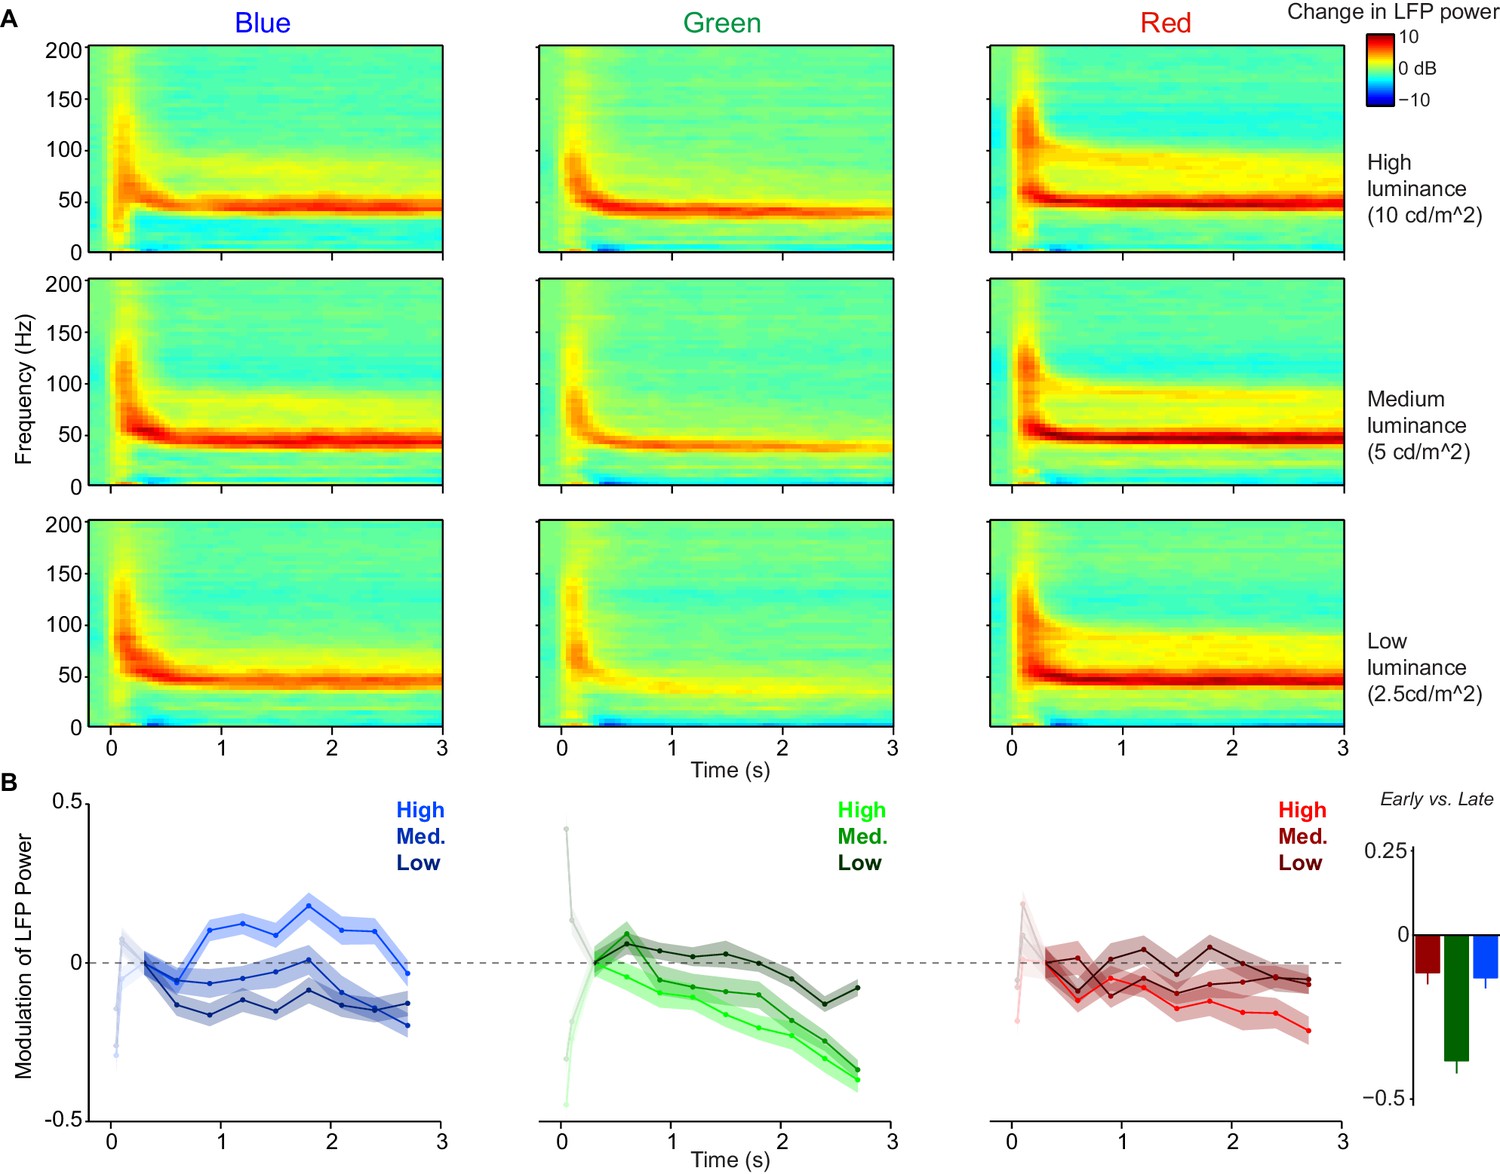
Within-trial temporal dynamics of LFP power spectra during viewing of uniform surfaces.
Time-frequency representations of log-transformed change in LFP power relative to baseline (dB), using Dataset 1 (n = 5 sessions, 19.80.45 trials per condition in each session). Shown are the three (equiluminant) different color hues at three different luminance levels. (B) Change in LFP power relative to 0.3–0.6 s period (third time point), separate for different color hues and luminance levels, shown as fold-change modulation index (see Materials and methods). The first two points correspond to 0.05–0.35 and 0.1–0.4 s and are whitened out because these points are strongly influenced by initial firing transient and associated bleed-in of spiking activity at high frequencies. Right panel shows the modulation of LFP power in early (0.3–0.6 s) versus late (2.7–3.0 s) period, averaged over three luminance levels. The decrease in gamma peak amplitude over time was significantly larger for green than blue and red surfaces (peak amplitude estimated as described in Materials and methods, main effect across luminance levels: p0.05, bootstrap test), and did not differ between blue and red conditions. This also held true for the modulation of LFP power for the highest luminance condition only (p0.05, bootstrap test).
Figure 6 with 3 supplements
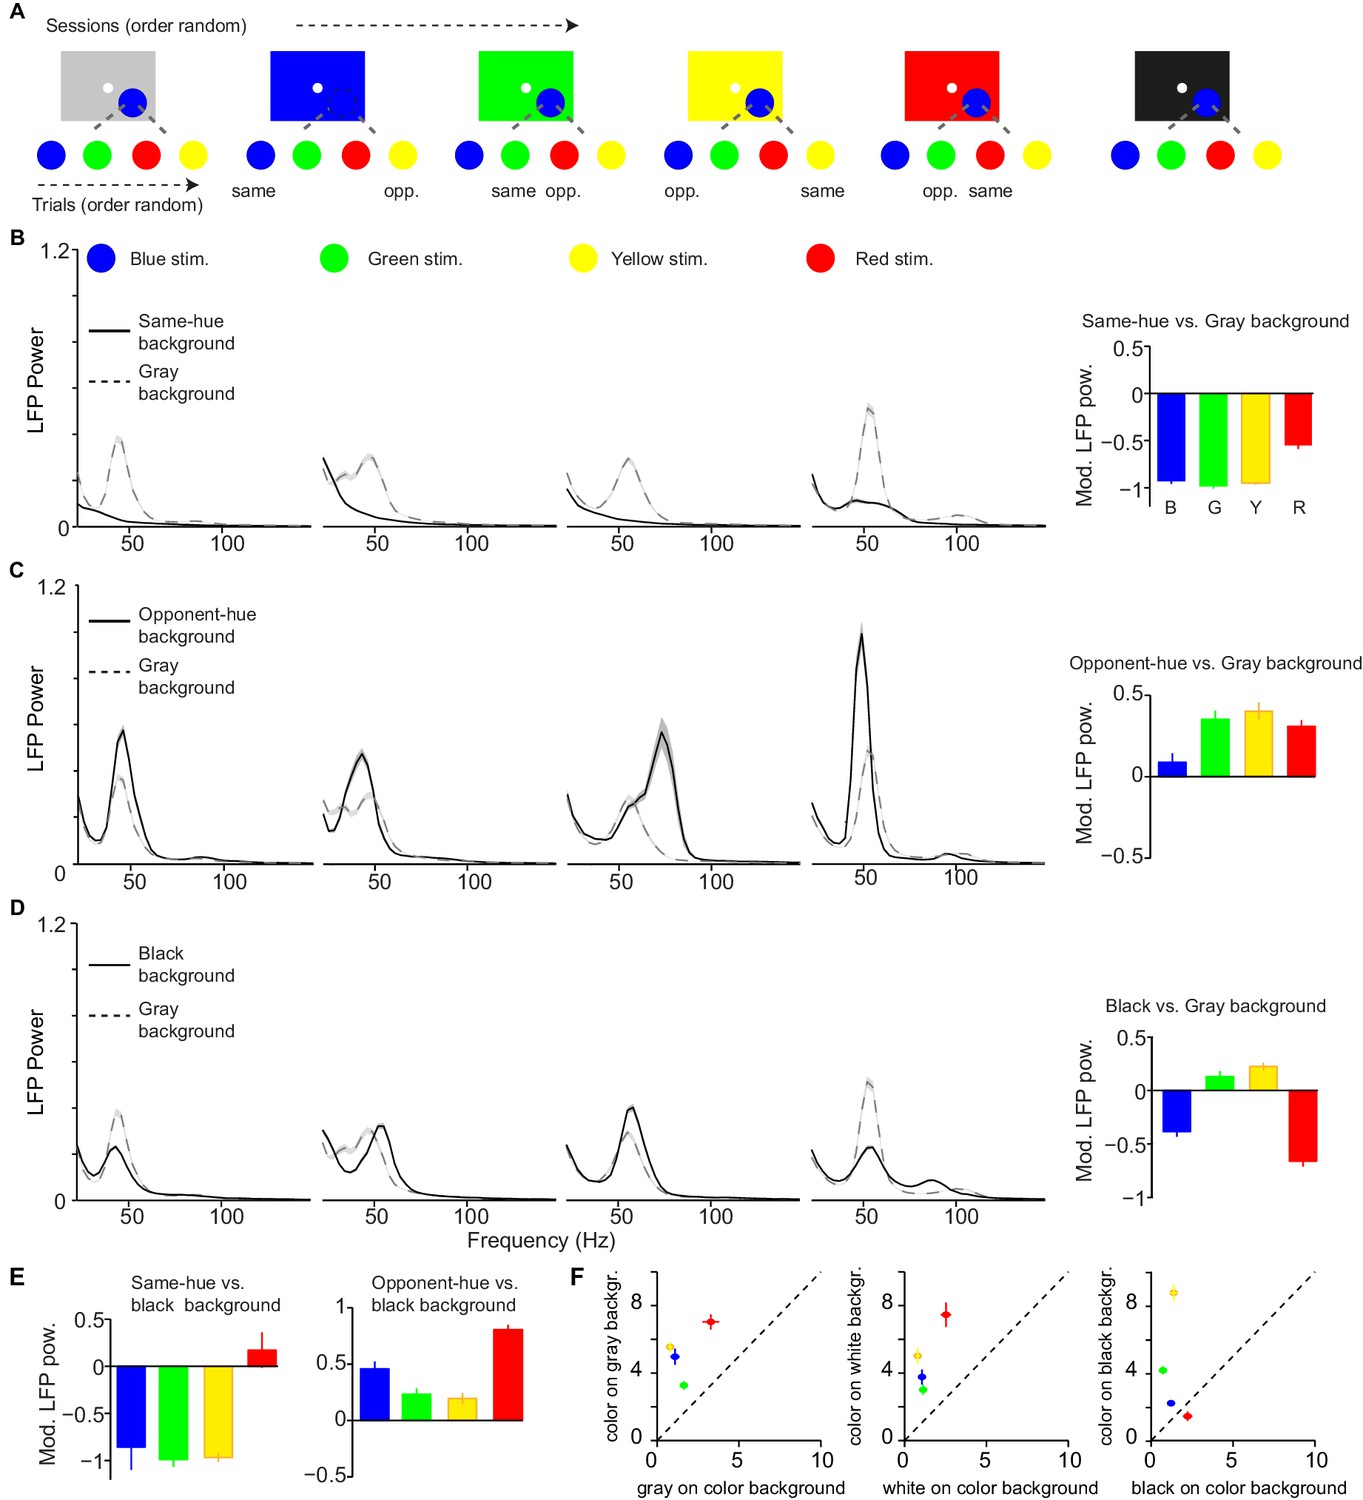
Dependence of LFP power spectra on background stimulus.
(A) Illustration of paradigm (Dataset 5, see Materials and methods; n = 25 sessions, 18.640.11 trials per condition and session). In a given session, a fixed background stimulus was used, and a set of chromatic and achromatic surfaces (6 or 8 deg) were presented in separate trials (see Materials and methods). (B) Average LFP power spectra for the different color conditions during gray background versus same-hue background sessions. We show analyses for blue, green, yellow, and red surfaces, presented at maximum possible luminance. Right: modulation index of LFP gamma-amplitudes (see Materials and methods). Main effect: p0.05, bootstrap test. R versus G, B or Y, and G versus B: p0.05, bootstrap test. (C) As B) for comparison of opponent color background and black background condition Main effect: p0.05. B versus R, G or Y, p0.05. (D) black background versus gray background. Main effect not significant. All color differences significant (p0.05, bootstrap test). (E) Modulation of gamma-band amplitude for same-hue vs black background condition (left), as well as opponent-hue vs black background condition (right). Left: p0.05: R versus G, B or Y; B versus G or Y Right: p0.05: all combinations except G versus Y. (F) Comparison of gamma-band responses between chromatic surfaces shown on achromatic background and achromatic surfaces shown on the same respective chromatic background (using the data shown in Figure 6—figure supplement 2).
Figure 6—figure supplement 1
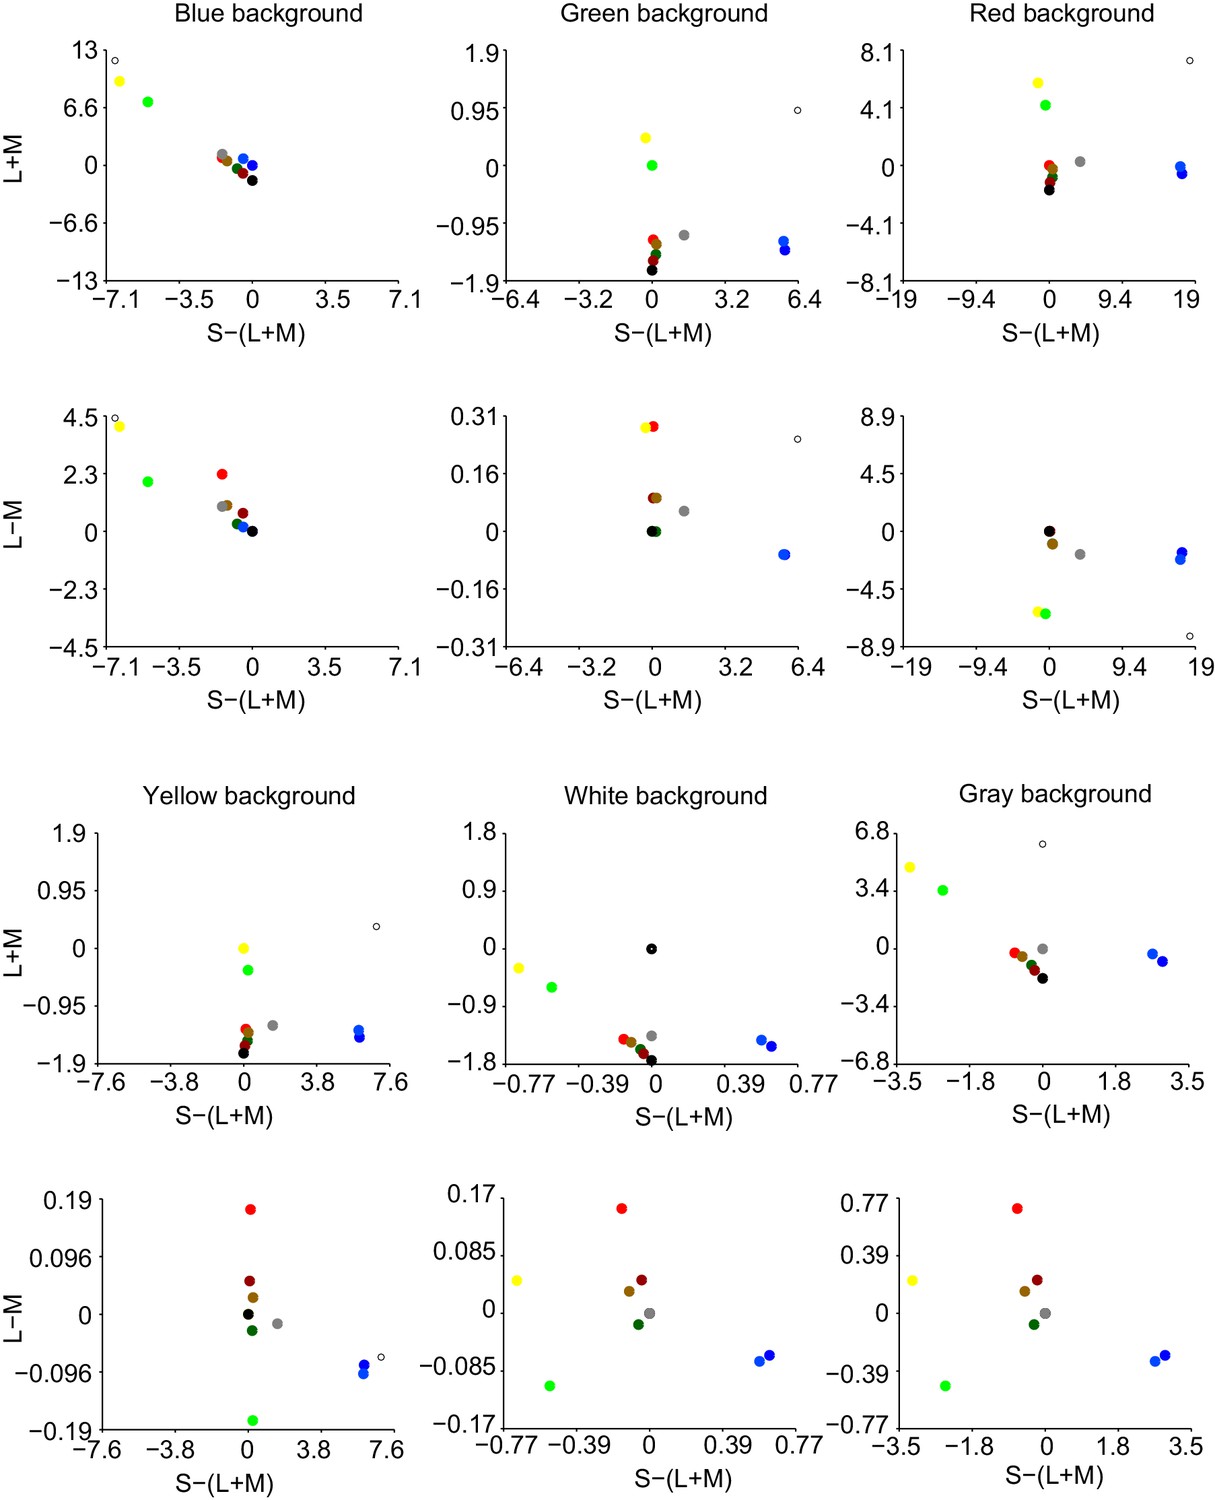
DKL-space representation for Figure 6 (main text) and Figure 6—figure supplement 2.
https://doi.org/10.7554/eLife.42101.017
Figure 6—figure supplement 2
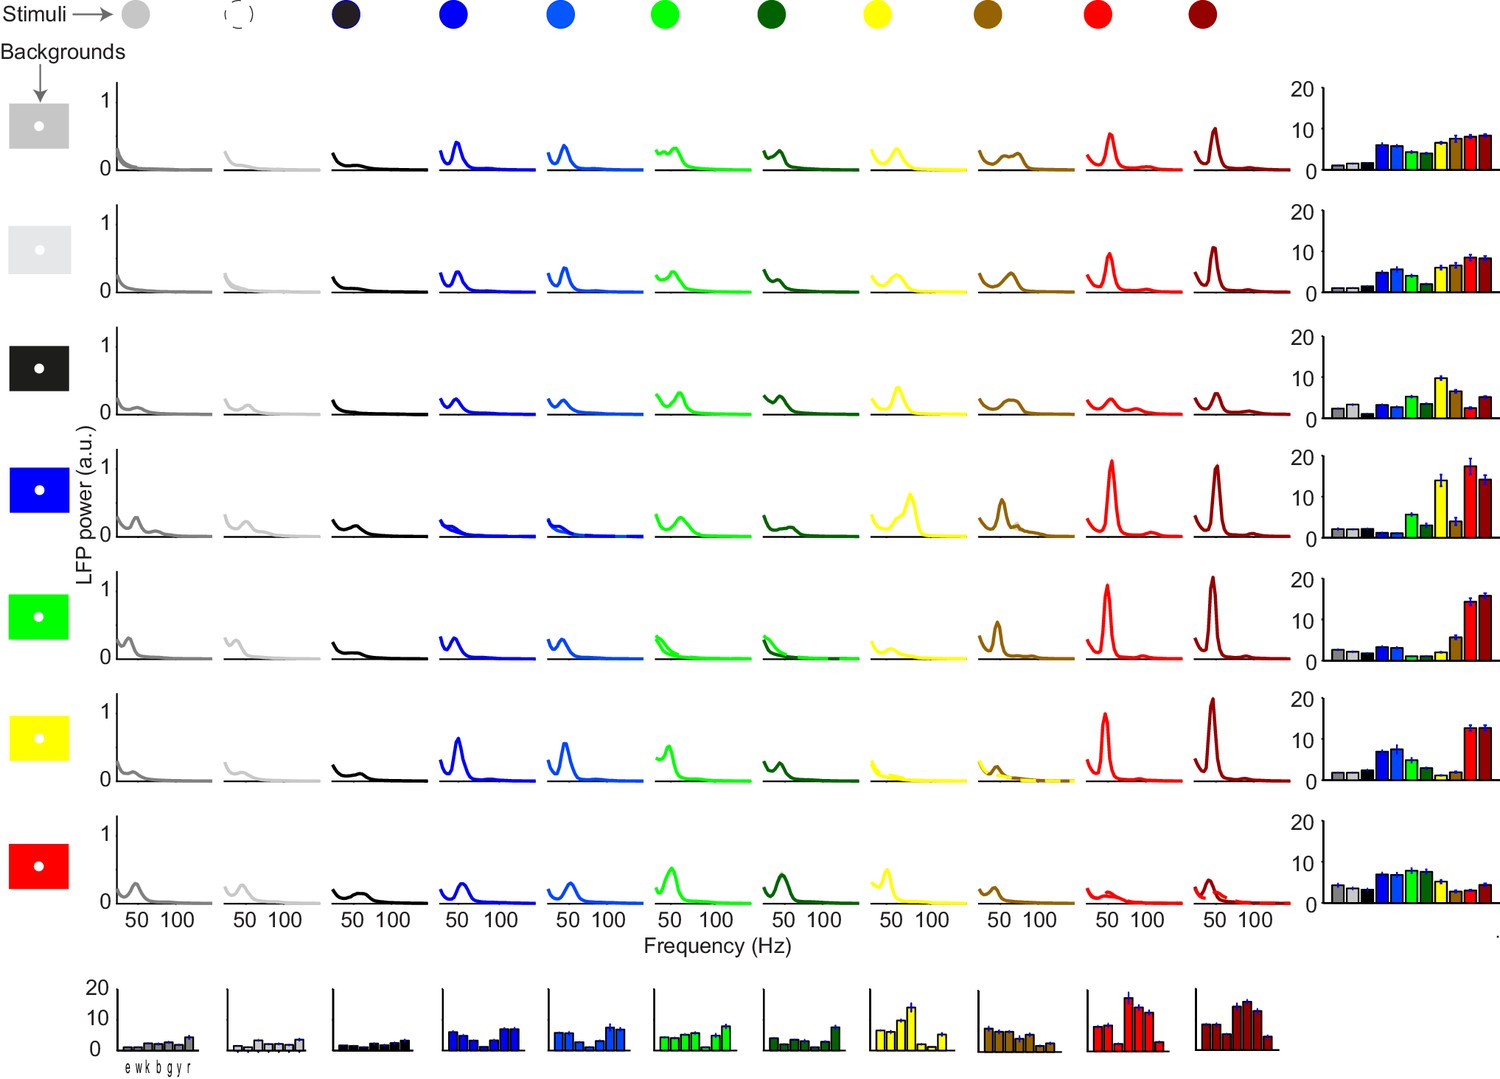
Dependence of gamma LFP power on the combination surface hue and background stimulus.
We show here all the condition combinations for Dataset 5. Different rows correspond to different stimulus background conditions. The color of the background is indicated by the background stimulus shown on the left. The second row corresponds to a white background. Different columns correspond to different stimulus hue conditions, which are indicated by the color of the lines in each graph. Each graph depicts the average LFP power spectrum, using the same estimation parameters as in Figure 6 of the main text. Bar graphs on the bottom show the gamma peak amplitude (fold-change) for the different backgrounds, separate for each surface hue. Bar graphs on the right show the gamma peak amplitude (fold-change) for the different surface hues, separate for each background condition.
Figure 6—figure supplement 3
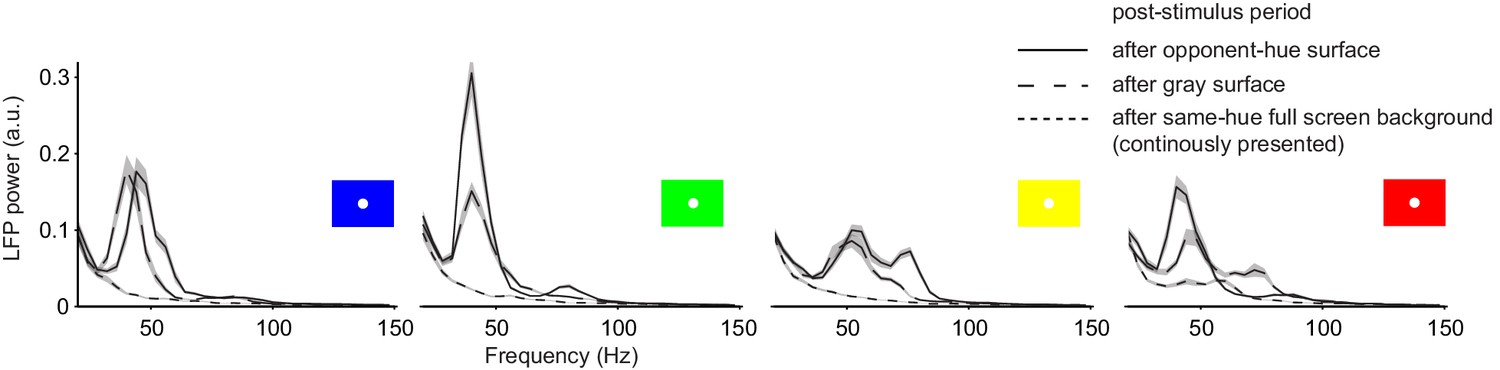
LFP power spectra for the post-stimulus period for the four chromatic background hues (3.5–3.8 s, excluding the initial transient response after stimulus offset at 3.3 s).
Clear gamma-band responses were observed for full-screen surfaces after both gray and opponent-hue surface presentation in the stimulus period.
Figure 7 with 1 supplement
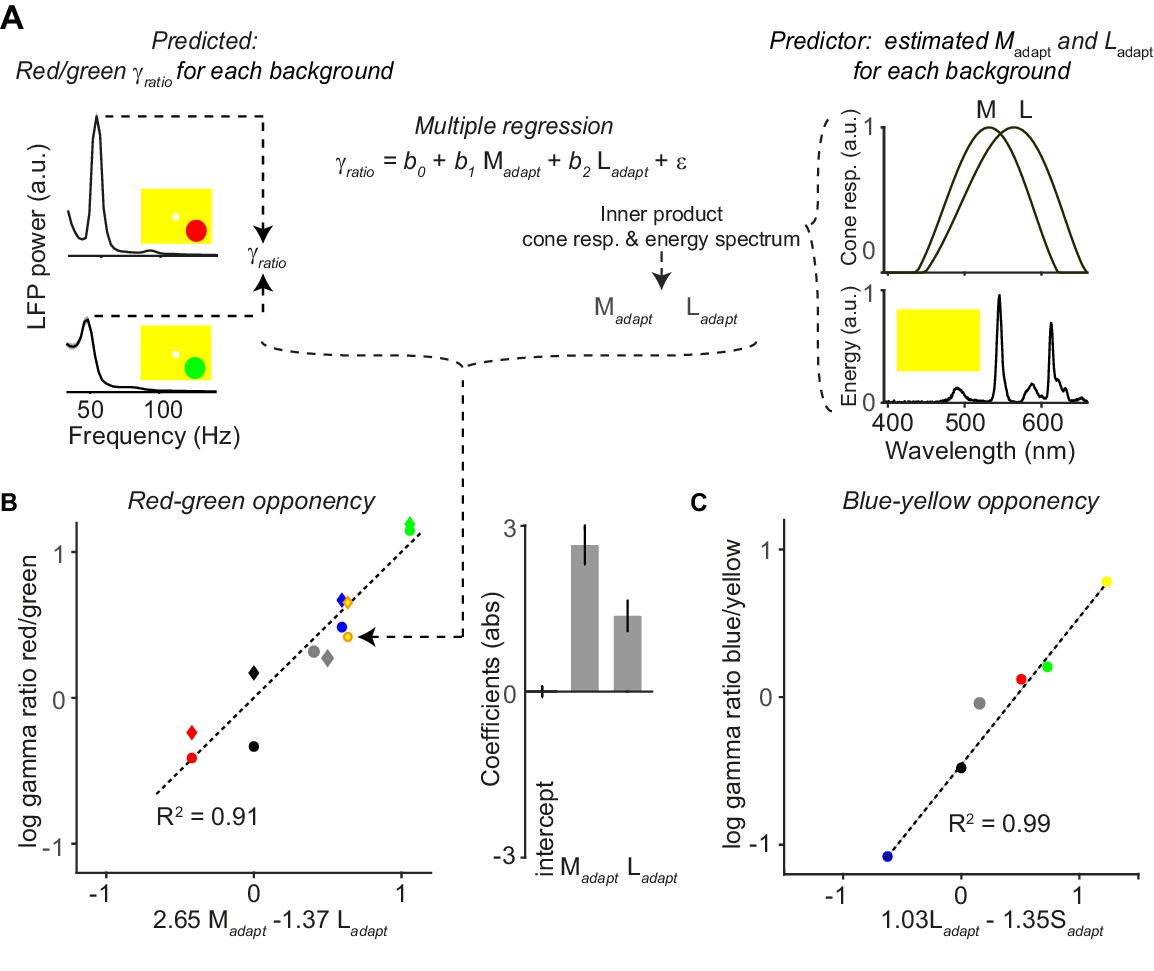
Quantitative model for dependence of gamma-band amplitude on background stimulus.
(A) With a multiple regression model, we predicted the ratio of gamma amplitude for red over green surface stimuli. Shown are the LFP gamma power spectra for red (top) and green (bottom) surface stimuli, with a yellow FSB. Normalized cone responses for macaque monkeys are shown on the right, constructed by fitting polynomials to bleaching difference spectra data (Hárosi, 1987). For each full-screen background (FSB), we estimates the extent to which it adapted the three cones (, and ; see Materials and methods), by convolving the spectral energy of the FSB with the normalized cone response curves. For illustration purposes, we only show the M- and L-cone response curve. (B) The hues of the data points correspond to the FSB, and the shape indicates whether the red and green surfaces were presented at maximum possible luminance intensity (circle), or whether they were presented at equiluminant intensities (diamond). As predictor variables we used and for the different FSBs. The dependent variable was the red/green gamma-ratio, . The coefficients indicates the relative influence of the two adaptation parameters on the , and the sign indicates whether adaptation of a given cone is increasing or decreasing the red/green gamma-ratio. (C) Similar to (B), but now for blue-yellow. In this case we used and as prediction parameters. A model using in addition did not yield a significant coefficient for .
Figure 7—figure supplement 1
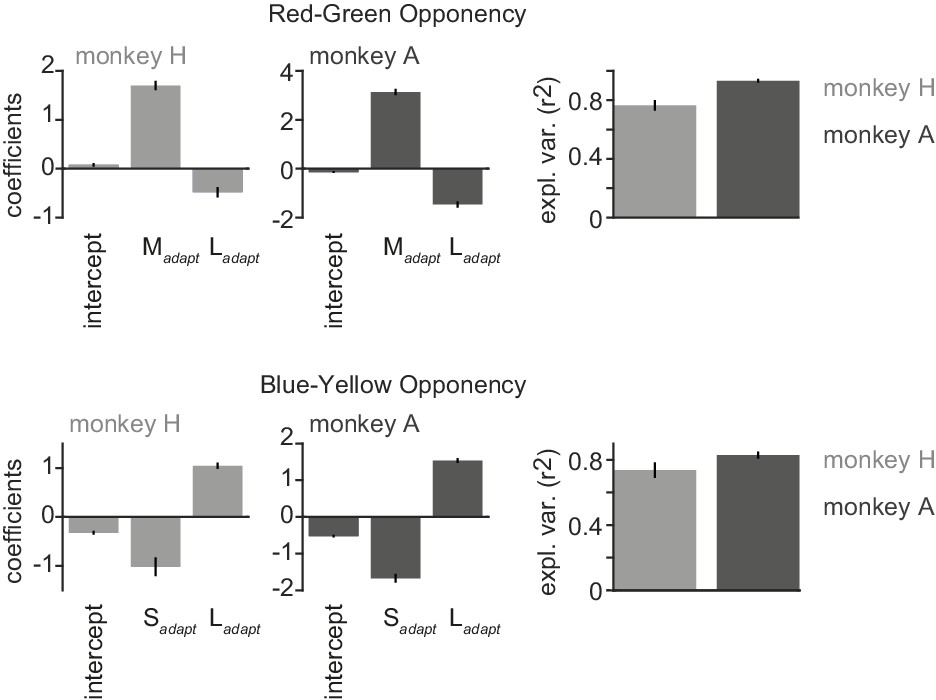
Analysis of Figure 7 in main text performed separately for the two monkeys.
Top: Red-green opponency. Shown are the adaptation coefficients and for the two monkeys separately, and the regression coefficients of the red-green as a function of these coefficients. Bottom: Same, but now for blue-yellow opponency.
Additional files
-
Supplementary file 1
RGB values, luminances (cd/m2) and CIE values (*1000) used in this study.
Luminances and CIE values were measured with a Konica Minolta CS-100A chromameter, CIE values refer to the 1931 two degree standard observer. Standard black, white and gray used across datasets are in rows 1–3.
- https://doi.org/10.7554/eLife.42101.022
-
Transparent reporting form
- https://doi.org/10.7554/eLife.42101.023
Download links
A two-part list of links to download the article, or parts of the article, in various formats.
Downloads (link to download the article as PDF)
Open citations (links to open the citations from this article in various online reference manager services)
Cite this article (links to download the citations from this article in formats compatible with various reference manager tools)
Surface color and predictability determine contextual modulation of V1 firing and gamma oscillations
eLife 8:e42101.
https://doi.org/10.7554/eLife.42101


