Oligodendrocytes regulate presynaptic properties and neurotransmission through BDNF signaling in the mouse brainstem
- University of Texas Health Science Center, United States
- The Second Xiangya Hospital, Central South University, China
Figures
Figure 1
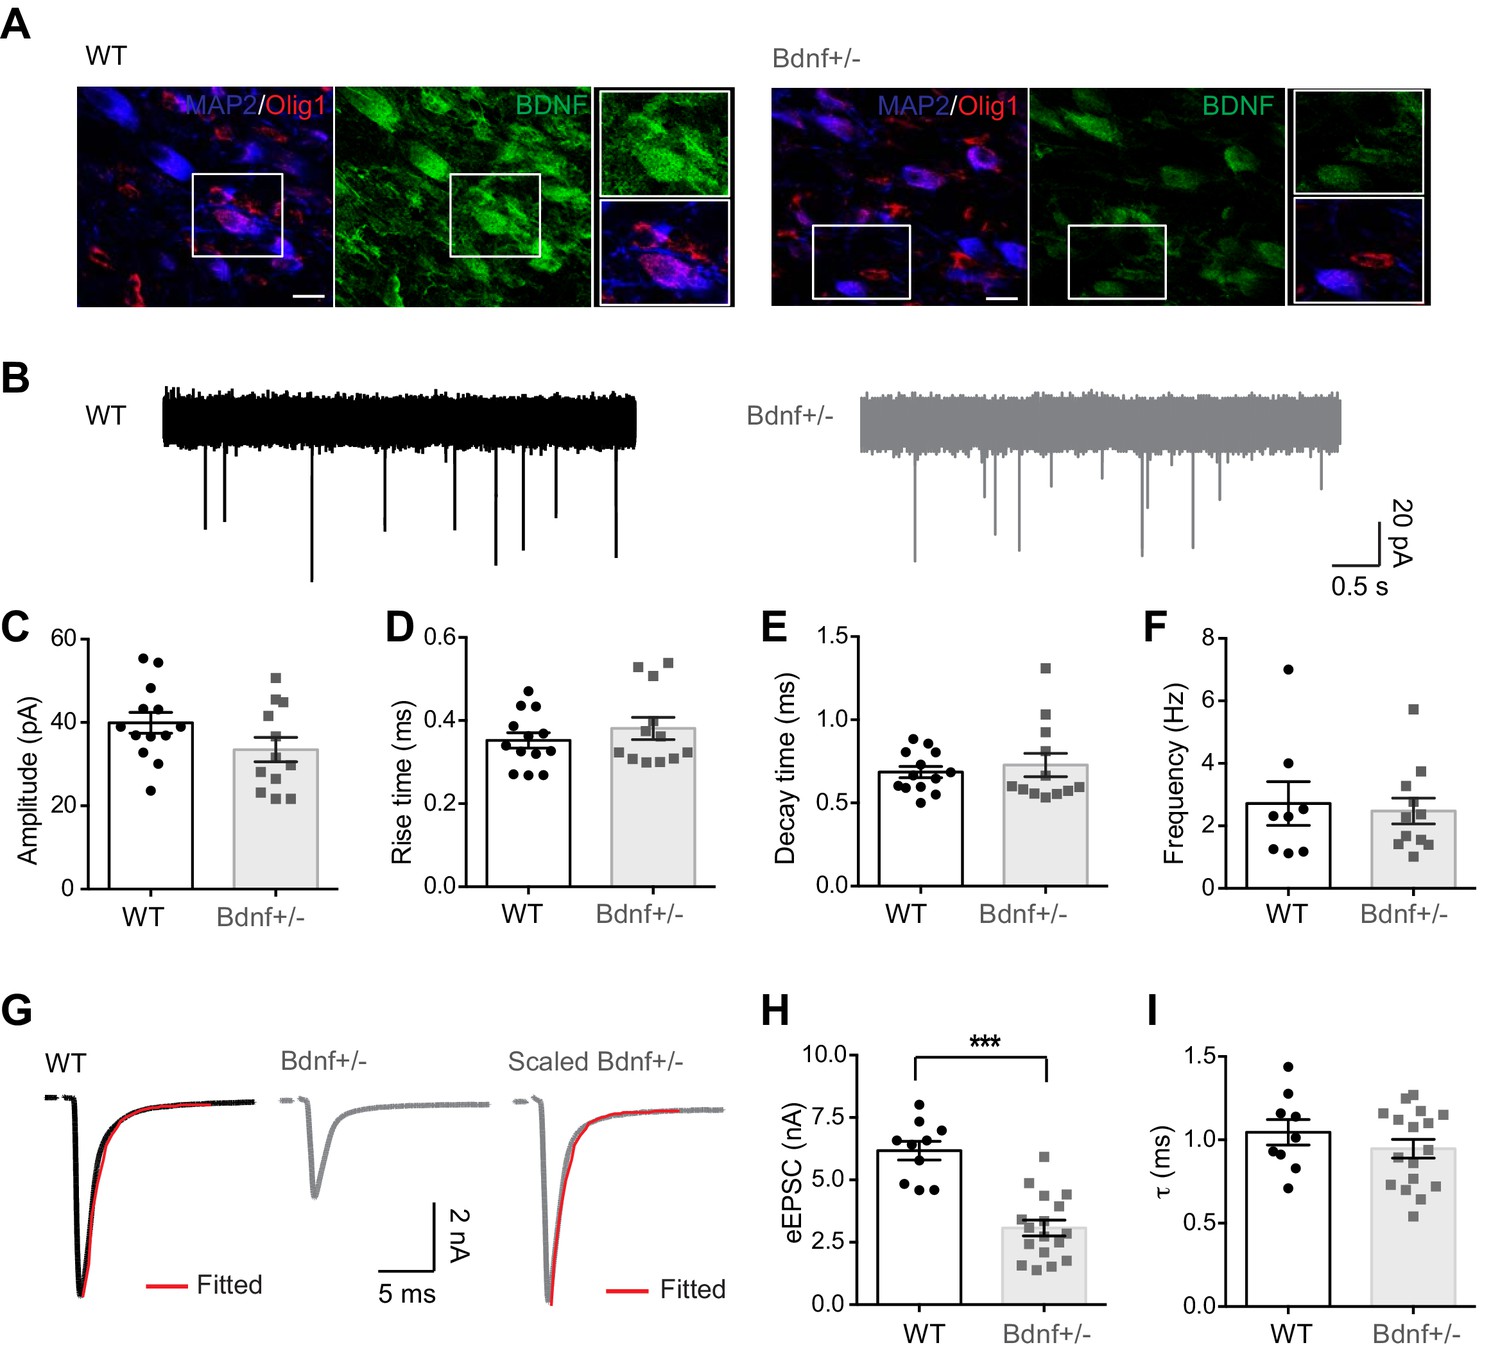
Reduction in endogenous BDNF impairs synaptic transmission at the calyx of Held synapse.
(A) Representative immunolabeled images for endogenous BDNF expression (green) in the MNTB principal neurons (MAP2, blue) and oligodendrocytes (Olig1, red) in WT and Bdnf+/– mice at postnatal day (P)21. Images shown are representative of results from n = 5 mice per group. Scale bars, 20 μm. (B) Representative traces of mEPSCs from MNTB neurons in WT (black) and Bdnf+/– mice (gray) at P16–20. (C–F) Quantification of the amplitude (C), rise time (D), decay time (E), and frequency (F) of mEPSCs from WT and Bdnf+/– mice. (G) A single EPSC evoked by afferent fiber stimulation in WT (black) and Bdnf+/– (gray) mice. The decay time constant (τ, red) was obtained by single exponential fitting after normalizing the amplitude of EPSCs from Bdnf+/– mice. (H, I) Summary of the amplitude (H) and decay time constant (I) of eEPSCs from WT and Bdnf+/– mice. Data are shown as the mean ± s.e.m. ***p<0.001 (unpaired t-test).
Figure 2

Reduction in endogenous BDNF alters presynaptic properties at the calyx terminals.
(A) Representative traces of EPSCs evoked by paired-pulse stimulation from WT (black) and Bdnf+/– (gray) mice (at P16, left). Summary of the PPR (right). (B) Trains of eEPSCs at 100 Hz stimulation in WT (black) and Bdnf+/– (gray) mice (left). Normalized amplitude of eEPSCs relative to the first eEPSC amplitude in WT and Bdnf+/– mice (right). (C) Plot of eEPSC amplitudes against the amplitude of the cumulative eEPSC in WT and Bdnf+/– mice. Plots were linearly fitted from the second through the fourth cumulative eEPSCs (red line for WT and blue line for Bdnf+/–), which were estimated by back-extrapolated linear fits to the x axis to estimate the RRP. (D, E) Summary of the cumulative eEPSC size and the release probability (Pr) using the EQ method in WT and Bdnf+/– mice. (F) Plot of the cumulative eEPSC against stimulus number in WT and Bdnf+/– mice. A line fit to the steady-state points is back-extrapolated to the y-axis to estimate the RRP. (G) Summary of the release probability (Pr) using the SMN method in WT and Bdnf+/– mice. (H) Left, EPSCs evoked at 30 s before and after tetanic stimulation (100 Hz, 3 s) from WT (top) and Bdnf+/– (bottom) mice. Right, plot of normalized eEPSC amplitude after the tetanus relative to the eEPSC amplitude before the tetanus. (I) Summary of the amplitude of eEPSCs before and after the tetanus from WT and Bdnf+/– mice. Data are shown as the mean ± s.e.m. *p<0.05; **p<0.01 (unpaired t-test; paired t-test).
Figure 3 with 1 supplement
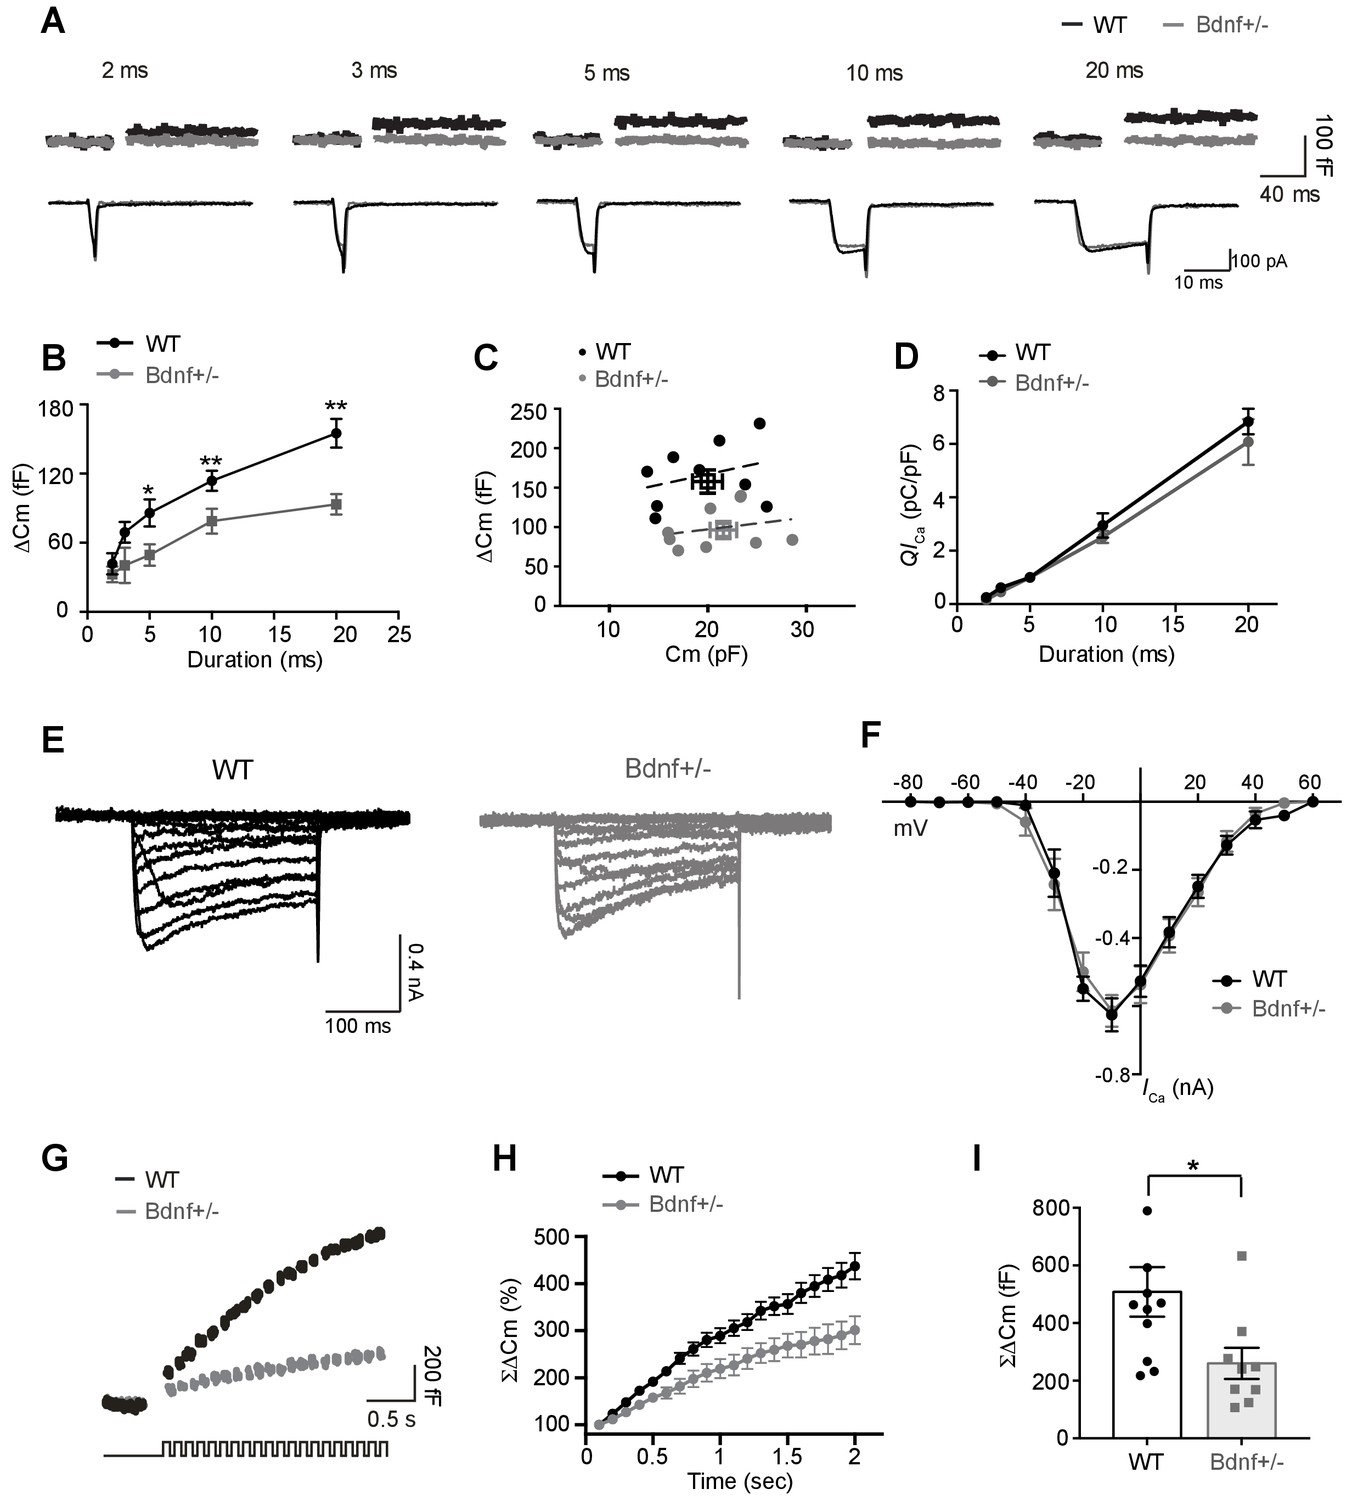
Exocytosis of vesicular glutamate is decreased at the calyx terminals in Bdnf+/– mice.
(A) Representative traces of membrane capacitance (Cm; top) and Ca2+ current (ICa; middle) induced by 2-, 3-, 5-, 10-, and 20 ms depolarization (bottom) from P9–13 calyx terminals in WT (black) and Bdnf+/– (gray) mice. Capacitance within 50 ms after depolarization is not shown to avoid artifacts. (B) Summary of capacitance changes (ΔCm), which are plotted against the depolarization duration in WT and Bdnf+/– mice. (C) Scatter plot: ΔCm (elicited by 20 ms depolarization)is plotted against the corresponding resting Cm for each calyx terminal. The squares indicate the mean value. The black and gray lines are linearly fit from each dot for WT and Bdnf+/– mice, respectively. (D) Summary of Ca2+ current charge (QICa), which is plotted against the depolarization duration for each genotype. (E) Representative traces of ICa induced by a 200 ms step-like depolarization (from –80 to 60 mV, Δ10 mV) in WT (black; n = 5) and Bdnf+/– (gray; n = 5) mice. (F) The I–V relationship for voltage-activated Ca2+ channels at the calyx terminal for each genotype is also shown. (G) Examples of Cm (top) induced by the train of 20 depolarizing pulses (10 ms, 10 Hz; bottom) from –80 to 0 mV in WT (black; n = 11) and Bdnf+/– (gray; n = 9) mice. (H) Summary of the normalized accumulated capacitance jump (ΣΔCm) relative to the stimulation time for each genotype. Data were normalized relative to the capacitance jump induced by the first 10 ms depolarization. (I) Summary of the ΣΔCm after the train of 20 depolarizing pulses (at 2 s) in each genotype. Data are shown as the mean ± s.e.m. *p<0.05; **p<0.01 (unpaired t-test).
Figure 3—figure supplement 1
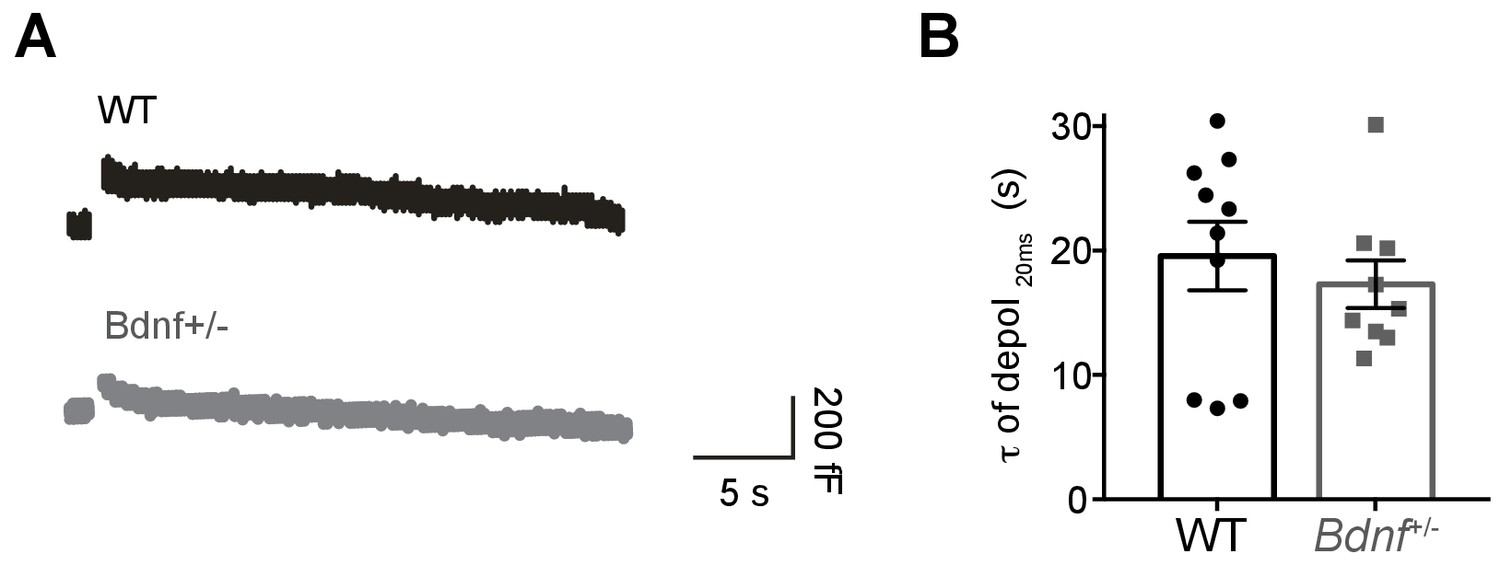
Reduction of endogenenous BDNF does not affect endocytosis in the calyx of Held.
(A) Representative membrane capacitance (Cm) induced by 20 ms depolarization from P9-13 calyx terminals in WT (black) and Bdnf+/- (gray) mice. The capacitance decay (τ of depol20ms) was measured from the exponential fit and indicates endocytosis rate. τ of depol20ms was measured within 30 s after 20 ms depolarization from −80 to 0 mV. (B) Summary of endocytosis rate, which is similar between WT (black; 19.56 ± 2.7 s; n = 10) and Bdnf+/- mice (gray; 17.29 ± 1.9 s; n = 9; p=0.51). Data are shown as the mean ± s.e.m. Unpaired t-test.
Figure 4
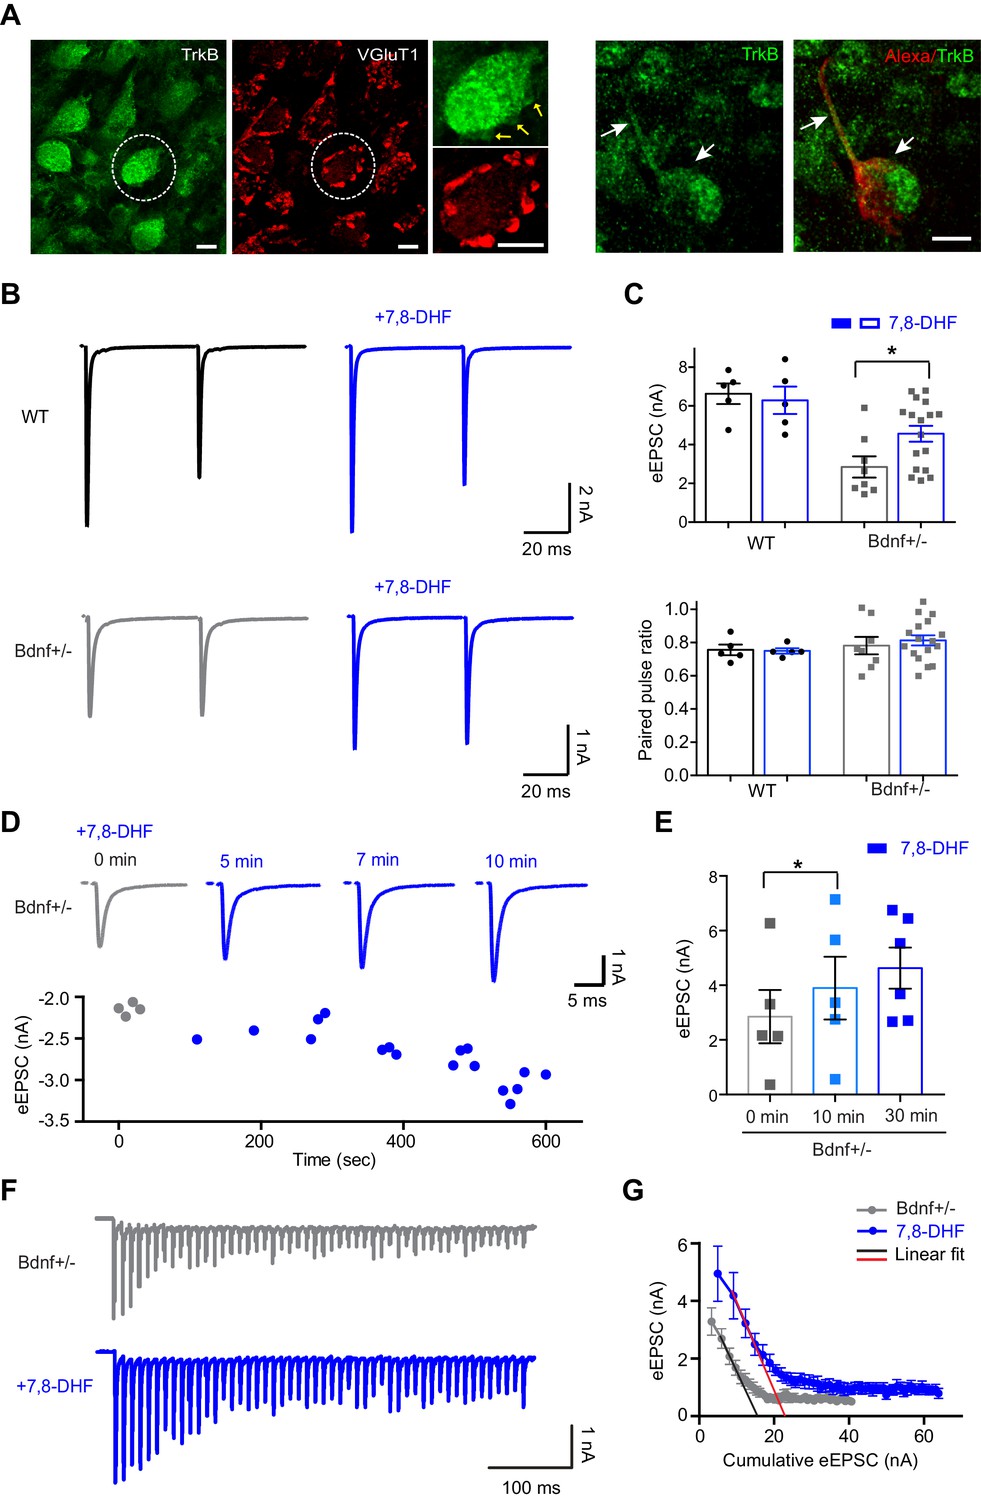
The activation of TrkB rescues decreased glutamate release at the calyx terminal.
(A) Expression of TrkB (green) and VGluT1 (red) at calyx terminals in the MNTB from WT mice (P20). The calyx terminal and axon (arrows, P12 WT mice), filled with Alexa 568 during whole-cell recording, expressed TrkB (green). Scale bars, 10 μm. (B) Representative traces of eEPSCs in response to paired-pulse stimulation in the absence or presence of 7,8-DHF for WT (n = 5) and Bdnf+/– (n = 17) mice. (C) Summary of the effect of 7,8-DHF on the eEPSC amplitude (top) and the PPR (bottom). (D) Top, example of eEPSCs at 0, 5, 7, and 10 min after the acute application of 7,8-DHF. Bottom, the amplitude of eEPSCs is plotted against time after 7,8-DHF application. (E) Summary of the acute effect of 7,8-DHF on eEPSCs at different time points. (F) Representative traces of the eEPSC train at 100 Hz from Bdnf+/– mice in the absence (gray; n = 11) or presence of 7,8-DHF (blue; n = 7). (G) Plot of eEPSC amplitude against the amplitude of the cumulative eEPSC from Bdnf+/– mice in the absence (gray) or presence of 7,8-DHF (blue). The black and red lines represent the linear fit from the second through fourth cumulative eEPSCs. Data are shown as the mean ± s.e.m. *p<0.05 (unpaired t-test; paired t-test).
Figure 5 with 2 supplements
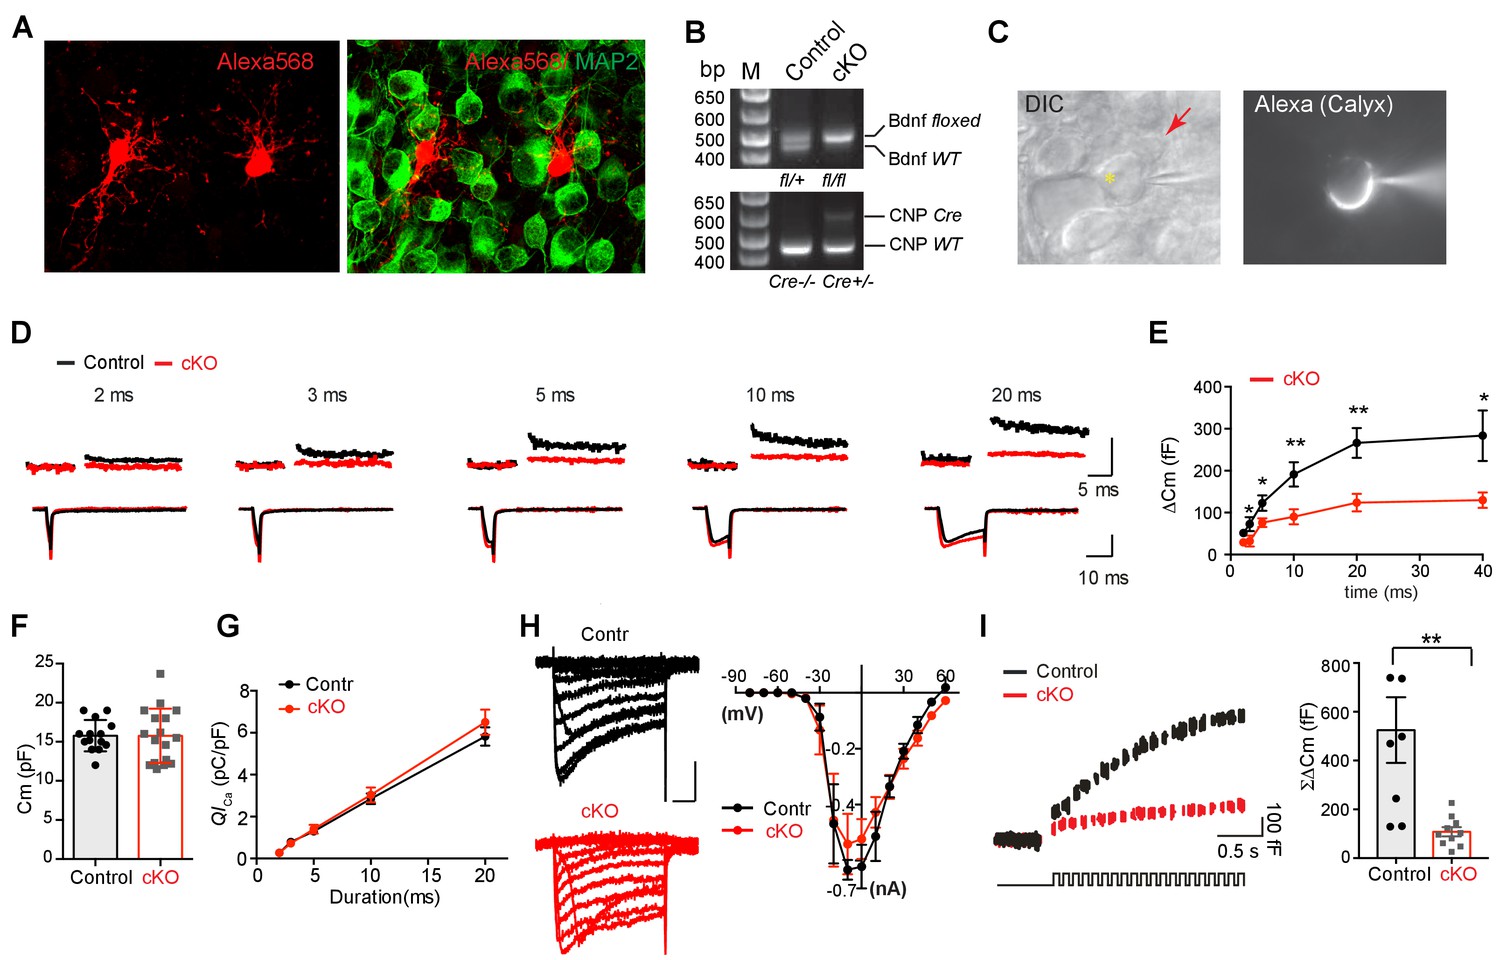
Removal of endogenous BDNF from oligodendrocytes affects exocytosis of vesicular glutamate at the presynaptic terminal.
(A) Confocal images of oligodendrocytes filled with Alexa 568 using whole-cell recording and MNTB principal neurons, which were immunolabeled with MAP2, from a WT mouse (P10). (B) Conditional deletion of BDNF in oligodendrocytes (Cnpcre: Bdnffl/fl). Genotyping PCR using genomic DNA from control and Bdnf cKO mice, which are Cnpcre: Bdnffl/+ and Cnpcre: Bdnffl/fl, respectively. (C) DIC and fluorescence images of the patched calyx terminal filled with Alexa568. Oligodendrocyte (red arrow) was located in close to the calyx synapse in the MNTB. Yellow asterisk indicates MNTB principal neuron. (D) Representative traces for membrane capacitance (Cm; top) and Ca2+ current (ICa; bottom) induced by 2-, 3-, 5-, 10-, and 20 ms depolarization (bottom) from P10–12 calyx terminals in control (black) and Bdnf cKO (red) mice. Scale: 200 fF (top) and 500 pA (bottom), respectively (E) Depolarization duration plotted against ΔCm for control (black; 2 ms, n = 23; 3 ms, n = 16; 5 ms, n = 23; 10 ms, n = 27; 20 ms, n = 24; 40 ms, n = 3) and Bdnf cKO mice (red; 2 ms, n = 25; 3 ms, n = 10; 5 ms, n = 24; 10 ms, n = 25; 20 ms, n = 23; 40 ms, n = 4). (F) Summary of the resting Cm in WT and Bdnf cKO mice. (G) The plot of depolarization duration versus Ca2+ current charge (QICa) was generated from data as in (D) for both genotypes. (H) Left: Representative traces of ICa induced by a 100 ms step-like depolarization (from –80 to 60 mV, Δ10 mV) in control (black; n = 4) and Bdnf cKO mice (red; n = 5). Right: The I–V relationship for voltage-activated Ca2+ channels at the calyx terminal for each genotype is also shown. (I) Summary of the ΣΔCm after the train of 20 depolarizing pulses (at 2 s) for each genotype. Data are shown as the mean ± s.e.m. *p<0.05; **p<0.01 (unpaired t-test).
Figure 5—figure supplement 1
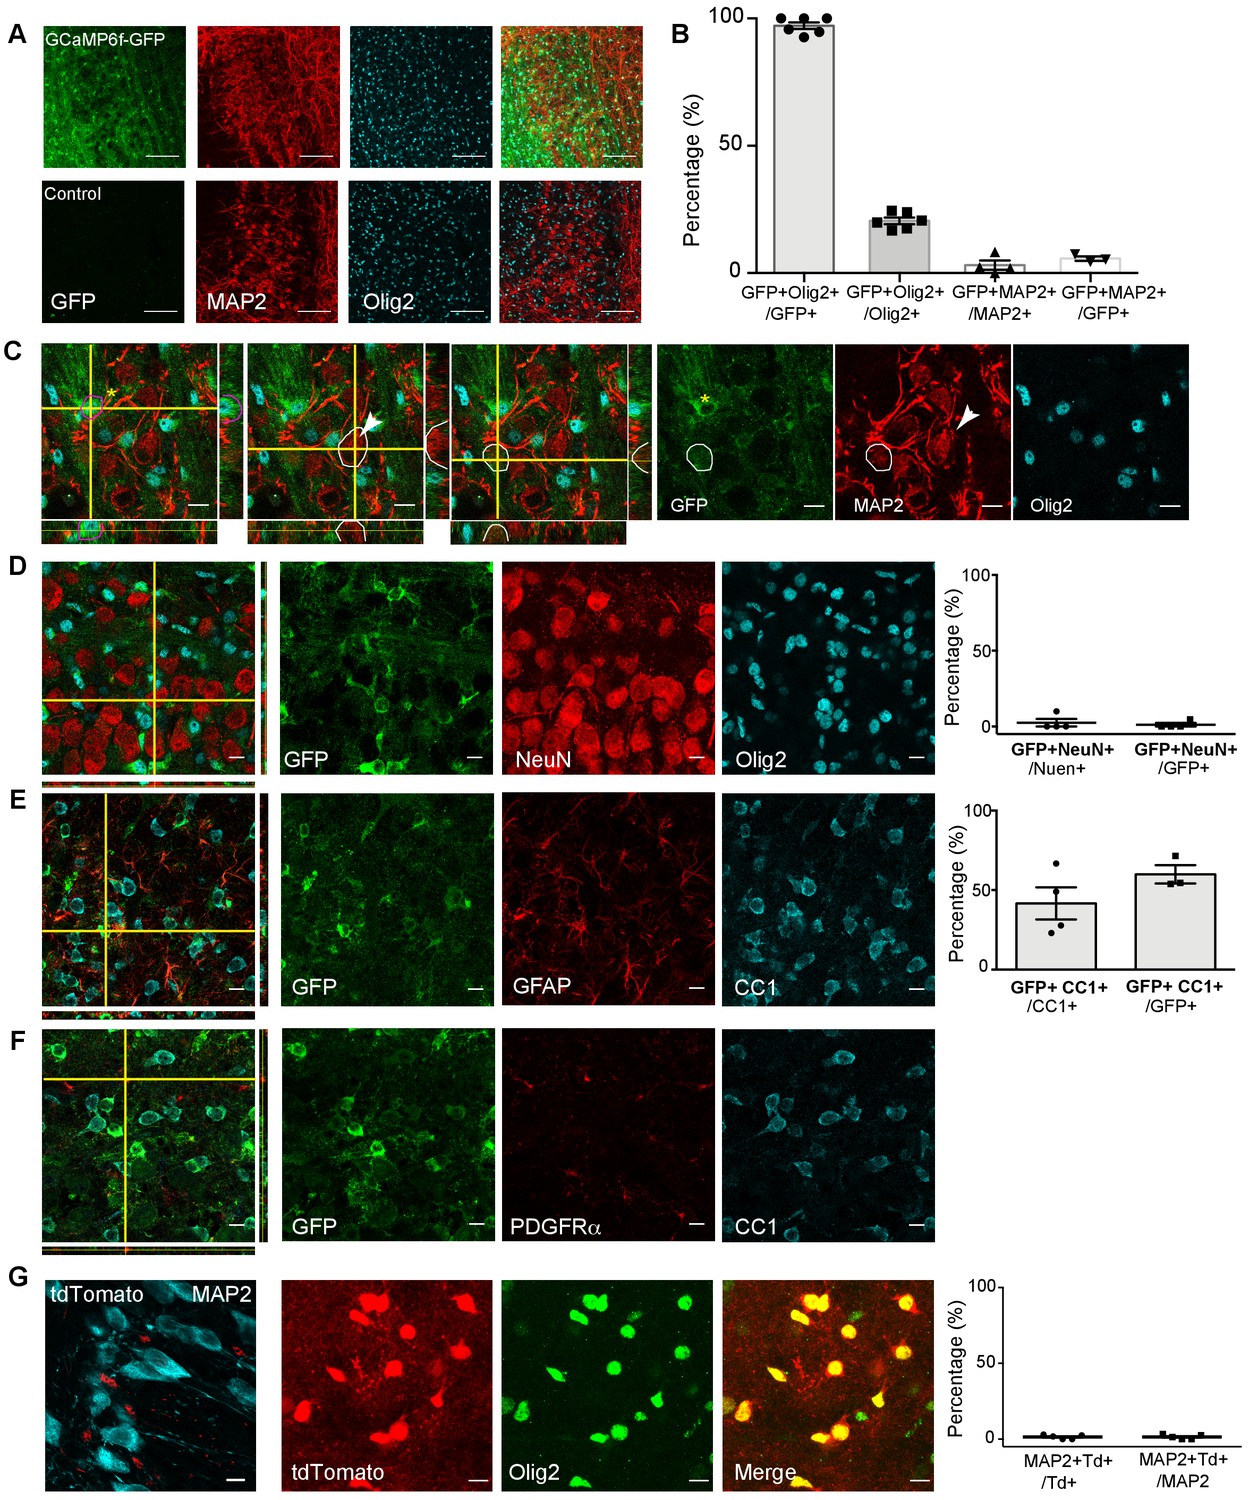
The specificity of the Cnpcre line.
(A) Cnpcre driven GFP-tagged GCaMP6f in Cnpcre:GCaMP6f-GFP+ mice (GFP) demonstrates expression in OLs. Upper: Co-localization of GFP with neuronal marker (MAP2) and OL marker (Olig2) in 20x image (z projection, 20 μm). Lower: Negative control, No GFP is seen in negative control (Cnpcre: GCaMP6f-GFP– mice). (B) Summary of GFP+ cell population, which are co-localized with Olig2 and MAP2. Cnpcre driven GFP is found in a subpopulation of Olig2+ OL (GFP+Olig2+/Olig2+ = 20.5 ± 3.2%) and a minimal number of MAP2+ neurons (GFP+ MAP2+/MAP2+ = 3.1 ± 3.6%). It indicates that CNP+ cells are approximately 20% of total OL lineage cells in this brain region and are not neuron. Quantification of GFP+ expression shows indicates the majority of GFP+ cells are Olig2+ (GFP+ Olig2+/GFP+=97.2 ± 3.3%) and not MAP2+ (GFP+ MAP2+/MAP2+ = 5.6%±1.6%). Scale = 100 μm (n = 3 mice/genotype). (C) A single focal image with orthogonal views taken at 40x. GFP demonstrates GFP staining was strongly detected around Olig2+ nuclei (red circle in the first panel). However, GFP signal was not detected from MAP2+ cell (white circle in the second panel). There is no detectable co-localization with GFP and MAP2 staining. One potentially GFP+ MAP2+ cell is observed with very dim GFP intensity (white outline in the third panel). Yellow star and white arrowhead indicate GFP+ cell and MAP2+ neuron, which were analyzed. Scale = 10 μm. (D) Image of NeuN+ cell with orthogonal views (63x, left). GFP signal was co-localized with Olig2, but not with another neuronal marker, NeuN (middle). Scale = 10 μm. Quantification of GFP+ cell population of total NeuN+ cells, showing that a minority of GFP+ cells are NeuN+ (GFP+ NeuN+ /GFP+ = 1.2% ± 2.4%) with very small number of potentially positive neurons (GFP+ NeuN+ /NeuN+ = 2.5 ± 5. 0 %, n = 3 mice). (E) Image of GFP+ cell with orthogonal views (green, 63x, left). GFP was co-localized with CC1 (mature oligodendrocytes) but not with GFAP (marker for astrocytes). No GFP was observed in astrocytes. Scale = 10 μm. 41.6 ± 20.1% of CC1+ OL expressed GFP and 60.0 ± 9.9% GFP+ cells were CC1+ (n = 3 mice). (F) Image of PDGFRα+ cell with orthogonal views (red, 63x, left). GFP was co-localized with CC1 (mature oligodendrocytes) but not with PDGFRα (OL progenitor cells, OPC). No GFP was observed in PDGFRα+ cells. (G) Cnpcre driven tdTomato demonstrates tdTomato is not observed in neurons. Quantification analysis shows majority of tdTomato+ cells are not MAP2+ (tdTomato+ MAP2+/MAP2+ = 1.4 ± 0.6% and tdTomato+ MAP2+/tdTomato+=1.4 ± 0.6%). tdTomato+ cells were positive to Olig2, indicating tdTomato+ cells are oligodendrocytes. All data are shown as mean ± s.d.
Figure 5—figure supplement 2
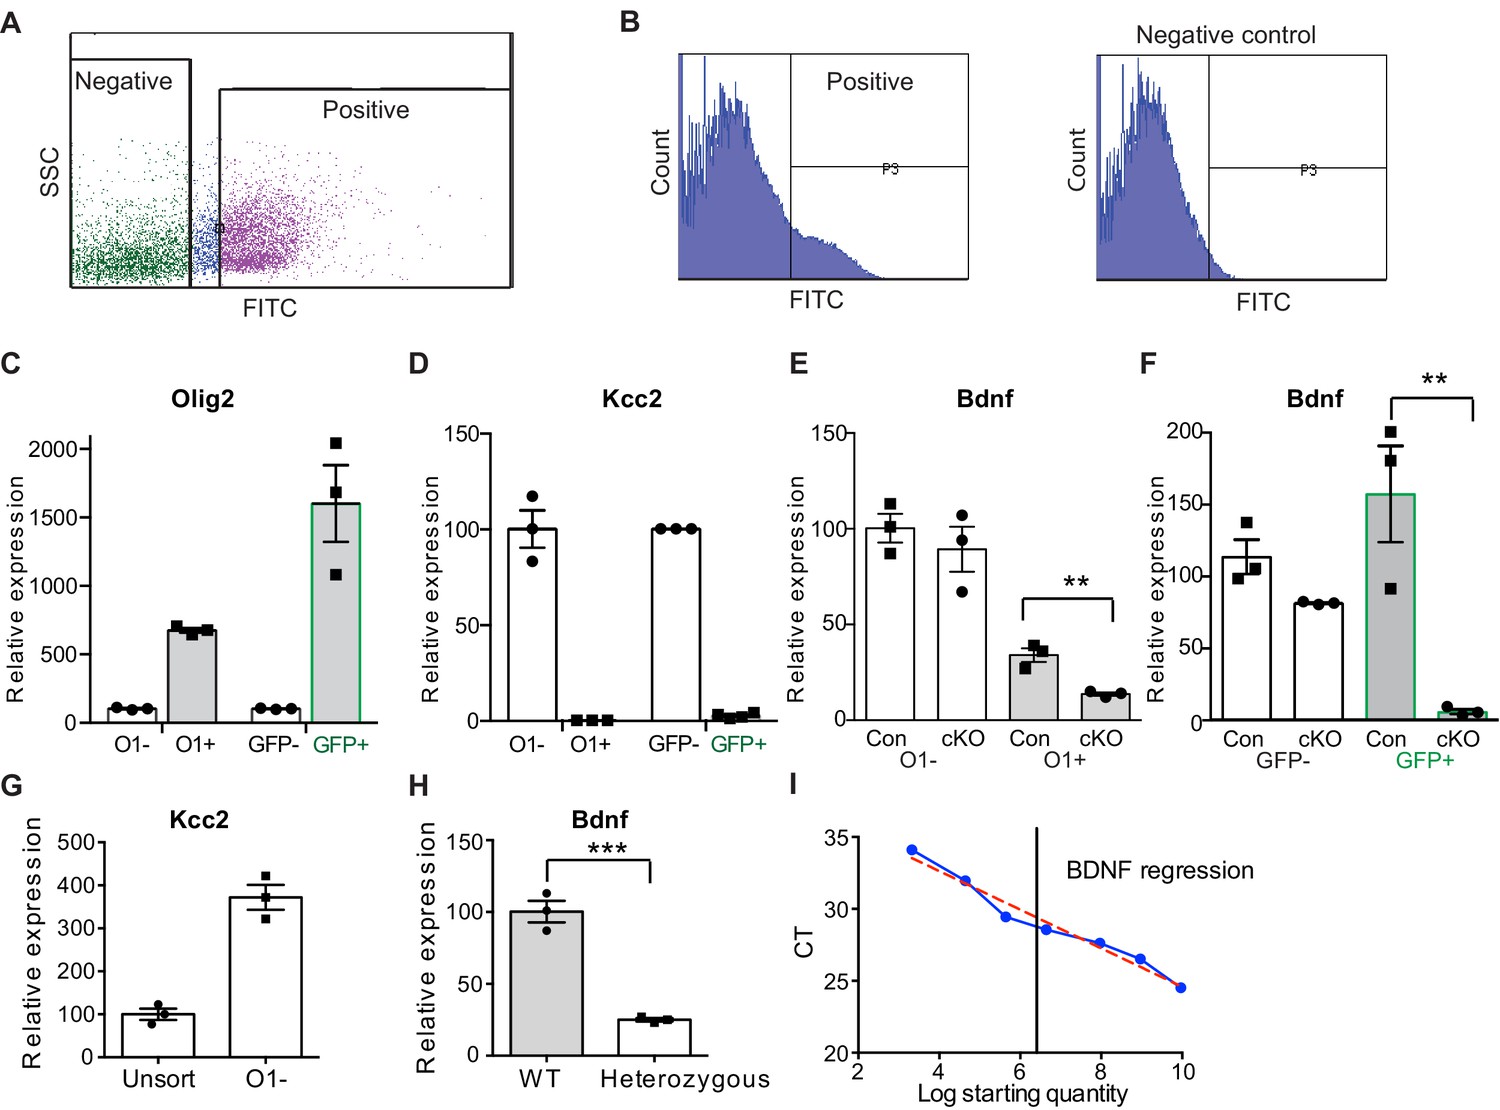
Specific reduction of BDNF in OLs in Cnpcre: Bdnffl/fl mice.
(A–B) Fluorescent activated cell sorting (FACS) revealed a distinct positive population based on scatter properties and fluorescence (A). SSC = side scatter. Histogram profiles were used to select the positive fraction. Example of histograms of isolated cells from a Cnpcre: GCAMP6f-GFP+ mouse versus a Cnpcre: GCaMP6f-GFP- as a negative control (B). (C) Verification of the isolated cells using qPCR. To isolate OLs, cells were sorted using an antibody for O1, an OL marker, or GCaMP6f-GFP (GFP). The O1+ or GFP+ cells demonstrated an enrichment of Olig2 mRNA quantified by qPCR. (D) The neuronal marker, Kcc2, was not detected from O1+ or GFP+ population. This data indicates that O1+ or GFP+ cells are Olig2+ and Kcc2- OLs. (E–F) Relative expression of Bdnf: All values are relative to the negartive control (O1- or GFP- population). Bdnf mRNA levels did not differ in the cKO O1- or GFP-fraction compared to the negative fraction. cKO O1+ fraction was significantly lower than the control O1+ populations (85 ± 2% reduction cKO O1+, t-test, **p<0.01, (E). cKO GFP+ fraction was significantly lower than the control GFP+ population (97 ± 3% reduction cKO GFP+ vs Control GFP+, t-test, **p<0.01, (F). This indicates a specific reduction of Bdnf in OLs from cKO. (G) Relative expression of Kcc2. There is no loss of neurons expressing Kcc2 in sorted cells from either O1- cells (372 ± 50, n = 3 mice) compared to unsorted population (100 ± 23, n = 3 mice). (H) To test the quality of Bdnf primer, we tested BDNF heterozygous mice. Bdnf is significantly reduced in heterozygous mice (mean ± s.e.m. = 25 ± 2 vs 100 ± 13, t-test, p=0.0006, n = 3 mice/genotype) indicating the Bdnf primer is amplifying Bdnf specifically. (I) The Bdnf primer shows linear amplification with low input RNA (r2 = 0.97, linear regression, p<0.0001). 100 ng was utilized for each comparison (black line). Therefore, even with low input and CT values > 27, the Bdnf probe can detect changes in input levels. Data in graph is shown as mean ± s.e.m. three technical replicates/gene from n = 3 mice/genotype were analyzed.
Figure 6 with 1 supplement
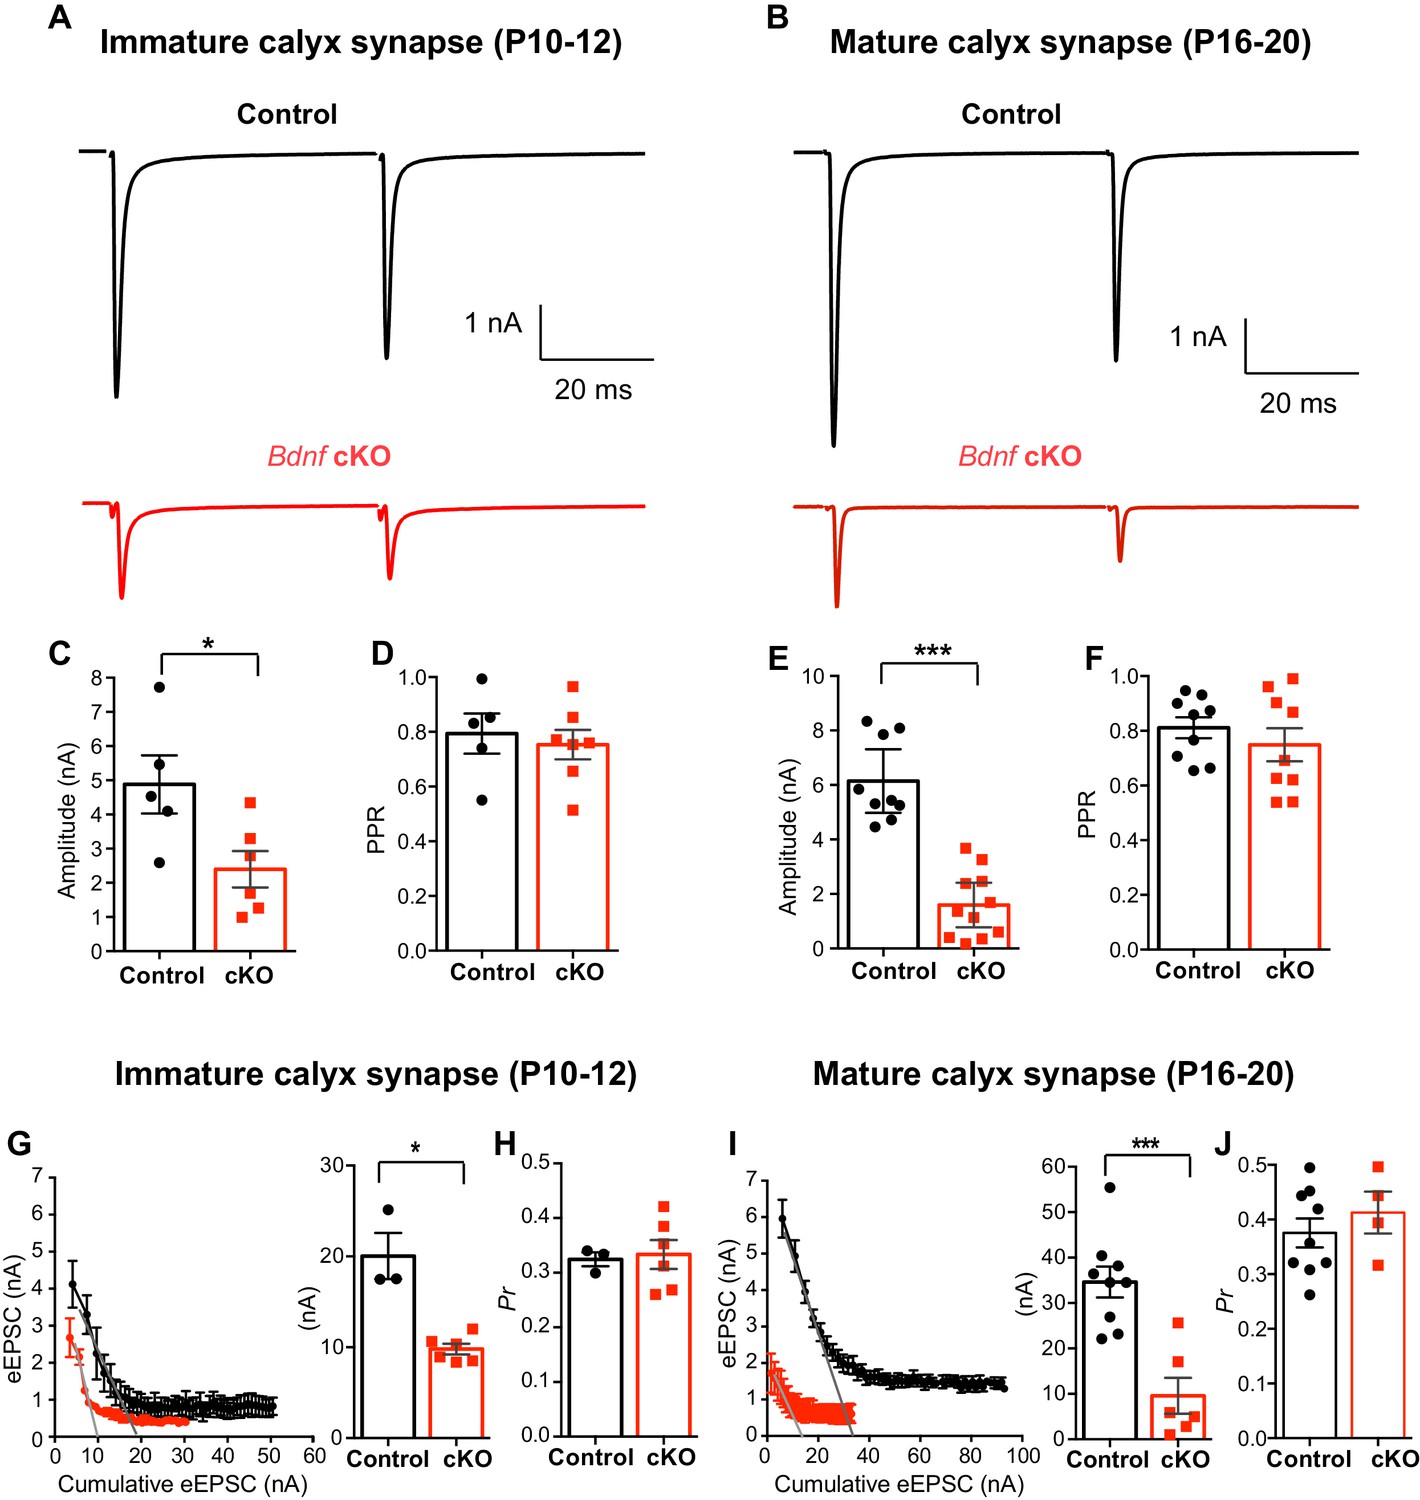
Oligodendroglial BDNF critically regulates glutamatergic transmission in the MNTB.
(A, B) Representative traces of EPSCs evoked by paired-pulse stimulation from immature calyx synapse (at P10-12, A) and mature calyx synapse (at P16-20, B) in control (black) and Bdnf cKO (red) mice. (C–F) Summary of the amplitude of EPSCs and the PPR from immature calyx synapses (C, D) and mature calyx synapses (E, F). (G–H) Using the EQ method, plot of eEPSC amplitudes against the amplitude of the cumulative eEPSC in immature calyx synapses from control (black) and Bdnf cKO (red) mice. Right: Summary of the RRP size, which was estimated by back-extrapolated linear fits to the x axis. (G) Summary of the release probability (Pr, H). (I–J) Summary of the RRP size (I) and the Pr (J) in mature calyx synapses from control (black) and Bdnf cKO (red) mice. Data are shown as the mean ± s.e.m. *p<0.05; ***p<0.001 (unpaired t-test; paired t-test).
Figure 6—figure supplement 1
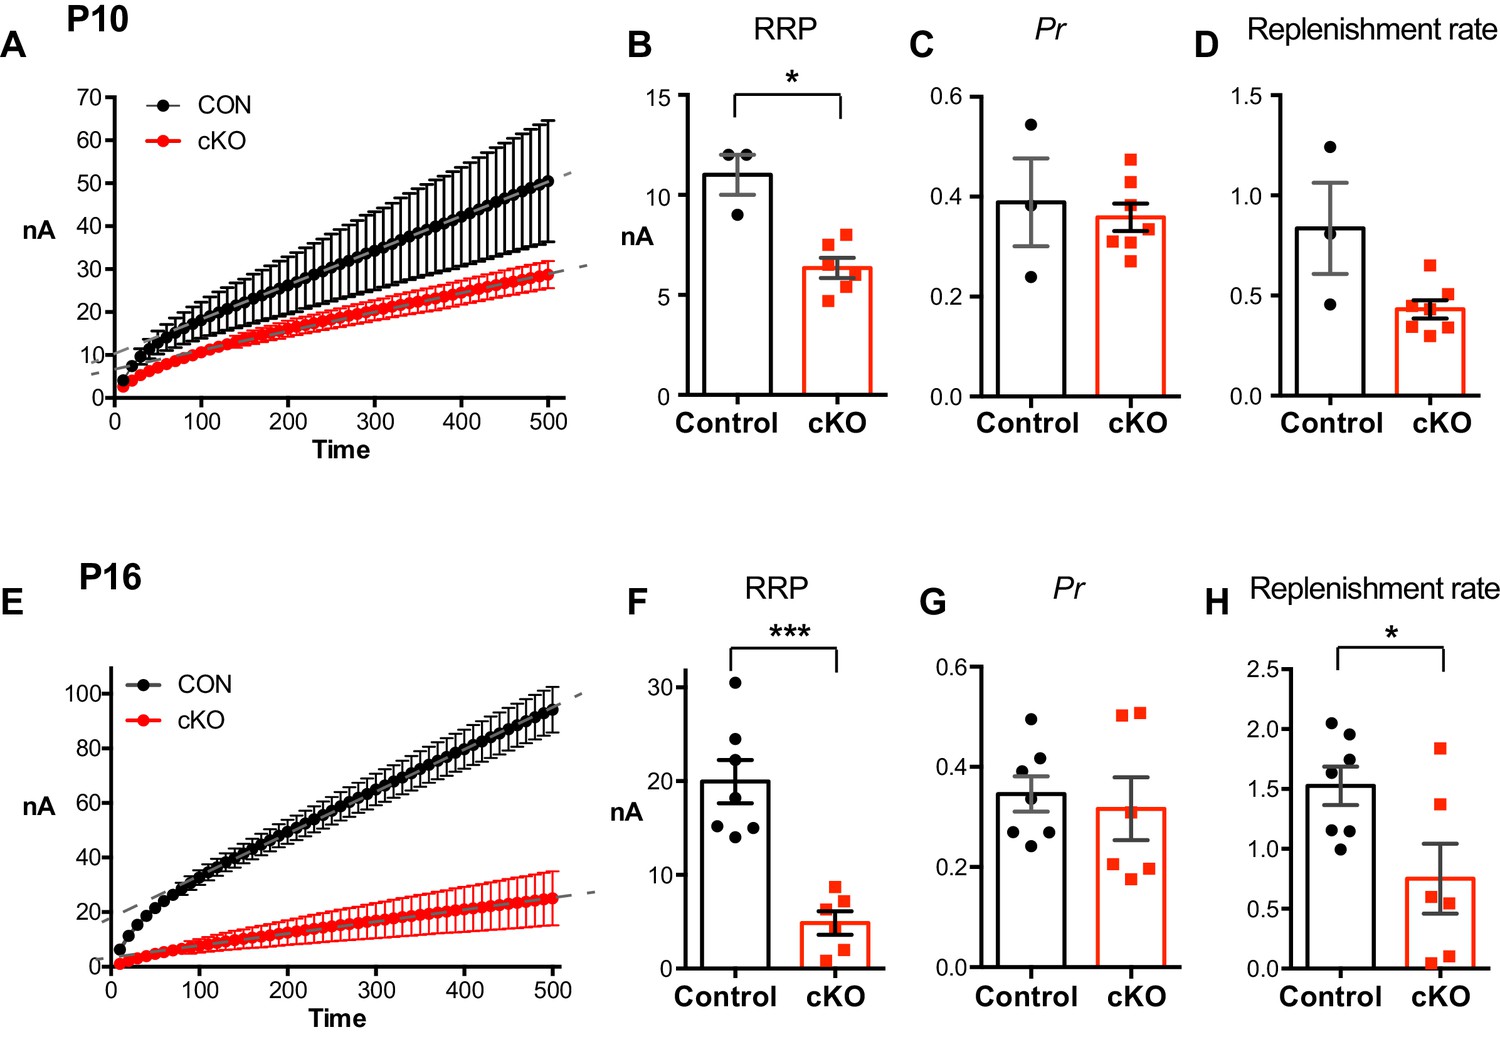
RRP and replenishment rate of calyces in cKO.
(A) Plot of the cumulative eEPSC against stimulus number in control and cKO mice at P10. A line fit to the steady-state points is back-extrapolated to the y-axis to estimate the RRP. A line fit to the steady-state points is back-extrapolated to the y-axis to estimate the RRP. (B–D) Summary of RRP, Pr, and replenishment rate from immature calyces. *p<0.05 (Mann-Whitney test). (E) Plot of the cumulative eEPSC against stimulus number in control and cKO mice at P16. (F–H) Summary of RRP, Pr, and replenishment rate from mature calyces at P16. Data are shown as the mean ± s.e.m. *p<0.05; ***p<0.001 (unpaired t-test).
Figure 7 with 2 supplements
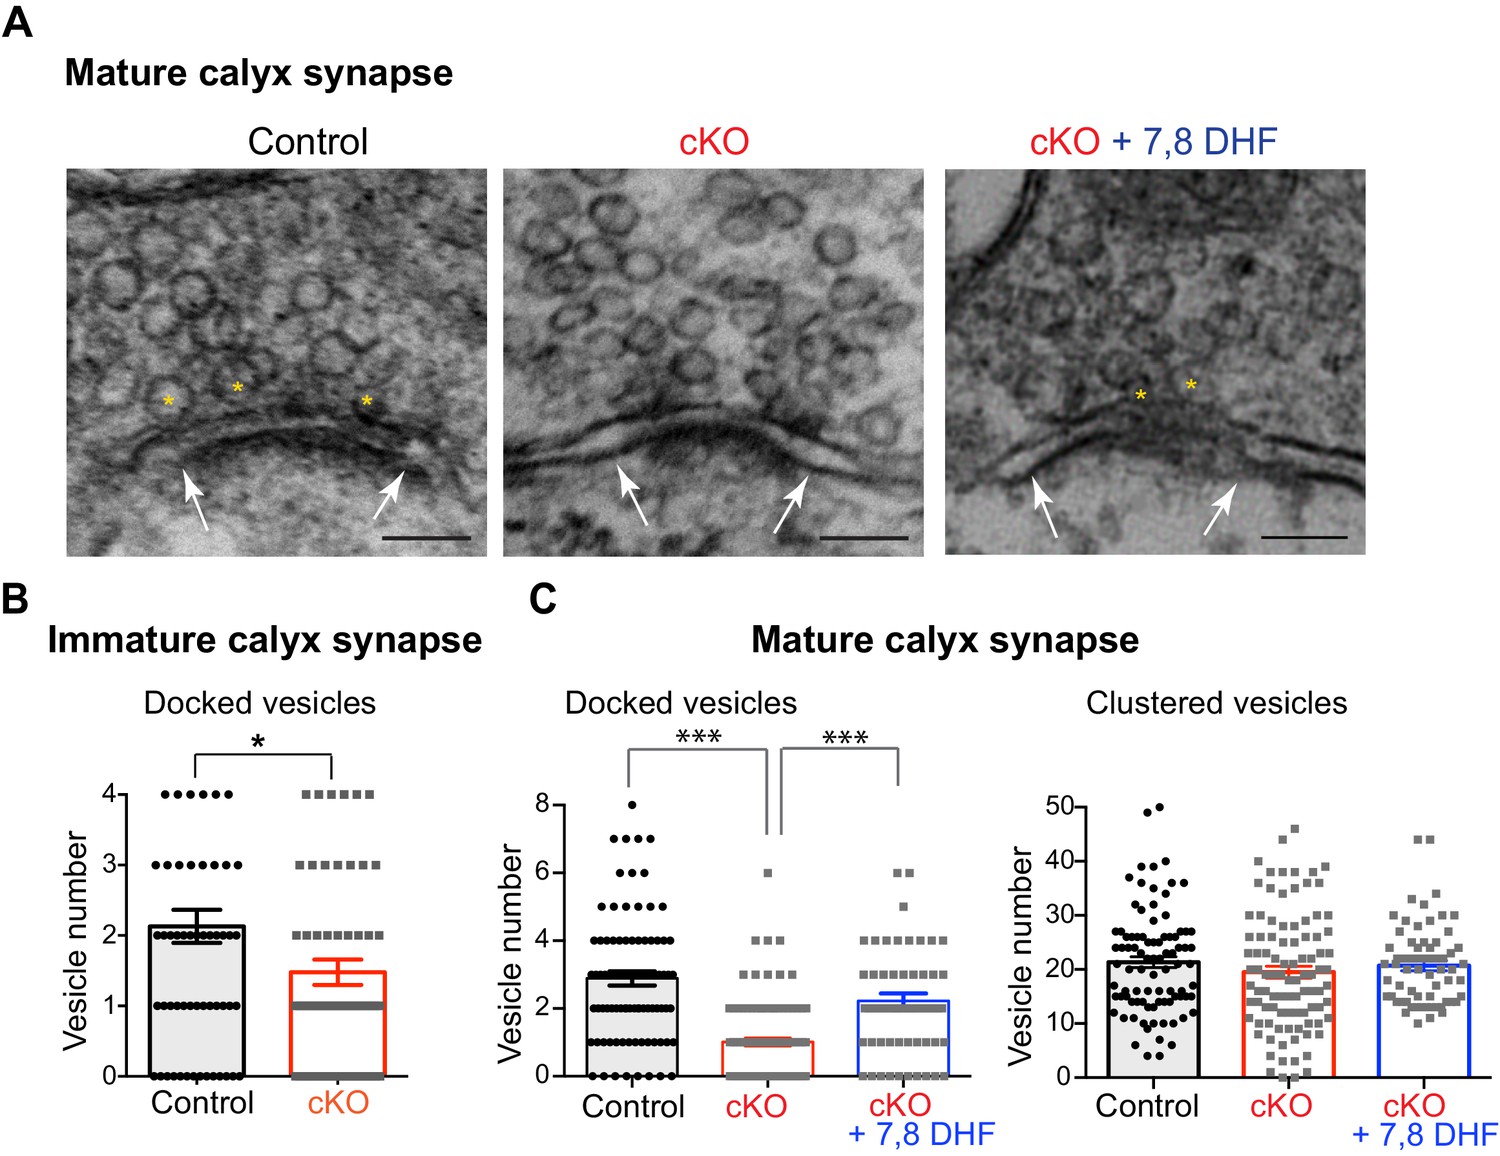
Loss of oligodendroglial BDNF reduces the number of docked vesicles at active zones of the calyx terminals.
(A) EM images of the calyx terminal in the MNTB in control (left) and cKO (middle), and 7,8-DHF treatment on cKO mice (right) at P20. Higher magnification of a presynaptic terminal showed the active zones and synaptic vesicles. The active zones are the dense and dark sites in contact with the MNTB cell membrane (white arrows). Yellow asterisks indicate the docked vesicles within 10 nm of the active zone. The clustered vesicles were located within 200 nm of the active zones. Scale bars, 100 nm. (B) Summary of the number of docked vesicles in immature calyx terminals from control (black) and cKO (red) mice at P10. (C) Summary of the number of docked vesicles (left) and clustered vesicles (right) at active zones for mature calyx terminals from control (black), cKO (red), and 7,8-DHF treatment on cKO mice (blue) at P20. Data are shown as the mean ± s.e.m. *p<0.05; ***p<0.001 (unpaired t-test).
Figure 7—figure supplement 1
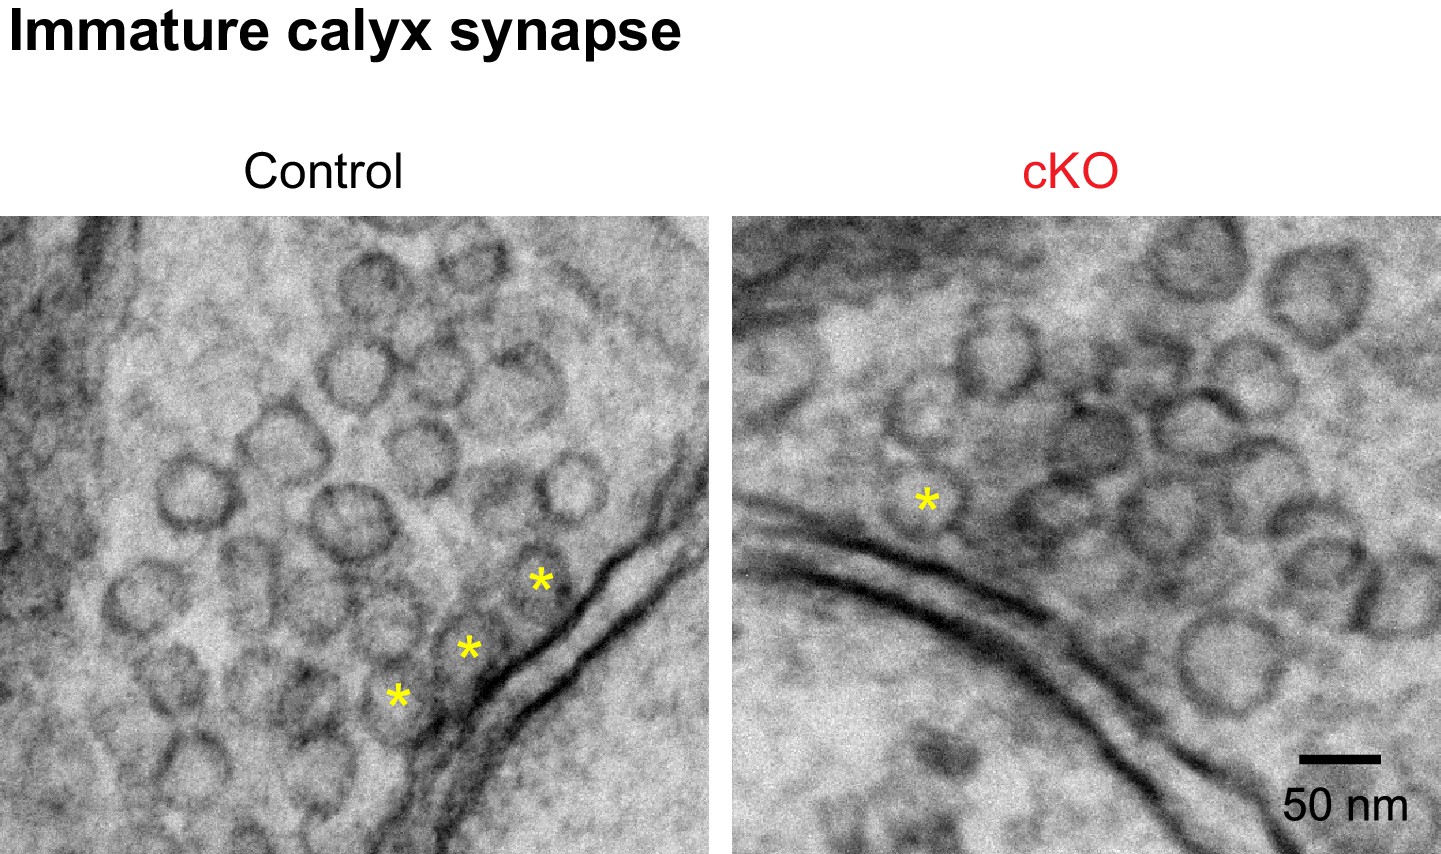
EM image of the immature calyx terminals in the MNTB in control and cKO mice at P10.
The active zones are the dense and dark sites in contact with the MNTB cell membrane. Yellow asterisks indicate the docked vesicles within 10 nm of the active zone. Scale bars, 50 nm.
Figure 7—figure supplement 2

3D reconstructions of the calyx terminal show reduced terminal volume in Bdnf cKO mice.
(A) 3D reconstruction of Alexa 568 dye-filled single calyces contacting a MNTB principal neuron from confocal z-stack images for a control and cKO mouse (P12). The 3D reconstruction and analysis were performed by using Amira 3D software (FEI, Oregon, USA). Scale bar, 20 μm. (B) Summary of calyx terminal volumes from control (black; 1,378 ± 143.7 μm3; n = 7) and cKO (red; 1,199 ± 146 μm3; n = 6; p=0.33, Mann-Whitney test) mice at P11-P13. Data are shown as the mean ± s.e.m. Mann-Whitney test.
Figure 8 with 1 supplement
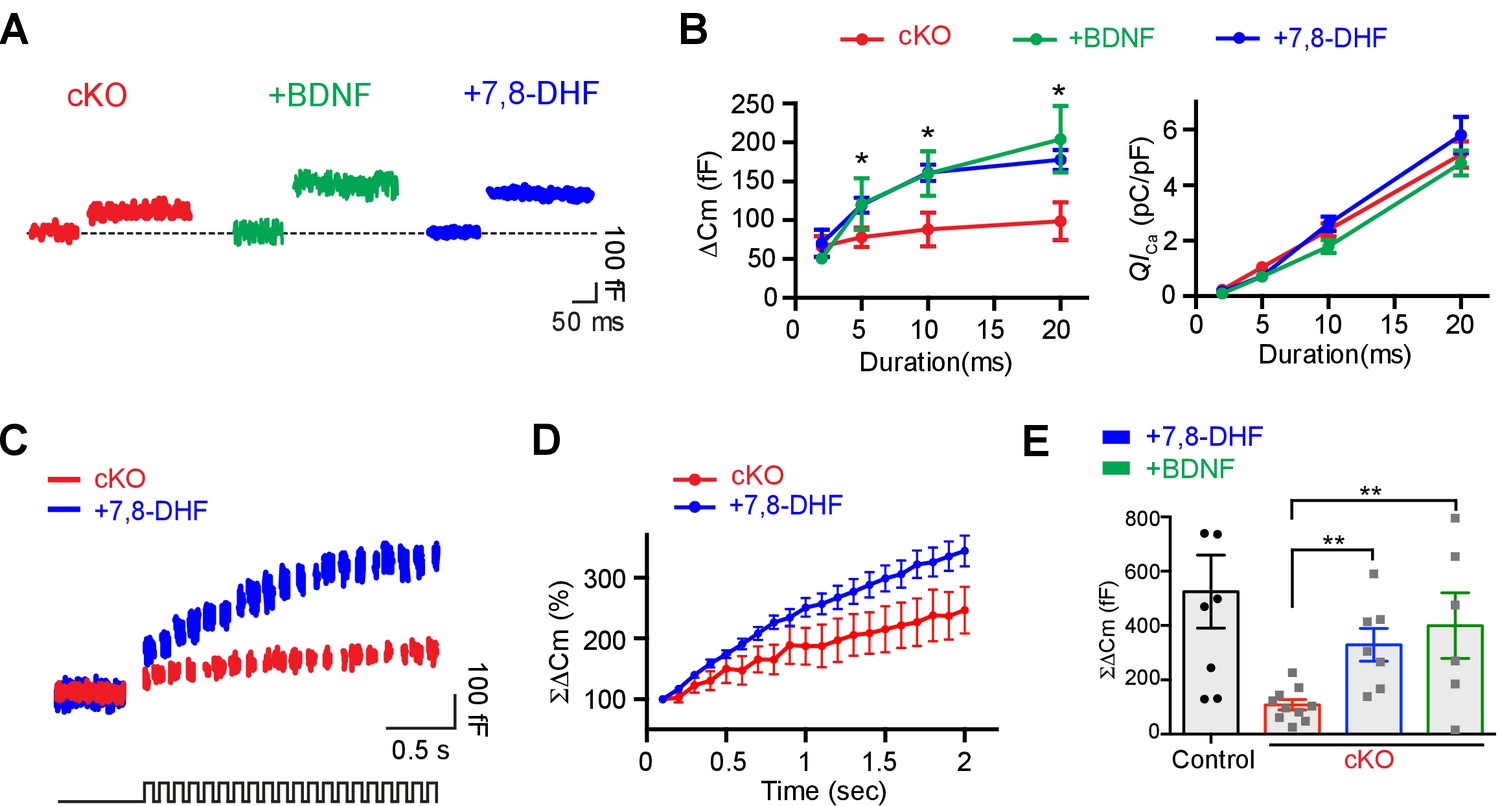
Application of extracellular BDNF or 7,8-DHF partially rescues the reduced exocytosis at calyx terminals in Bdnf cKO mice.
(A) Representative traces of Cm (top) and ICa (middle) induced by 20 ms depolarization from –80 to 0 mV (bottom) at calyx terminals in Bdnf cKO mice (P9–13, red) in the presence of BDNF (100 ng/ml; green) or 7,8-DHF (20 μM; blue). (B) The duration of depolarizing pulses was plotted versus ΔCm (left) and QICa (right) for terminals from Bdnf cKO slices in the absence (red) and the presence of BDNF (green) or 7,8-DHF (blue). (C) Representative traces of Cm (top) induced by the train of 20 depolarizing pulses (10 ms, 10 Hz; bottom) from –80 to 0 mV in terminals from Bdnf cKO mice in the absence (red) or presence of 7,8-DHF (blue). (D) Summary of the normalized ΣΔCm relative to the stimulation time in the absence (red) or presence of 7,8-DHF (blue). (E) Summary of ΣΔCm of calyx terminals after the train of 20 depolarizing pulses (at 2 s) in the control slices (black) and in Bdnf cKO slices in the absence (red) and in the presence of BDNF (green) or 7,8-DHF (blue). Data are shown as the mean ± s.e.m. *p<0.05; **p<0.01 (unpaired t-test).
Figure 8—figure supplement 1
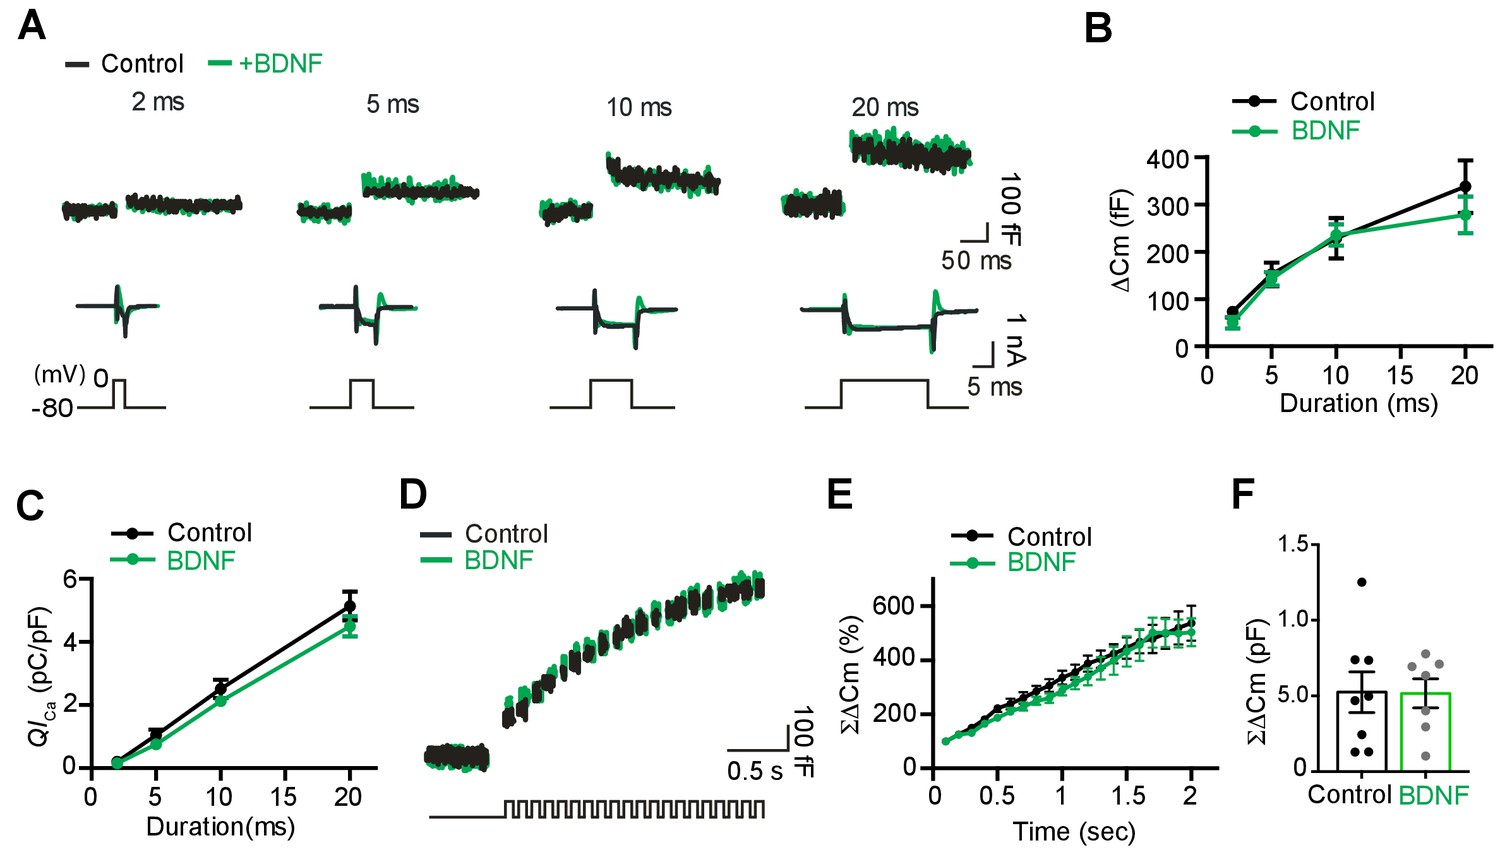
BDNF application does not affect presynaptic ICa and exocytosis at the calyx of terminal in control.
(A) Representative traces for membrane capacitance (Cm; top) and Ca2+ current (ICa; middle) induced by 2-, 5-, 10-, and 20 ms depolarizations (bottom) in the absence (black) and presence of BDNF (100 ng/ml; green) from P9–13 calyces in control mice. (B) Depolarization duration plotted against ΔCm for terminals from control slices untreated (black; 2 ms, 72.8 ± 11.74 fF, n = 12; 5 ms, 152 ± 25.12 fF, n = 10; 10 ms, 228 ± 42.86 fF, n = 14; 20 ms, 338 ± 55.72 fF, n = 13) and treated with BDNF (green; 2 ms, 50.7 ± 12.12 fF, n = 7; p=0.23; 5 ms, 144 ± 16.33 fF, n = 8; p=0.80; 10 ms, 235 ± 22.5 fF, n = 10; p=0.90; 20 ms, 278 ± 38.49 fF, n = 8; p=0.45). (C) The plot of depolarization duration versus Ca2+ current charge (QICa) was generated from data as in (A) for both groups (control, 2 ms, 0.2 ± 0.45 pC/pF, n = 12; 5 ms, 1.0 ± 0.72 pC/pF, n = 10; 10 ms, 2.5 ± 0.29 pC/pF, n = 14; 20 ms, 5.1 ± 0.45 pC/pF, n = 13; BDNF, 2 ms, 0.2 ± 0.05 pC/pF, n = 7; p=0.51; 5 ms, 0.8 ± 0.12 pC/pF, n = 8; p=0.20; 10 ms, 1.9 ± 0.2 pC/pF, n = 10; p=0.11; 20 ms, 4.5 ± 0.32 pC/pF, n = 8; p=0.32). (D) Representative trace of Cm (top) induced by the train of 20 depolarizing pulses (10 ms, 10 Hz; bottom) from –80 to 0 mV in terminals from control mice in the absence (black, n = 8) or presence of BDNF (green; n = 7). (E) Summary of the normalized ΣΔCm data plotted relative to the stimulation time for each group. Data were normalized relative to the capacitance jump induced by the first 10 ms depolarization. (F) Summary of the ΣΔCm after the train of 20 depolarizing pulses (at 2 s) for each group (control, black, 525 ± 134 fF, n = 8; BDNF, green, 517 ± 95.7 fF, n = 7; p=0.96). Data are shown as the mean ± s.e.m.
Figure 9
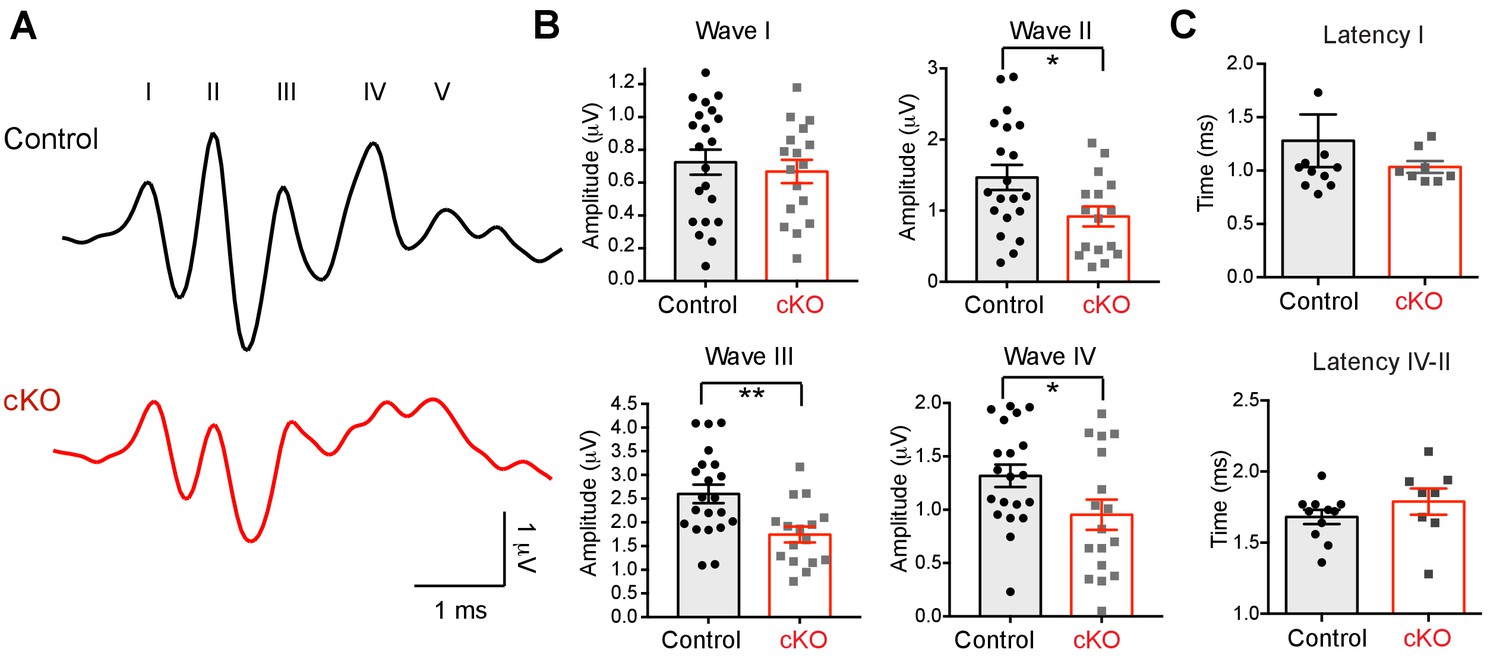
The absence of oligodendroglial BDNF impairs the auditory function of Bdnf cKO mice.
(A) Examples of the ABRs in a control (black) and a Bdnf cKO mouse (red, both at P25), were recorded in response to a click stimulus of sound (75 dB). Roman numerals indicate peak waves I to V. (B) Summary of the amplitude of waves I to IV in response to click stimulus (75 dB), and the latency of wave I and the latency between wave II and IV in control (black) and Bdnf cKO mice (red). Data are shown as the mean ± s.e.m. *p<0.05; **p<0.01 (unpaired t-test).
Author response image 1
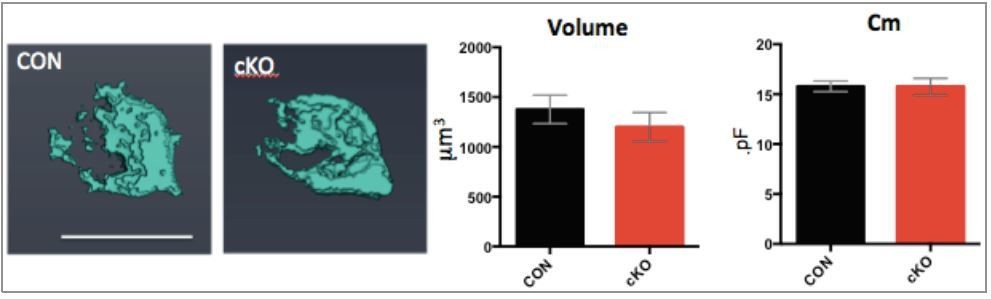
(Left) 3D images of calyces from control and cKO mice.
(Right) Summary of volume and Cm.
Author response image 2
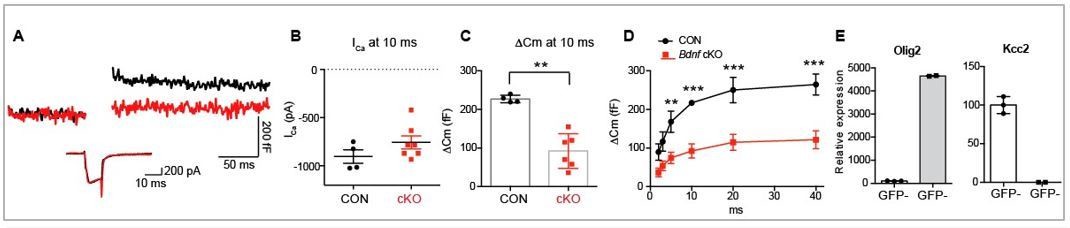
Effects of reduced BDNF in OL on vesicular glutamate release from presynaptic terminal in the Bdnf cKO (Sox10creER: Bdnff/f).
(A) Representative traces for membrane capacitance (Cm; top) and Ca2+ current (ICa; bottom) induced by 10‐ms depolarization from P11–12 calyx terminals in control (black) and Bdnf cKO (red) mice. (B‐C) Summary of Ica and Cm induced by 10‐ms depolarization to 0 mV in calyces from control (black) and cKO (red) mice. (D) Depolarization duration plotted against ΔCm for control and Bdnf cKO mice. (E) Verification of Cre-line specificity. Using FACS and qPCR, isolated GCaMP6f‐GFP+ cells demonstrated a high level of Olig2 mRNA, a oligodendrocytes marker, but no detectable Kcc2 mRNA, a neuronal marker, indicating this Cre‐line is specific to Olig2+ oligodendrocytes.
Tables
Key resources table
| Reagent type (species) or resource | Designation | Source or reference | Identifiers | Additional information |
|---|---|---|---|---|
| Genetic reagent (M. musculus) | B6.129S4-Bdnftm1Jae/J | The Jackson Laboratory | stock no.:002266 | PMID:8139657 |
| Genetic reagent (M. musculus) | Bdnftm3Jae/J | The Jackson Laboratory | stock no.:004339 | Rios et al., 2001 |
| Genetic reagent (M. musculus) | CnpCre mice | Dr. Klaus Nave (Max Planck Institute) | MGI no: 3051635 | Lappe-Siefke et al., 2003 |
| Genetic reagent (M. musculus) | GCaMP6f | The Jackson Laboratory | stock no.:024105 | Dr. Paukert, UTHSCSA |
| Genetic reagent (M. musculus) | tdTomato | The Jackson Laboratory | stock no.:007909 | Dr. Paukert, UTHSCSA |
| Antibody | Mouse monoclonal anti-Olig1 | Millipore | MAB5540 | 1:500 |
| Antibody | Mouse monoclonal anti-MAP2 | Millipore | MAB3418 | 1:200 |
| Antibody | Mouse monoclonal anti-NeuN | Millipore | MAB377 | 1:200 |
| Antibody | Rabbit polyclonal anti-GFAP | DAKO | Z033429 | 1:500 |
| Antibody | Mouse monoclonal anti-CC1 | Millipore | OP80 | 1:200 |
| Antibody | Rabbit monoclonal anti-Olig2 | Abcam | 109186 | 1:100 |
| Antibody | Rat monoclonal anti-PDGFRa | Abcam | AB90967 | 1:300 |
| Antibody | Rabbit polyclonal anti-BDNF | Bioss | BS4989R | 1:100 |
| Antibody | Mouse monoclonal anti-TrkB | Santa Cruz | sc-136990 | 1:50 |
| Antibody | Guinea pig polyclonal anti-VGluT1 | Millipore | AB5905 | 1:1000 |
| Chemical compound, drug | 7,8-Dihydroxyflavone (7,8-DHF) | Sigma | D5446 | 20 μM |
| Chemical compound, drug | BDNF | Millipore | GF301 | 100 ng/ml |
| Chemical compound, drug | TEA-Cl | Sigma | T2265 | 10 mM |
| Chemical compound, drug | 4-AP | Sigma | 275875 | 0.1 mM |
| Chemical compound, drug | TTX | TOCRIS | 1078 | 1 μM |
| Chemical compound, drug | QX314 bromide | TOCRIS | 1014 | 4 mM |
| Chemical compound, drug | Bicuculline | TOCRIS | 130 | 10 µM |
| Chemical compound, drug | Strychnine | Sigma | S8753 | 2 µM |
Additional files
-
Transparent reporting form
- https://doi.org/10.7554/eLife.42156.018
Download links
A two-part list of links to download the article, or parts of the article, in various formats.
Downloads (link to download the article as PDF)
Open citations (links to open the citations from this article in various online reference manager services)
Cite this article (links to download the citations from this article in formats compatible with various reference manager tools)
Oligodendrocytes regulate presynaptic properties and neurotransmission through BDNF signaling in the mouse brainstem
eLife 8:e42156.
https://doi.org/10.7554/eLife.42156


