A Gs-coupled purinergic receptor boosts Ca2+ influx and vascular contractility during diabetic hyperglycemia
- University of California, Davis, United States
- University of Louisville, United States
- Sasse Surgical Associates, United States
- University of Nevada, United States
- VA Northern California Healthcare System, United States
Figures
Figure 1 with 2 supplements
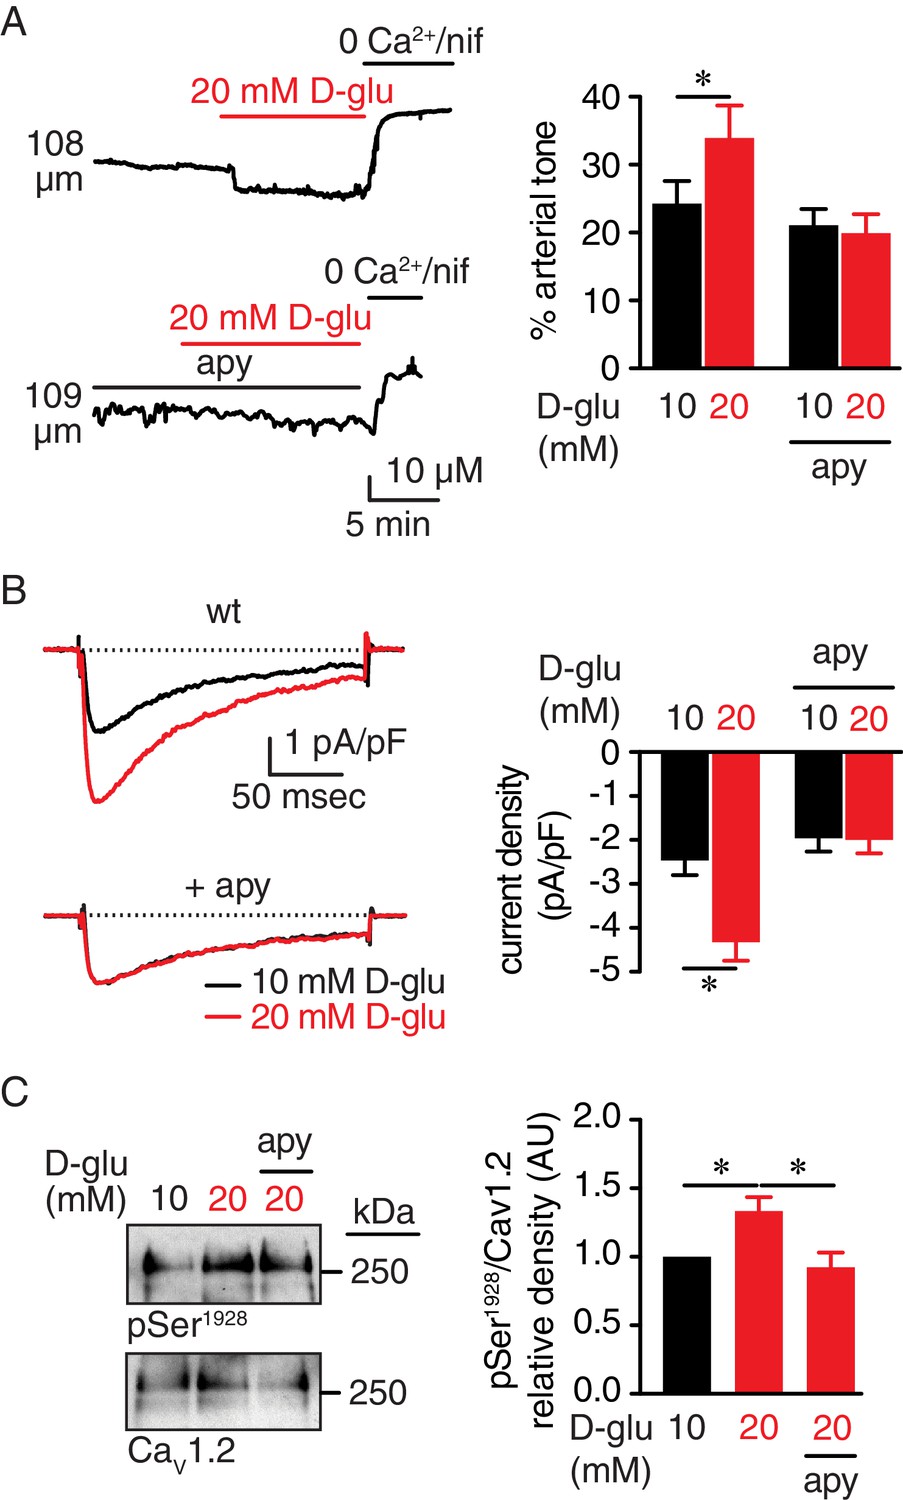
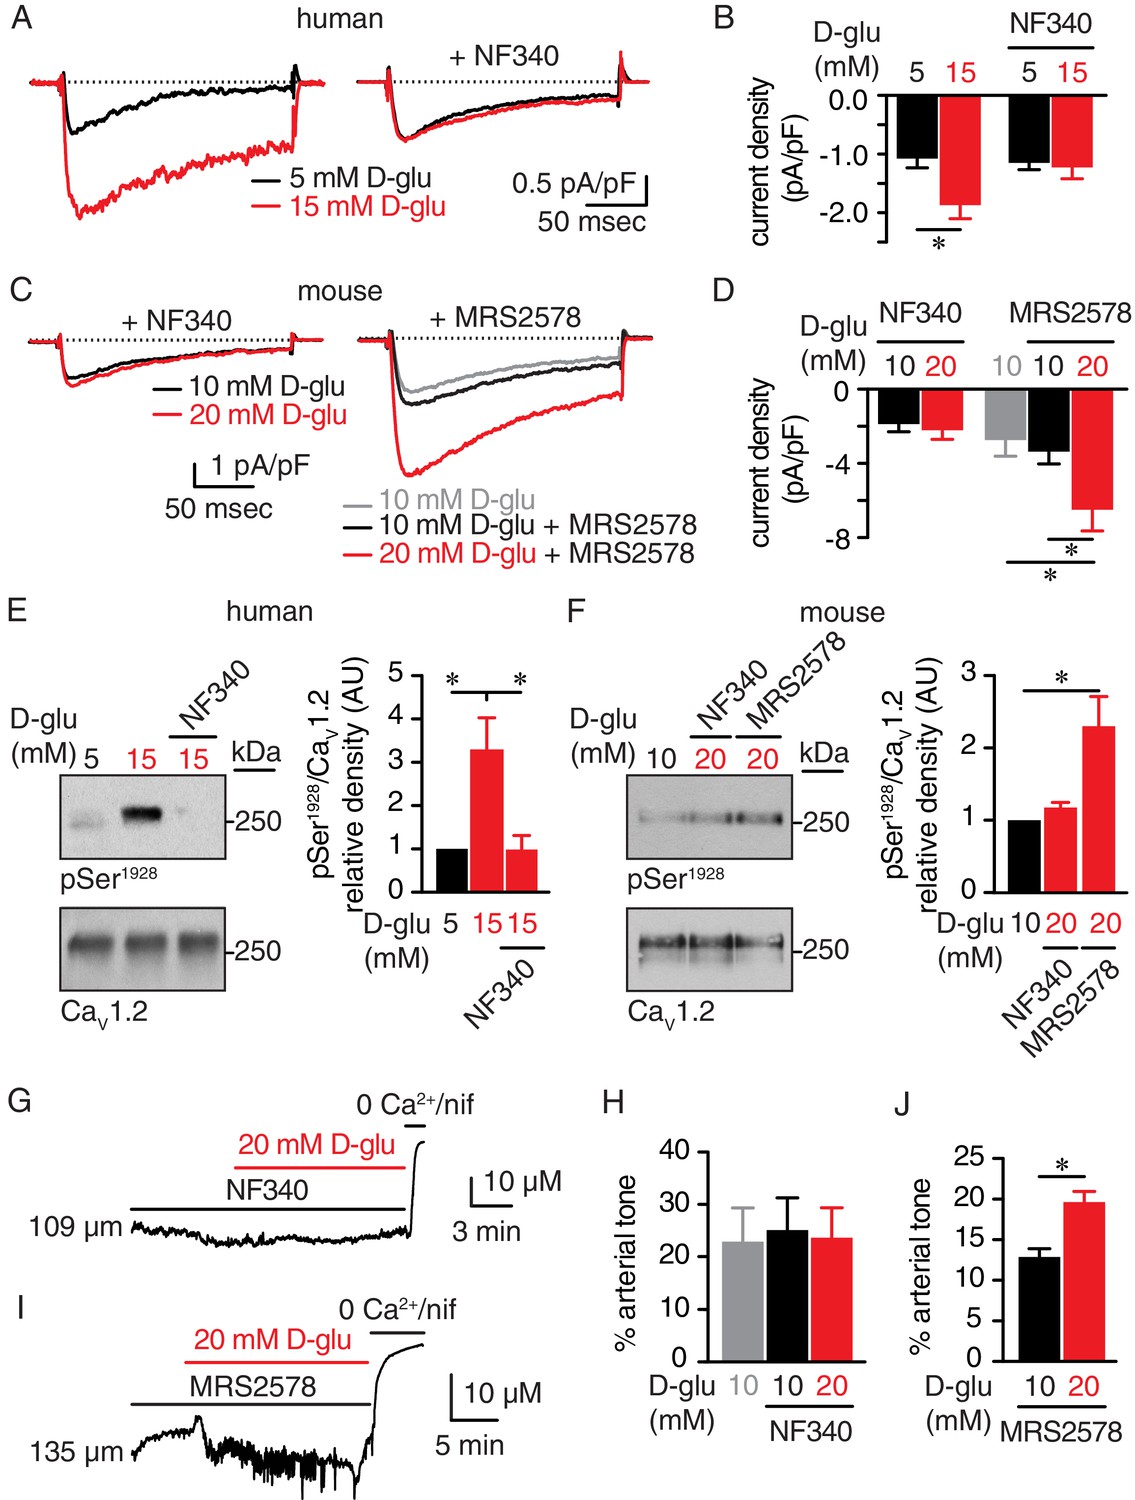
Extracellular nucleotides promote vasoconstriction, CaV1.2 activity and Ser1928 phosphorylation in response to 20 mM D-glucose in murine arterial myocytes.
(A) Representative diameter recordings and summary arterial tone data from pressurized (60 mmHg) wt mouse cerebral arteries before and after application of 20 mM D-glucose in the absence (n = 6 arteries from six mice) and presence (n = 6 arteries from six mice) of apyrase (apy; 0.32 U/ml; *p<0.05, Wilcoxon matched pairs test; Figure 1—source data 1). (B) Characteristic IBa recordings from the same cell and summary IBa data from wt mouse cerebral arterial myocytes evoked by step depolarizations from −70 to +10 mV before and after application of 20 mM D-glucose in the absence (n = 11 cells from five mice) and presence of apyrase (n = 9 cells from five mice) (*p<0.05, paired t test; Figure 1—source data 2). (C) Representative immunoblot detection of phosphorylated Ser1928 (pSer1928) and total CaV1.2 from wt mouse cerebral and mesenteric arteries after 10 min incubation with 10 mM or 20 mM D-glucose in the absence and presence of apyrase (n = 10 arterial lysates per condition), and quantification of pSer1928 (AU = arbitrary units) (*p<0.05, Kruskal-Wallis with Dunn’s multiple comparisons; Figure 1—source data 3).
-
Figure 1—source data 1
Excel spreadsheet containing the individual numeric values of % arterial tone analyzed in Figure 1A and corresponding raw diameters.
- https://doi.org/10.7554/eLife.42214.010
-
Figure 1—source data 2
Excel spreadsheet containing the individual numeric values of current density analyzed in Figure 1B.
- https://doi.org/10.7554/eLife.42214.011
-
Figure 1—source data 3
Excel spreadsheet containing the individual numeric values of pSer1928/CaV1.2 relative density analyzed in Figure 1C.
- https://doi.org/10.7554/eLife.42214.012
Figure 1—figure supplement 1
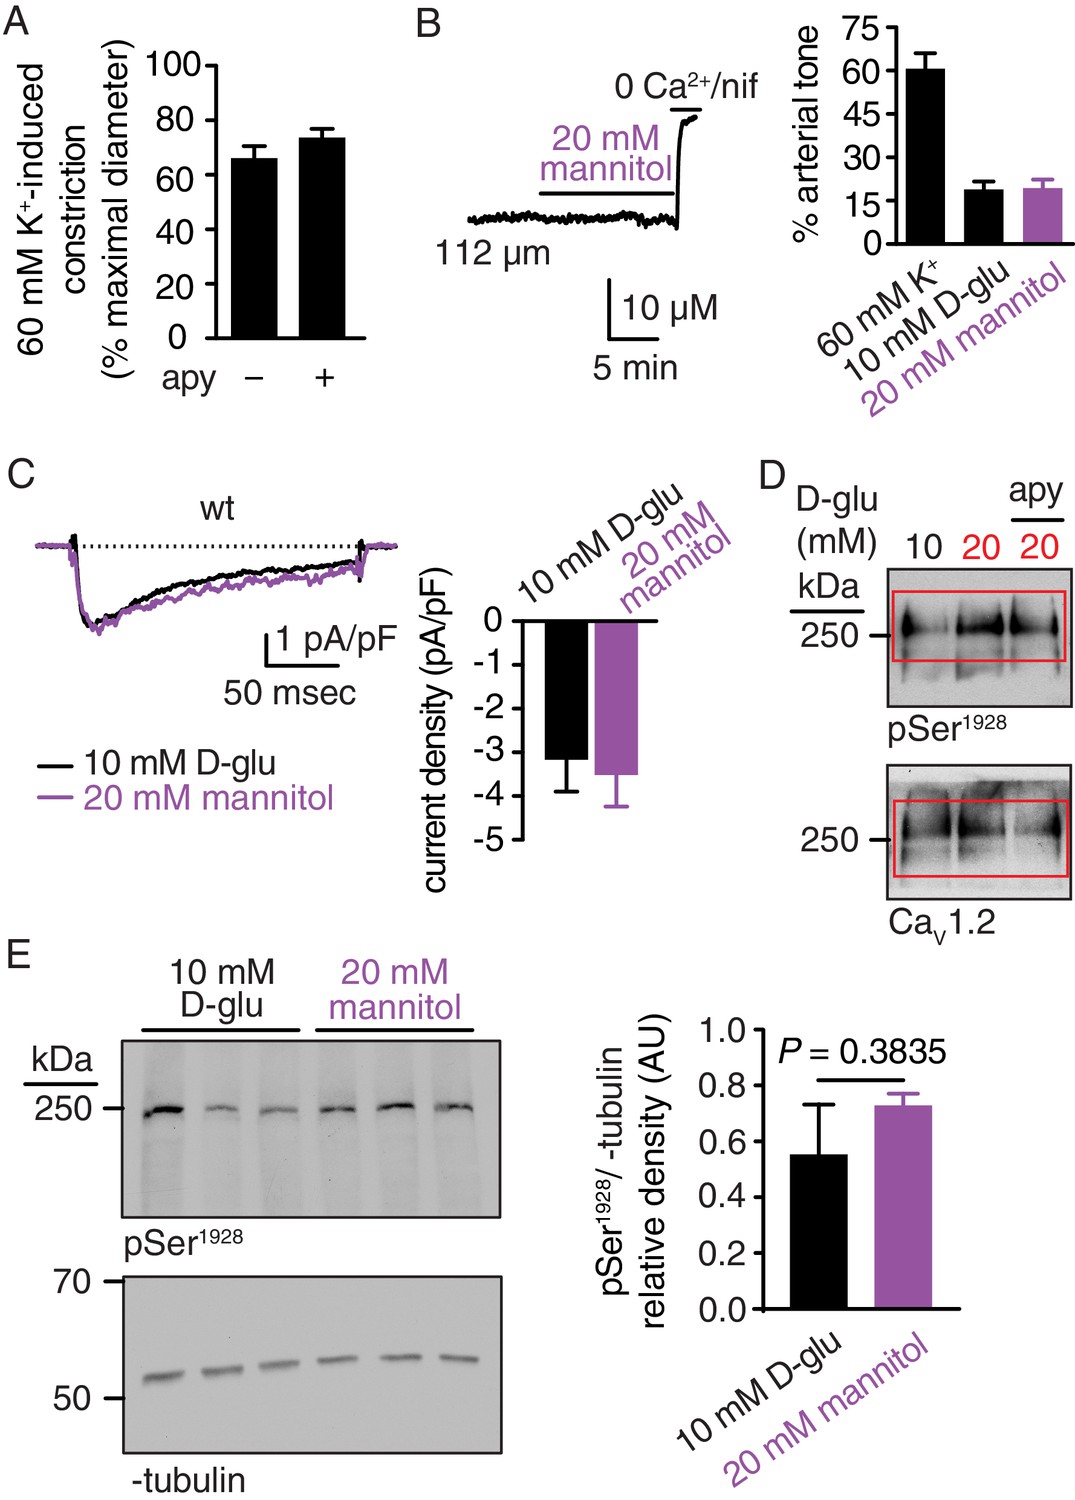
K+-induced arterial constriction in the absence and presence of apyrase, no changes in arterial tone, IBa and pSer1928 in response to 20 mM mannitol, and full-length blots corresponding to Figure 1C.
(A) Bar plot of % constriction in response to high K+ (60 mM) from wt mouse cerebral arteries exposed to 10 mM D-glucose in the absence and presence of apyrase (apy; 0.32 U/ml; n = 6 arteries from six mice per condition; Figure 1—figure supplement 1—source data 1). Response to high K+ (60 mM) was obtained in pressurized arteries at 20 mmHg. (B) Representative diameter recording and summary arterial tone data from pressurized (60 mmHg) wt mouse cerebral arteries before and after application of 20 mM mannitol (n = 6 arteries from six mice; Figure 1—figure supplement 1—source data 2). (C) Exemplary IBa recording from the same cell and summary IBa data from wt mouse cerebral arterial myocytes evoked by step depolarizations from −70 to +10 mV before and after application of 20 mM mannitol (n = 7 cells from three mice; Figure 1—figure supplement 1—source data 3). (D) Complete scan of representative phosphorylated Ser1928 (pSer1928) and total CaV1.2 blots for mouse arteries incubated with 10 mM D-glucose, 20 mM D-glucose and 20 mM D-glucose +apyrase. Red boxes indicate the crop region displayed in the main Figure 1C. (E) Representative immunoblot detection of phosphorylated Ser1928 (pSer1928) and α-tubulin (loading control) from wt mouse arteries after 10 min incubation in either 10 mM D-glucose or 20 mM mannitol (n = 5 arterial lysates from five mice per condition) and quantification of pSer1928 (AU = arbitrary units) (*p=0.3835, unpaired t-test; Figure 1—figure supplement 1—source data 4).
-
Figure 1—figure supplement 1—source data 1
Excel spreadsheet containing the individual numeric values of 60 mM K+-induced % constriction analyzed in Figure 1—figure supplement 1A.
- https://doi.org/10.7554/eLife.42214.004
-
Figure 1—figure supplement 1—source data 2
Excel spreadsheet containing the individual numeric values of % arterial tone analyzed in Figure 1—figure supplement 1B and corresponding raw diameters.
- https://doi.org/10.7554/eLife.42214.005
-
Figure 1—figure supplement 1—source data 3
Excel spreadsheet containing the individual numeric values of current density analyzed in Figure 1—figure supplement 1C.
- https://doi.org/10.7554/eLife.42214.006
-
Figure 1—figure supplement 1—source data 4
Excel spreadsheet containing the individual numeric values of pSer1928/α-tubulin relative density analyzed in Figure 1—figure supplement 1E.
- https://doi.org/10.7554/eLife.42214.007
Figure 1—figure supplement 2
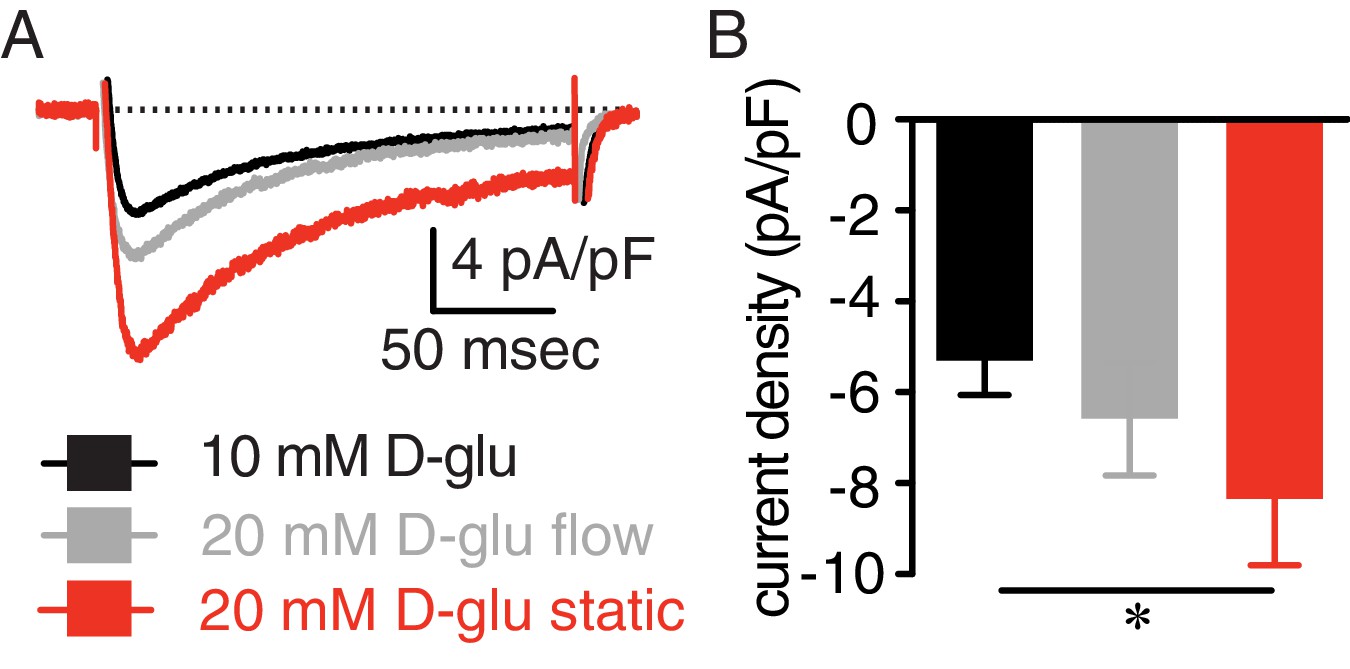
Enhanced IBa in response to elevated glucose is prevented by continuous bath perfusion.
(A) Representative IBa recordings from the same cell and (B) summary IBa data from wt mouse cerebral arterial myocytes induced by step depolarizations from −70 to +10 mV during exposure to 10 mM D-glucose and in response to 20 mM D-glucose with constant bath perfusion (flow) and after stopping perfusion (e.g. static) (n = 9 cells from three mice; *p<0.05, Friedman Test with Dunn’s multiple comparisons; Figure 1—figure supplement 2—source data 1). For these experiments, cells were patched in a bath solution containing 10 mM D-glucose at a perfusion rate of 2.1 mL/min. After establishment of a stable gigaseal for at least 5 min, IBa were recorded in the presence of 10 mM D-glucose under continuous flow. Cells were then perfused with a bath solution containing 20 mM D-glucose under continuous flow for at least 5 min before recording of IBa again. Subsequently, the bath perfusion was stopped, and cells were bathed in the 20 mM D-glucose solution under static bath condition for five more minutes before recording IBa one more time. If the three experimental conditions could not be performed in the same cells, the results were discarded.
-
Figure 1—figure supplement 2—source data 1
Excel spreadsheet containing the individual numeric values of current density analyzed in Figure 1—figure supplement 2B.
- https://doi.org/10.7554/eLife.42214.009
Figure 2 with 1 supplement
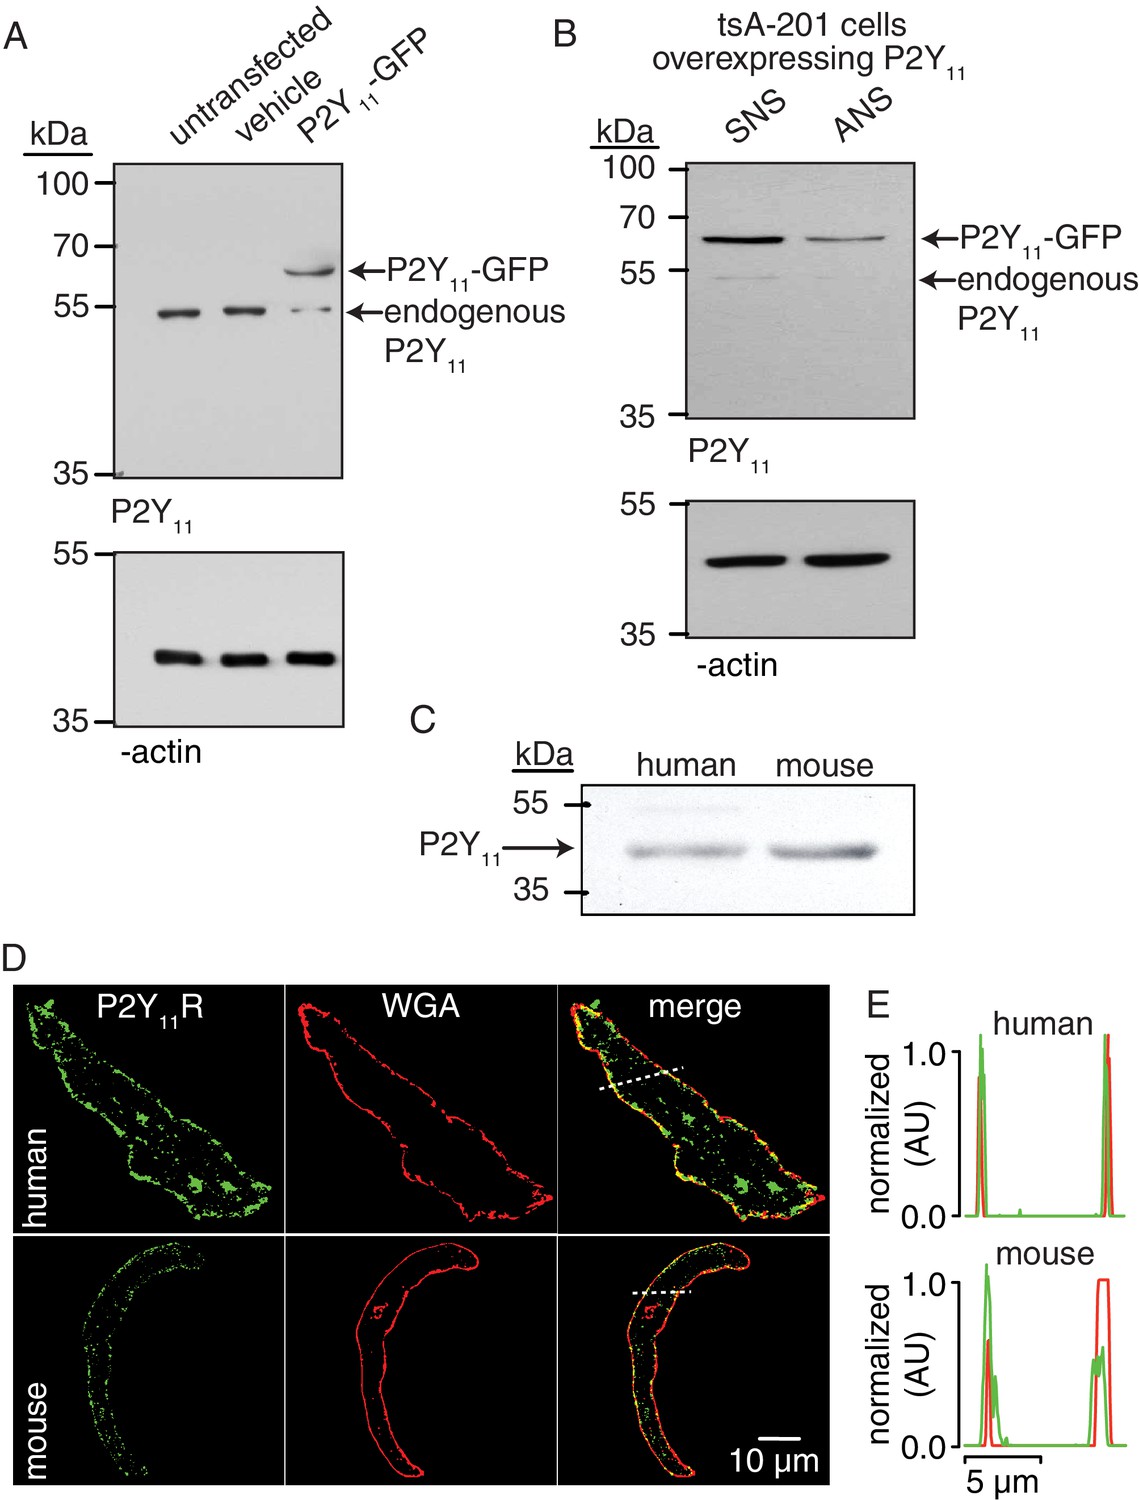
P2Y11 protein and distribution in arterial myocytes.
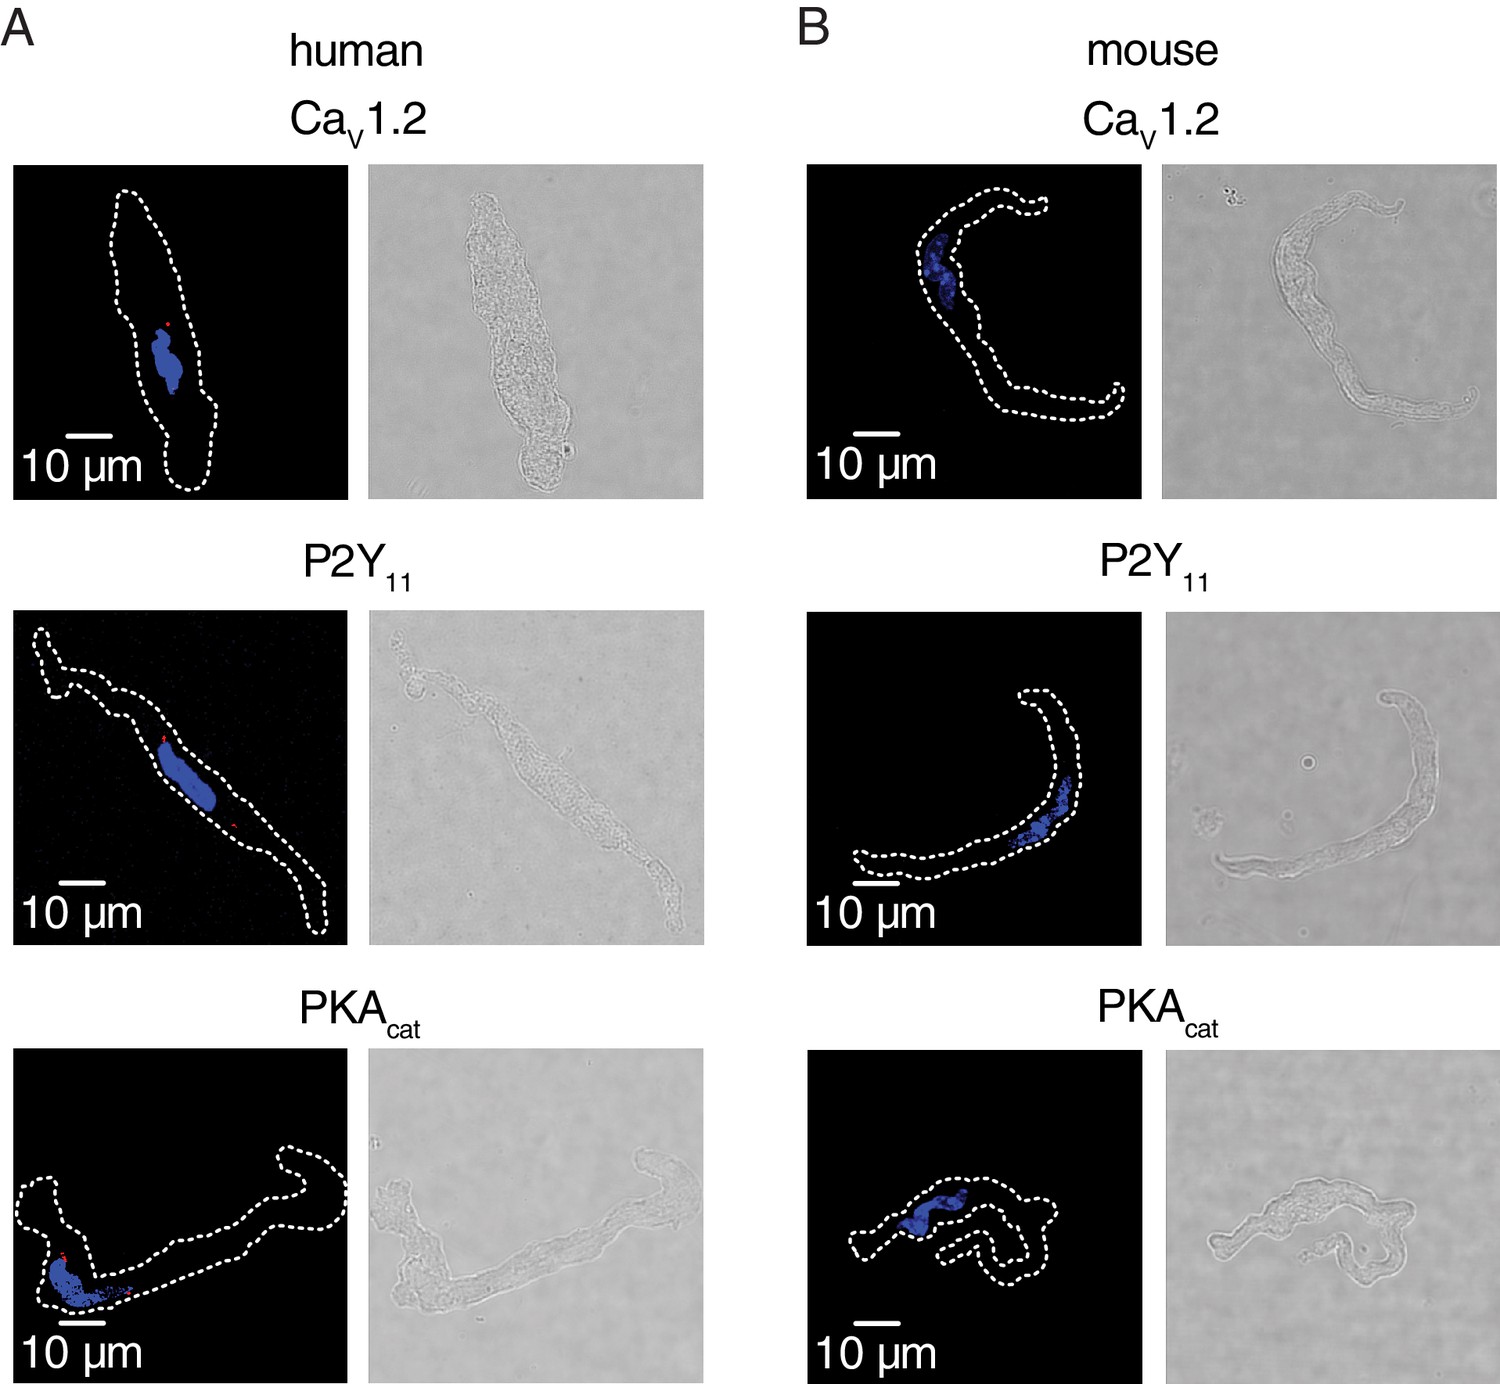
(A) Representative blot of immunoreactive bands of expected molecular weight for endogenous P2Y11 (~40 kDa), overexpressed P2Y11-GFP (~70 kDa), and β-actin (~43 kDa) in untransfected, vehicle-treated (empty transfection) and P2Y11-GFP transfected tsA-201 cells (n = 3 lysates per condition). Note that tsA-201 cells endogenously express P2Y11 (Dreisig and Kornum, 2016). (B) Representative blot of immunoreactive bands of expected molecular weight for endogenous P2Y11 (~40 kDa), overexpressed P2Y11-GFP (~70 kDa), and β-actin (~43 kDa) in tsA-cells transfected with P2Y11-GFP as well as corresponding P2Y11 sense (SNS) or antisense (ANS) ODNs (64% reduction in endogenous P2Y11 expression in cells treated with ANS; 62% reduction in P2Y11-GFP expression in P2Y11-GFP-transfected cells treated with ANS; n = 3 lysates per condition; Figure 2—source data 1). (C) Representative immunoblot detection of P2Y11 (~40 kDa) in lysates from human and wt mouse arteries (n = 3 arterial lysates per sample). (D) Representative confocal images of P2Y11-associated fluorescence (green), wheat germ agglutinin (WGA, red) and merged channels in human (n = 11 cells from three humans) and wt mouse (n = 14 cells from three mice) arterial myocytes. (E) Line profile of the P2Y11- and WGA-associated fluorescence from the area highlighted by the dotted lines in the representative human and mouse arterial myocytes in D.
-
Figure 2—source data 1
Excel spreadsheet containing the individual numeric values of P2Y11/ β-actin relative density corresponding to values reported in legend of Figure 2B.
- https://doi.org/10.7554/eLife.42214.016
Figure 2—figure supplement 1

Full-length blot for Figure 2C, knock down of P2Y11 in arterial lysates, P2Y11 immunoreactivity in isolated mouse arterial lysates, negative controls for immunofluorescence experiments in Figure 2D and P2Y11 antibody control.
(A) Full-length blot corresponding to Figure 2C. Red box indicates the crop region displayed in main figure. (B) Representative blots of immunoreactive bands of expected molecular weight for P2Y11 (~40 kDa) in human (n = 5 arterial lysates per condition) and mouse (n = 5 arterial lysates per condition) arterial lysates treated with P2Y11 sense (SNS) and antisense (ANS) ODNs (*p<0.05, Wilcoxon matched pairs test; Figure 2—figure supplement 1—source data 1). (C) Representative confocal images of human (left; n = 10 cells from two humans) and mouse (right; n = 10 cells from two mice) arterial myocytes in which the primary antibody for P2Y11 (no 1° Ab) was excluded from the preparation (e.g. negative control). Wheat germ agglutinin (WGA, red) was used to label the plasma membrane. (D) Representative blots of immunoreactive bands of expected molecular weight for P2Y11 (~40 kDa) and total protein in isolated mouse arterial myocyte lysates (n = 2 lysates). (E) Exemplary confocal images of P2Y11-associated fluorescence (left) and wheat germ agglutinin (WGA, right) in wt mouse arterial myocytes stained with unboiled (n = 7 cells from six mice) or boiled (n = 7 cells from six mice) P2Y11 primary antibody.
-
Figure 2—figure supplement 1—source data 1
Excel spreadsheet containing the individual numeric values of P2Y11/ β-actin relative density analyzed in Figure 2—figure supplement 1B.
- https://doi.org/10.7554/eLife.42214.015
Figure 3 with 3 supplements
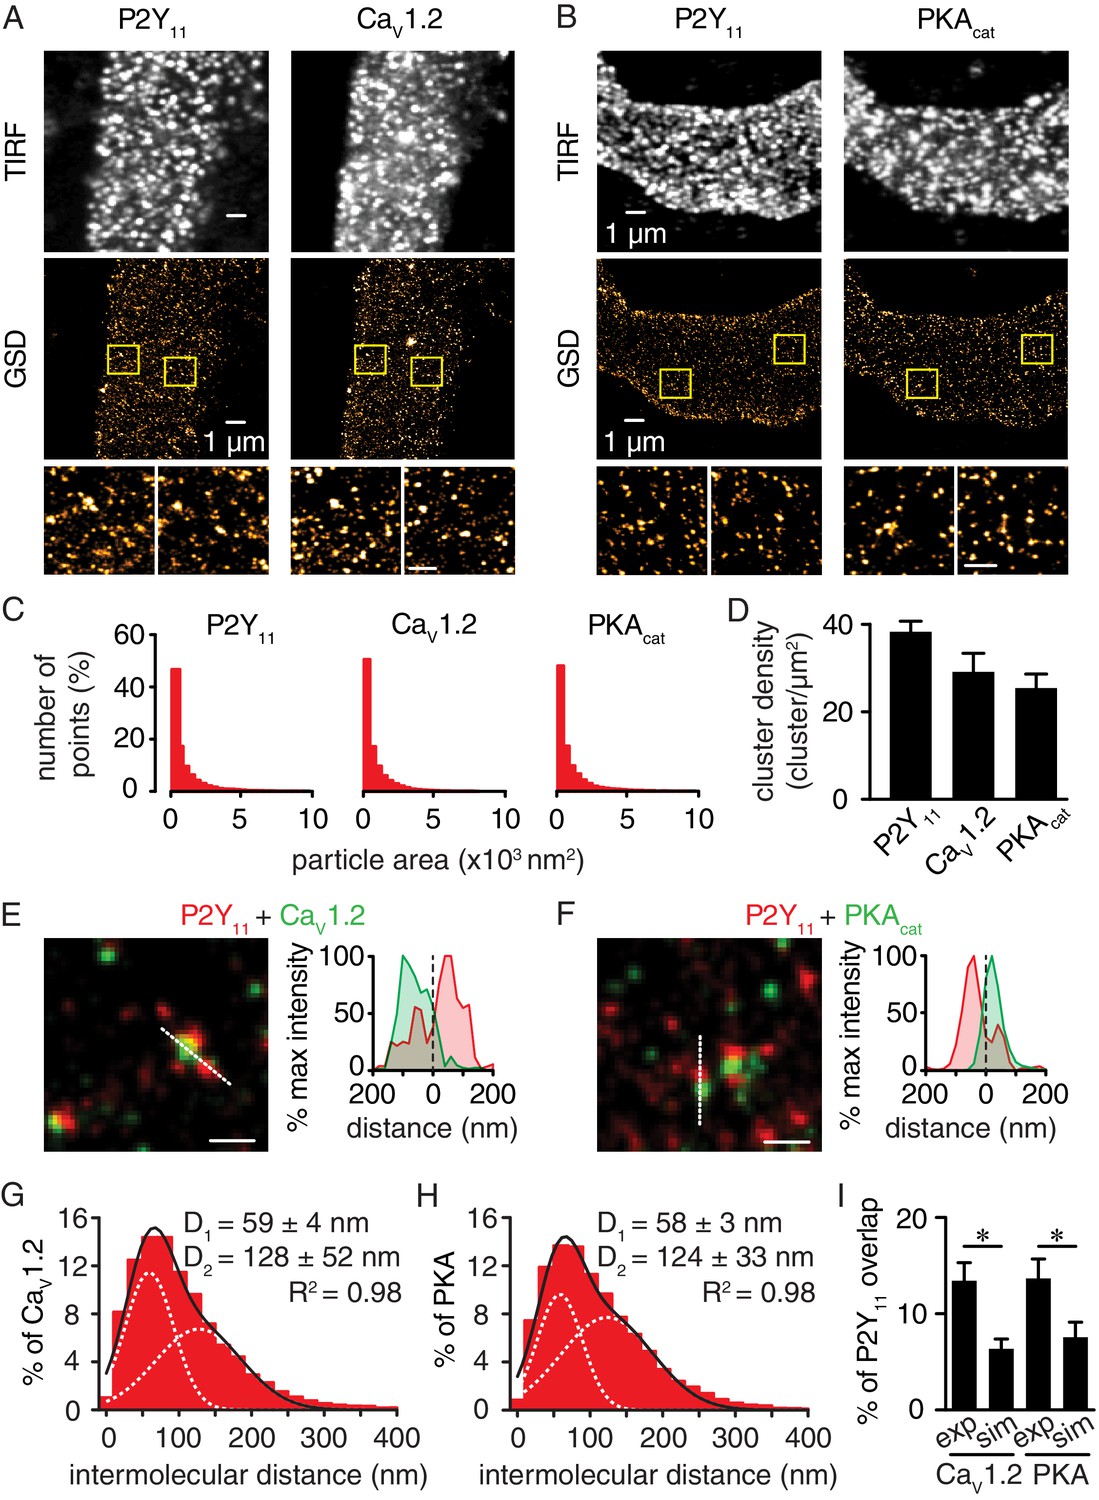
Nanometer organization of P2Y11 with CaV1.2 and PKAcat in human arterial myocytes.
Representative conventional TIRF images (top) and corresponding GSD reconstruction maps (bottom) from human arterial myocytes labeled for (A) P2Y11 and CaV1.2 and (B) P2Y11 and PKAcat. Lower panels display enhanced magnifications of areas shown in yellow boxes (scale bar, 400 nm). (C) Histograms of the area of P2Y11, CaV1.2 and PKAcat clusters in isolated human arterial myocytes (1621 ± 29, 1209 ± 16 and 1322 ± 20 nm2, respectively; Figure 3—source data 1). (D) Bar plot of cluster density for P2Y11, CaV1.2 and PKAcat (38 ± 2, 29 ± 4, and 25 ± 3 clusters/µm2, respectively; Figure 3—source data 2). Enlarged merged image (left) and associated x-y fluorescence intensity profile (right) from area highlighted by the dotted lines of sites of close proximity between (E) P2Y11 (red) and CaV1.2 (green) and (F) P2Y11 (red) and PKAcat (green) (scale bar, 200 nm). Histograms of the lowest intermolecular distance to P2Y11 centroids for (G) CaV1.2 (n = 19,611 particles from 6 cells; Figure 3—source data 3) and (H) PKAcat (n = 22,425 particles from 6 cells; Figure 3—source data 4) fluorescence particles. Data were fit with a sum of two Gaussian functions with depicted R2 and centroids. (I) Bar plot of % overlap of P2Y11 with CaV1.2 or PKAcat for experimental (CaV1.2: n = 36 segments from 12 cells; PKAcat: n = 22 segments from 11 cells) and randomized simulations images (CaV1.2: n = 6 segments from 6 cells; PKAcat: n = 6 segments from 6 cells) (*p<0.05, unpaired t test with Welch’s correction; Figure 3—source data 5).
-
Figure 3—source data 1
Excel spreadsheet containing the individual numeric values of frequency distribution histograms for cluster area in Figure 3C.
- https://doi.org/10.7554/eLife.42214.025
-
Figure 3—source data 2
Excel spreadsheet containing the individual numeric values for cluster density in Figure 3D.
- https://doi.org/10.7554/eLife.42214.026
-
Figure 3—source data 3
Excel spreadsheet containing the individual numeric values of frequency distribution histograms for intermolecular distance in Figure 3G.
- https://doi.org/10.7554/eLife.42214.027
-
Figure 3—source data 4
Excel spreadsheet containing the individual numeric values of frequency distribution histograms for intermolecular distance in Figure 3H.
- https://doi.org/10.7554/eLife.42214.028
-
Figure 3—source data 5
Excel spreadsheet containing the individual numeric values for % of P2Y11 overlap in Figure 3I.
- https://doi.org/10.7554/eLife.42214.029
Figure 3—figure supplement 1
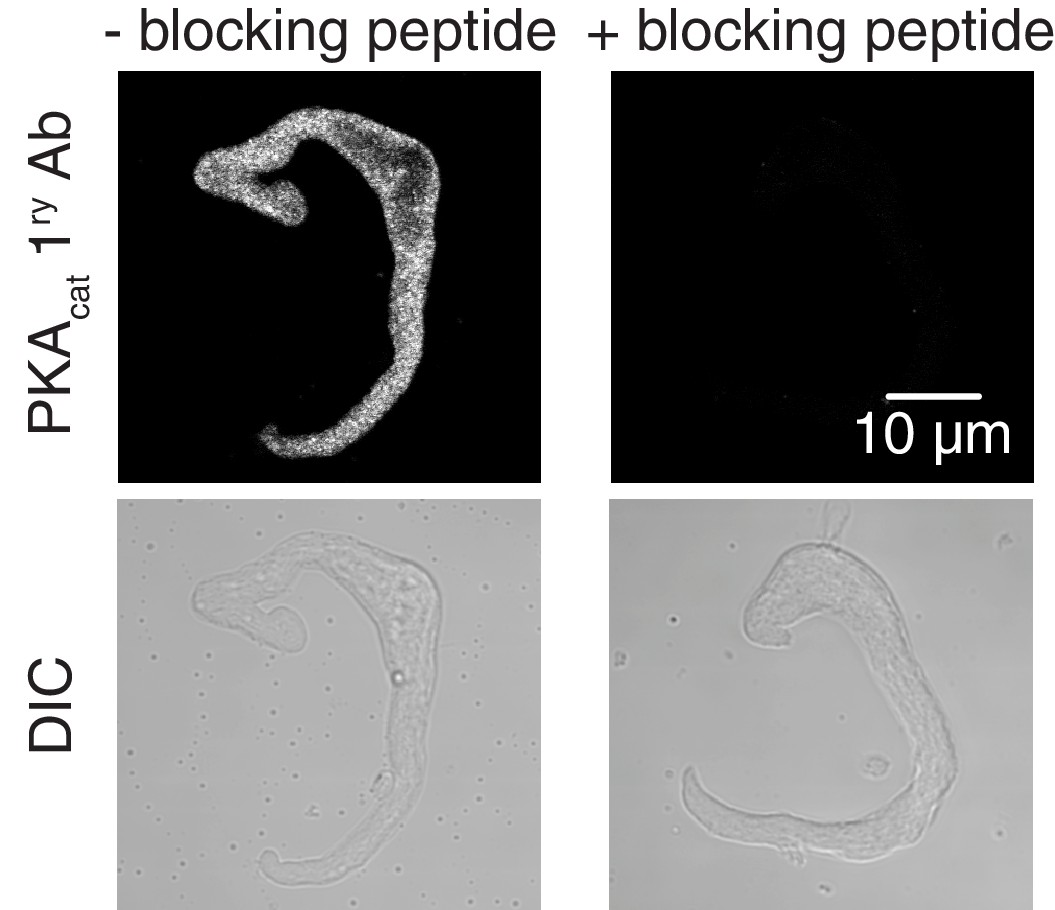
Validation for PKAcat primary antibody.
Representative confocal images of PKAcat-associated fluorescence (top) and differential interference contrast (DIC, bottom) in wt mouse arterial myocytes stained with an anti-PKAcat antibody (- PKAcat blocking peptide on left side; n = 7 cells) and an anti-PKAcat antibody preabsorbed with a PKAcat blocking peptide (+PKAcat blocking peptide on right side; n = 8 cells).
Figure 3—figure supplement 2
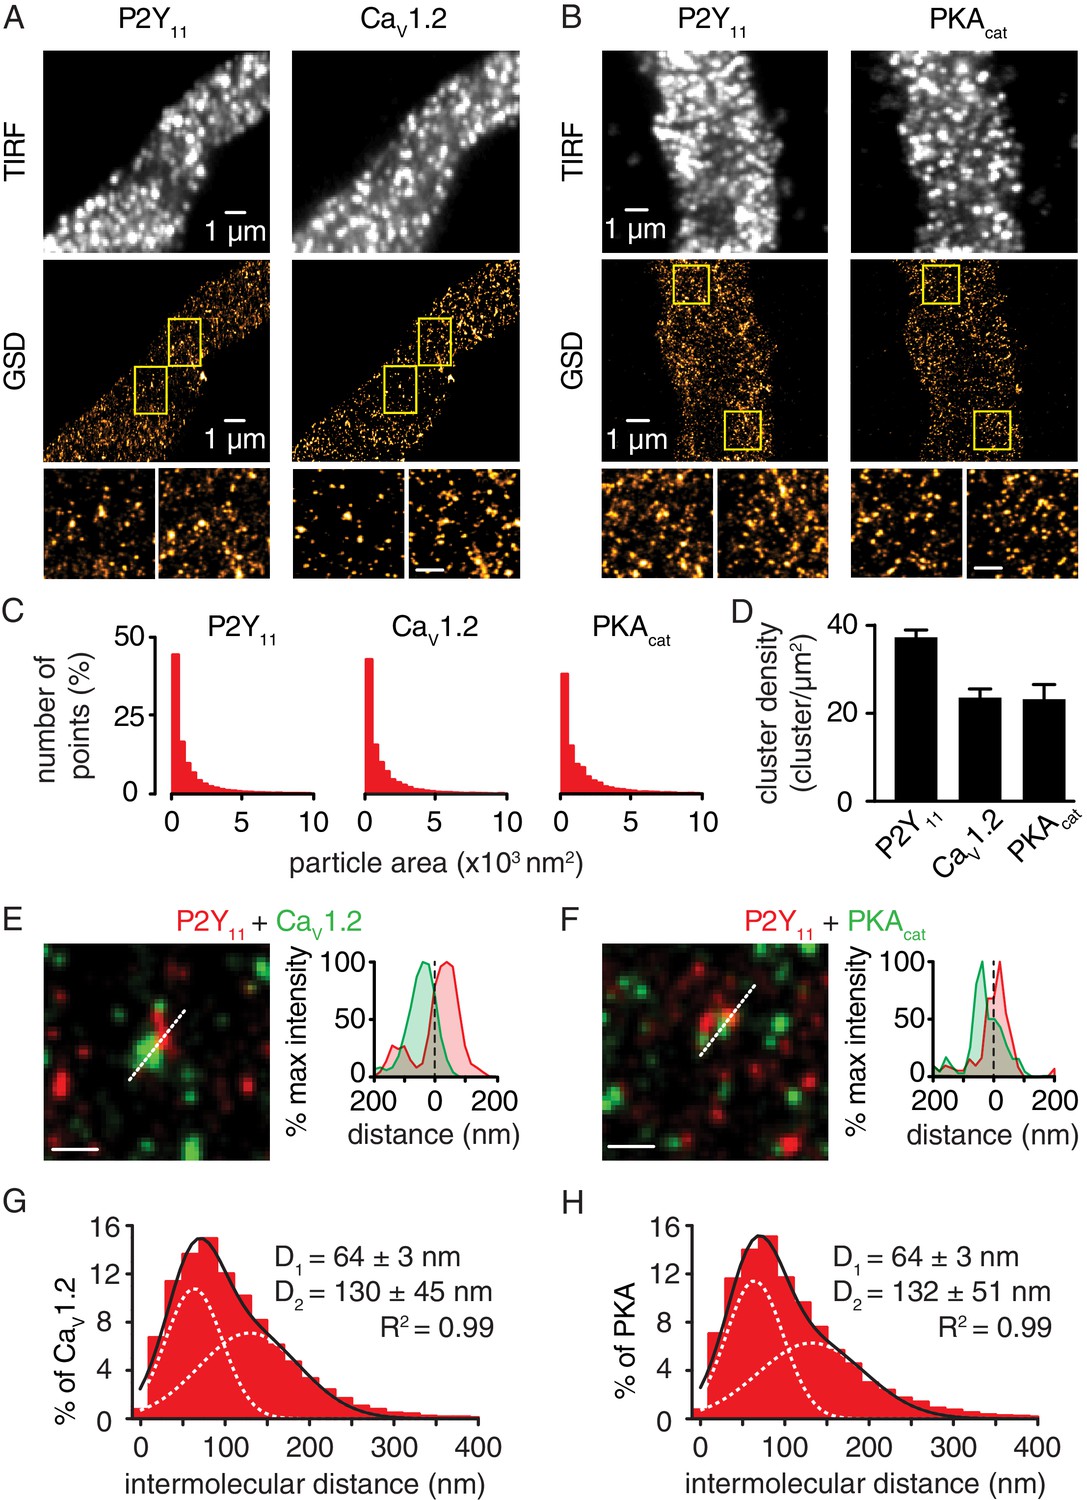
Nanometer organization of P2Y11, CaV1.2 and PKAcat in murine arterial myocytes.
Representative TIRF images (top) and corresponding GSD reconstruction maps (bottom) from murine arterial myocytes labeled for (A) P2Y11 and CaV1.2 and (B) P2Y11 and PKAcat. Lower panels show enhanced magnifications of areas highlighted in yellow boxes (scale bar, 400 nm). (C) Histograms of the area of P2Y11, CaV1.2 and PKAcat clusters in arterial myocytes (1803 ± 22, 2111 ± 68, and 1836 ± 28 nm2, respectively; Figure 3—figure supplement 2—source data 1). (D) Bar plot of cluster density for P2Y11, CaV1.2 and PKAcat (37 ± 2, 24 ± 2, and 23 ± 3 clusters/µm2, respectively; Figure 3—figure supplement 2—source data 2). Enlarged merged image (left) and associated x-y fluorescence intensity profile (right) from area highlighted by the dotted lines of sites of close proximity between (E) P2Y11 (red) and CaV1.2 (green) and (F) P2Y11 (red) and PKAcat (green) (scale bar, 200 nm). Histograms of the lowest intermolecular distance to P2Y11 centroids for (G) CaV1.2 (n = 23,722 particles from 6 cells; Figure 3—figure supplement 2—source data 3) and (H) PKAcat (n = 19,219 particles from 5 cells; Figure 3—figure supplement 2—source data 4) fluorescence particles. Data were fit with a sum of two Gaussian functions with depicted R2 and centroids.
-
Figure 3—figure supplement 2—source data 1
Excel spreadsheet containing the individual numeric values of frequency distribution histograms for cluster area in Figure 3—figure supplement 2C.
- https://doi.org/10.7554/eLife.42214.020
-
Figure 3—figure supplement 2—source data 2
Excel spreadsheet containing the individual numeric values for cluster density in Figure 3—figure supplement 2D.
- https://doi.org/10.7554/eLife.42214.021
-
Figure 3—figure supplement 2—source data 3
Excel spreadsheet containing the individual numeric values of frequency distribution histograms for intermolecular distance in Figure 3—figure supplement 2G.
- https://doi.org/10.7554/eLife.42214.022
-
Figure 3—figure supplement 2—source data 4
Excel spreadsheet containing the individual numeric values of frequency distribution histograms for intermolecular distance in Figure 3—figure supplement 2H.
- https://doi.org/10.7554/eLife.42214.023
Figure 3—figure supplement 3

Negative controls for GSD images in human and murine arterial myocytes, and experimental and randomized reconstruction maps.
Representative TIRF images (top) and corresponding GSD reconstruction maps (bottom) from freshly dissociated (A) human (n = 6 cells from four humans) and (B) mouse (n = 6 cells from six mice) arterial myocytes labeled with secondary antibodies only (no 1° Ab, Alexa 647 or no 1° Ab, Alexa 568). (C) Representative binarized sub-image area of experimental GSD super-resolution localization maps (top) and randomized simulation distribution images (bottom) for P2Y11 with CaV1.2 (left panels; experimental, n = 38 sub-image area from 12 cells; randomized, n = 6 sub-image area from 6 cells) and P2Y11 with PKAcat (right panels; experimental, n = 24 sub-image area from 11 cells; randomized, n = 6 sub-image area from 6 cells) in arterial myocytes. A smoothing filter was applied to the P2Y11, CaV1.2 and PKAcat images for presentation. Note that randomization data were repeated six times from six different experimental GSD super-resolution localization maps. The overlap images for both experimental and simulated data were generated by multiplying the P2Y11 image by the respective CaV1.2 or PKAcat image, thus revealing overlapping objects.
Figure 4 with 1 supplement
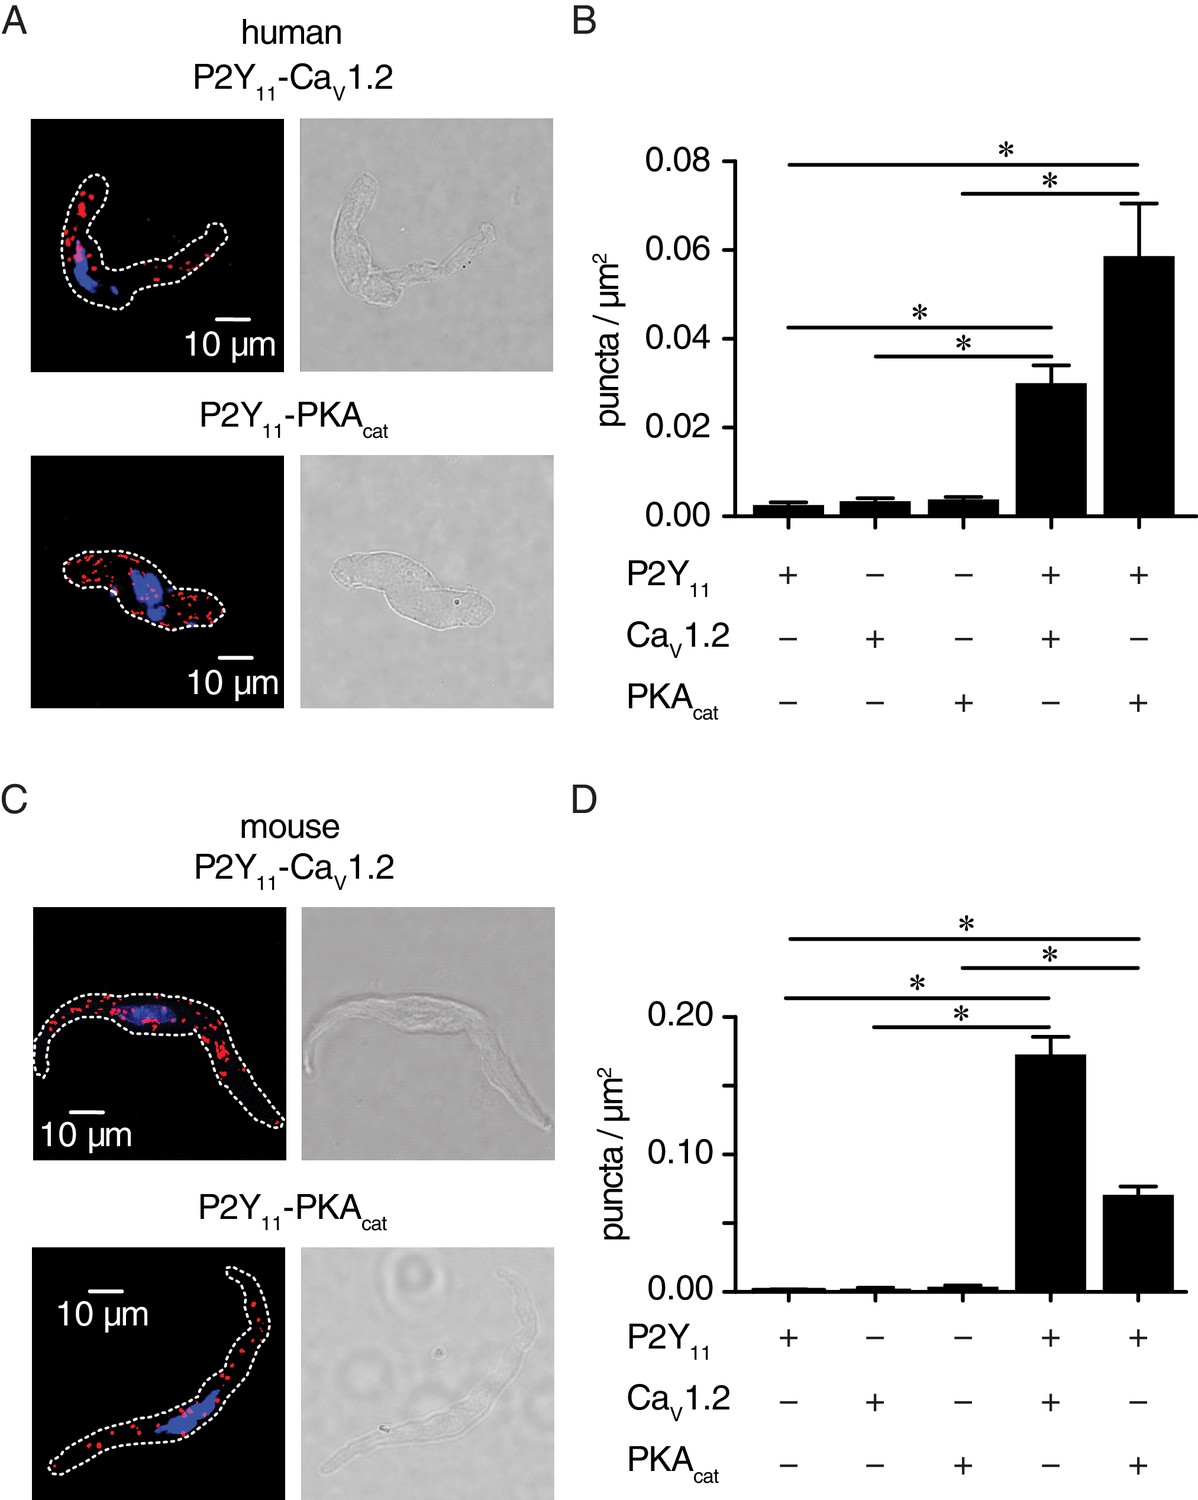
P2Y11 associates with CaV1.2 and PKAcat in human and murine arterial myocytes.
(A) Exemplary fluorescence PLA (red)/DAPI (blue) and differential interference contrast (right) images of human arterial myocytes labeled for P2Y11 + CaV1.2 and P2Y11 + PKAcat. (B) Quantification of PLA fluorescent puncta per cell area (puncta/µm2) for human arterial myocytes labeled for P2Y11 (n = 26 cells from three human samples), CaV1.2 (n = 20 cells from three humans), PKAcat (n = 17 cells from three humans), P2Y11 + CaV1.2 (n = 23 cells from three humans), and P2Y11 + PKAcat (n = 20 cells from three humans) (*p<0.05, Kruskal-Wallis with Dunn’s multiple comparisons; Figure 4—source data 1). (C) Representative fluorescence PLA (red)/DAPI (blue) and differential interference contrast (right) images of mouse arterial myocytes labeled for P2Y11 + CaV1.2 and P2Y11 + PKAcat. (D) Quantification of PLA fluorescent puncta per µm2 cell area for mouse arterial myocytes labeled for P2Y11 (n = 44 cells from six mice), CaV1.2 (n = 15 cells from six mice), PKAcat (n = 19 cells from six mice), P2Y11 + CaV1.2 (n = 25 cells from six mice), and P2Y11 + PKAcat (n = 29 cells from six mice) (*p<0.05, Kruskal-Wallis with Dunn’s multiple comparisons; Figure 4—source data 2).
-
Figure 4—source data 1
Excel spreadsheet containing the individual numeric values of puncta/µm2 graphs in Figure 4B.
- https://doi.org/10.7554/eLife.42214.032
-
Figure 4—source data 2
Excel spreadsheet containing the individual numeric values of puncta/µm2 graphs in Figure 4D.
- https://doi.org/10.7554/eLife.42214.033
Figure 4—figure supplement 1
Negative controls for PLA in human and murine arterial myocytes.
Fluorescence PLA (red)/DAPI (blue) (left) and differential interference contrast (right) images of negative controls for human (A) and murine (B) arterial myocytes labeled with one 1° antibody (CaV1.2: n = 20 cells from three humans, n = 15 cells from six mice; P2Y11: n = 26 cells from three humans, n = 44 cells from six mice; PKAcat: n = 17 cells from three humans, n = 19 cells from six mice).
Figure 5 with 1 supplement

Glucose and the P2Y11 agonist NF546 increase sarcolemmal cAMP synthesis in arterial myocytes, and these effects are prevented by the P2Y11 antagonist NF340.
(A) Time course of YFP/CFP (donor/acceptor) FRET ratios (normalized to resting levels before treatment) in human arterial myocytes expressing the ICUE3-PM biosensor in response to 15 mM D-glucose (black; n = 19 cells from two humans), 500 nM NF546 (green; n = 18 cells from two humans) and 15 mM D-glucose +500 nM NF546 (red; n = 14 cells from two humans) before and after application of broad adenylyl cyclase agonist forskolin (1 µM). In a set of experiments, cells were first pre-treated with the P2Y11 antagonist NF340 (10 µM) for at least 15–20 min before treatment with 500 nM NF546 (orange; n = 15 cells from two humans) and 15 mM D-glucose +500 nM NF546 (blue; n = 13 cells from two humans). Horizontal bars indicate treatment. Increases in cAMP production are represented by decreases in YFP/CFP ratio due to binding of cAMP to the biosensor. (B) Bar plot of maximum FRET responses (YFP/CFP) for human arterial myocytes in response to the indicated treatment (*p<0.05, Kruskal-Wallis with Dunn’s multiple comparisons; Figure 5—source data 1. Statistical differences were compared between 15 mM D-glucose vs NF546, 15 mM D-glucose vs 15 mM D-glucose +NF546, 15 mM D-glucose vs NF546 +NF340, 15 mM D-glucose vs 15 mM D-glucose +NF546+NF340, NF546 vs NF546 +NF340, NF546 vs 15 mM D-glucose +NF546, NF546 vs 15 mM D-glucose +NF546+NF340, 15 mM D-glucose +NF546 vs 15 mM D-glucose +NF546+NF340). (C) Time course of YFP/CFP (donor/acceptor) FRET ratios (normalized to resting levels before treatment) in mouse arterial myocytes expressing the ICUE3-PM biosensor in response to 20 mM D-glucose (black; n = 83 cells from three mice), 500 nM NF546 (green; n = 13 cells from three mice) and 20 mM D-glucose +500 nM NF546 (red; n = 13 cells from three mice). Horizontal bars indicate treatment. In a set of experiments, cells were first pre-treated with the P2Y11 antagonist NF340 (10 µM) for at least 15–20 min before treatment with 500 nM NF546 (orange; n = 17 cells from three mice) and 20 mM D-glucose +500 nM NF546 (blue; n = 18 cells from three mice). Increases in cAMP production are represented by decreases in YFP/CFP ratio due to binding of cAMP to the biosensor. (D) Bar plot of maximum FRET responses (YFP/CFP) for mouse arterial myocytes in response to the indicated treatment (*p<0.05, Kruskal-Wallis with Dunn’s multiple comparisons; Figure 5—source data 2. Statistical differences were compared between all datasets).
-
Figure 5—source data 1
Excel spreadsheet containing the individual numeric values for maximum FRET responses in Figure 5B.
- https://doi.org/10.7554/eLife.42214.039
-
Figure 5—source data 2
Excel spreadsheet containing the individual numeric values for maximum FRET responses in Figure 5D.
- https://doi.org/10.7554/eLife.42214.040
Figure 5—figure supplement 1
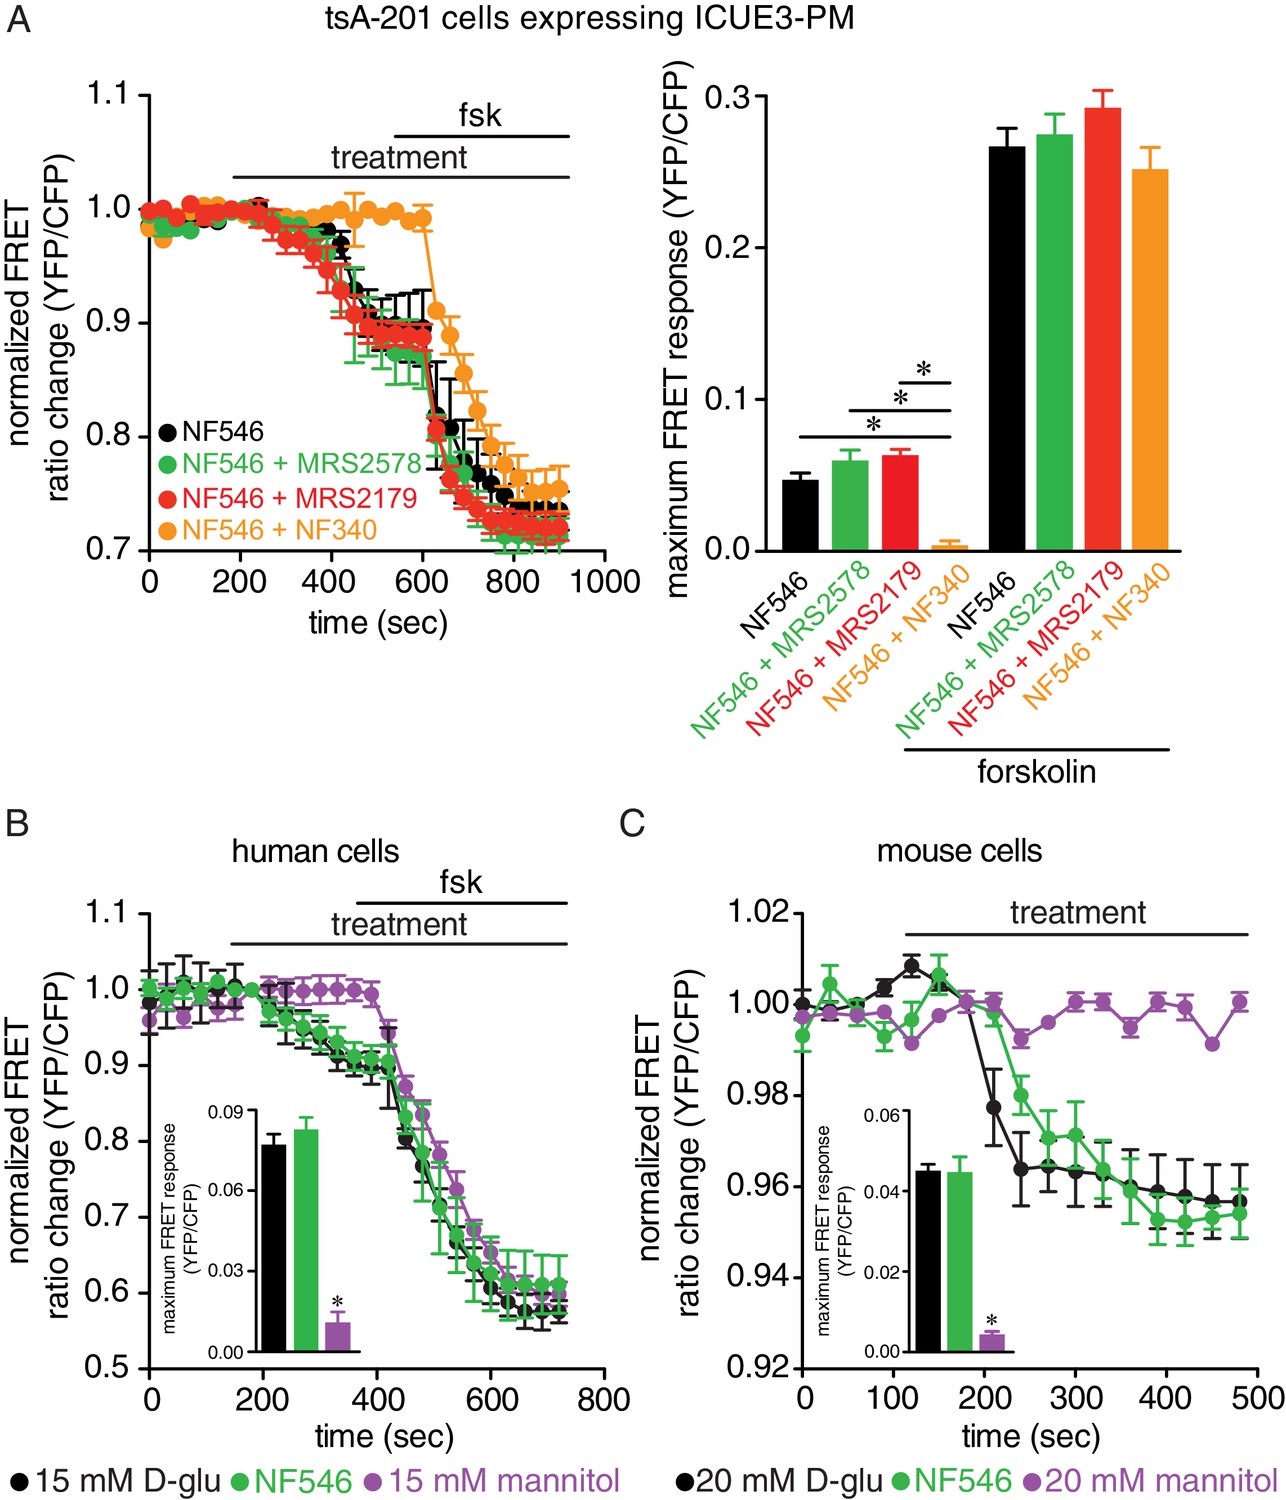
The P2Y11 agonist NF546 increases cAMP and this is blocked in the presence of the P2Y11 inhibitor NF340 but not with the P2Y1 inhibitor MSR2179 or P2Y6 inhibitor MRS2578 in tsA-201 cells, and no increases in cAMP in arterial myocytes with mannitol.
(A) Time course of YFP/CFP (donor/acceptor) FRET ratios (normalized to resting levels before treatment) in tsA-201 cells expressing the ICUE3-PM biosensor in response to 500 nM NF546 (black; n = 19 cells) and 500 nM NF546 in the presence of the P2Y6 inhibitor MRS2578 (100 nM; green; n = 25 cells), P2Y1 inhibitor MRS2179 (10 μM; red; n = 18 cells) or the P2Y11 inhibitor NF340 (10 μM; orange; n = 20 cells) before and after application of the broad adenylyl cyclase agonist forskolin (1 µM). Horizontal bars indicate treatment. All inhibitors were applied to the preparation 15–20 min before treatment. Increases in cAMP production are represented by decreases in YFP/CFP ratio due to binding of cAMP to the biosensor. Bar plot of maximum FRET responses (YFP/CFP) for tsA-201 cells in response to the indicated treatment (*p<0.05, Kruskal-Wallis with Dunn’s multiple comparisons; Figure 5—figure supplement 1—source data 1). (B) Time course of YFP/CFP (donor/acceptor) FRET ratios (normalized to resting levels before treatment) in human arterial myocytes expressing the ICUE3-PM biosensor in response to 15 mM D-glucose (black; n = 19 cells from two humans), 500 nM NF546 (green; n = 18 cells from two humans), and 15 mM mannitol (purple; n = 17 cells from two humans) before and after application of forskolin (1 µM). Bar plot of maximum FRET responses (YFP/CFP) for human arterial myocytes in response to indicated treatment. Data for 15 mM D-glucose and NF546 are from Figure 5A (*p<0.05, Kruskal-Wallis with Dunn’s multiple comparisons; Figure 5—figure supplement 1—source data 2). (C) Time course of YFP/CFP (donor/acceptor) FRET ratios (normalized to resting levels before treatment) in mouse arterial myocytes expressing the ICUE3-PM biosensor in response to 20 mM D-glucose (black; n = 83 cells from three mice), 500 nM NF546 (green; n = 13 cells from three mice), and 20 mM mannitol (purple; n = 23 cells from three mice). Bar plot of maximum FRET responses (YFP/CFP) for mouse arterial myocytes in response to indicated treatment. Data for 20 mM D-glucose and NF546 is from Figure 5B (*p<0.05, Kruskal-Wallis with Dunn’s multiple comparisons; Figure 5—figure supplement 1—source data 3).
-
Figure 5—figure supplement 1—source data 1
Excel spreadsheet containing the individual numeric values for maximum FRET responses in Figure 5—figure supplement 1A.
- https://doi.org/10.7554/eLife.42214.036
-
Figure 5—figure supplement 1—source data 2
Excel spreadsheet containing the individual numeric values for maximum FRET responses in Figure 5—figure supplement 1B.
- https://doi.org/10.7554/eLife.42214.037
-
Figure 5—figure supplement 1—source data 3
Excel spreadsheet containing the individual numeric values for maximum FRET responses in Figure 5—figure supplement 1C.
- https://doi.org/10.7554/eLife.42214.038
Figure 6 with 1 supplement
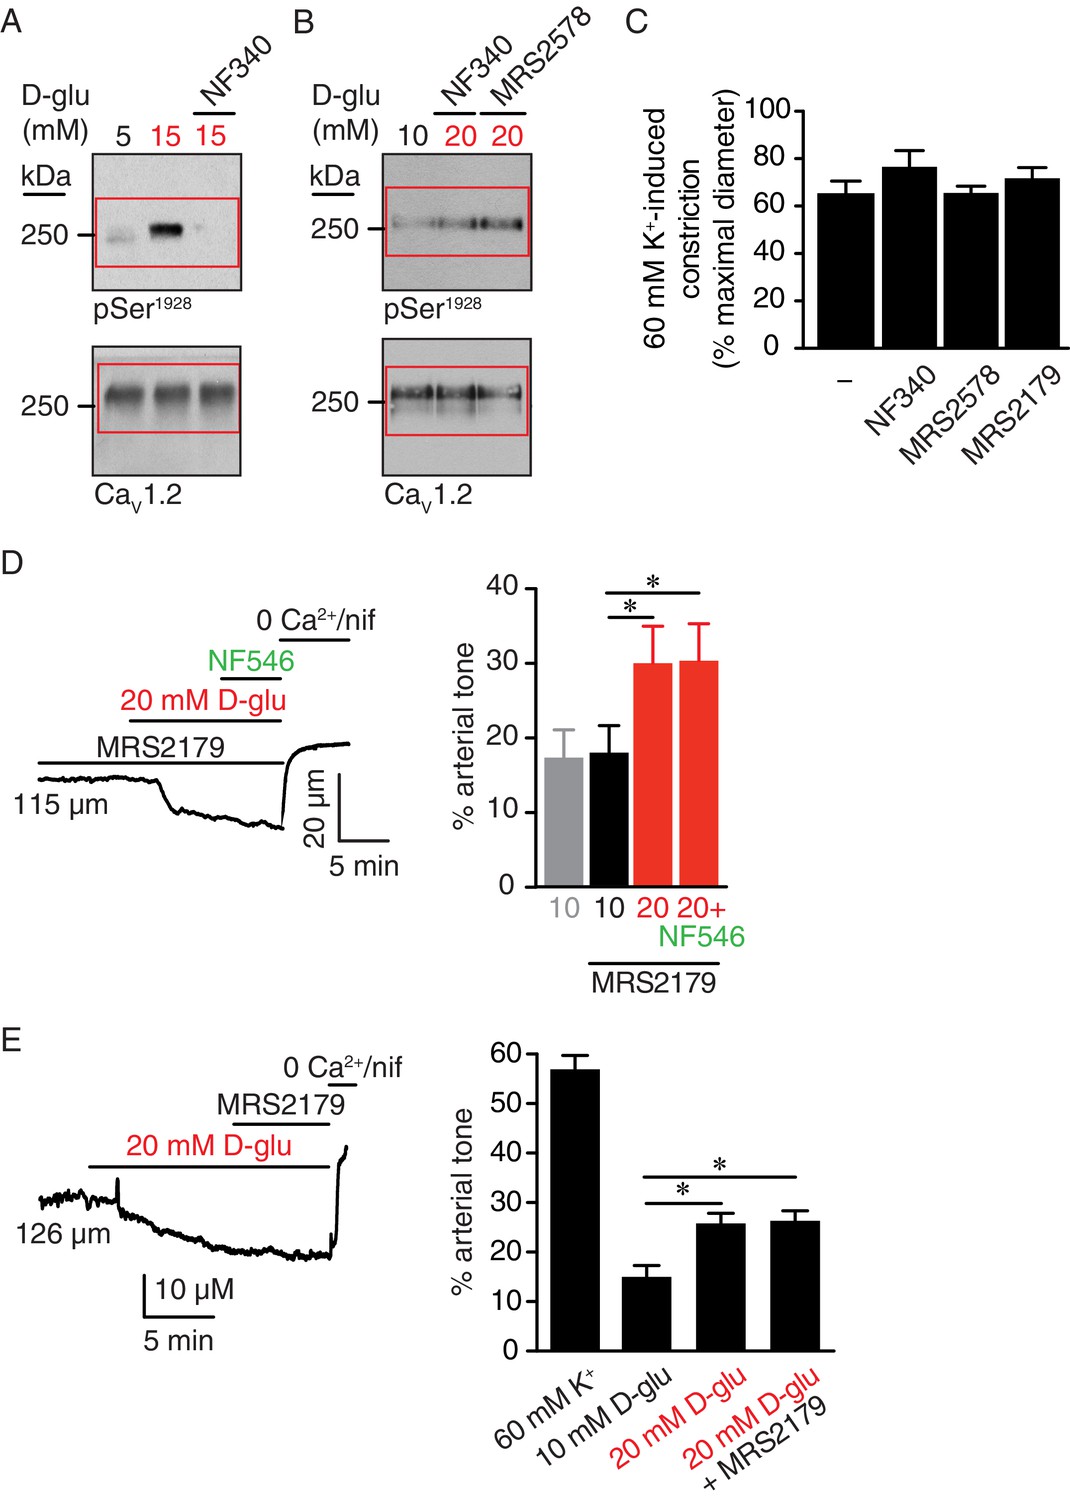
The P2Y11 inhibitor NF340 prevents glucose-induced elevations in Ser1928 phosphorylation, LTCC activity, and vasoconstriction in human and murine arterial myocytes.
(A) Representative IBa recordings from the same cell and (B) summary current density data obtained from freshly dissociated human arterial myocytes before and after increasing extracellular D-glucose from 5 mM to 15 mM in the absence (n = 12 cells from six humans) and presence (n = 10 cells from five humans) of NF340 (10 µM) (*p<0.05, paired t test; Figure 6—source data 1). (C) Exemplary IBa traces from the same cell and (D) amalgamated current density data recorded from mouse cerebral arterial myocytes treated with 10 µM NF340 (n = 8 cells from three mice) or 100 nM MRS2578 (n = 7 cells from five mice) before and after increasing extracellular D-glucose from 10 mM to 20 mM (*p<0.05, Kruskal-Wallis with Dunn’s multiple comparisons; Figure 6—source data 2). Representative immunoreactive bands for phosphorylated Ser1928 (pSer1928) and total CaV1.2 and densitometry for pSer1928/CaV1.2 ratio in lysates from (E) human arteries exposed to 5 mM and 15 mM D-glucose in the absence and presence of 10 µM NF340 (n = 6 arterial lysates per condition; *p<0.05, Kruskal-Wallis with Dunn’s multiple comparisons; Figure 6—source data 3) and (F) mouse cerebral and mesenteric arteries exposed to 10 mM or 20 mM D-glucose in the presence of 10 µM NF340 or 100 nM MRS2578 (n = 4 arterial lysates per condition; *p<0.05 Kruskal-Wallis with Dunn’s multiple comparisons; Figure 6—source data 4). Representative diameter recordings and summary data from pressurized (60 mmHg) mouse cerebral arteries exposed to (G–H) 10 µM NF340 (n = 4 arteries from four mice; Friedman with Dunn’s multiple comparisons; Figure 6—source data 5) or (I–J) 100 nM MRS2578 (n = 7 arteries from seven mice; *p<0.05, Wilcoxon matched pair test; Figure 6—source data 6) before and after application of 20 mM D-glucose.
-
Figure 6—source data 1
Excel spreadsheet containing the individual numeric values of current density analyzed in Figure 6B.
- https://doi.org/10.7554/eLife.42214.046
-
Figure 6—source data 2
Excel spreadsheet containing the individual numeric values of current density analyzed in Figure 6D.
- https://doi.org/10.7554/eLife.42214.047
-
Figure 6—source data 3
Excel spreadsheet containing the individual numeric values of pSer1928/CaV1.2 relative density analyzed in Figure 6E.
- https://doi.org/10.7554/eLife.42214.048
-
Figure 6—source data 4
Excel spreadsheet containing the individual numeric values of pSer1928/CaV1.2 relative density analyzed in Figure 6F.
- https://doi.org/10.7554/eLife.42214.049
-
Figure 6—source data 5
Excel spreadsheet containing the individual numeric values of % arterial tone analyzed in Figure 6H and corresponding raw diameters.
- https://doi.org/10.7554/eLife.42214.050
-
Figure 6—source data 6
Excel spreadsheet containing the individual numeric values of % arterial tone analyzed in Figure 6J and corresponding raw diameters.
- https://doi.org/10.7554/eLife.42214.051
Figure 6—figure supplement 1
Full-length blots for Figure 6E and F, high K+induced constriction in arteries pretreated with NF340 and MRS2578 corresponding to data in Figure 6, and glucose-induced vasoconstriction is not prevented or inhibited by a selective P2Y1 antagonist.
Representative full-length blots corresponding to (A) Figure 6E and (B) Figure 6F. Red boxes indicate the crop region displayed in the main figure. (C) Bar plot of % constriction in response to 60 mM K+ from mouse arteries in control (-) condition (same control as in Figure 1—figure supplement 1A) and arteries pretreated with 10 µM NF340 (n = 4 arteries from four mice), 100 nM MRS2578 (n = 7 arteries from seven mice) or 10 µM MRS2179 (n = 7 arteries from four mice) (Figure 6—figure supplement 1—source data 1). (D) Representative diameter recording and summary data from pressurized (60 mmHg) mouse cerebral arteries exposed to 10 µM MRS2179 before and after application of 20 mM D-glucose in the absence and presence of 500 nM NF546 (n = 7 arteries from four mice; *p<0.05, Friedman test with Dunn’s multiple comparisons for datasets in the presence of MRS2179. Mann-Whitney test was performed between 10 mM D-glu and 10 mM D-glu +MRS2179; Figure 6—figure supplement 1—source data 2). (E) Representative diameter recording and summary data from pressurized (60 mmHg) mouse cerebral arteries exposed to 20 mM D-glucose before and after application of 10 µM MRS2179 (n = 6 arteries from six mice; *p<0.05, Friedman test with Dunn’s multiple comparisons; Figure 6—figure supplement 1—source data 3).
-
Figure 6—figure supplement 1—source data 1
Excel spreadsheet containing the individual numeric values of 60 mM K+-induced % constriction analyzed in Figure 6—figure supplement 1C.
- https://doi.org/10.7554/eLife.42214.043
-
Figure 6—figure supplement 1—source data 2
Excel spreadsheet containing the individual numeric values of % arterial tone analyzed in Figure 6—figure supplement 1D and corresponding raw diameters.
- https://doi.org/10.7554/eLife.42214.044
-
Figure 6—figure supplement 1—source data 3
Excel spreadsheet containing the individual numeric values of % arterial tone analyzed in Figure 6—figure supplement 1E and corresponding raw diameters.
- https://doi.org/10.7554/eLife.42214.045
Figure 7 with 1 supplement
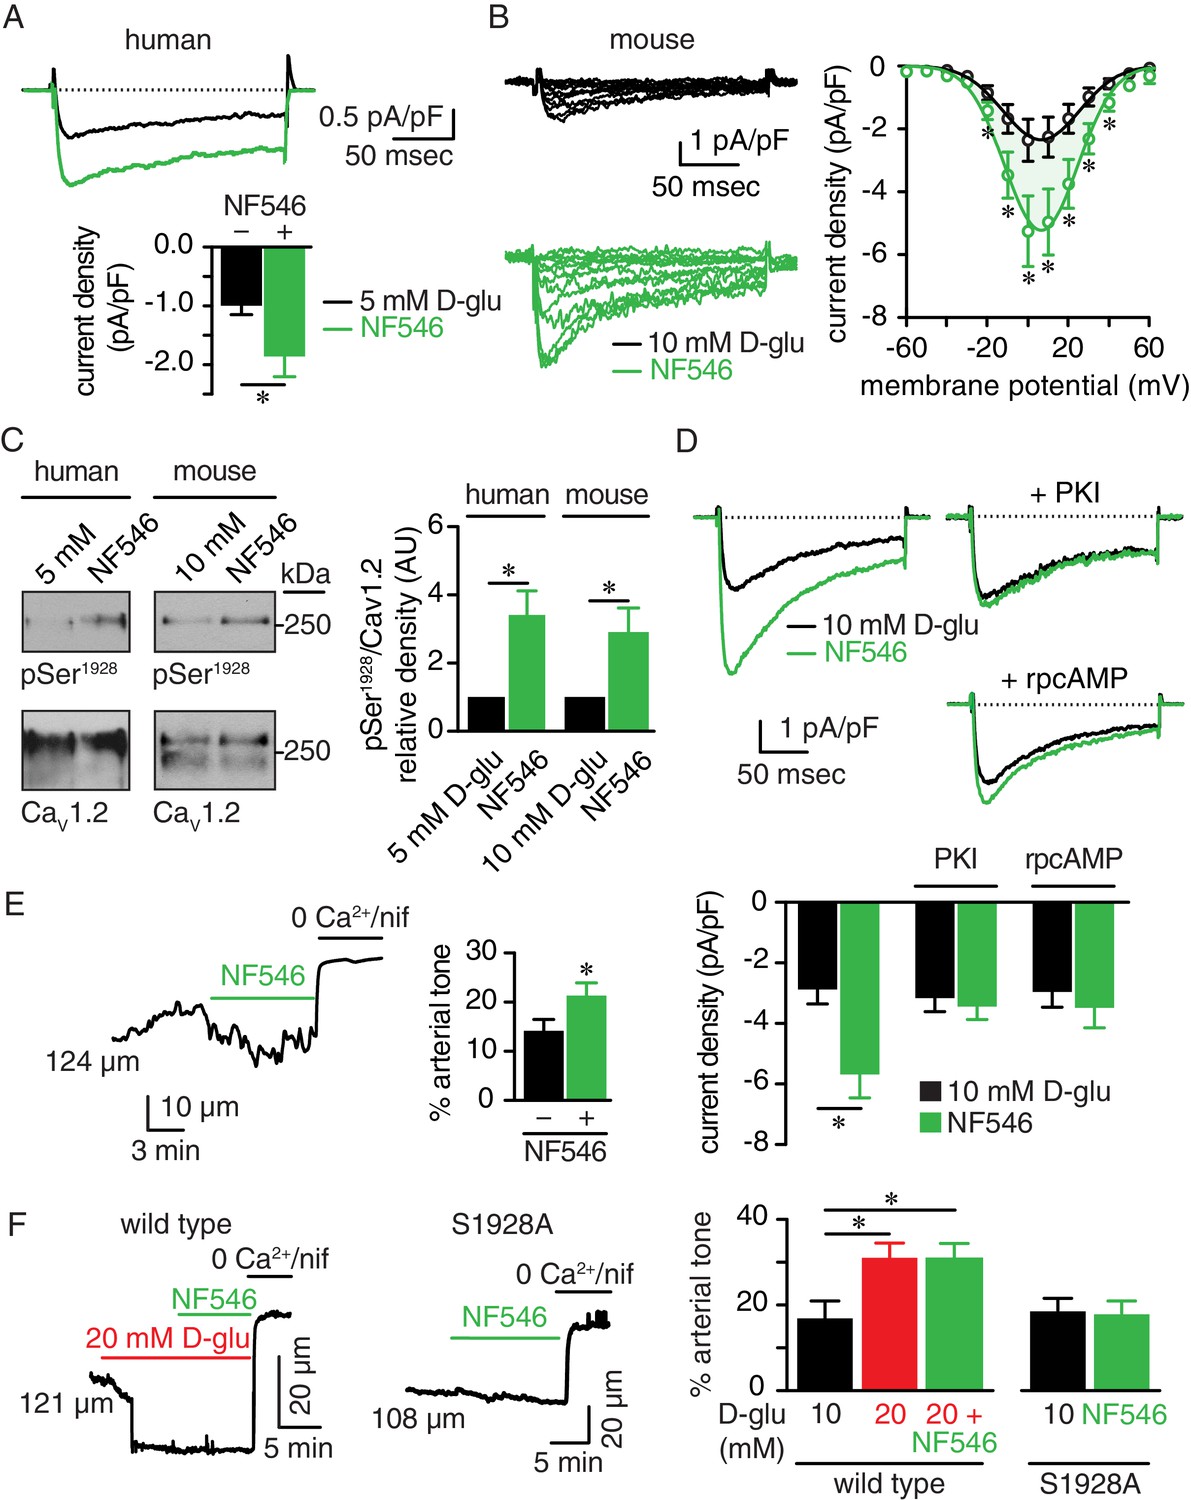
The P2Y11 agonist NF546 increases Ser1928 phosphorylation, LTCC activity, and induces vasoconstriction.
(A) Representative IBa recordings from the same cell (top) and summary IBa data (bottom) from freshly dissociated human arterial myocytes in response to step depolarizations from −70 to +10 mV before and after application of 500 nM NF546 (n = 11 cells from five humans; *p<0.05, paired t test; Figure 7—source data 1). (B) Representative IBa recordings from the same cell (left) triggered by step depolarization from −70 mV to voltages ranging from −60 to +60 mV before and after application of 500 nM NF546 in mouse cerebral arterial myocytes and corresponding IBa-voltage relationship (right) (n = 8 cells from five mice) (*p<0.05, paired t test; Figure 7—source data 2). (C) Exemplary immunoblot detection of phosphorylated Ser1928 (pSer1928) and total CaV1.2 from human (left) and mouse cerebral and mesenteric arteries (right) incubated with 500 nM NF546 and respective densitometry quantification of pSer1928/CaV1.2 ratio (n = 6 arterial lysates per condition for humans; n = 6 arterial lysates per condition for mice) (*p<0.05, Wilcoxon matched pairs test; Figure 7—source data 3). (D) Representative IBa recordings from the same cell (top) and summary IBa data (bottom) from mouse arterial myocytes evoked by step depolarizations from −70 to +10 mV before and after application of 500 nM NF546 in the absence (n = 9 cells, four mice) and presence of 100 nM PKI (n = 9 cells, five mice) or 10 µM rpcAMP (n = 9 cells, four mice) (*p<0.05, paired t test; Figure 7—source data 4). (E) Representative diameter recording and summary arterial tone data from pressurized (60 mmHg) mouse cerebral arteries exposed to 500 nM NF546 (n = 6 arteries, six mice) (*p<0.05, Wilcoxon matched pairs test; Figure 7—source data 5). (F) Representative diameter recordings and summary arterial tone data from pressurized (60 mmHg) wt mouse cerebral arteries exposed to 20 mM D-glucose before and after application of 500 nM NF546 (n = 6 arteries, six mice, left; *p<0.05, Friedman with Dunn’s multiple comparisons; Figure 7—source data 6) and S9128A mouse cerebral arteries after NF546 application (n = 4 from three mice, right; Figure 7—source data 6).
-
Figure 7—source data 1
Excel spreadsheet containing the individual numeric values of current density analyzed in Figure 7A.
- https://doi.org/10.7554/eLife.42214.057
-
Figure 7—source data 2
Excel spreadsheet containing the individual numeric values of current density analyzed in Figure 7B.
- https://doi.org/10.7554/eLife.42214.058
-
Figure 7—source data 3
Excel spreadsheet containing the individual numeric values of pSer1928/CaV1.2 relative density analyzed in Figure 7C.
- https://doi.org/10.7554/eLife.42214.059
-
Figure 7—source data 4
Excel spreadsheet containing the individual numeric values of current density analyzed in Figure 7D.
- https://doi.org/10.7554/eLife.42214.060
-
Figure 7—source data 5
Excel spreadsheet containing the individual numeric values of % arterial tone analyzed in Figure 7E and corresponding raw diameters.
- https://doi.org/10.7554/eLife.42214.061
-
Figure 7—source data 6
Excel spreadsheet containing the individual numeric values of % arterial tone analyzed in Figure 7F and corresponding raw diameters.
- https://doi.org/10.7554/eLife.42214.062
Figure 7—figure supplement 1
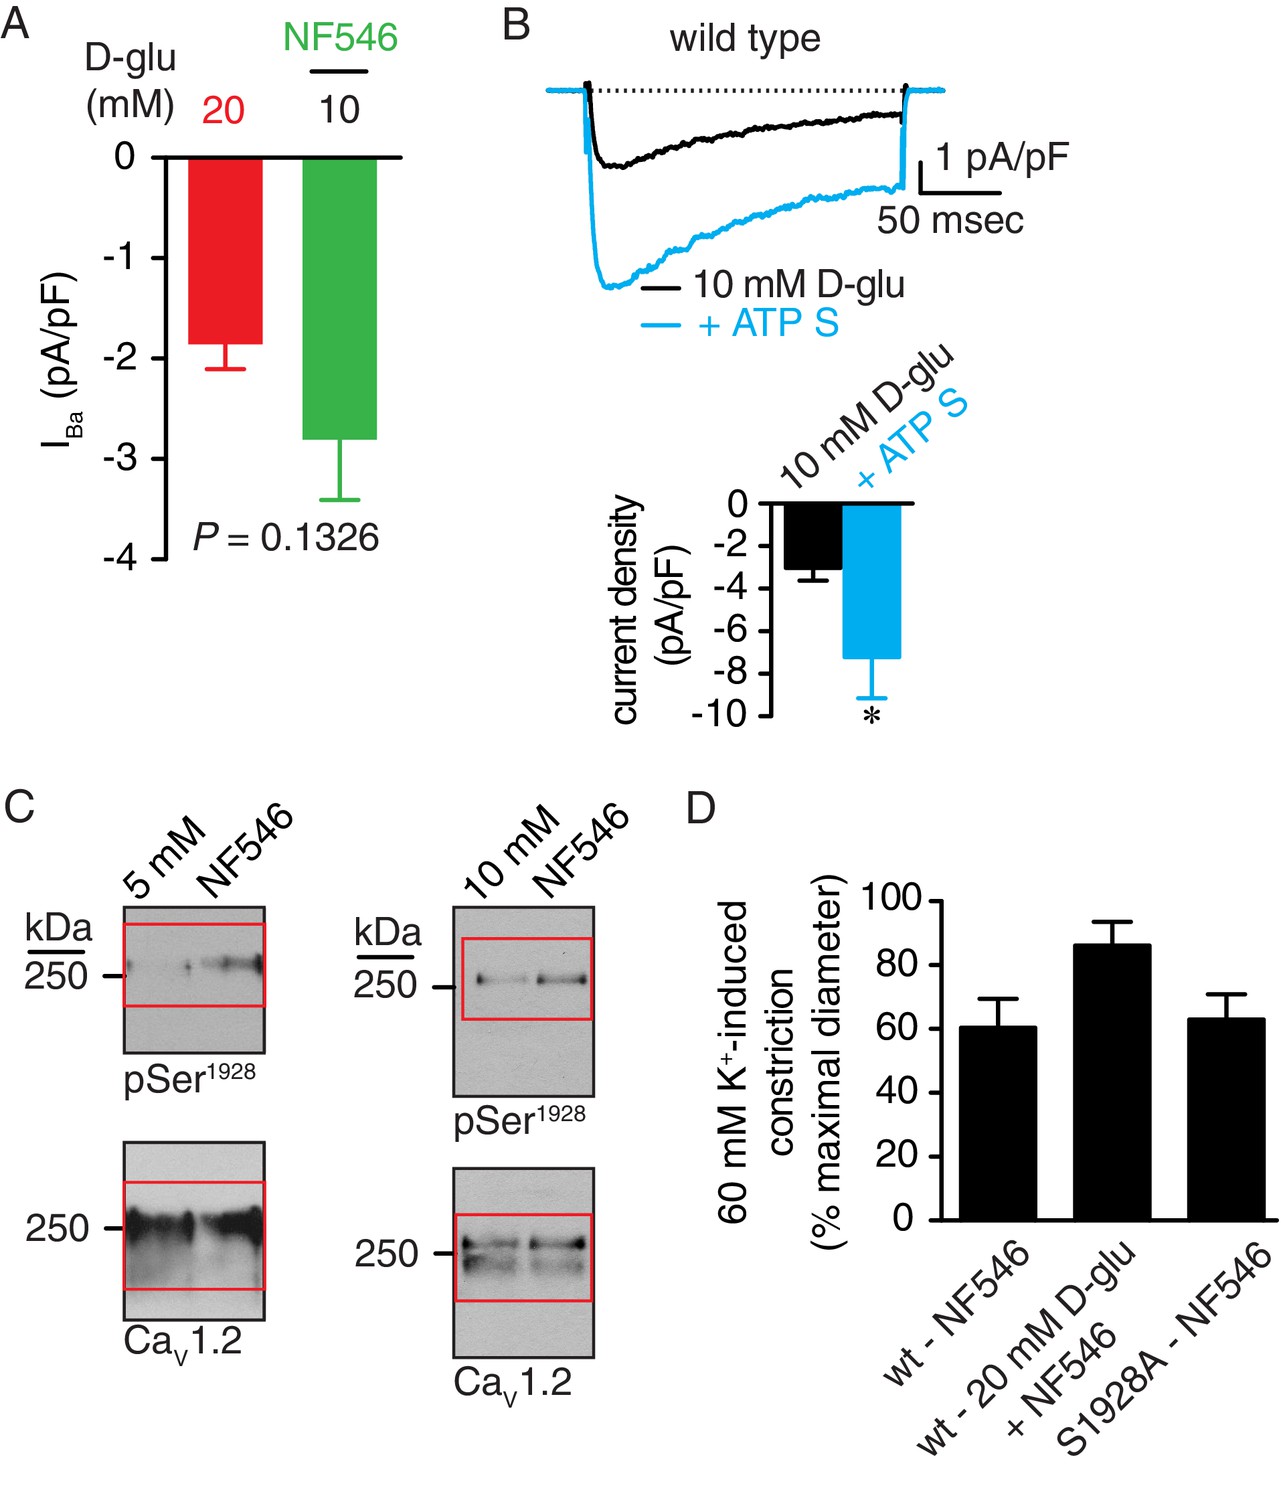
D-glucose and NF546 elicit changes in IBa of similar magnitude in mouse arterial myocytes, ATPγS increases IBa in arterial myocytes, full-length blots corresponding to data in Figure 7C, and high K+-induced constriction in wt and S1928A arteries treated with NF546 corresponding to data in Figure 7.
(A) Summary data showing changes in IBa in response to elevating D-glucose from 10 mM to 20 mM (−1.9 ± 0.2 pA/pF; n = 11 cells from five mice) or after application of the P2Y11 agonist NF546 (500 nM; −2.8 ± 0.6 pA/pF; n = 9 cells from four mice) (*p=0.1326, unpaired t test; Figure 7—figure supplement 1—source data 1). (B) Representative IBa recordings from the same cell (left) and summary IBa data (right) from mouse arterial myocytes evoked by step depolarizations from −70 to +10 mV before and after application of 1 µM ATPγS (n = 10 cells from four mice) (*p<0.05, paired t test; Figure 7—figure supplement 1—source data 2). (C) Full-length blots corresponding to Figure 7C. Red boxes indicate the crop regions displayed in the main figure. (D) Bar plot of % constriction in response to 60 mM K+ from wt mouse arteries treated with 500 nM NF546 (n = 6 arteries, six mice) and 20 mM D-glucose +NF546 (n = 6 arteries, six mice) and S1928A mouse arteries treated with NF546 (n = 4 from three mice) (Figure 7—figure supplement 1—source data 3).
-
Figure 7—figure supplement 1—source data 1
Excel spreadsheet containing the individual numeric values of change in current density analyzed in Figure 7—figure supplement 1A.
- https://doi.org/10.7554/eLife.42214.054
-
Figure 7—figure supplement 1—source data 2
Excel spreadsheet containing the individual numeric values of current density analyzed in Figure 7—figure supplement 1B.
- https://doi.org/10.7554/eLife.42214.055
-
Figure 7—figure supplement 1—source data 3
Excel spreadsheet containing the individual numeric values of 60 mM K+-induced % constriction analyzed in Figure 7—figure supplement 1D.
- https://doi.org/10.7554/eLife.42214.056
Figure 8 with 1 supplement
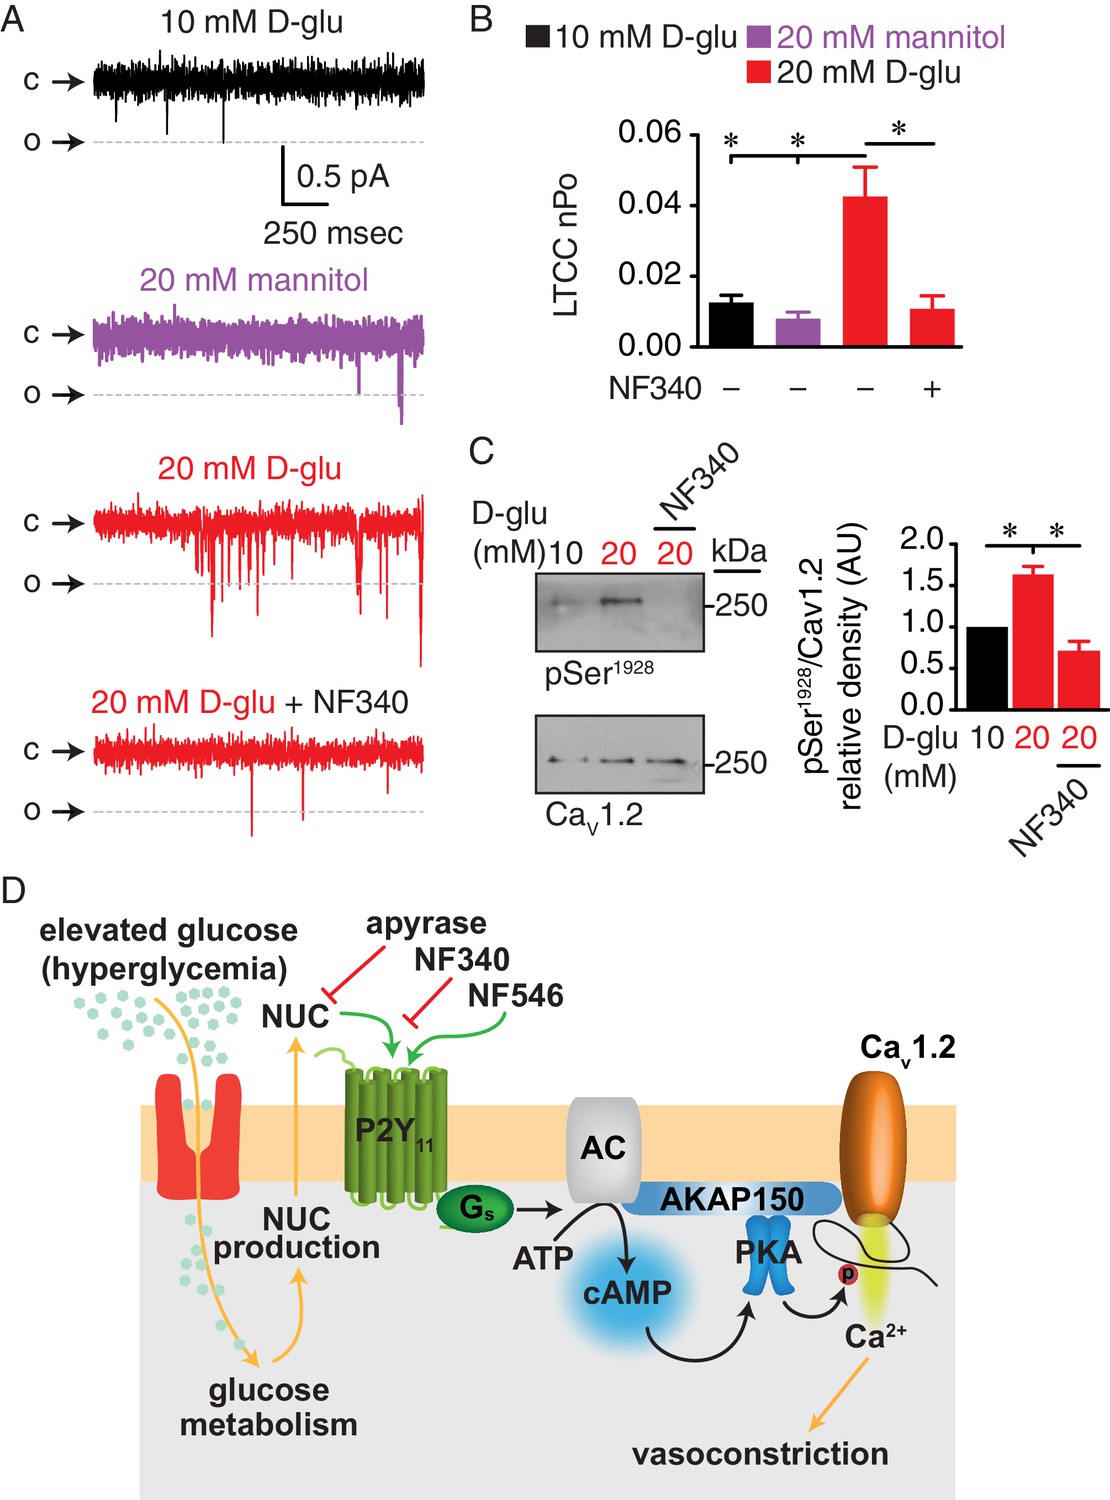
Augmented LTCC activity and Ser1928 phosphorylation in response to chronic extracellular glucose elevations are prevented in the presence of the P2Y11 antagonist NF340.
(A) Representative single LTCC recordings obtained during a 2 s step depolarization from −80 to −30 mV and (B) bar plot of LTCC nPo in arterial myocytes isolated from mouse cerebral arteries incubated for 48 hr in 10 mM D-glucose (n = 10 cells from three mice), 20 mM mannitol (n = 13 cells from four mice), 20 mM D-glucose (n = 10 cells from four mice) and 20 mM D-glucose +10 µM NF340 (n = 10 cells from four mice). Channel openings (o) are represented by downward deflections from baseline (c) (*p<0.05, one-way ANOVA with Tukey post hoc test; Figure 8—source data 1). (C) Representative immunoblot detection of phosphorylated Ser1928 (pSer1928) and total CaV1.2 from mouse cerebral and mesenteric arteries incubated for 48 hr in 10 mM D-glucose, 20 mM D-glucose and 20 mM D-glucose +10 µM NF340 and densitometry quantification of pSer1928/CaV1.2 ratio (n = 7 arterial lysates per condition) (*p<0.05, Kruskal-Wallis with Dunn’s multiple comparisons; Figure 8—source data 2). (D) Proposed model for the role of P2Y11 in PKA-dependent stimulation of LTCC activity and vasoconstriction during diabetic hyperglycemia (NUC = nucleotides).
-
Figure 8—source data 1
Excel spreadsheet containing the individual numeric values of LTCC nPo analyzed in Figure 8B.
- https://doi.org/10.7554/eLife.42214.066
-
Figure 8—source data 2
Excel spreadsheet containing the individual numeric values of pSer1928/CaV1.2 relative density analyzed in Figure 8C.
- https://doi.org/10.7554/eLife.42214.067
Figure 8—figure supplement 1
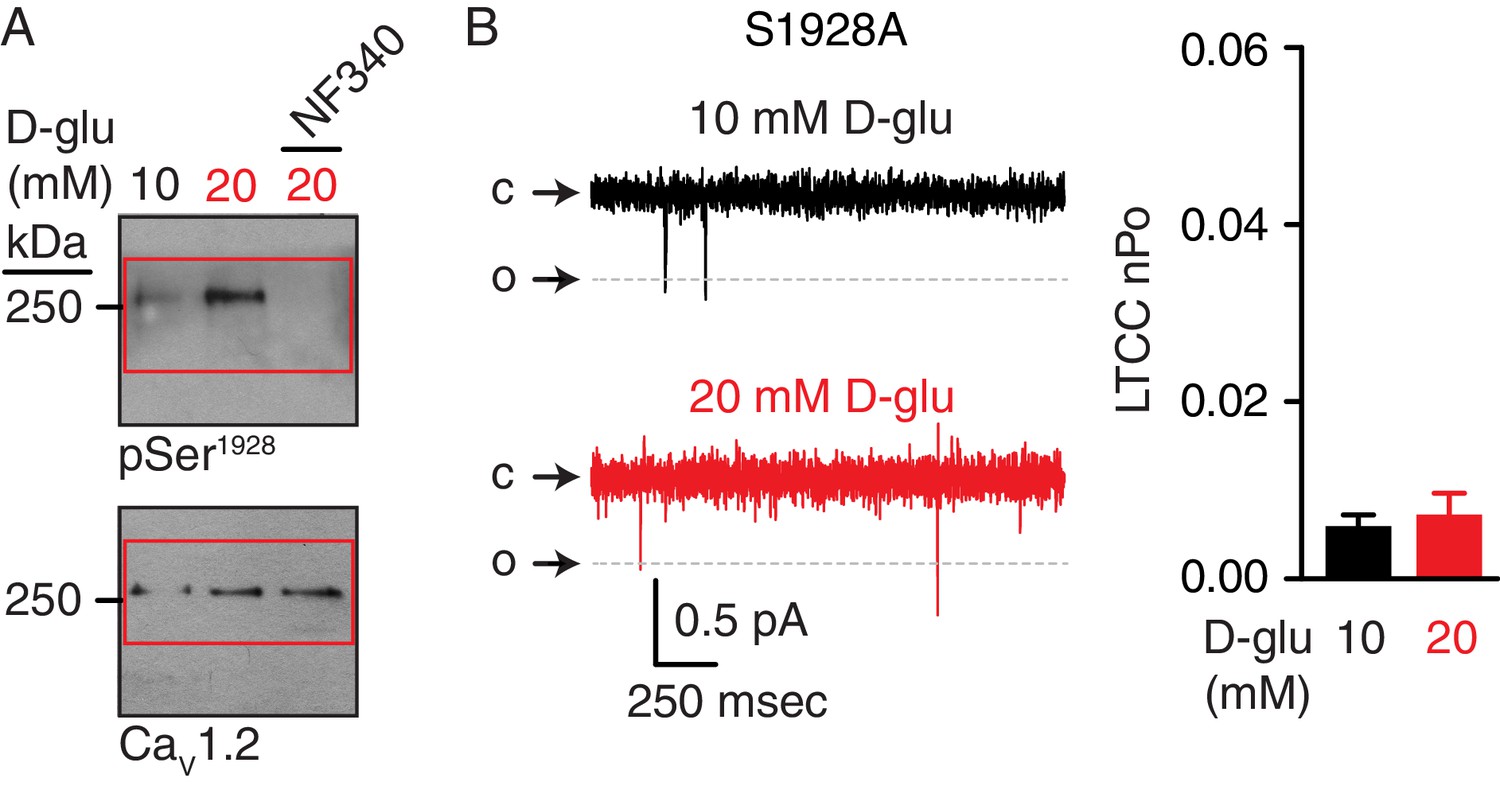
Full-length blots corresponding to data in Figure 8C and unchanged LTCC nPo in response to chronic elevations in extracellular glucose in S1928A arterial myocytes.
(A) Full-length blots corresponding to Figure 8C. Red boxes indicate the crop region displayed in the main figure. (B) Representative single LTCC recordings obtained during a 2 s step depolarization from −80 to −30 mV and bar plot of LTCC nPo in arterial myocytes isolated from S1928A mouse cerebral arteries incubated for 48 hr in 10 mM D-glucose (n = 9 cells from three mice) and 20 mM D-glucose (n = 8 cells from three mice) (Figure 8—figure supplement 1—source data 1). Channel openings (o) are represented by downward deflections from baseline (c). Titles for source data files.
-
Figure 8—figure supplement 1—source data 1
Excel spreadsheet containing the individual numeric values of LTCC nPo analyzed in Figure 8—figure supplement 1B.
Titles for supplementary files.
- https://doi.org/10.7554/eLife.42214.065
Tables
Key resources table
| Reagent type (species) or resource | Designation | Source or reference | Identifiers | Additional information |
|---|---|---|---|---|
| Strain (Mus musculus), C57BL/6J | wild-type | Jackson Laboratories | stock # 000664 | |
| Strain (Mus musculus) | S1928A | (Lemke et al., 2008) | ||
| Cell line (human embryonal kidney) | tsA-201 | Sigma-Aldrich | 96121229 | SV40 transformed |
| Oligodeoxynucleotide, sense | P2Y11 SNS ODN | Integrated DNA Technologies | human P2Y11 sequence (NC_000019.10): 5’-CAACGTCTCGGGTAAGGAGAA-3’ and 5’-ATGAGGAAGGAAACGTGGGT-3’ | last three bases on the 3’ end were phosphoro-thioated |
| Oligodeoxynucleotide, antisense | P2Y11 ANS ODN | Integrated DNA Technologies | human P2Y11 sequence (NC_000019.10): 5’-CAAGGCCACCCTAACCACTG-3’ and 5’-CTCTCCCTTCCCTGCGTTA-3’ | last three bases on the 3’ end were phosphoro-thioated |
| DNA construct | human P2Y11 | UMR cDNA Resource Center | www.cDNA.org; clone ID P2Y1100000 | tagged with GFP at C- terminus |
| Antibody | anti-FP1 (CaV1.2; custom rabbit) | (Davare et al., 2000) | dilutions: 1:100 for immunoblot and PLA; 10 µg/mL for GSD | |
| Antibody | anti-CH3P (pSer1928, custom rabbit) | (Davare et al., 2000) | 1:50-1:100 dilutions | |
| Antibody | anti-β-actin (mouse monoclonal) | Abcam | ab8226 RRID: AB_30637 | 1:1000 dilution |
| Antibody | anti-α-tubulin (mouse monoclonal) | Active Motif | 39527; clone 5-B-1–2 | 1:500 dilution |
| Antibody | anti-P2Y11 (rabbit polyclonal) | Abcam | ab180739 | 1:100-1:200 dilutions |
| Antibody | anti-P2Y11 (goat polyclonal) | Santa Cruz Biotechnology | sc-69588; clone C-18 RRID: AB_21559 | dilutions: 1:100 for stainings (PLA, classical) and 10 µg/mL for GSD |
| Antibody | anti-PKAcatα, β, γ (mouse monoclonal) | Santa Cruz Biotechnology | sc-28315; clone A-2 | 1:200 dilution |
| Antibody | PKAcatα, β, γ blocking peptide | Santa Cruz Biotechnology | sc-28315 P; clone A-2 | 1:20 dilution for 1 µg of primary antibody |
| Antibody | anti-PKAcat α, β, γ (rabbit polyclonal) | Santa Cruz Biotechnology | sc-28892; clone H-95 | dilutions: 1:200 for PLA and 10 µg/mL for GSD |
| Antibody | Alexa Fluor 488 conjugate of wheat germ agglutinin | Life Technologies | W7024 | |
| Antibody | Alexa Fluor 568-conjugated donkey anti-goat | Molecular Probes | A11057 RRID: AB_142581 | 5 mg/mL dilution |
| Antibody | Alexa Fluor 568-conjugated donkey anti-mouse | Molecular Probes | A10037 | 5 mg/mL dilution |
| Antibody | Alexa Fluor 568-conjugated donkey anti-rabbit | Molecular Probes | A11011 RRID: AB_143157 | 2 µg/mL dilution |
| Antibody | Alexa Fluor 647-conjugated donkey anti-goat | Molecular Probes | A21447 RRID: AB_141844 | 2 µg/mL dilution |
| Antibody | goat anti-rabbit IgG (H + L)-horseradish peroxidase conjugate | Bio-Rad | 170–6515 RRID: AB_11125142 | 1:10000 dilution |
| Antibody | goat anti-mouse IgG (H + L)-horseradish peroxidase conjugate | Bio-Rad | 170–6516 | 1:10000 dilution |
| Chemical compound, drug | sodium pentobarbital (Fatal-Plus) | Vortech Pharma-ceuticals | NDC 0298-9373-68 | |
| Chemical compound, drug | mannitol | Fisher Scientific | BP686 | |
| Chemical compound, drug | NF340 | Santa Cruz Biotechnology | sc-361274 | |
| Chemical compound, drug | NF546 | Tocris | 3892 | |
| Chemical compound, drug | apyrase | New England Biolabs | M0398L | |
| Chemical compound, drug | nifedipine | Sigma-Aldrich | N7634 | |
| Chemical compound, drug | Bay K-8644 | Sigma-Aldrich | 71145-03-4 | |
| Chemical compound, drug | forskolin | Sigma-Aldrich | F6886 | |
| Chemical compound, drug | amphotericin B | Sigma-Aldrich | A4888 | |
| Chemical compound, drug | MRS2578 | Santa Cruz Biotechnology | sc-204103A | |
| Chemical compound, drug | MRS2179 | Tocris | 1454889-37-2 | |
| Chemical compound, drug | protein kinase A inhbitor (PKI) | Sigma-Aldrich | P9115 | fragment 14–22, myristoylated trifluoroacetate salt |
| Chemical compound, drug | Rp-Adenosine 3’,5’-cyclic monophos-phorothioate triethylam-monium salt (rpcAMP) | Sigma-Aldrich | A165 | |
| Chemical compound, drug | Adenosine 5’-[γ-thio] triphosphate tetralithium salt (ATPγS) | Sigma-Aldrich | A1388 | |
| Software, algorithm | GraphPad Prism | GraphPad Prism, RRID: SCR_002798 | ||
| Software, algorithm | ImageJ | Fiji, RRID: SCR_002285 | ||
| Software, algorithm | pCLAMP10 | Molecular Devices | electrophysiology | |
| Software, algorithm | LASAF | Leica | GSD | |
| Software, algorithm | IonOptix | IonOptix | arterial diameter recordings | |
| Software, algorithm | Metaflor | Molecular Devices | FRET |
Additional files
-
Supplementary file 1
K+-induced constriction and baseline and passive diameters of arteries from wild type and S1928A mice.
- https://doi.org/10.7554/eLife.42214.068
-
Supplementary file 2
Arterial tone from wild type and S1928A mouse arteries.
- https://doi.org/10.7554/eLife.42214.069
-
Supplementary file 3
Human nondiabetic patients undergoing surgical sleeve gastrectomy.
- https://doi.org/10.7554/eLife.42214.070
-
Transparent reporting form
- https://doi.org/10.7554/eLife.42214.071
Download links
A two-part list of links to download the article, or parts of the article, in various formats.
Downloads (link to download the article as PDF)
Open citations (links to open the citations from this article in various online reference manager services)
Cite this article (links to download the citations from this article in formats compatible with various reference manager tools)
A Gs-coupled purinergic receptor boosts Ca2+ influx and vascular contractility during diabetic hyperglycemia
eLife 8:e42214.
https://doi.org/10.7554/eLife.42214


