Perception in autism does not adhere to Weber’s law
- University of Haifa, Isreal
- University of Haifa, Israel
Figures
Figure 1
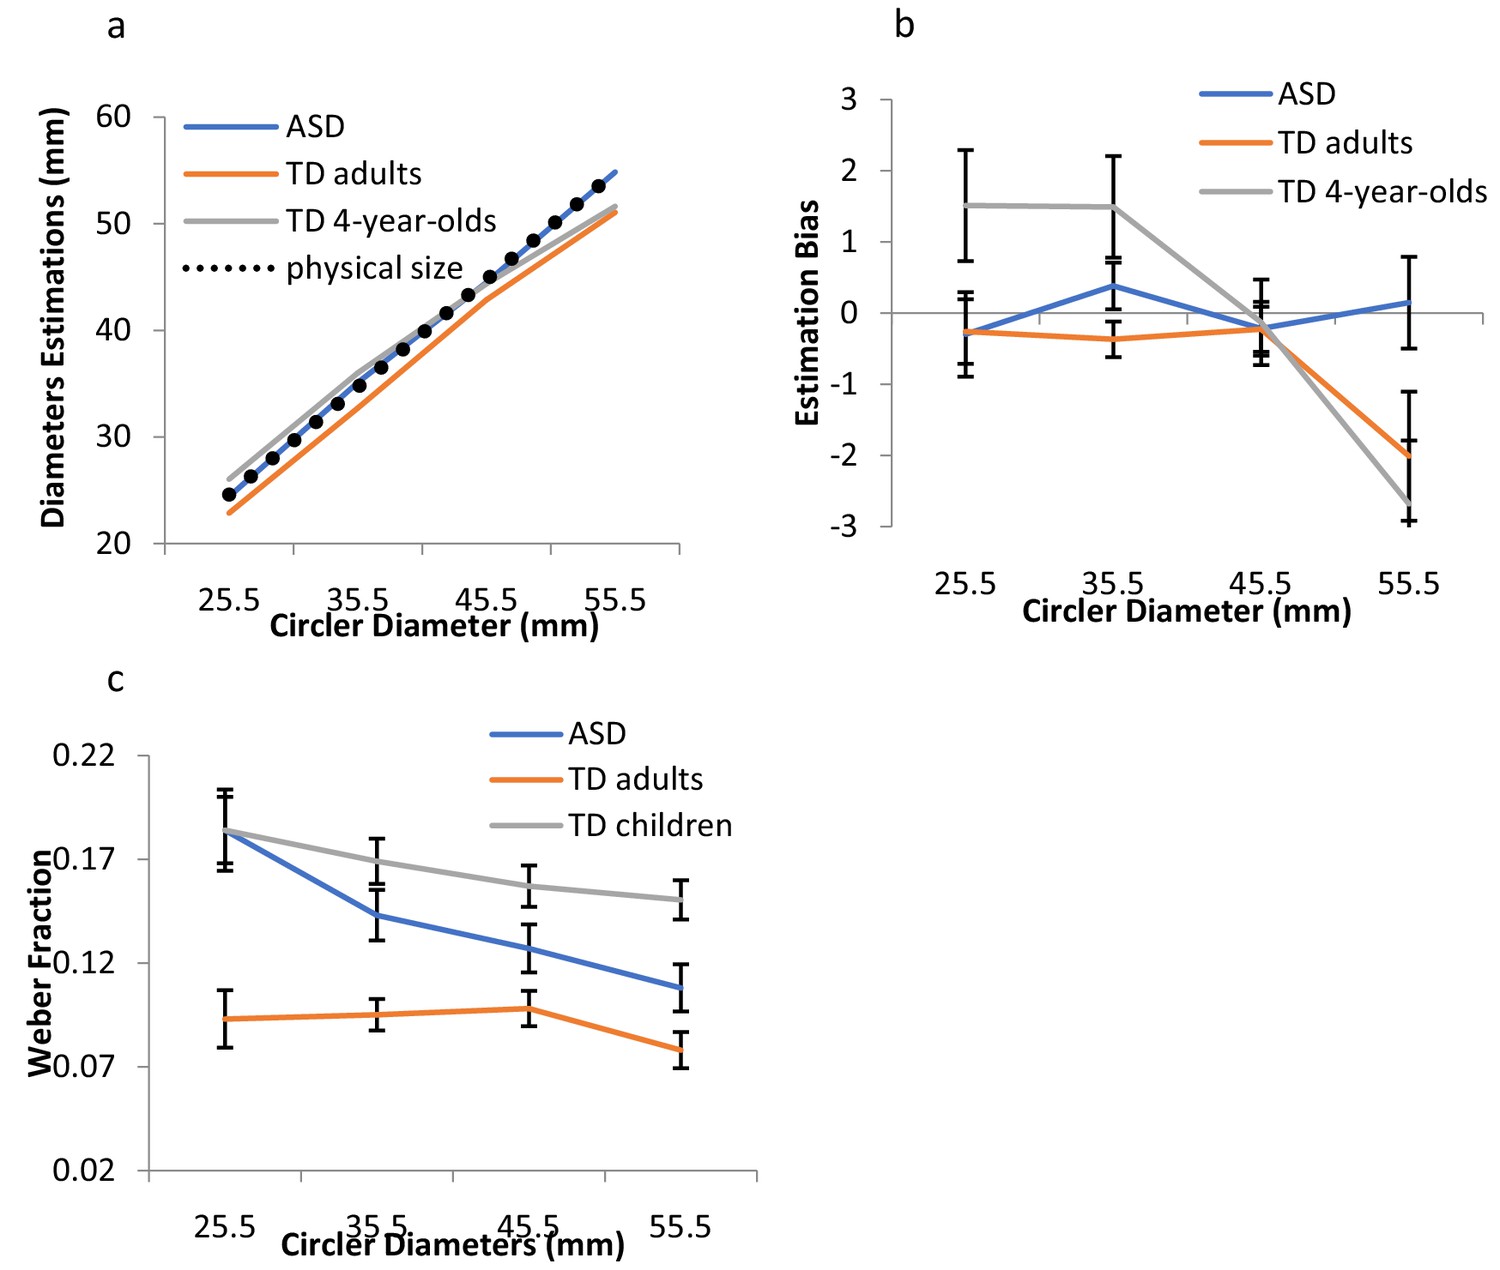
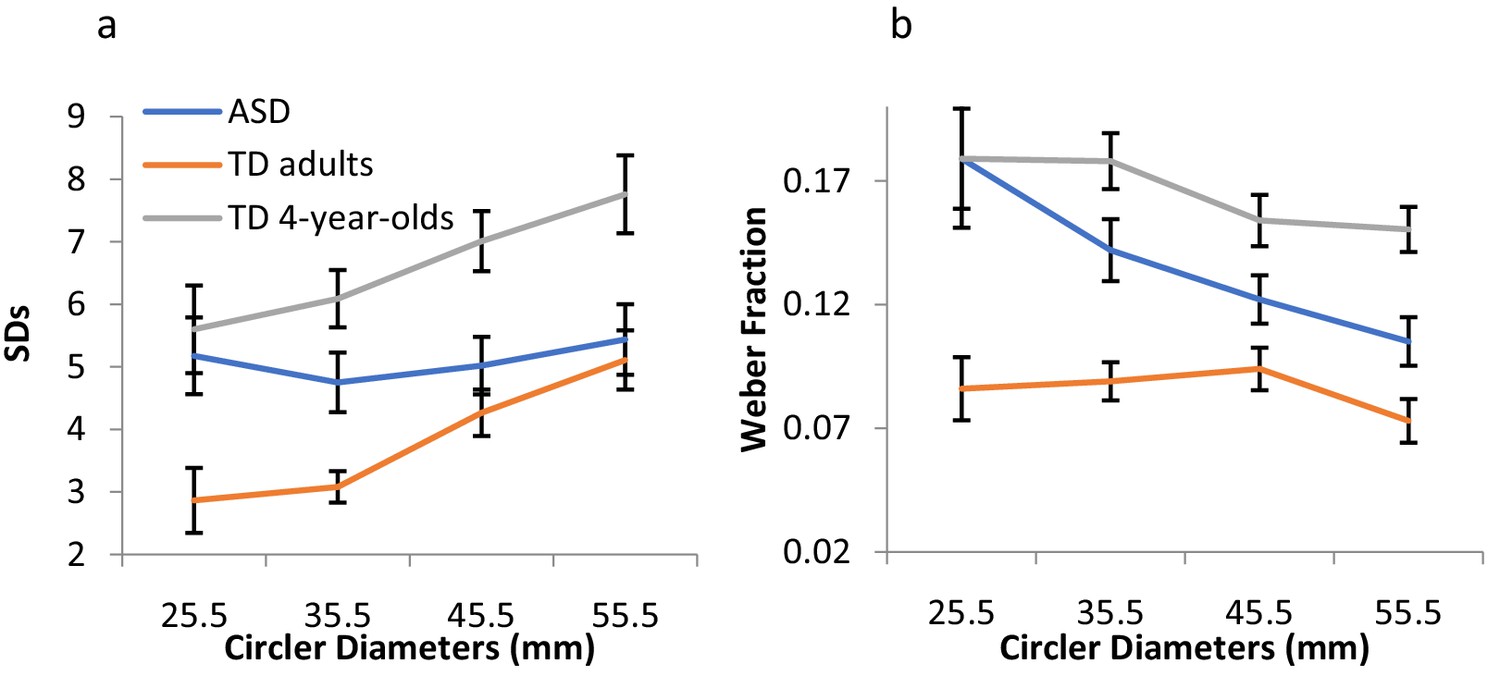
Results for Exp.1.
(a) Mean estimated sizes for the different diameters for ASD individuals, TD adults, and TD children. The black dashed line indicates the real physical size. (b) The mean estimation bias (see text for details) is shown for the three groups. Estimations were biased towards the individual mean of estimations more for TD adults and the typically developing children than for the ASD individuals. (c) Weber’s fractions, computed as the within-subject SDs of estimations divided by the mean estimations for each size, are depicted as a function of the circler diameters, for the two groups. Adherence to Weber was indicated by the constancy of the coefficient of variation, normalized to the perceived magnitude. Weber fractions remained constant across the different sizes, as predicted by Weber, for the TD children and adults, but not for those with ASD. Error bars indicate 95% within-subjects CI.
-
Figure 1—source data 1
Source data for Exp. 1 - Size estimation task.
- https://doi.org/10.7554/eLife.42223.003
Figure 2 with 2 supplements
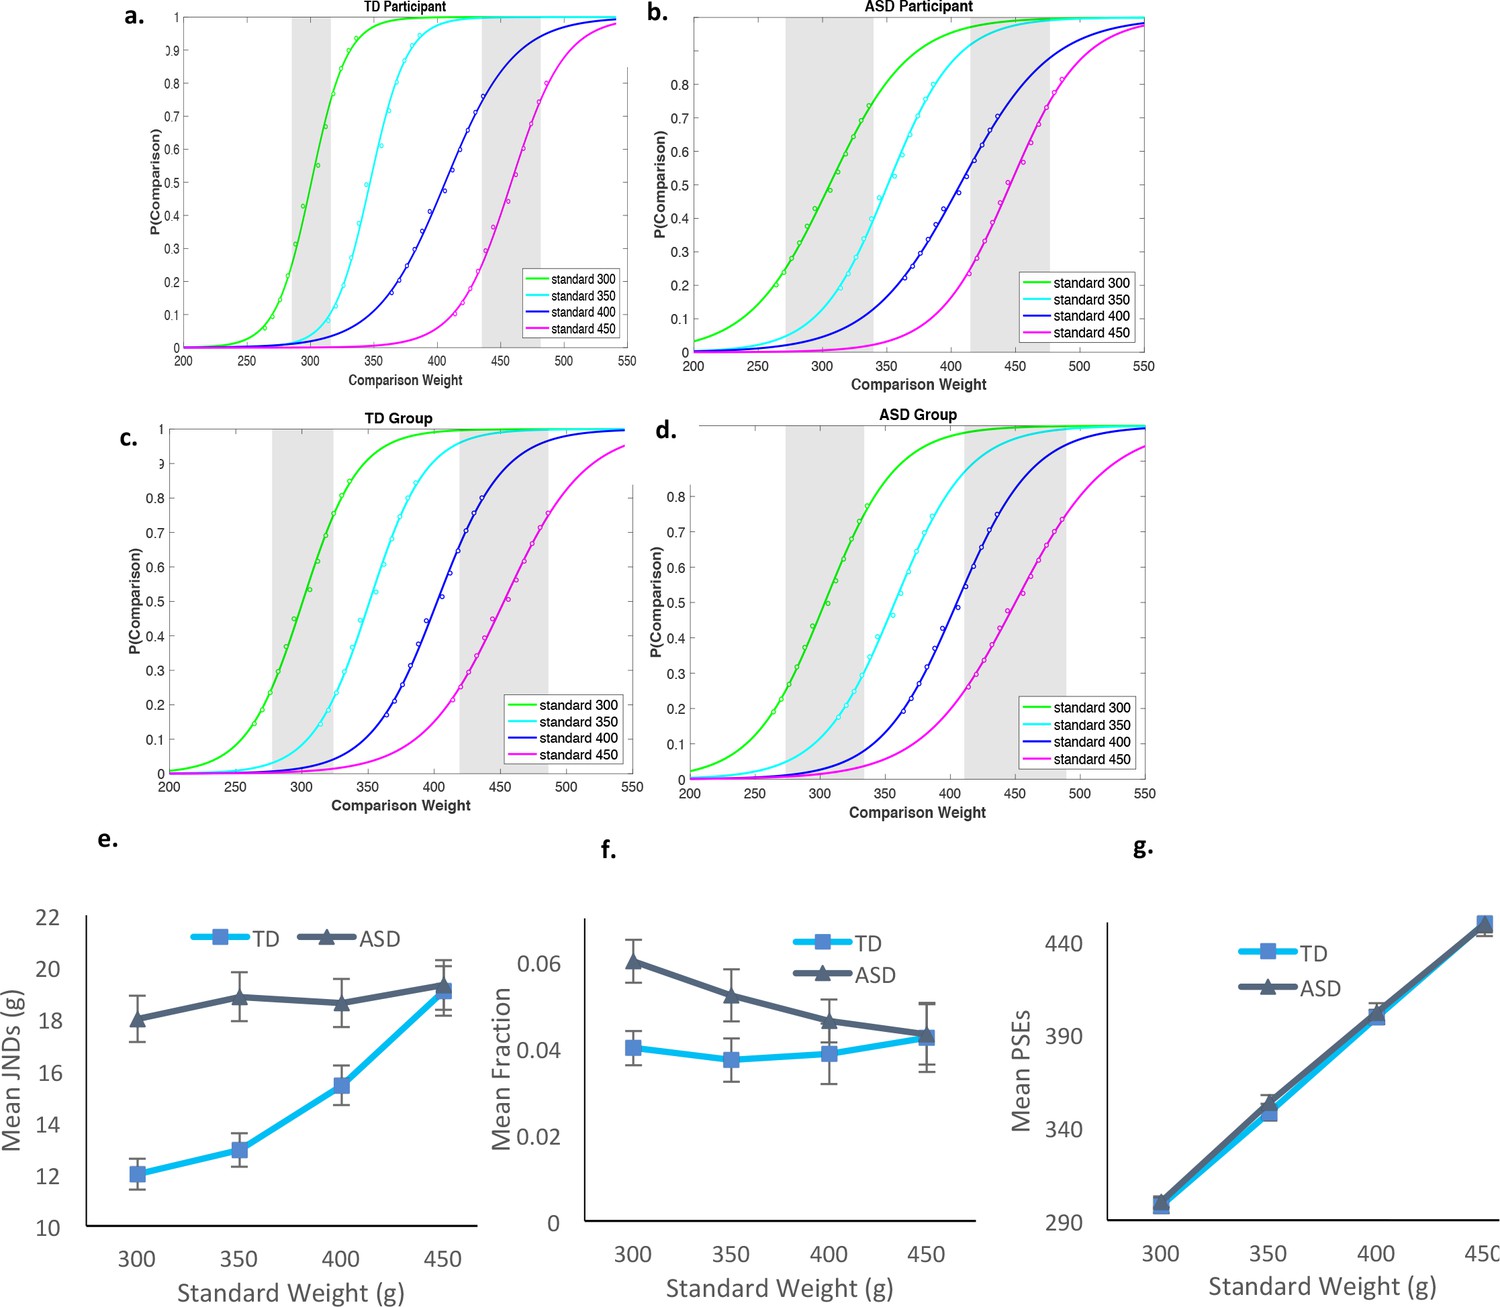
Results for Exp. 2.
Psychometric functions, plotting the proportion of trials in which participants reported the comparison as heavier, as a function of weight of the comparisons. The different functions refer to the four standards. (a) Data for a representative TD participant. (b) Data for a representative individual diagnosed with ASD. (c) All data for the typical group pooled (n = 11). (d) All data for the ASD group pooled (n = 12). The shaded gray areas in each graph signify JNDs for standards of 300 and 450 g. (e) JNDs increased linearly with weight only for the TD group. (f) Weber’s fractions were computed as the ratio of the JNDs to the PSEs (JNDs/PSEs), computed for each weight for each participant. These fractions did not remain constant as a function of weight for ASD, violating Weber. (g) PSEs demonstrated accurate perception in both groups. As in the visual estimation task, TD adults showed a subtle tendency to underestimate the standard weights. Error bars in e-f indicate standard errors.
Figure 2—figure supplement 1

Individual Psychometric functions for the TD group.
https://doi.org/10.7554/eLife.42223.005
Figure 2—figure supplement 2
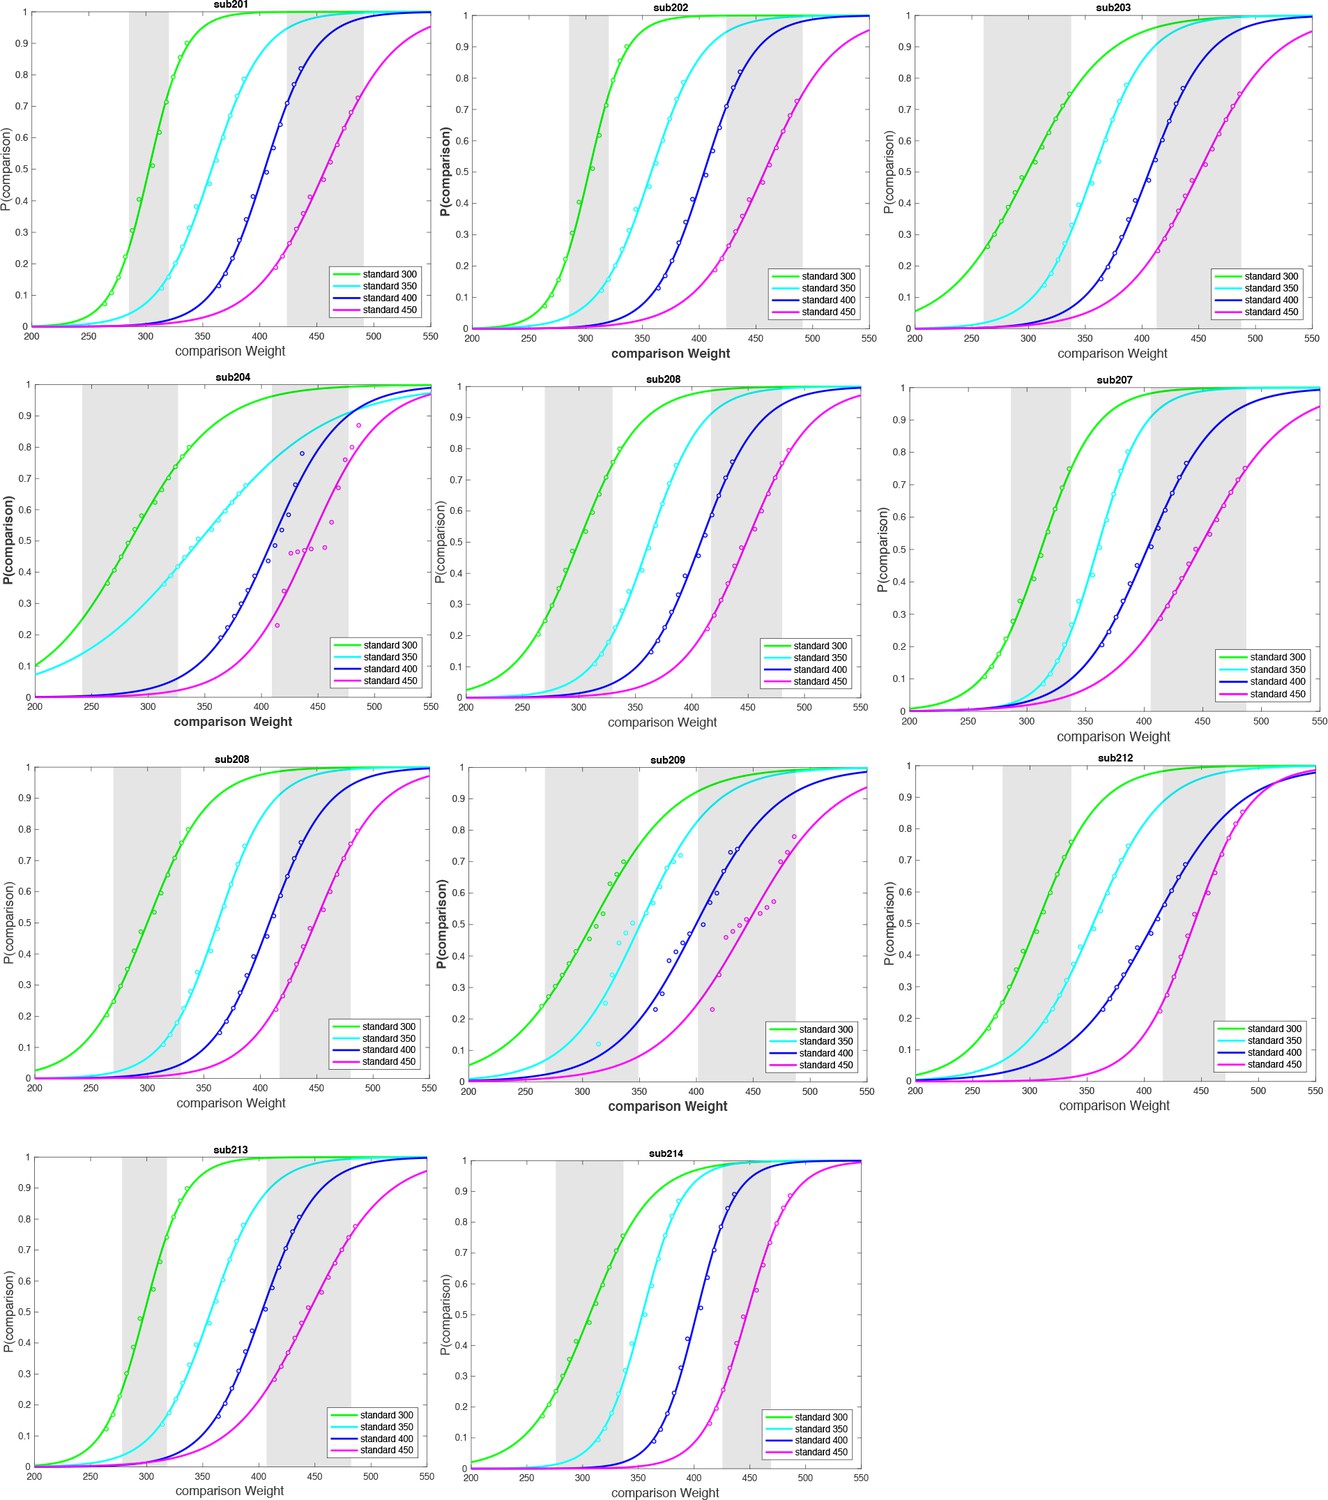
Individual Psychometric functions for the ASD group.
https://doi.org/10.7554/eLife.42223.006
Figure 3
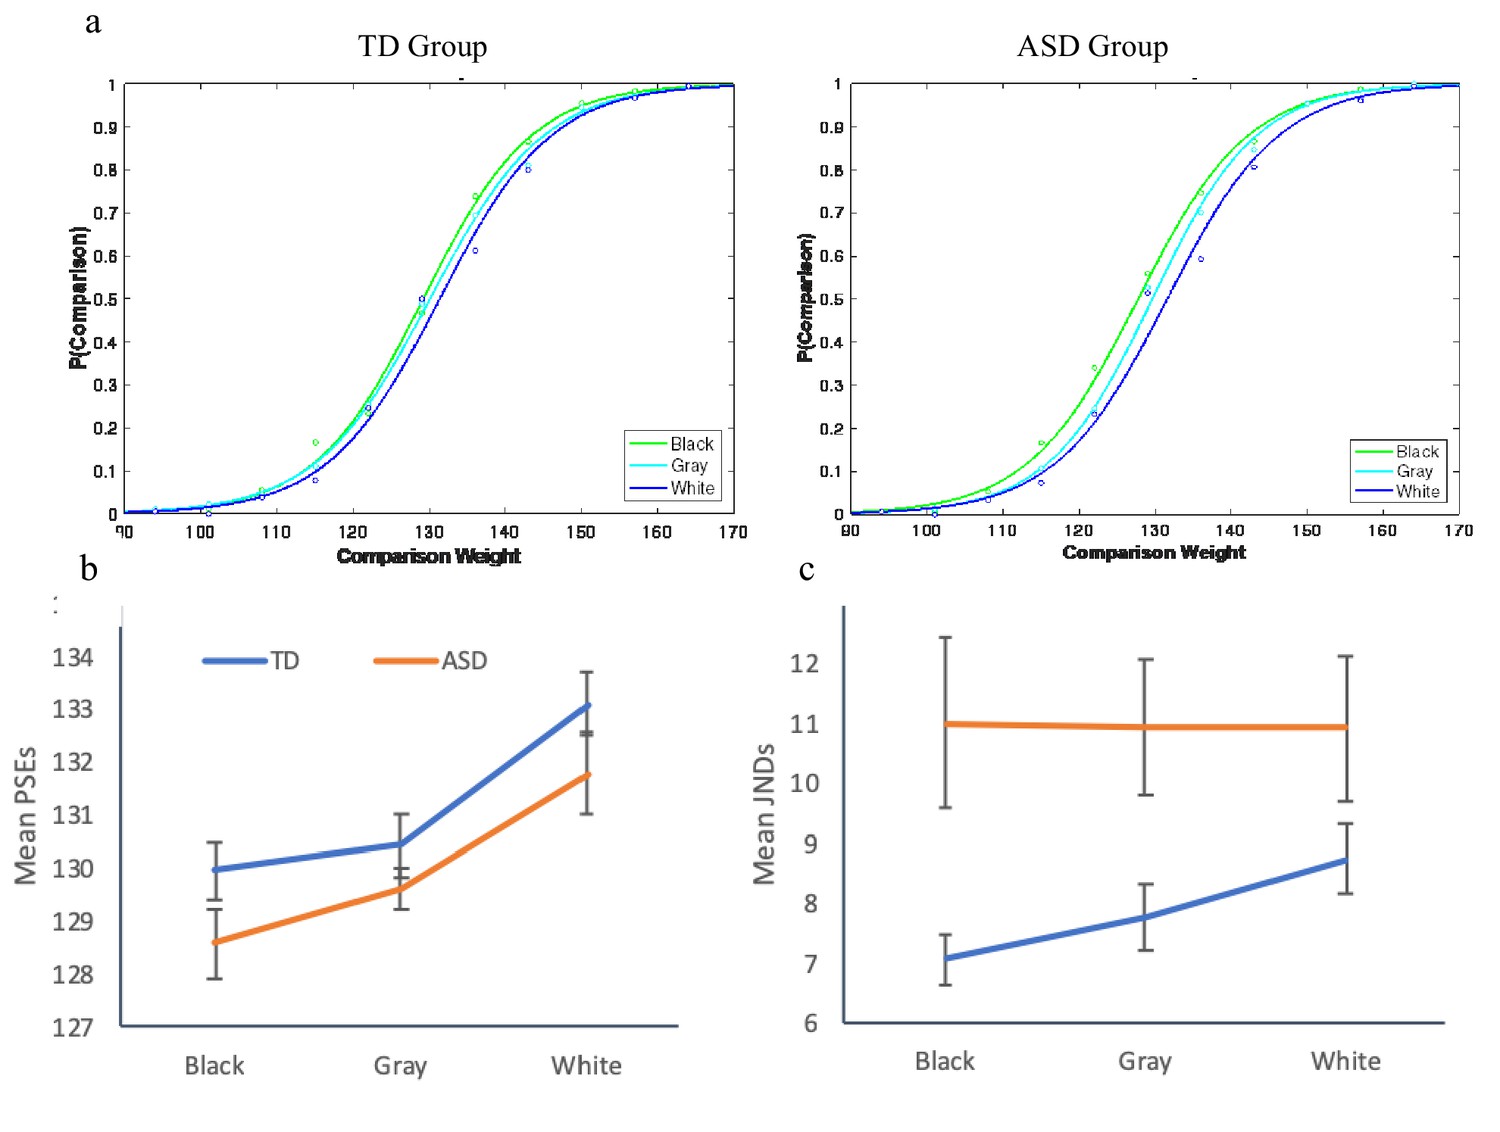
Results for Exp. 3.
(a) Psychometric functions, plotting the proportion of trials for which participants reported the comparison as heavier, as a function of the brightness of the standards. Both groups were affected by the illusion, overestimating the weight of the white standard and underestimating the weight of the black standard. (b) Both groups exhibited larger PSEs for the white standard and smaller PSEs for the black standard, compared to the gray control standard. (c) Only the TD group demonstrated scaling of the JNDs to the perceived weight, in adherence to Weber’s law. Individuals with ASD exhibited constant JNDs across the perceived weights.
Appendix 1—figure 1
Exp. 1 results - raw estimations.
(a) The standard deviations (JNDs) of the raw estimations as a function of the diameters for ASD individuals, TD adults, and TD children. (b) Weber’s fractions, computed as the within-subject SDs of estimations divided by the physical sizes, remained constant across the different sizes, as predicted by Weber, for the TD groups only. Error bars indicate 95% within-subjects CI.
Tables
Table 1
Participants’ details, IQ scores, and AQ scores for Experiment 1
https://doi.org/10.7554/eLife.42223.008| N (Female, Male) | Age (range) | Approx. IQ (range; SD) | AQ (range; SD) | |
|---|---|---|---|---|
| ASD | 26 (8,18) | 21.5 (18–28) | 107.73 (82-125; 15.37) | 23.21 (16-39; 8.16) |
| TD Adults | 20 (12,8) | 26.5 (24–30) | 117.35 (95-120; 8.25) | 16.50 (5-22; 4.80) |
| TD Children | 17 (11,6) | 4.8 (3.9–5.1) | - | - |
Table 2
Participants’ details, IQ scores, and AQ scores for Experiment 2
https://doi.org/10.7554/eLife.42223.009| N (Female, Male) | Age (range) | Approx. IQ (range; SD) | AQ (range; SD) | |
|---|---|---|---|---|
| ASD | 11 (3,8) | 28.3 (23–30) | 105.3 (80–120; 12.56) | 25.32 (13-39; 9.21) |
| TD adults | 12 (4,8) | 23.6 (20–26) | 115.35 (95-120; 7.24) | 14.50 (6-22; 5.20) |
Table 3
Participants’ details, IQ scores, and AQ scores for Experiment 3 (only for participants who were susceptible to the illusion)
https://doi.org/10.7554/eLife.42223.010| N (Female, Male) | Age (range) | Approx. IQ (range; SD) | AQ (range; SD) | |
|---|---|---|---|---|
| ASD | 12 (4,8) | 25.3 (21–28) | 110.3 (85–120; 12.26) | 27.12 (14-39; 9.21) |
| TD adults | 16 (6,10) | 25.6 (19–27) | 112.15 (95-120; 8.24) | 15.50 (7-22; 5.20) |
Additional files
-
Transparent reporting form
- https://doi.org/10.7554/eLife.42223.011
Download links
A two-part list of links to download the article, or parts of the article, in various formats.
Downloads (link to download the article as PDF)
Open citations (links to open the citations from this article in various online reference manager services)
Cite this article (links to download the citations from this article in formats compatible with various reference manager tools)
Perception in autism does not adhere to Weber’s law
eLife 8:e42223.
https://doi.org/10.7554/eLife.42223


