Anterior insular cortex plays a critical role in interoceptive attention
- Beijing Tiantan Hospital, Capital Medical University, China
- China National Clinical Research Center for Neurological Diseases, China
- Capital Normal University, China
- Peking University, China
- The City University of New York, United States
- Icahn School of Medicine at Mount Sinai, United States
- The James J. Peter Veterans Affairs Medical Center, United States
- National Institute on Drug Abuse, United States
Figures
Figure 1 with 2 supplements
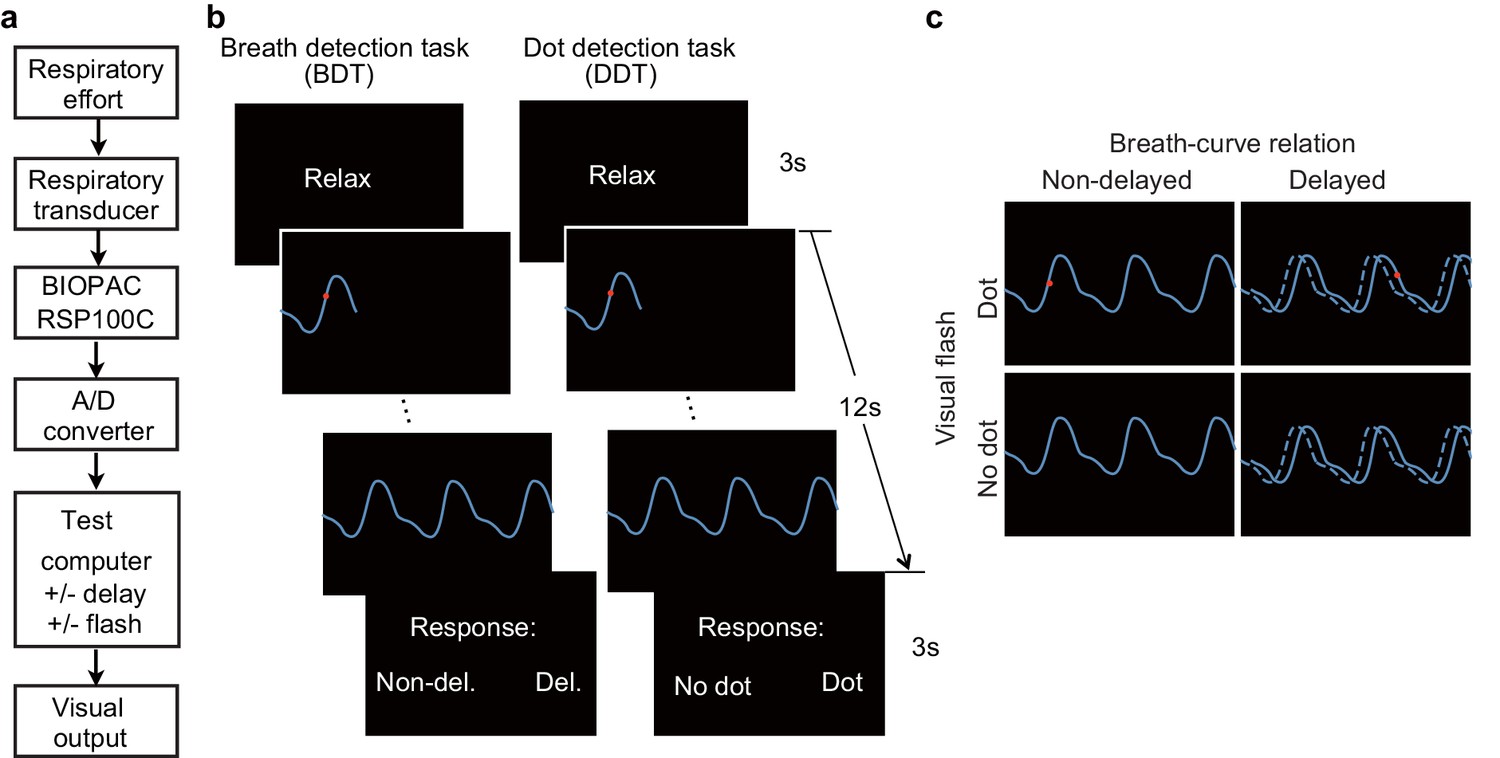
Experimental setup, trial structure of the tasks, and stimulus conditions.
(a) The respiratory effort is converted into electronic signal changes using a respiratory transducer, amplified by BIOPAC, digitized using an A/D converter, and sent to the test computer for the final visual display as a dynamic breath curve, with or without a 400 ms delay. (b) This panel shows two trials for the breath detection task (BDT) and flash dot detection task (DDT) runs, respectively. Each trial begins with a 3 s blank display, followed by a 12 s display of respiratory curve presented with or without a 400 ms delay and with or without a 30 ms red dot flashed at a random position on the curve, and ends with a 3 s response window during which participants make a forced-choice button-press response to two alternative choices depending on the block type (BDT or DDT) to indicate whether the feedback curve is synchronous or delayed (for the BDT run) or whether a dot has appeared (for the DDT run). (c) The task represents a 2 × 2 × 2 factorial design with the factors of attention to breath or dot (block design), presence or absence of breath curve delay, and presence or absence of a dot flashed. The dashed line represents the actual breath curve, while the solid line represents the feedback breath curve displayed on the screen.
Figure 1—figure supplement 1

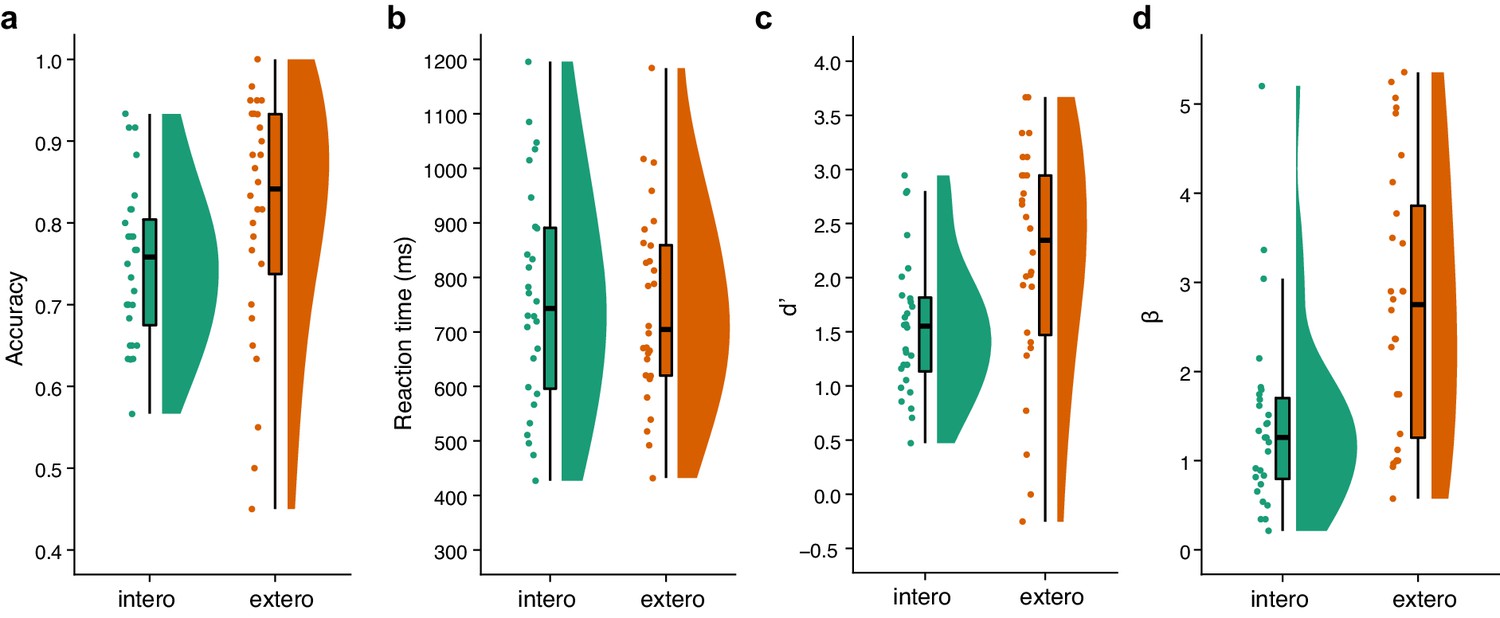
Raincloud plots visualizing the five-number summary (minimum, lower quartile, median, upper quartile, and maximum) for (a) accuracy, (b) reaction time, (c) d’, and (d) β for the BDT and DDT tasks in the first sample of the fMRI study.
https://doi.org/10.7554/eLife.42265.003-
Figure 1—figure supplement 1—source data 1
Behavioral data for the first sample of the fMRI study.
- https://doi.org/10.7554/eLife.42265.004
Figure 1—figure supplement 2
Raincloud plots visualizing the five-number summary (minimum, lower quartile, median, upper quartile, and maximum) for (a) accuracy, (b) reaction time, (c) d’, and (d) β for the BDT and DDT tasks in the second sample of the fMRI study.
https://doi.org/10.7554/eLife.42265.005-
Figure 1—figure supplement 2—source data 1
Behavioral data for the second sample of the fMRI study.
- https://doi.org/10.7554/eLife.42265.006
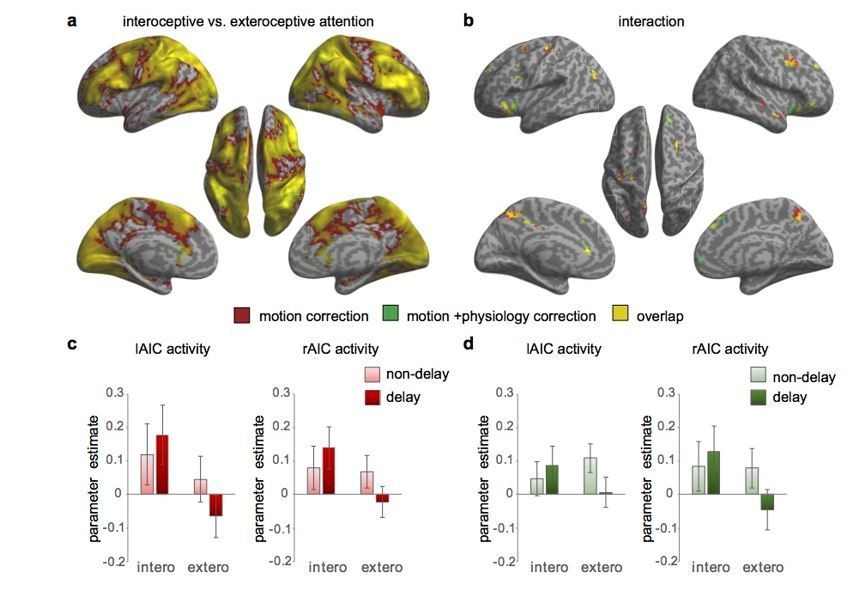
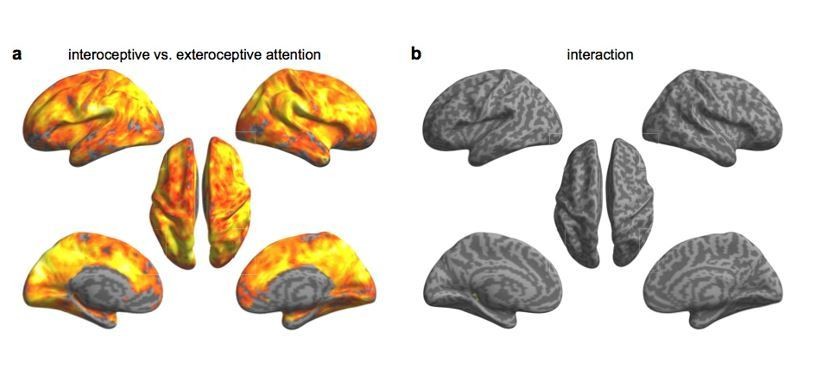
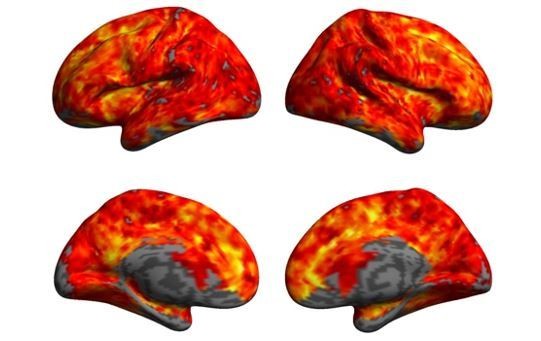
Figure 2
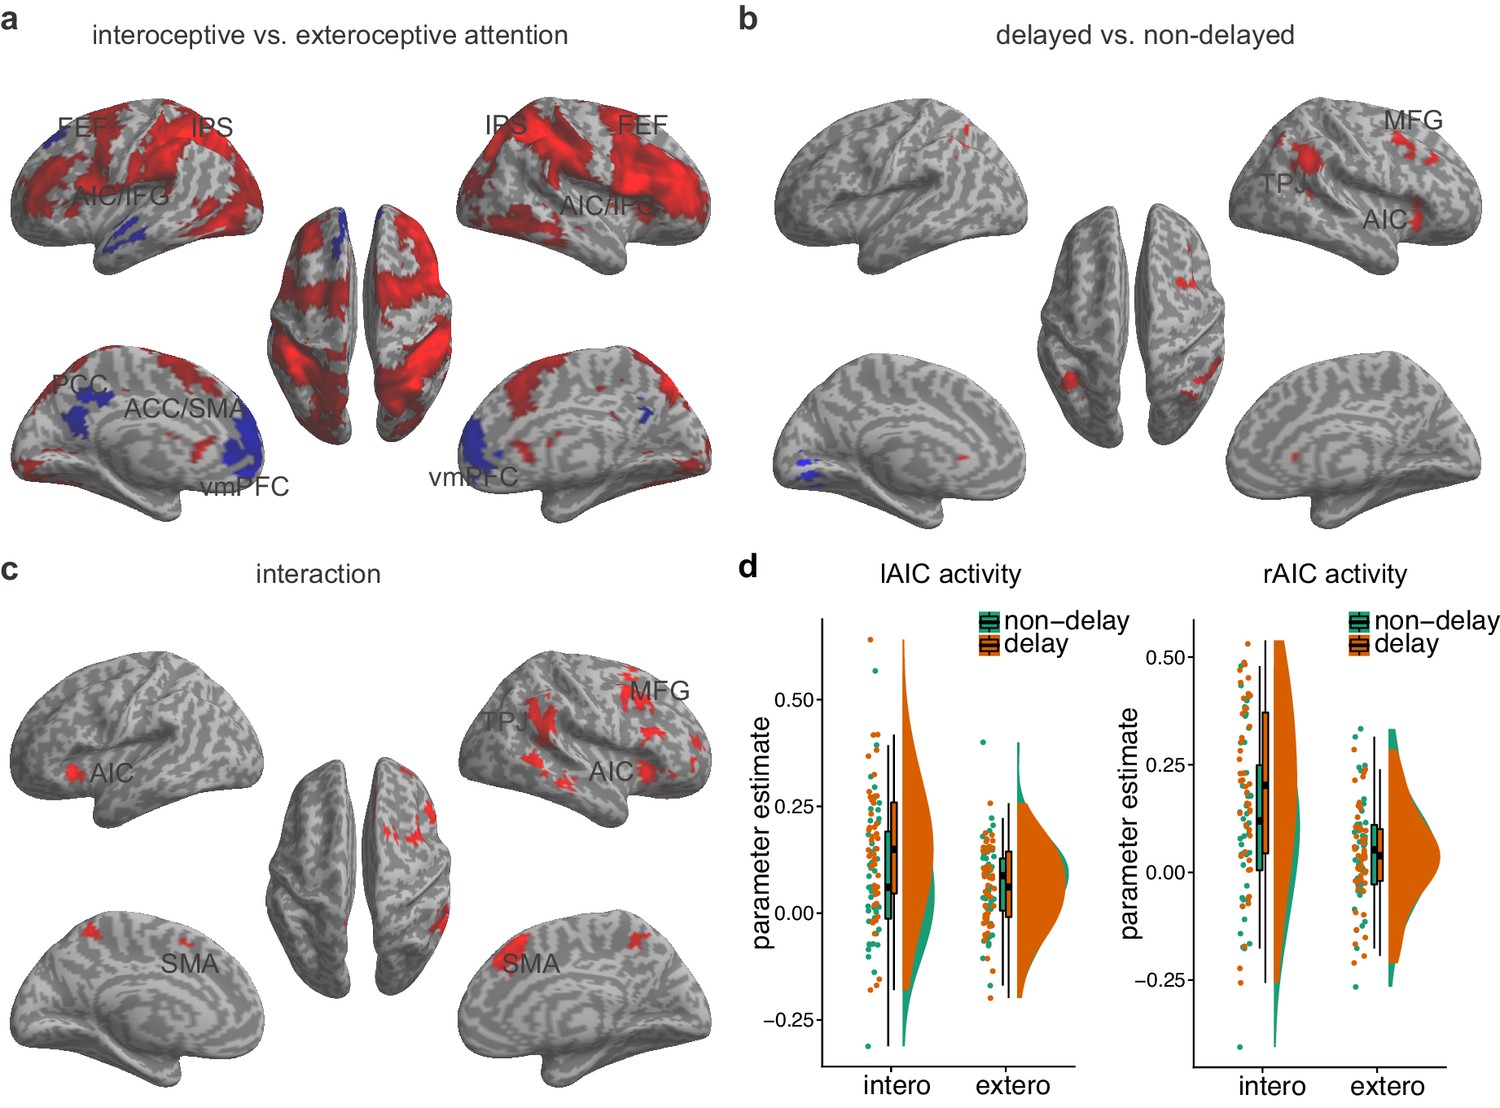
Main effects and the interaction effect of the whole brain analysis of the first sample.
(a) Main effect of interoceptive vs. exteroceptive attention contrast (BDT vs. DDT). (b) Main effect of breath curve feedback condition (delayed curve vs. non-delayed curve). (c) Interaction between attention type and breath-curve feedback condition ([delayed – non-delayed] BDT – [delayed – non-delayed] DDT). Here we showed the left AIC for the visualization of the seed for the ROI analysis in the second fMRI sample, although the cluster with 210 voxels did not survive GRF correction. Red color represents an increased activation; Blue color represents a decreased activation. (d) Activation of the left and the right AIC under the four task conditions, and the pattern of the interaction.
-
Figure 2—source data 1
CSV file containing data for Figure 2d.
- https://doi.org/10.7554/eLife.42265.011
Figure 3
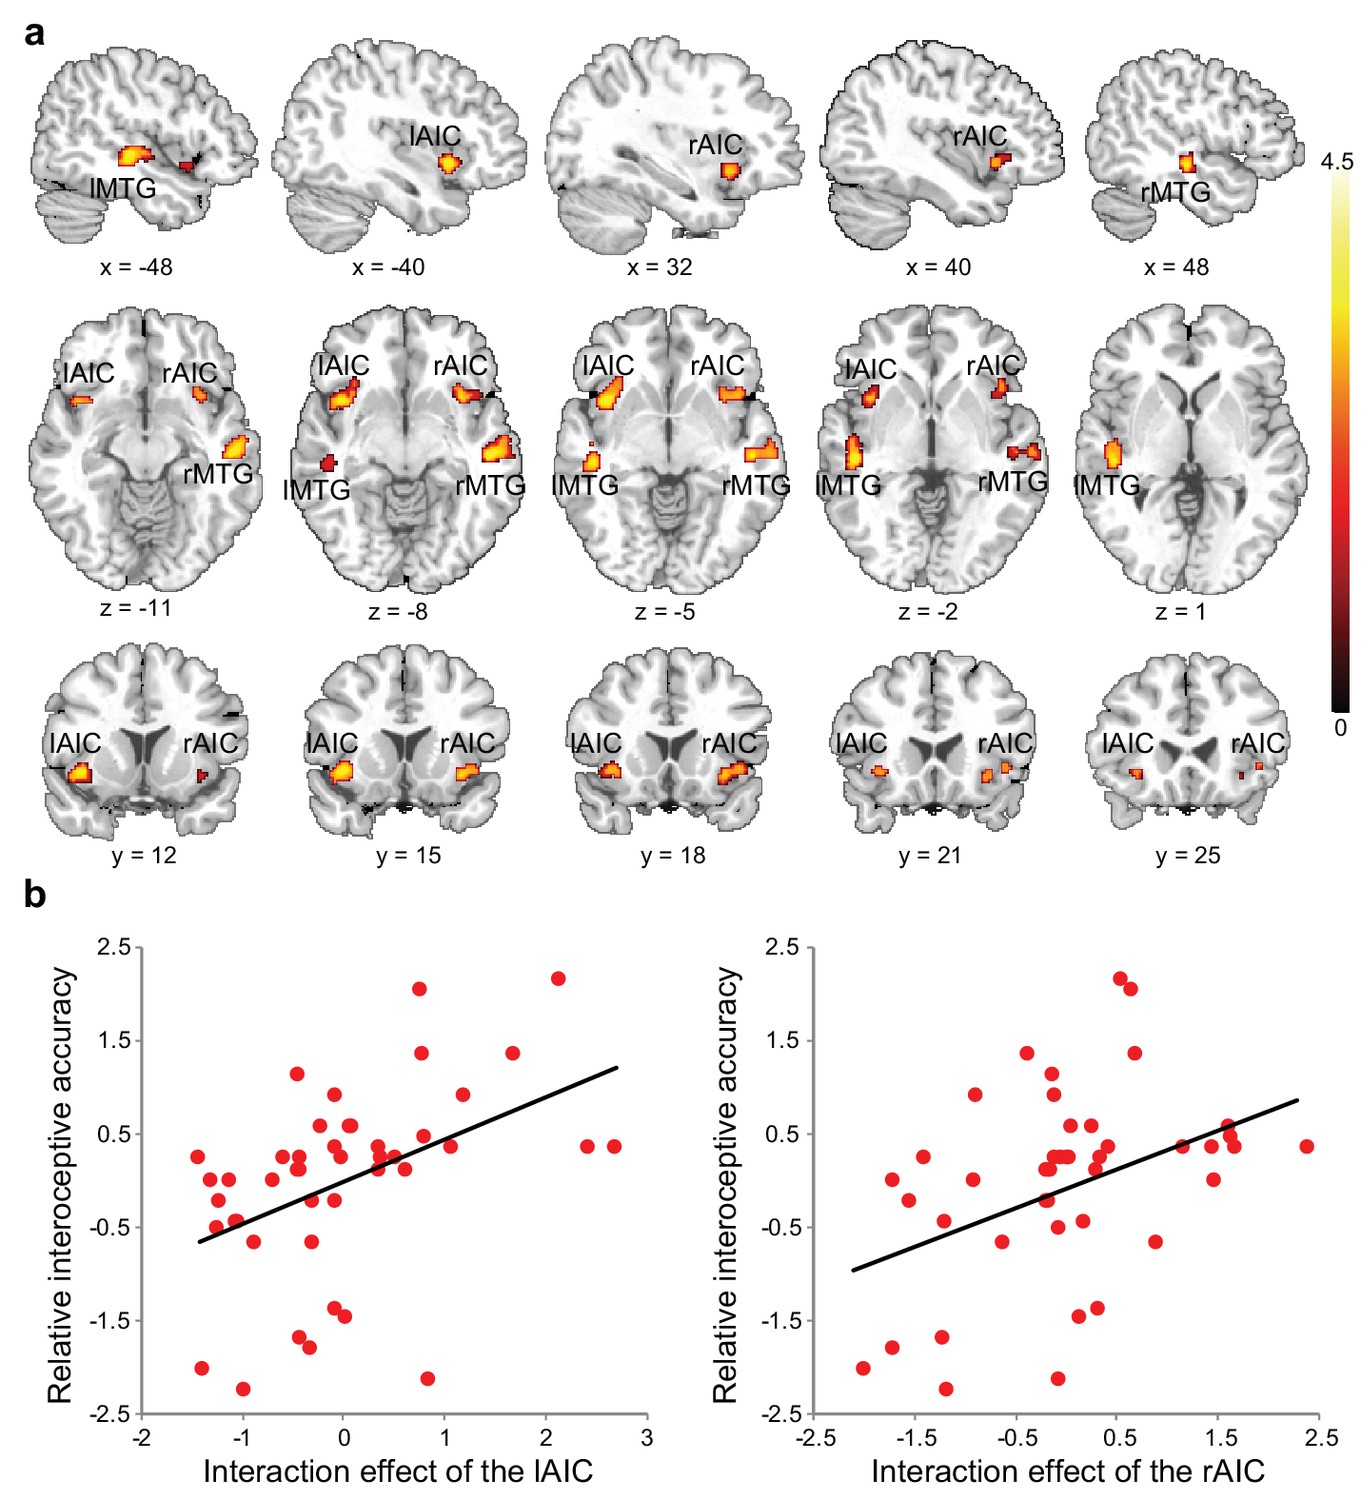
Relationship between brain activation and behavioral performance across participants.
(a) This was revealed in a regression analysis of contrast images for the interaction between interoceptive attention deployment (BDT vs. DDT) and breath curve feedback condition (delayed vs. no-delayed), with performance accuracy on interoceptive and exteroceptive tasks as regressor-of-interest and covariate, respectively. AIC, anterior insular cortex; MTG, middle temporal gyrus. (b) Correlational patterns between the interaction effect of bilateral AIC activation and relative interoceptive accuracy. Data were normalized as z-scores.
-
Figure 3—source data 1
CSV file containing data for Figure 3b.
- https://doi.org/10.7554/eLife.42265.016
Figure 4 with 2 supplements
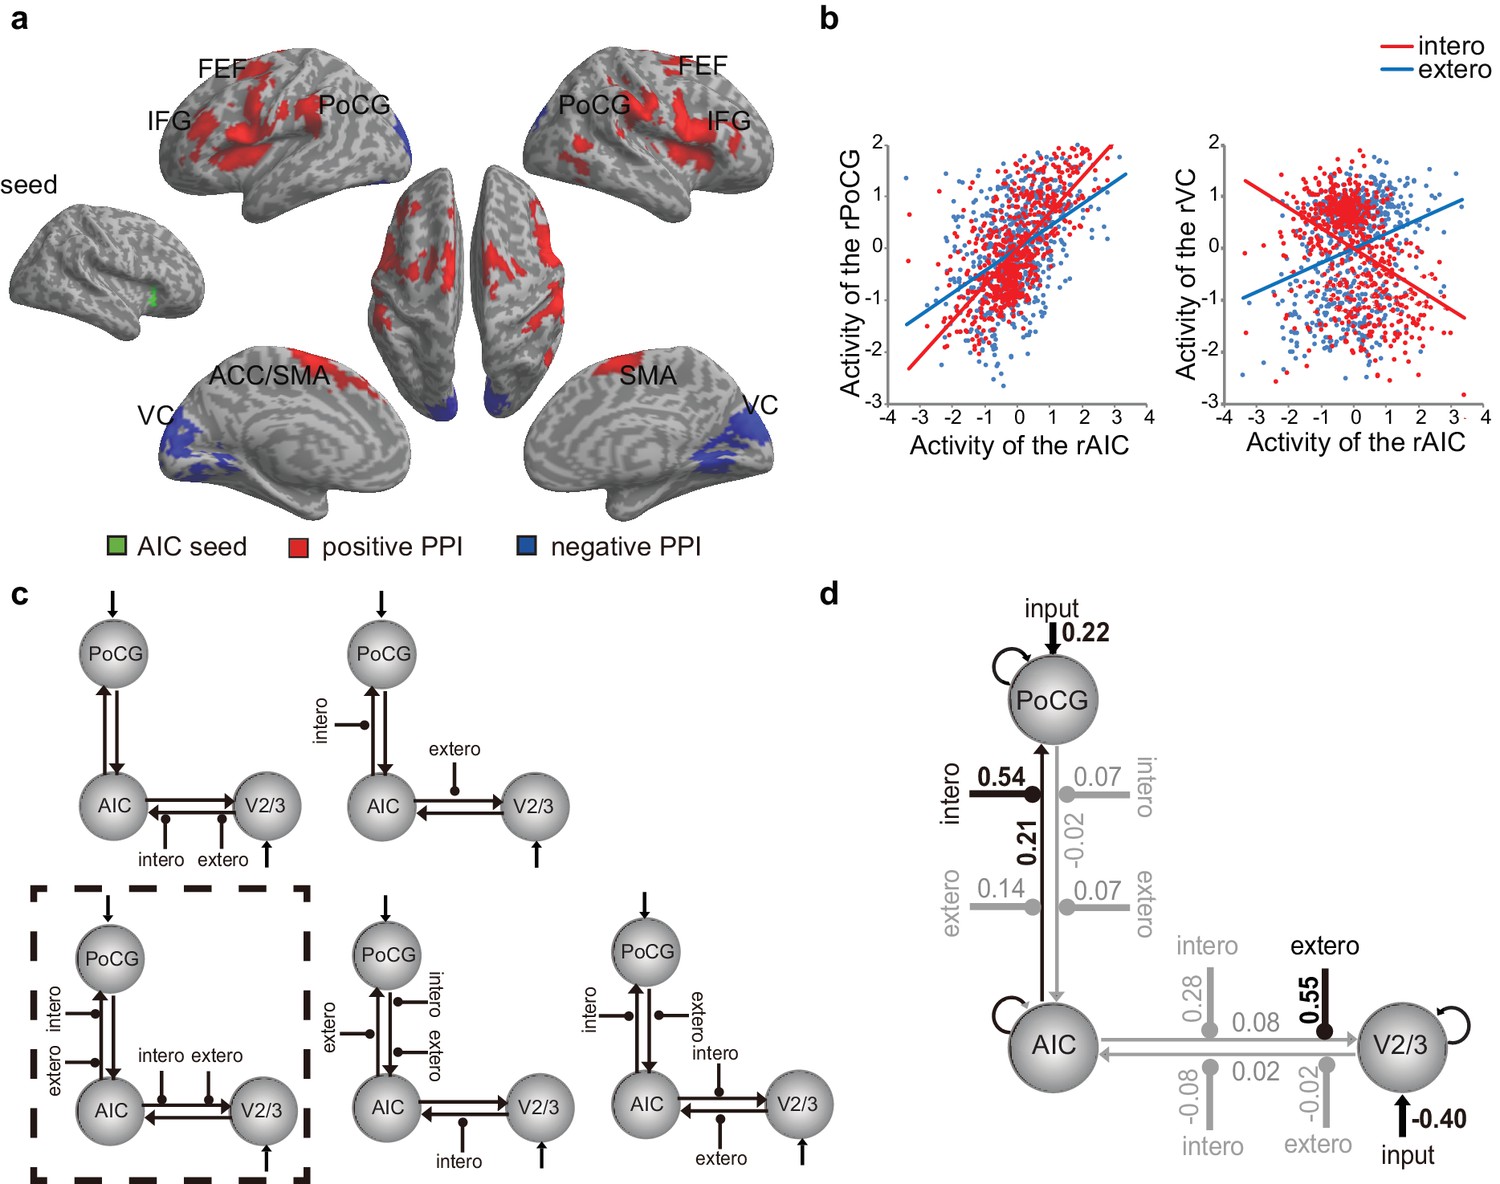
PPI and DCM results of the first fMRI sample.
(a) Regions showing positive (red) and negative (blue) associations with AIC activation modulated by interoceptive attention relative to exteroceptive attention (BDT vs. DDT). (b) An increase in activation in the right AIC was associated with an increase in activation in the postcentral gyrus (PoCG) and a decrease in activation in the visual cortex (VC, V2/3) under the condition of interoceptive attention compared with exteroceptive attention. (c) Five base models generated by specifying possible modulations of interoceptive and exteroceptive attention (BDT and DDT) on the four endogenous connections between ROIs. The model surrounded by a rectangle in dashed-line indicates the winning model out of 52 variant models revealed by random-effects Bayesian model selection (BMS). (d) Intrinsic efferent connection from the AIC to the PoCG was significant. The modulatory effect of interoceptive attention (BDT) on the connection from the AIC to the PoCG was significant. The modulatory effect of exteroceptive attention (DDT) on the connection from AIC to V2/3 was significant (uncorrected).
-
Figure 4—source data 1
CSV file containing data for Figure 4b.
- https://doi.org/10.7554/eLife.42265.021
Figure 4—figure supplement 1
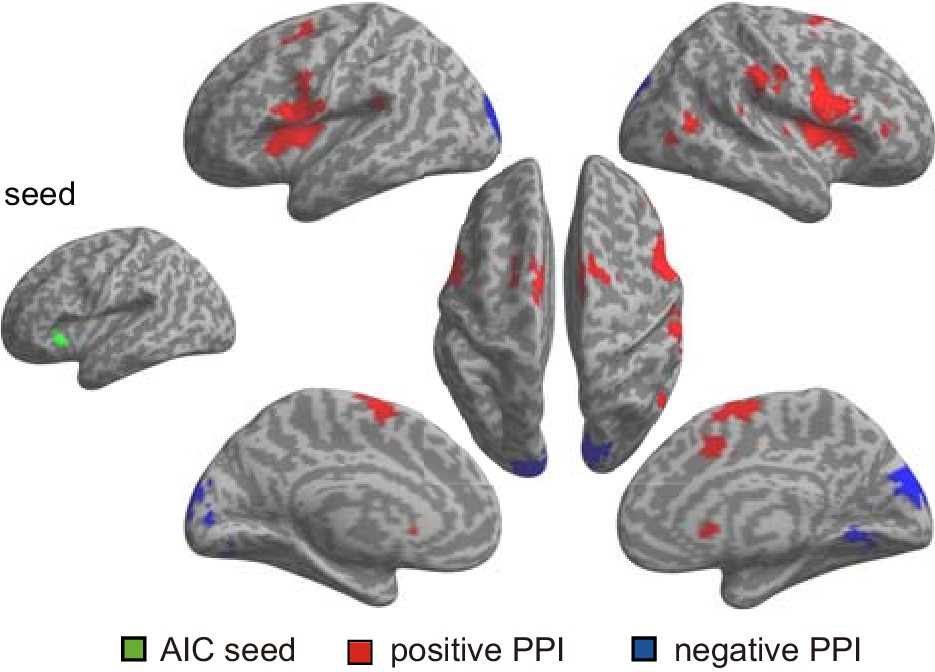
Regions showed positive (red) and negative (blue) association with the left AIC (as the seed) modulated by interoceptive attention relative to exteroceptive attention (BDT vs DDT) for the first fMRI sample.
https://doi.org/10.7554/eLife.42265.019
Figure 4—figure supplement 2
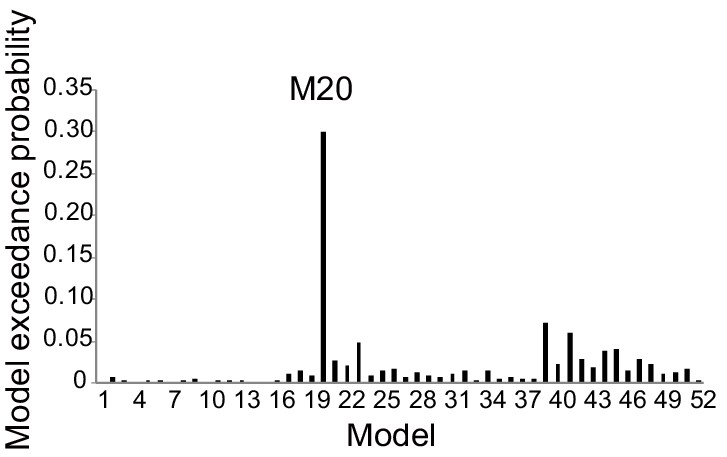
Exceedance probability of RFX BMS for the first fMRI sample.
Across all 52 models, M20 outperformed the other models and thus was identified as the optimal model. M20 denotes the model with the modulatory effects of interoceptive and exteroceptive attention (BDT and DDT) exerting on the connection from the AIC to the PoCG and to the V2/3.
Figure 5 with 3 supplements

ROI results of the second fMRI sample.
(a) ROI analysis of the parameter estimates of the left and the right AIC under the four experimental conditions. Raincloud plots were used for visualization. (b) Correlation between the interaction effect of bilateral AIC and relative interoceptive accuracy. The values of the variable in b were normalized as z-scores.
-
Figure 5—source data 1
CSV file containing data for Figure 5b.
- https://doi.org/10.7554/eLife.42265.027
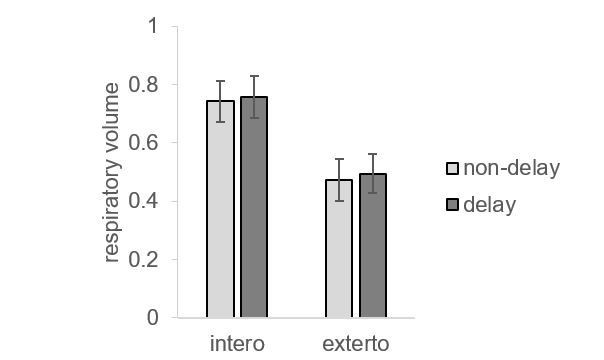
Figure 5—figure supplement 1
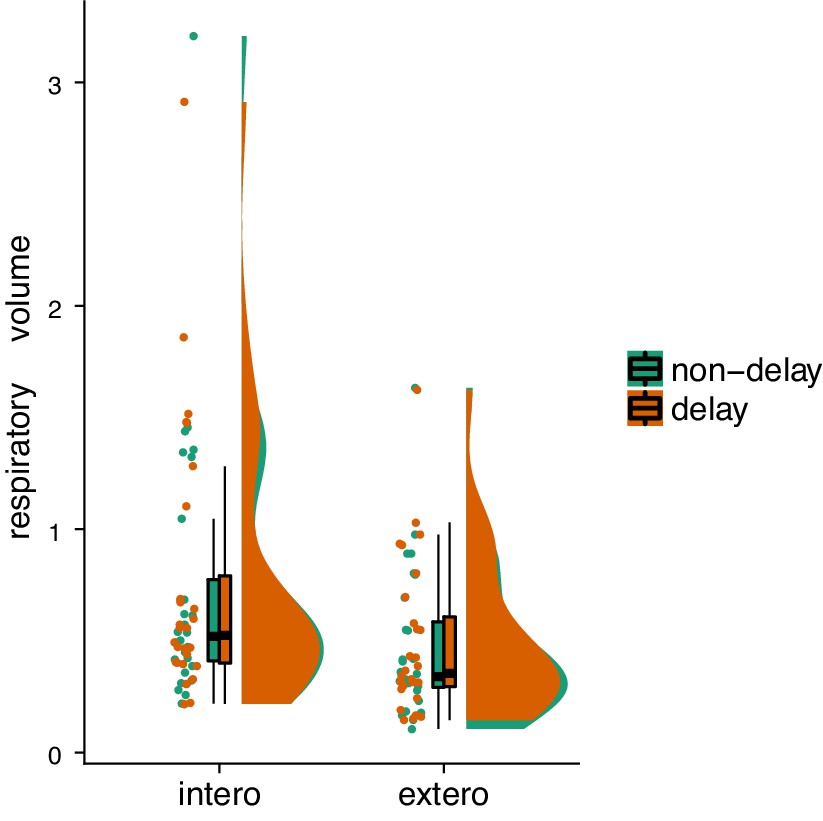
Raincloud plot visualization of respiratory volumes under the four experimental conditions from the second fMRI sample.
https://doi.org/10.7554/eLife.42265.024-
Figure 5—figure supplement 1—source data 1
CSV file containing data for Figure 5—figure supplement 1.
- https://doi.org/10.7554/eLife.42265.029
Figure 5—figure supplement 2
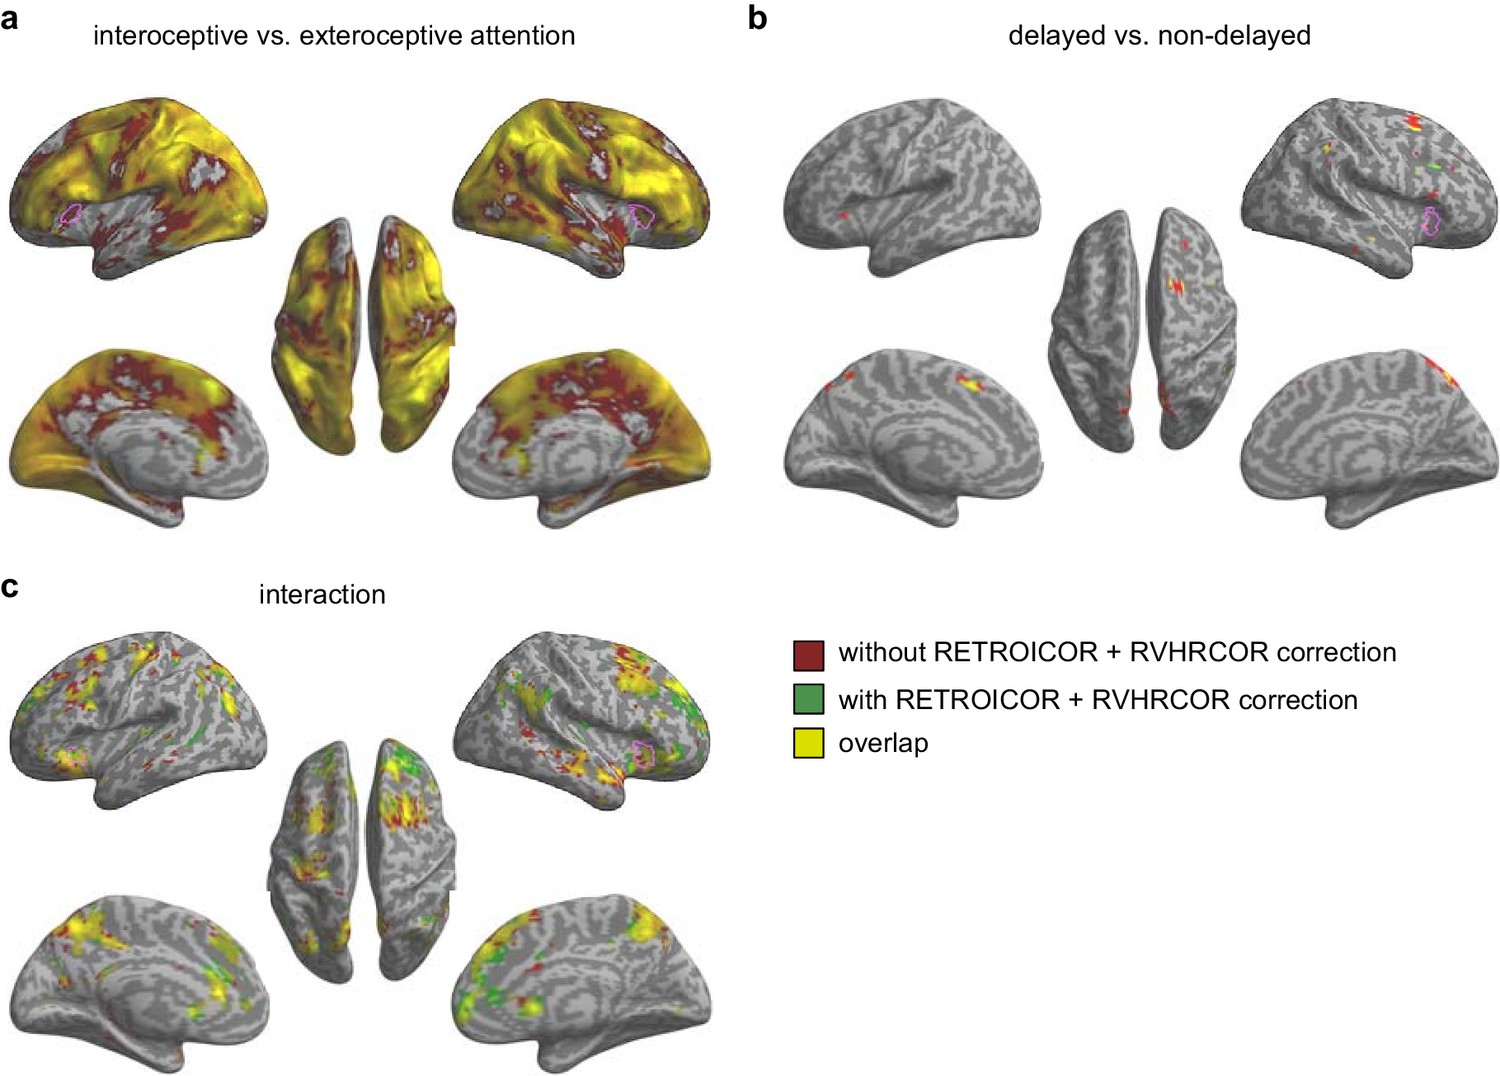
Activation maps without and with RETROICOR +RVHRCOR correction for the second fMRI sample.
(a) Main effect of interoceptive vs. exteroceptive attention (BDT vs. DDT). (b) Main effect of breath curve feedback condition (delayed vs. non-delayed). (c) Interaction between attention type and breath-curve feedback condition ([delayed – non-delayed] BDT – [delayed – non-delayed] DDT). Pink purple contours indicate corresponding activation in the first sample. We used an extremely liberal threshold of voxelwise p<0.05 for visualization.
Figure 5—figure supplement 3
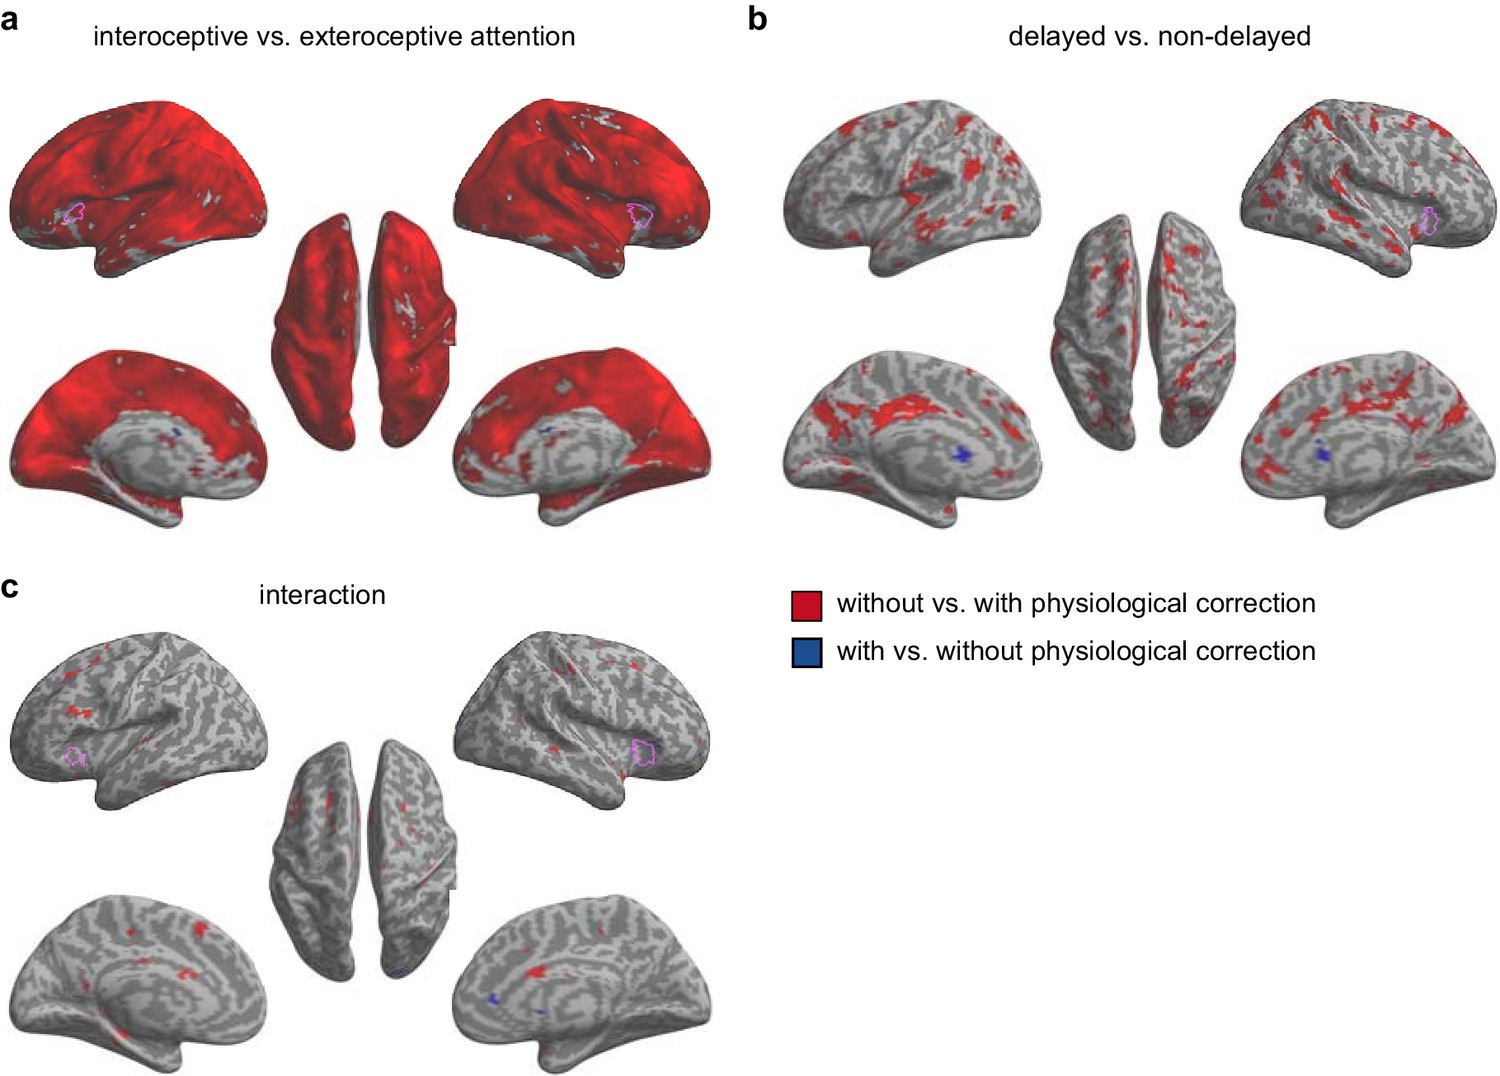
Paired t-test of beta maps obtained without and with RETROICOR + RVHRCOR correction for the second fMRI sample.
The difference of the signals of the AIC between the analyses with and without physiological corrections was only evident under the main effect of interoceptive vs. exteroceptive attention (BDT vs. DDT), but not under the interaction contrast, confirming that the interaction effect of the AIC was not significantly impacted by the physiological noises. (a) Main effect of interoceptive vs. exteroceptive attention (BDT vs. DDT). (b) Main effect of breath curve feedback condition (delayed vs. non-delayed). (c) Interaction between attention type and breath-curve feedback condition ([delayed – non-delayed] BDT – [delayed – non-delayed] DDT). Pink purple contours indicate corresponding activation in the first sample. We used an extremely liberal threshold of voxelwise p<0.05 for visualization.
Figure 6
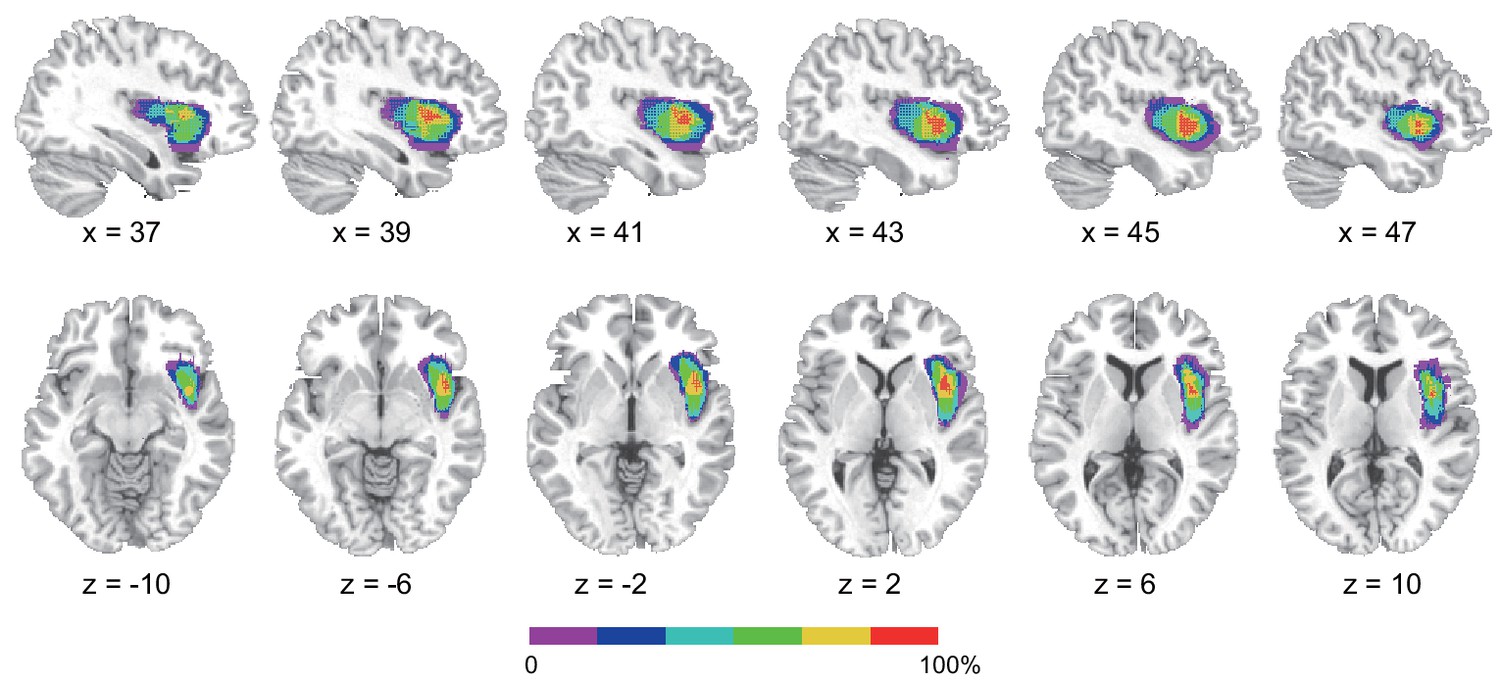
Reconstruction of anterior insular cortex lesions of six patients.
Red color indicates 100% overlap. Left lesions were flipped to the right side to map the lesion overlap.
Figure 7

Behavioral results of the lesion study.
(a, b, c) the interoceptive performance on the BDT, and (d, e, f) the exteroceptive performance on the DDT. On the BDT, patients with AIC lesions had significantly lower performance in accuracy and dʹ compared with the NC and BDC groups but did not show significant alteration in β during the BDT. On the DDT, patients with AIC lesions did not show significant abnormality in performance in accuracy, dʹ, and β compared with either the NC or BDC groups. NC, normal control; BDC, brain damage control. Dashed line: chance level. * p < 0.05; ** p < 0.01; *** p < 0.001.
-
Figure 7—source data 1
CSV file containing behavioral data for lesion study.
- https://doi.org/10.7554/eLife.42265.031
Author response image 1
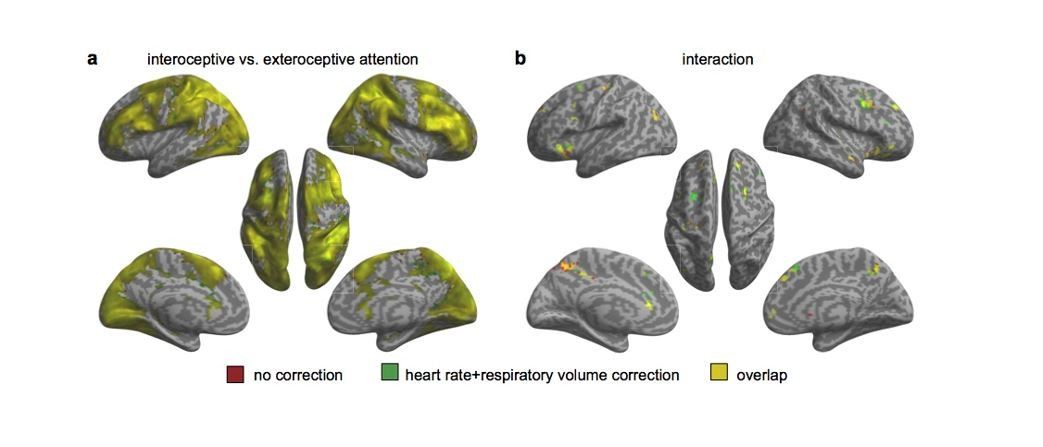
Activation maps with and without including individual heart rate and respiratory volume as covariates in the 2nd GLM.
(a) Main effect of interoceptive attention (interoceptive task vs. exteroceptive task). (b) Interaction between attention type and breath-curve feedback condition ([delayed – non-delayed]interoceptive task – [delayed – non-delayed]exteroceptive task).
Author response image 2
The pattern of respiratory parameters under different task conditions.
Author response image 3
Activation maps with and without physiological correction for the 1st level GLM.
(a) Main effect of interoceptive attention (interoceptive task vs. exteroceptive task). (b) Interaction between attention type and breath-curve feedback condition ([delayed – non-delayed]interoceptive task – [delayed – non-delayed]exteroceptive task). (c) The interaction patterns of the left and right anterior insular cortex (AIC) activity without physiological correction. (d) The interaction patterns of the left and right AIC activity with physiological correction.
Author response image 4
Paired t-test on beta maps obtained without and with physiological correction.
(a) using interoceptive vs. exteroceptive contrast maps. (b) using interaction effect beta maps.
Author response image 5

Author response image 6
The F-test across all RETROICOR regressors.
Voxelwise p < 0.001.
Tables
Table 1
Statistics of behavioral results of the fMRI studies.
https://doi.org/10.7554/eLife.42265.008| First sample | Second sample | ||||||
|---|---|---|---|---|---|---|---|
| Df | T | Cohen’s d | Df | T | Cohen’s d | ||
| accuracy | intero vs. 0.5 | 43 | 14.51*** | 2.18 | 27 | 13.77*** | 2.59 |
| intero vs. extero | 43 | −2.36* | 0.35 | 27 | −1.83 | 0.35 | |
| dʹ | intero vs. 0 | 43 | 13.09*** | 2.0 | 27 | 12.89*** | 2.67 |
| intero vs. extero | 43 | -2.31* | 0.35 | 27 | -2.83** | 0.50 | |
| β | intero vs. extero | 43 | −2.31* | 0.35 | 27 | −2.83** | 0.50 |
| RT | intero vs. extero | 43 | 2.89** | 0.44 | 27 | 0.6 | 0.12 |
-
* p<0.05; **p<0.01; ***p<0.001.
Table 2
Pearson correlation coefficients (and Bayes Factors) between the behavioral measurements for the first, the second, and across the two samples.
https://doi.org/10.7554/eLife.42265.009| Relative accuracy | Subjective difficulty | BPQ | Positive PANAS | HAMA | BDI | ||
|---|---|---|---|---|---|---|---|
| Relative accuracy | - | ||||||
| 1st sample | Subjective difficulty | −0.43** (10.38) | - | ||||
| BPQ | 0.27 (0.17) | −0.15 (0.29) | - | ||||
| Positive PANAS | 0.31 (1.38) | −0.04 (0.19) | −0.006 (0.19) | - | |||
| HAMA | −0.006 (0.19) | −0.14 (0.28) | 0.25 (0.69) | −0.12 (0.25) | - | ||
| BDI | −0.002 (0.19) | −0.004 (0.19) | 0.16 (0.32) | −0.06 (0.20) | 0.70*** (>100) | - | |
| Relative accuracy | - | ||||||
| 2nd sample | Subjective difficulty | - | - | ||||
| BPQ | −0.17 (0.33) | - | - | ||||
| Positive PANAS | 0.12 (0.27) | - | 0.07 (0.25) | - | |||
| HAMA | 0.29 (0.69) | - | 0.40 (1.90) | −0.034 (0.24) | - | ||
| BDI | 0.034 (0.24) | - | 0.075 (0.25) | −0.43 (2.84) | 0.47* (4.96) | - | |
| Relative accuracy | - | ||||||
| 1st + 2nd samples | Subjective difficulty | - | - | ||||
| BPQ | 0.06 (0.17) | - | - | ||||
| Positive PANAS | 0.25 (1.16) | - | 0.03 (0.15) | - | |||
| HAMA | 0.12 (0.25) | - | 0.31* (4.91) | −0.09 (0.20) | - | ||
| BDI | 0.008 (0.15) | - | 0.14 (0.28) | −0.20 (0.56) | 0.60*** (>100) | - |
-
* corrected p<0.05; ** corrected p<0.01; *** corrected p<0.001; value in brackets represents Bayes factor. BPQ, body perception questionnaire; PANAS, positive and negative affective schedule; HAMA, Hamilton anxiety scale; BDI, Beck depression inventory.
Table 3
Activation and deactivation of the brain regions involved in interoceptive attention (interoception – exteroception).
https://doi.org/10.7554/eLife.42265.012| MNI | ||||||||
|---|---|---|---|---|---|---|---|---|
| Region | L/R | BA | X | Y | Z | T | Z | K |
| Positive | ||||||||
| Cerebelum crus I | L | −30 | −70 | −24 | 13.02 | Inf. | 73834 | |
| Middle occipital gyrus | R | 19 | 32 | −68 | 22 | 11.99 | Inf. | |
| Cerebelum crus II | L | −20 | −78 | −48 | 11.72 | 7.80 | ||
| Inferior frontal gyrus | R | 44 | 52 | 14 | 24 | 11.24 | 7.63 | |
| Inferior parietal lobule | R | 40 | 36 | −48 | 44 | 11.19 | 7.62 | |
| Inferior parietal lobule | L | 40 | −38 | −46 | 42 | 10.41 | 7.32 | |
| Postcentral gyrus | R | 2 | 46 | −40 | 54 | 10.29 | 7.27 | |
| Supramarginal gyrus | R | 40 | 48 | −34 | 42 | 10.00 | 7.15 | |
| Superior occipital gyrus | R | 7 | 22 | −72 | 46 | 9.99 | 7.15 | |
| Cerebelum VIIB | L | −32 | −70 | −52 | 9.78 | 7.06 | ||
| Superior parietal lobule (Intraparietal sulcus) | R | 7 | 16 | −78 | 52 | 9.69 | 7.02 | |
| Cerebelum VIII | R | 22 | −74 | −50 | 9.61 | 6.99 | ||
| Middle frontal gyrus | L | 46 | −44 | 50 | 12 | 9.20 | 6.80 | |
| Middle frontal gyrus | R | 46 | 42 | 42 | 24 | 9.16 | 6.78 | |
| Supplementary motor area | R | 6 | 8 | 4 | 76 | 8.92 | 6.68 | |
| Inferior occipital gyrus | R | 37 | 52 | −66 | −12 | 8.68 | 6.56 | |
| Cerebelum crus II | R | 2 | −76 | −36 | 8.66 | 6.56 | ||
| Middle occipital gyrus (Intraparietal sulcus) | R | 19 | 32 | −76 | 34 | 8.58 | 6.52 | |
| Thalamus | R | 18 | −20 | 20 | 8.55 | 6.50 | ||
| Inferior temporal gyrus | R | 20 | 56 | −38 | −20 | 8.41 | 6.43 | |
| Inferior frontal gyrus | R | 45 | 44 | 38 | 12 | 8.31 | 6.38 | |
| Superior parietal lobule (Intraparietal sulcus) | L | 7 | −20 | −72 | 46 | 8.21 | 6.33 | |
| Supplementary motor area | L | 6 | -2 | -4 | 74 | 8.08 | 6.27 | |
| Inferior frontal gyrus | L | 44 | −54 | 12 | 26 | 8.07 | 6.26 | |
| Caudate | R | 16 | -8 | 24 | 7.89 | 6.17 | ||
| Anterior cingulate cortex | R | 32 | 2 | 18 | 44 | 7.78 | 6.12 | |
| Vermis | -2 | −74 | −12 | 7.76 | 6.10 | |||
| Middle frontal gyrus | R | 46 | 50 | 14 | 40 | 7.75 | 6.10 | |
| Middle frontal gyrus | L | 46 | −40 | 34 | 34 | 7.72 | 6.08 | |
| Supramarginal gyrus | L | 40 | −60 | −36 | 28 | 7.47 | 5.95 | |
| Middle frontal gyrus | R | 6 | 28 | 2 | 48 | 7.01 | 5.69 | |
| Anterior insular cortex | R | 34 | 20 | 4 | 6.98 | 5.68 | ||
| Postcentral gyrus | L | 2 | −62 | −26 | 36 | 6.87 | 5.62 | |
| Inferior frontal gyrus | L | 6 | −52 | 8 | 12 | 6.84 | 5.59 | |
| Superior frontal gyrus | L | 6 | −26 | 4 | 66 | 6.73 | 5.53 | |
| Middle occipital gyrus (Intraparietal sulcus) | L | 7 | −24 | −66 | 36 | 6.66 | 5.49 | |
| Lingual gyrus | L | 18 | −18 | −90 | −18 | 6.61 | 5.46 | |
| Superior parietal lobule | L | 1 | −24 | −44 | 72 | 6.55 | 5.42 | |
| Caudate | L | -8 | 22 | 4 | 6.45 | 5.37 | ||
| Precentral gyrus | L | 6 | −40 | 2 | 56 | 6.23 | 5.23 | |
| Superior occipital gyrus | L | 18 | −22 | −92 | 28 | 6.20 | 5.21 | |
| Middle occipital gyrus | L | 18 | −24 | −94 | 16 | 6.09 | 5.14 | |
| Middle occipital gyrus | R | 18 | 30 | −86 | 16 | 6.09 | 5.14 | |
| Fusiform gyrus | L | 37 | −46 | −46 | −22 | 5.82 | 4.97 | |
| Anterior insular cortex | L | −30 | 20 | 8 | 5.50 | 4.76 | ||
| Cuneus | L | 19 | 0 | −88 | 34 | 5.22 | 4.57 | |
| Superior parietal lobule | L | 5 | −18 | −60 | 66 | 5.18 | 4.54 | |
| Fusiform gyrus | R | 37 | 44 | −32 | −20 | 4.96 | 4.39 | |
| Negative | ||||||||
| Anterior cingulate cortex | R | 32 | 4 | 38 | -4 | 7.47 | 5.95 | 3232 |
| Anterior cingulate cortex | L | 32 | -6 | 38 | -4 | 7.10 | 5.94 | |
| Superior frontal gyrus | L | 9 | −16 | 38 | 54 | 5.97 | 5.07 | |
| Medial superior frontal gyrus | R | 32 | 10 | 52 | 20 | 5.33 | 4.65 | |
| Medial superior frontal gyrus | L | 32 | -8 | 50 | 26 | 5.32 | 4.63 | |
| Middle frontal gyrus | L | 8 | −24 | 30 | 56 | 5.12 | 4.50 | |
| Superior frontal gyrus | L | 9 | −20 | 32 | 48 | 4.54 | 4.08 | |
| Precuneus | L | 23 | −10 | −44 | 40 | 6.45 | 5.37 | 819 |
| Precuneus | R | 23 | 6 | −60 | 24 | 4.24 | 3.85 | |
| Middle temporal gyrus | L | 21 | −60 | −10 | −14 | 5.89 | 5.02 | 787 |
Table 4
Activation and deactivation of the brain regions involved in feedback delay (delay – non-delay).
https://doi.org/10.7554/eLife.42265.013| MNI | ||||||||
|---|---|---|---|---|---|---|---|---|
| Region | L/R | BA | X | Y | Z | T | Z | K |
| Positive | ||||||||
| Anterior insular cortex | R | 30 | 26 | -4 | 5.26 | 4.60 | 618 | |
| Inferior frontal gyrus | R | 45 | 42 | 22 | 8 | 4.40 | 3.98 | |
| Caudate | R | 8 | 24 | 4 | 4.29 | 3.90 | ||
| Inferior parietal lobule | L | 40 | −38 | −54 | 42 | 5.23 | 4.58 | 598 |
| Angular gyrus | R | 39 | 44 | −44 | 30 | 4.99 | 4.41 | 1317 |
| Inferior parietal lobule | R | 40 | 56 | −54 | 44 | 4.17 | 3.80 | |
| Middle frontal gyrus | R | 6 | 34 | 8 | 46 | 4.78 | 4.26 | 780 |
| Middle frontal gyrus | R | 9 | 34 | 18 | 34 | 4.74 | 4.23 | |
| Middle frontal gyrus | R | 46 | 34 | 28 | 32 | 4.32 | 3.92 | |
| Negative | ||||||||
| Lingual gyrus | L | 17 | −10 | −78 | -4 | 6.21 | 5.22 | 443 |
Table 5
Activation of brain regions related to the interaction between interoceptive attention and feedback delay ([delayed – non-delayed] interoception – [delayed – non-delayed] exteroception).
https://doi.org/10.7554/eLife.42265.014| MNI | ||||||||
|---|---|---|---|---|---|---|---|---|
| Region | L/R | BA | X | Y | Z | T | Z | K |
| Positive | ||||||||
| Anterior insular cortex | R | 28 | 28 | 0 | 5.52 | 4.77 | 516 | |
| Inferior frontal gyrus | R | 47 | 40 | 26 | −10 | 4.66 | 4.17 | |
| Middle frontal gyrus | R | 9 | 40 | 14 | 40 | 5.36 | 4.67 | 2330 |
| Supplementary motor area | R | 8 | 4 | 22 | 54 | 5.19 | 4.55 | |
| Anterior cingulate cortex | R | 32 | 6 | 36 | 38 | 5.12 | 4.5 | |
| Superior frontal gyrus | R | 8 | 6 | 30 | 44 | 4.71 | 4.21 | |
| Inferior frontal gyrus | R | 45 | 46 | 22 | 16 | 4.50 | 4.05 | |
| Middle frontal gyrus | R | 6 | 34 | 4 | 52 | 4.27 | 3.88 | |
| Supplementary motor area | L | 6 | −12 | 8 | 52 | 3.64 | 3.38 | |
| Anterior cingulate cortex | R | 32 | 10 | 30 | 28 | 3.49 | 3.25 | |
| Supramarginal gyrus | R | 40 | 54 | −46 | 26 | 4.91 | 4.35 | 1748 |
| Middle temporal gyrus | R | 21 | 66 | −32 | −10 | 4.70 | 4.20 | |
| Inferior parietal lobule | R | 19 | 60 | −48 | 42 | 4.56 | 4.10 | |
| Superior temporal gyrus | R | 42 | 58 | −40 | 16 | 4.49 | 4.04 | |
Table 6
Relationship between the interaction effect ([delayed – non-delayed] interoception – [delayed – non-delayed] exteroception) of the brain and behavioral performance (interoceptive accuracy) across participants.
https://doi.org/10.7554/eLife.42265.017| MNI | ||||||||
|---|---|---|---|---|---|---|---|---|
| Region | L/R | BA | X | Y | Z | T | Z | K |
| Positive | ||||||||
| Middle temporal gyrus | R | 20 | 54 | −20 | −10 | 3.85 | 3.53 | 232 |
| Middle temporal gyrus | L | 22 | −48 | −24 | -2 | 3.69 | 3.41 | 170 |
| Anterior insular cortex | L | −42 | 12 | -6 | 3.64 | 3.37 | 168 | |
| Anterior insular cortex | R | 42 | 16 | -6 | 3.41 | 3.18 | 119 | |
| Angular gyrus | R | 22 | 58 | −50 | 26 | 3.10 | 2.92 | 128 |
Table 7
Positive and negative psychophysiological interaction effects with the right AIC as the seed.
https://doi.org/10.7554/eLife.42265.022| MNI | ||||||||
|---|---|---|---|---|---|---|---|---|
| Region | L/R | BA | X | Y | Z | T | Z | K |
| Positive | ||||||||
| Inferior frontal operculum | R | 44 | 52 | 8 | 26 | 7.49 | 5.96 | 5895 |
| Precentral gyrus | R | 6 | 58 | 10 | 36 | 6.71 | 5.52 | |
| Insula cortex | R | 38 | 0 | 14 | 6.35 | 5.30 | ||
| Putamen | R | 20 | 8 | 10 | 6.33 | 5.29 | ||
| Rolandic operculum | R | 48 | 48 | 4 | 10 | 6.01 | 5.09 | |
| Caudate | R | 8 | 10 | 4 | 5.86 | 5.00 | ||
| Inferior frontal gyrus | R | 45 | 42 | 36 | 10 | 4.35 | 3.94 | |
| Postcentral gyrus | R | 43 | 58 | −16 | 32 | 6.95 | 6.55 | 2078 |
| Supramarginal gyrus | R | 2 | 66 | −22 | 34 | 6.04 | 5.11 | |
| Superior temporal gyrus | R | 42 | 62 | −32 | 20 | 5.28 | 4.61 | |
| Precentral gyrus | L | 6 | −58 | 10 | 30 | 6.89 | 5.63 | 11155 |
| Putamen | L | −20 | 10 | 12 | 6.04 | 5.11 | ||
| Supplementary motor area | L | 6 | -8 | -4 | 64 | 5.90 | 5.02 | |
| Caudate | L | -8 | 16 | 2 | 5.41 | 4.70 | ||
| Triangle Inferior fronal gyrus | L | 48 | −38 | 32 | 24 | 5.21 | 4.56 | |
| Superior temporal gyrus | L | 44 | −48 | −42 | 24 | 5.19 | 4.55 | |
| Insula cortex | L | −36 | -2 | 8 | 5.19 | 4.55 | ||
| Supplementary motor area | R | 6 | 4 | 4 | 64 | 5.19 | 4.55 | |
| Supramarginal gyrus | L | 2 | −56 | −28 | 40 | 5.13 | 4.50 | |
| Superior frontal gyrus | L | 6 | −24 | -2 | 58 | 4.73 | 4.22 | |
| Postcentral gyrus | L | 3 | −56 | −20 | 34 | 4.53 | 4.07 | |
| Middle frontal gyrus | L | 6 | −28 | -8 | 52 | 4.48 | 4.04 | |
| Middle temporal gyrus | R | 37 | 48 | −60 | 8 | 5.44 | 4.72 | 569 |
| Cerebelum VIIb | L | −16 | −74 | −48 | 4.95 | 4.38 | 427 | |
| Cerebelum VIII | L | −24 | −66 | −52 | 4.75 | 4.24 | ||
| Negative | ||||||||
| Cuneus | L | 17 | −10 | −96 | 16 | 7.30 | 5.85 | 5904 |
| Cuneus | R | 18 | 14 | −90 | 28 | 6.80 | 5.40 | |
| Lingual gyrus | R | 18 | 14 | −62 | -2 | 6.05 | 5.11 | |
| Lingual gyrus | L | 18 | −18 | −74 | -8 | 5.26 | 4.60 | |
| Calcarine | L | 18 | 0 | −76 | 18 | 5.11 | 4.49 | |
| Fusiform gyrus | L | 18 | −24 | −80 | −16 | 4.95 | 4.38 | |
| Calcarine | R | 17 | 20 | −54 | 6 | 4.72 | 4.22 | |
| Cerebelum Crus I | L | −38 | −78 | −18 | 4.37 | 3.95 | ||
| Middle occipital gyrus | L | 18 | −16 | −86 | -4 | 4.22 | 3.84 | |
Table 8
Statistics of the results of the lesion study.
https://doi.org/10.7554/eLife.42265.032| Accuracy | dʹ | ||||
|---|---|---|---|---|---|
| T | BF | T | BF | ||
| BDT | AIC vs. NC | −3.47*** | 14.71 | −3.62*** | 13.78 |
| AIC vs. BDC | −2.35** | 3.95 | −2.22* | 3.40 | |
| BDC vs. NC | 0 | 0.42 | 0.11 | 0.43 | |
| DDT | AIC vs. NC | 0.18 | 0.38 | 0.18 | 0.38 |
| AIC vs. BDC | −0.99 | 0.98 | −0.83 | 0.85 | |
| BDC vs. NC | 1.74* | 0.82 | 1.46 | 0.69 | |
-
* p<0.05; **p<0.01; ***p<0.001; one- tailed; BF, Bayes factor.
Table 9
Demographic characteristics of the participants in lesion experiment.
https://doi.org/10.7554/eLife.42265.007| Lesion laterality | Lesion size (ml) | Chronicity (months) | Age (years) | Gender | Education (years) | MMSE | BDI | |
|---|---|---|---|---|---|---|---|---|
| IC1 | Right | 3.7 | 38 | 39 | M | 15 | 28 | 4 |
| IC2 | Right | 5.5 | 6 | 33 | M | 16 | 28 | 1 |
| IC3 | Left | 11.2 | 9 | 38 | M | 12 | 26 | 4 |
| IC4 | Left | 9.0 | 12 | 53 | M | 12 | 26 | 8 |
| IC5 | Left | 16.0 | 6 | 51 | M | 16 | 29 | 1 |
| IC6 | Left | 9.2 | 37 | 40 | M | 16 | 26 | 0 |
| BDC | 3 Left/3 Right | 18 ± 14 | 21 ± 16 | 39 ± 7 | 3F/3M | 12 ± 3 | 28 ± 1 | 2 ± 2 |
| NC | N/A | N/A | N/A | 46 ± 7 | 8F/4M | 14 ± 2 | 28 ± 1 | 1 ± 1 |
-
IC, insular cortex; BDC, brain damage control; NC, normal control; MMSE, mini-mental state examination; BDI, Beck depression inventory.
Additional files
-
Transparent reporting form
- https://doi.org/10.7554/eLife.42265.033
Download links
A two-part list of links to download the article, or parts of the article, in various formats.
Downloads (link to download the article as PDF)
Open citations (links to open the citations from this article in various online reference manager services)
Cite this article (links to download the citations from this article in formats compatible with various reference manager tools)
Anterior insular cortex plays a critical role in interoceptive attention
eLife 8:e42265.
https://doi.org/10.7554/eLife.42265


