Integrin alpha11 is an Osteolectin receptor and is required for the maintenance of adult skeletal bone mass
- University of Texas Southwestern Medical Center, United States
- Tongji University, China
- Howard Hughes Medical Institute, University of Texas Southwestern Medical Center, United States
Figures
Figure 1
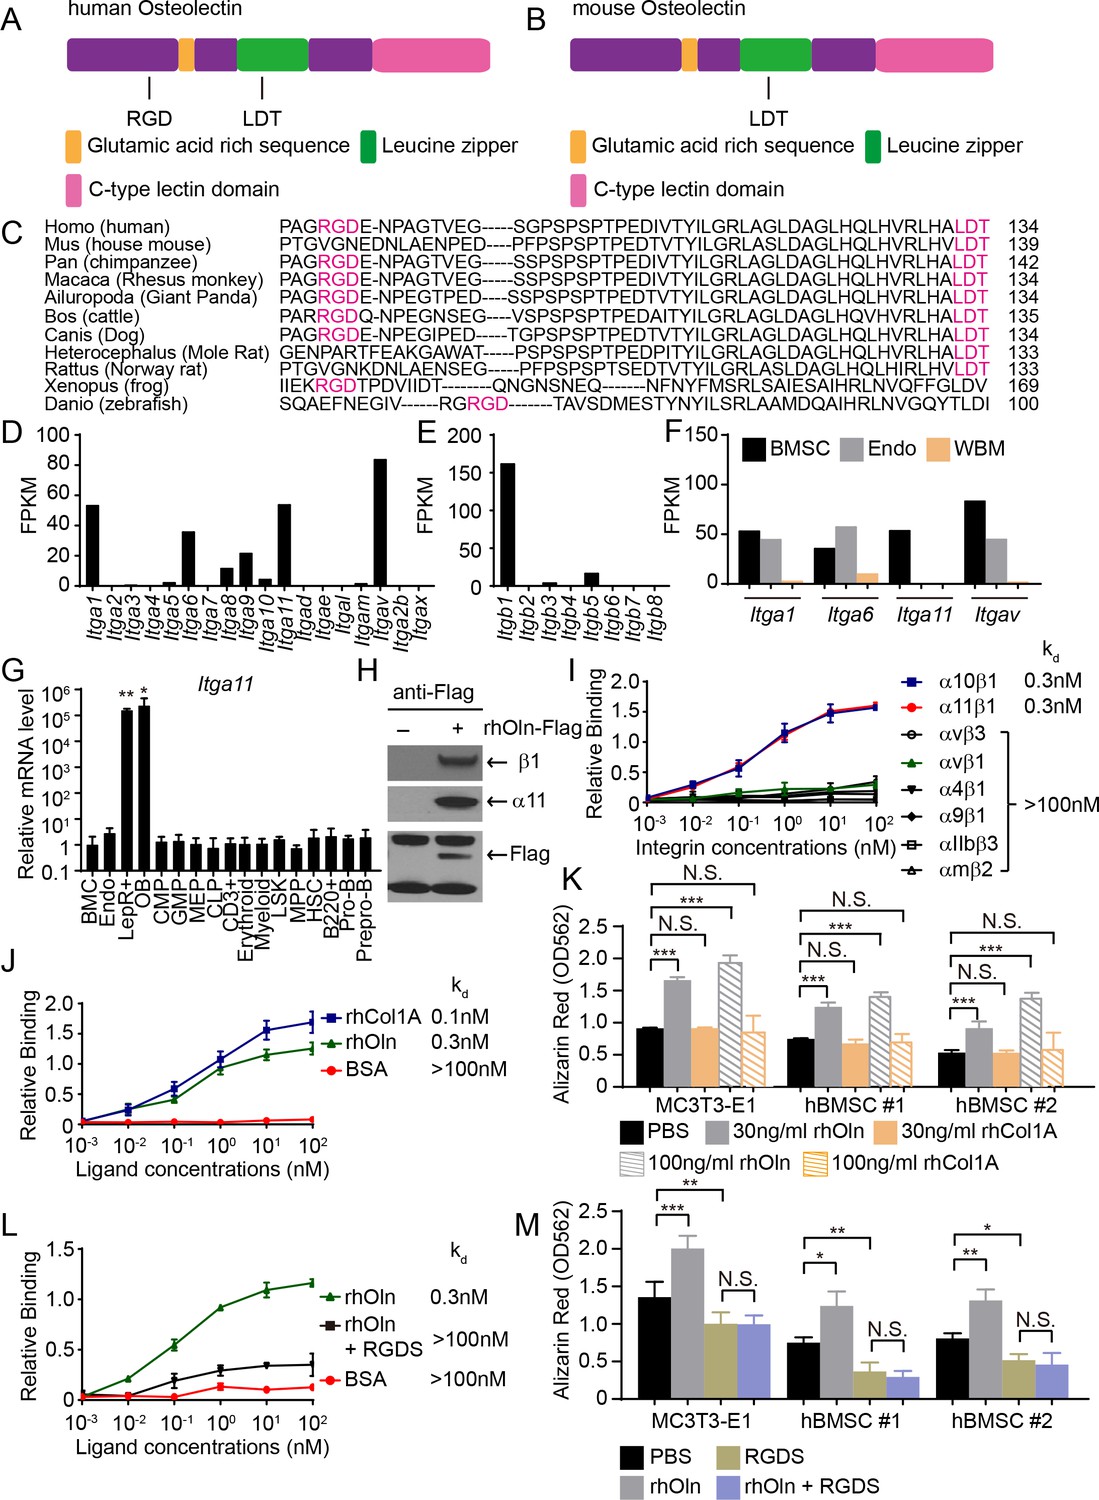
Osteolectin contains conserved integrin binding motifs and binds with high affinity to integrin α11β1.
(A, B) The human (A) and mouse (B) Osteolectin proteins contain RGD and LDT sequences. (C) Alignment of Osteolectin amino acid sequences shows that the RGD and LDT domains are evolutionarily conserved among bony vertebrates. (D, E) RNA-seq analysis of integrin α (D) and β (E) subunits in PDGFRα+CD45-Ter119-CD31- bone marrow stromal cells from enzymatically dissociated adult bone marrow (n = 2 independent samples). These cells are uniformly positive for LepR expression (Zhou et al., 2014). (F) RNA-seq analysis of Itga1, Itga6, Itga11, and Itgav in PDGFRα+CD45-Ter119-CD31- bone marrow stromal cells, VE-Cadherin+ bone marrow endothelial cells, and whole bone marrow cells (n = 2 independent samples per cell population). (G) Itga11 expression in cell populations from mouse bone marrow by qRT-PCR (n = 3 independent samples per cell population). The markers used for the isolation of each cell population are shown in Supplementary file 1. (H) In MC3T3-E1 preosteoblast cells expressing Flag-tagged Osteolectin, anti-Flag antibody co-immunoprecipitated endogenous integrin β1 and integrin α11 with Flag-tagged Osteolectin (results are representative of two independent experiments). (I) Recombinant human Osteolectin (rhOln) selectively bound to recombinant human integrin α11β1 and α10β1, but not to other integrins (n = 3 independent experiments). (J) Integrin α11β1 bound Osteolectin and recombinant human Pro-Collagen 1α (rhCol1A) with similar affinities, but not bovine serum albumin (BSA) (n = 3 independent experiments). (K) Osteolectin, but not Pro-Collagen 1α, promoted osteogenic differentiation by MC3T3-E1 cells and human bone marrow stromal cells (n = 3 independent experiments). (L) 200 nM RGDS peptide inhibited the binding of integrin α11β1 to recombinant human Osteolectin. (M) 100 μM RGDS peptide inhibited osteogenic differentiation by MC3T3-E1 cells and human bone marrow stromal cells in response to 30 ng/ml of recombinant human Osteolectin. All numerical data reflect mean ±standard deviation. Statistical significance was determined with one-way (G) or two-way ANOVAs with Dunnett’s multiple comparisons tests (K) or Tukey’s multiple comparisons tests (M).
-
Figure 1—source data 1
Data for Figure 1.
- https://doi.org/10.7554/eLife.42274.004
Figure 2
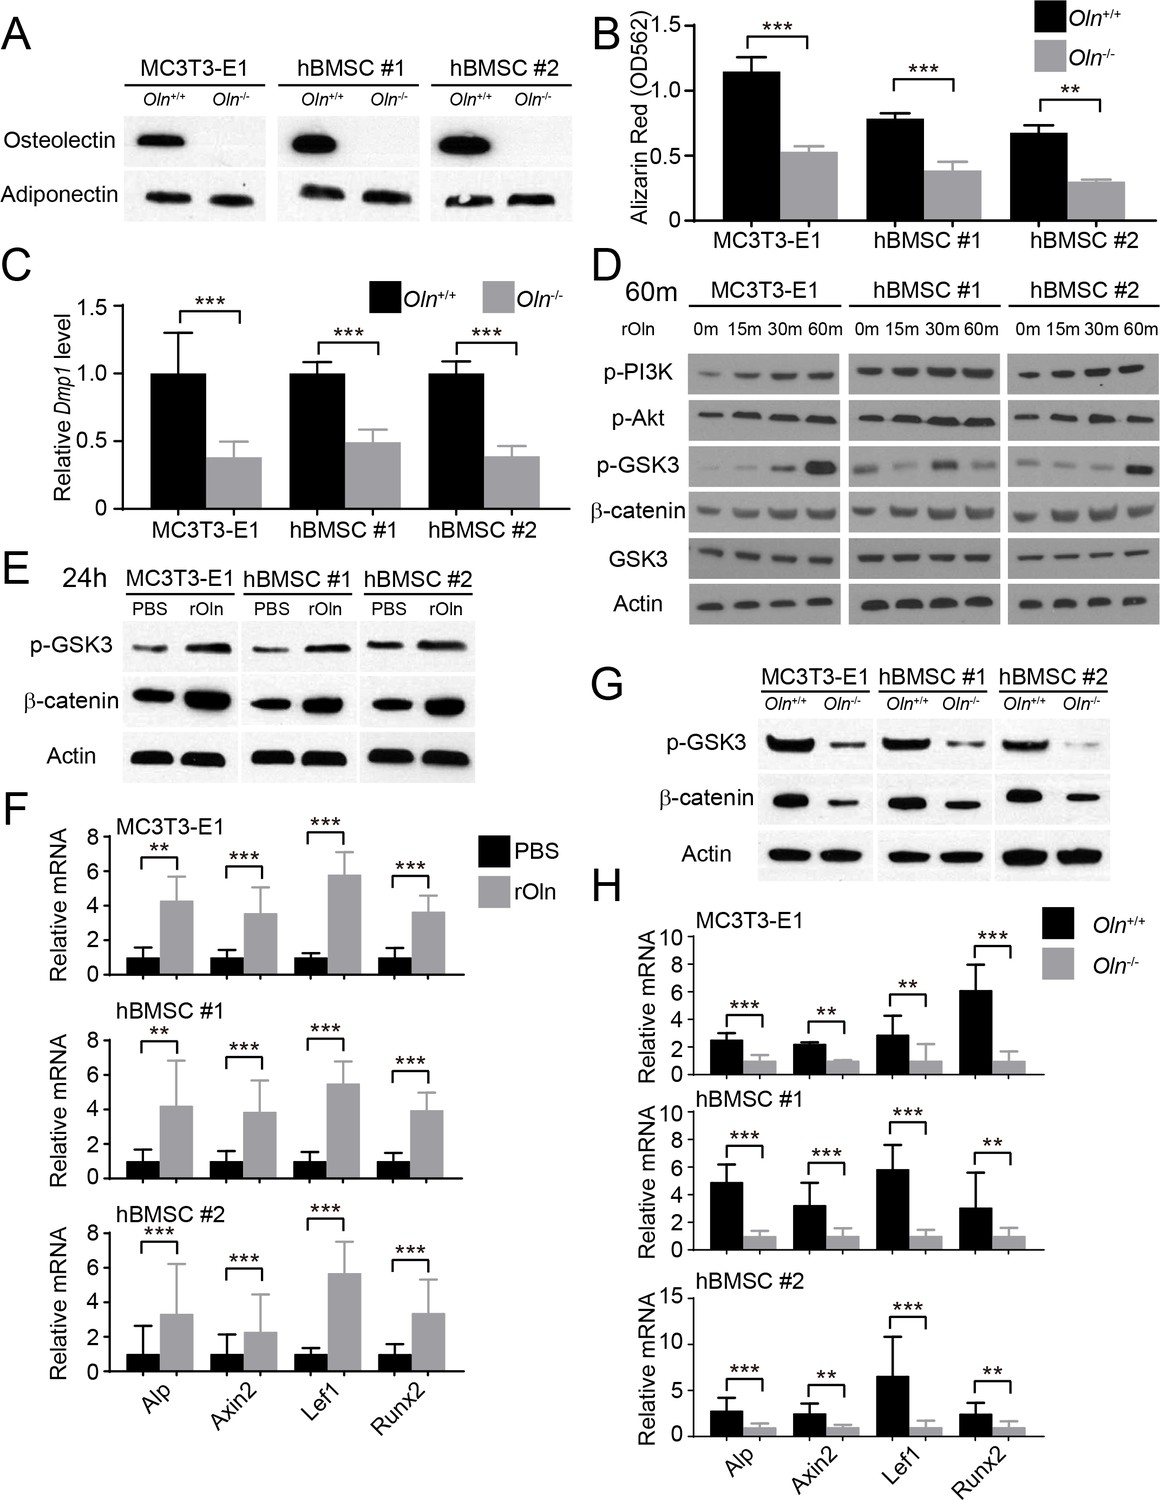
Osteolectin activates Wnt pathway signaling in skeletal stem/progenitor cells.
(A) Western blot of cell culture supernatant from parental or Osteolectin deficient MC3T3-E1 cells and human bone marrow stromal cells (hBMSC#1 and hBMSC#2 cells) (this blot is representative of blots from three independent experiments). (B) Osteogenic differentiation in culture of parental or Osteolectin deficient MC3T3-E1 cells, hBMSC#1 cells, and hBMSC#2 cells. Alizarin red staining was performed after 14 days (for MC3T3-E1 cells) or 21 days (for hBMSC cells) to quantify osteoblast differentiation and mineralization (n = 3 independent experiments). (C) qRT-PCR analysis of Dmp1 transcript levels in MC3T3-E1 cells, hBMSC#1 cells, and hBMSC#2 cells after 14 to 21 days of osteogenic differentiation (n = 5 independent experiments). (D) MC3T3-E1 cells, hBMSC#1 cells, and hBMSC#2 cells were stimulated with recombinant mouse Osteolectin (rOln) in osteogenic differentiation medium then lysed 0, 15, 30, or 60 min later and immunoblotted for phospho-PI3K, phospho-Akt, phospho-GSK3, β-catenin, total GSK3, and Actin (results are representative of 3 independent experiments). (E) MC3T3-E1 cells, hBMSC#1 cells, and hBMSC#2 cells were transferred into osteogenic differentiation medium for 24 hr with PBS or recombinant mouse Osteolectin, lysed, and immunoblotted for phospho-GSK3, β-catenin, and Actin (this blot is representative of blots from three independent experiments). (F) qRT-PCR analysis of Wnt target gene transcript levels (Alkaline phosphatase, Axin2, Lef1, or Runx2) in MC3T3-E1 cells, hBMSC#1 cells, and hBMSC#2 cells 24 hr after transfer into osteogenic differentiation medium, with PBS or recombinant mouse Osteolectin (n = 5 independent experiments). (G) Parental or Osteolectin deficient MC3T3-E1 cells, hBMSC#1 cells, and hBMSC#2 cells after 24 hr in osteogenic differentiation medium were lysed and immunoblotted for phospho-GSK3, β-catenin, and Actin (this blot is representative of blots from three independent experiments). (H) qRT-PCR analysis of Wnt target gene transcript levels in parental or Osteolectin deficient MC3T3-E1 cells, hBMSC#1 cells, and hBMSC#2 cells 24 hr after transfer into osteogenic differentiation medium (n = 5 independent experiments). All numerical data reflect mean ±standard deviation. The statistical significance of differences was determined with two-way ANOVAs with Sidak’s multiple comparisons tests.
-
Figure 2—source data 1
Data for Figure 2.
- https://doi.org/10.7554/eLife.42274.006
Figure 3
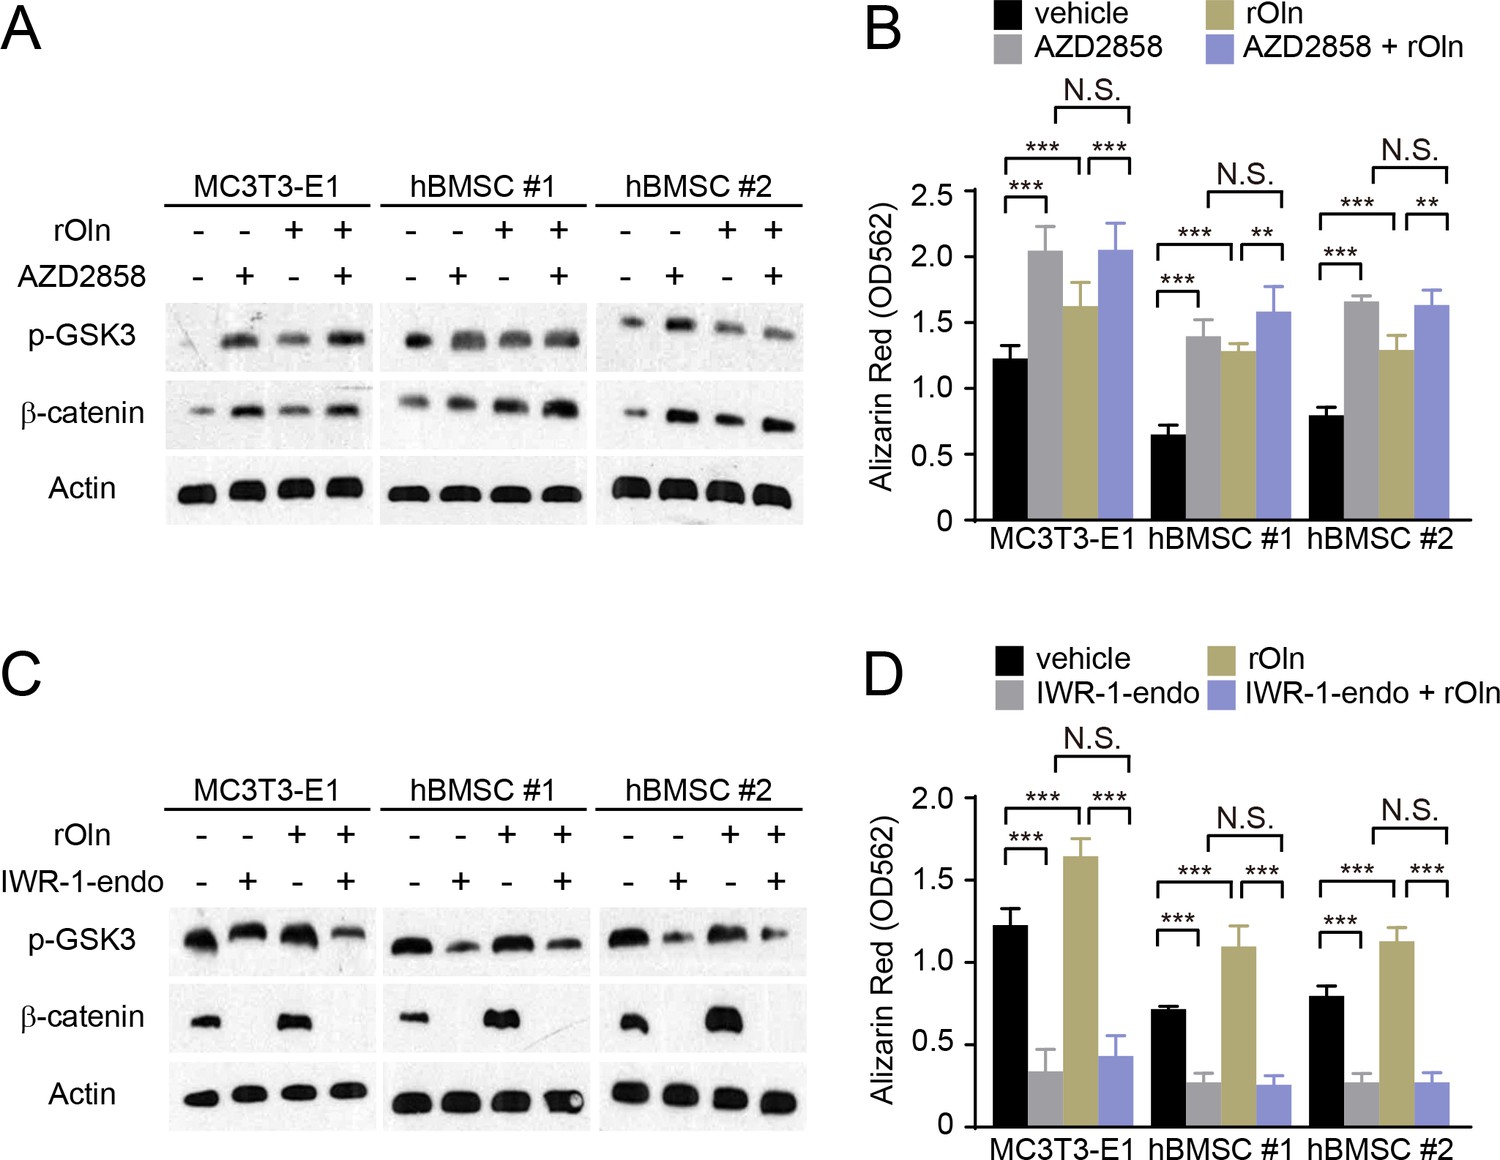
Osteogenic differentiation in response to Osteolectin requires β-catenin.
(A and B) MC3T3-E1 cells, hBMSC#1 cells, and hBMSC#2 cells were transferred into osteogenic differentiation medium with PBS or 30 ng/ml recombinant mouse Osteolectin, as well as DMSO or 200 nM of the GSK3 inhibitor AZD2858. (A) Cells were lysed 24 hr later and immunoblotted for phospho-GSK3, β-catenin, and Actin. (B) Alizarin red staining after 14 days (MC3T3-E1 cells) or 21 days (hBMSC cells) to quantify osteoblast differentiation and mineralization (n = 3 independent experiments). (C and D) MC3T3-E1 cells, hBMSC#1 cells, and hBMSC#2 cells were transferred into osteogenic differentiation medium with PBS or 30 ng/ml Osteolectin, as well as DMSO or 200 nM of the β-catenin inhibitor IWR-1-endo. (C) Cells were lysed 24 hr later and immunoblotted for phospho-GSK3, β-catenin, and Actin. (D) Alizarin red staining after 14 days (MC3T3-E1 cells) or 21 days (hBMSC cells) to quantify osteoblast differentiation and mineralization (n = 3 independent experiments). All numerical data reflect mean ±standard deviation. The statistical significance of differences was determined with two-way ANOVAs with Tukey’s multiple comparisons tests.
-
Figure 3—source data 1
Data for Data for Figure 3.
- https://doi.org/10.7554/eLife.42274.008
Figure 4
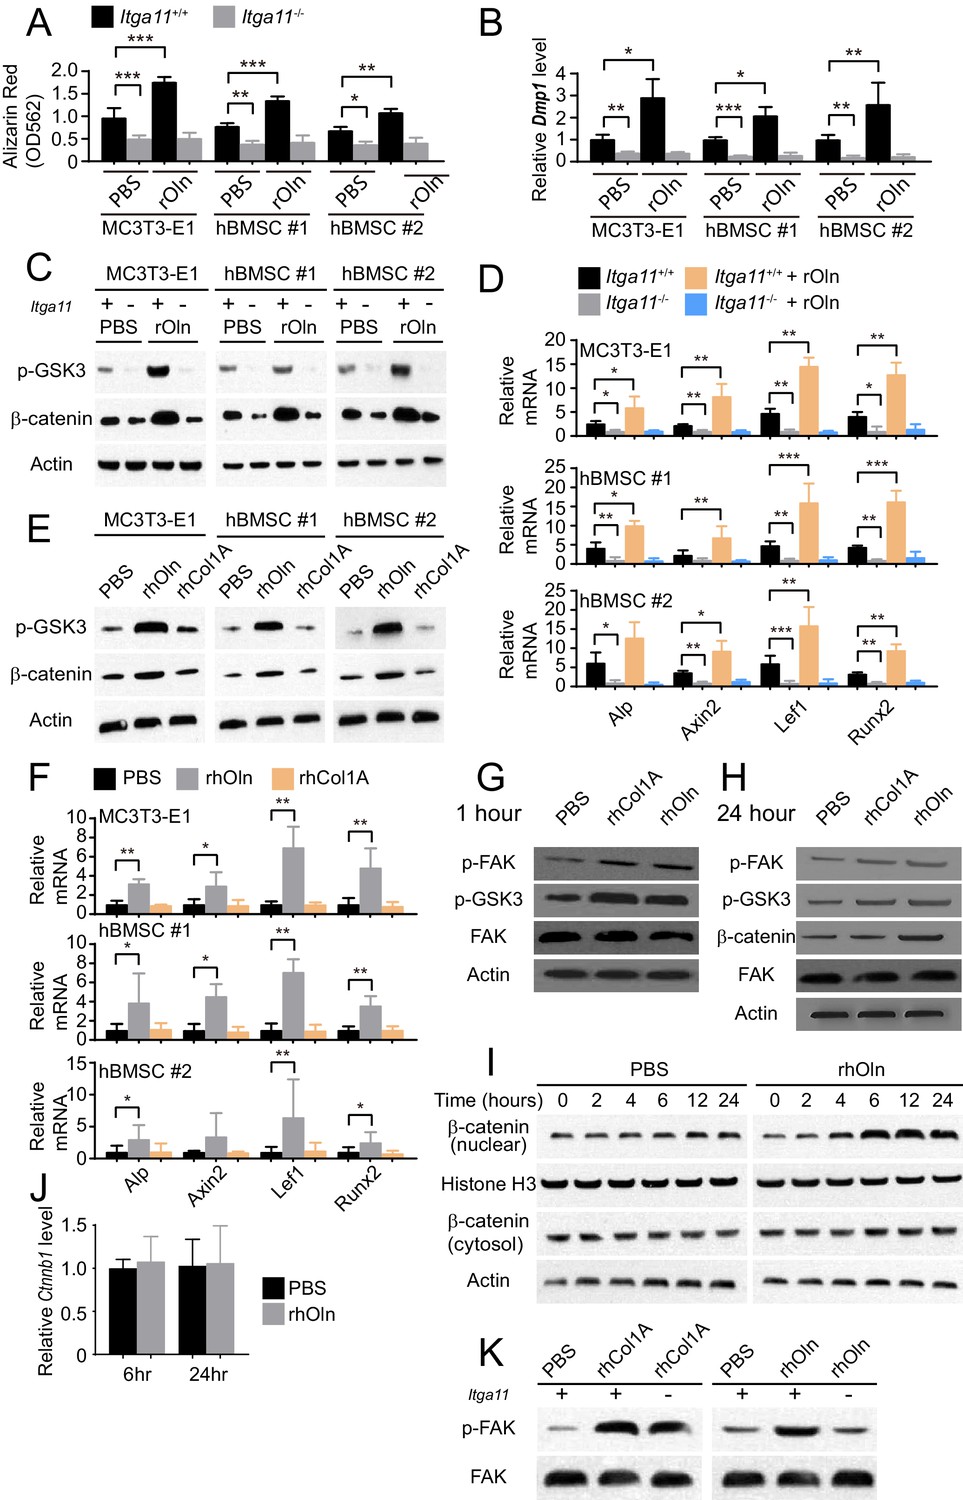
Integrin α11 is required for osteogenic differentiation and Wnt pathway activation in response to Osteolectin but exogenous collagen does not activate Wnt pathway signaling.
(A) Osteogenic differentiation in culture of parental or Itga11 deficient MC3T3-E1 cells, hBMSC#1 cells, and hBMSC#2 cells with PBS or recombinant mouse Osteolectin (n = 3 independent experiments). (B) qRT-PCR analysis of Dmp1 transcript levels in MC3T3-E1 cells, hBMSC#1 cells, and hBMSC#2 cells after 14 to 21 days of osteogenic differentiation (n = 5 independent experiments). (C) Parental or Itga11 deficient MC3T3-E1 cells, hBMSC#1 cells, and hBMSC#2 cells were transferred into osteogenic differentiation medium with or without recombinant mouse Osteolectin then lysed 24 hr later and immunoblotted for phospho-GSK3, β-catenin, and Actin (this blot is representative of blots from three independent experiments). (D) qRT-PCR analysis of Wnt target gene transcript levels in parental or Itga11 deficient MC3T3-E1 cells, hBMSC#1 cells, and hBMSC#2 cells 24 hr after transfer into osteogenic differentiation medium with PBS or Osteolectin (n = 5 independent experiments). (E) MC3T3-E1 cells, hBMSC#1 cells, and hBMSC#2 cells were transferred into osteogenic differentiation medium with PBS or 30 ng/ml Osteolectin, or 30 ng/ml recombinant Pro-Collagen 1α, then lysed 24 hr later and immunoblotted for phospho-GSK3, β-catenin, and Actin (this blot is representative of blots from three independent experiments). (F) qRT-PCR analysis of Wnt target gene transcript levels in MC3T3-E1 cells, hBMSC#1 cells, and hBMSC#2 cells 24 hr after transfer into osteogenic differentiation medium with PBS or 30 ng/ml Osteolectin, or 30 ng/ml Pro-Collagen 1α (n = 5 independent experiments). (G) Primary mouse bone marrow stromal cells were adherently cultured in osteogenic differentiation medium. PBS (control), recombinant human Pro-Collagen 1α, or recombinant human Osteolectin was added, then the cells were lysed 1 hr later and lysates were immunoblotted for phospho-FAK, phospho-GSK3, total FAK, and Actin (this blot is representative of blots from three independent experiments). (H) Primary mouse bone marrow stromal cells adherently cultured in osteogenic differentiation medium were treated with PBS (control), recombinant human Pro-Collagen 1α, or recombinant human Osteolectin then lysed 24 hr later and lysates were immunoblotted for phospho-FAK, phospho-GSK3, β-catenin, total FAK, and Actin (this blot is representative of blots from three independent experiments). (I) Primary mouse bone marrow stromal cells adherently cultured in osteogenic differentiation medium were treated with 30 ng/ml recombinant human Osteolectin or PBS (control) then lysed 2, 4, 6, 12, or 24 hr later. Nuclear and cytosolic/membrane-associated fractions were isolated from lysates by centrifugation then immunoblotted for β-catenin. As loading controls, Histone H3 was blotted in the nuclear fraction and Actin was blotted in the cytosolic/membrane-associated fraction (this blot is representative of blots from three independent experiments). (J) qRT-PCR analysis of Ctnnb1 transcript levels in cells from the experiment in panel (I) (n = 3 independent experiments). (K) Primary mouse bone marrow stromal cells from Lepr-Cre; Itga11fl/fl or littermate control mice were adherently cultured in osteogenic differentiation medium. PBS (control), recombinant human Pro-Collagen 1α, or recombinant human Osteolectin was added then the cells were lysed 1 hr later and lysates were immunoblotted for phospho-FAK and FAK (this blot is representative of blots from two independent experiments). All numerical data reflect mean ±standard deviation. Statistical significance was determined with two-way ANOVAs with Tukey’s multiple comparisons tests (A, B and D), Dunnett’s multiple comparisons tests (F), or Sidak’s multiple comparisons tests (J).
-
Figure 4—source data 1
Data for Figure 4.
- https://doi.org/10.7554/eLife.42274.010
Figure 5 with 1 supplement
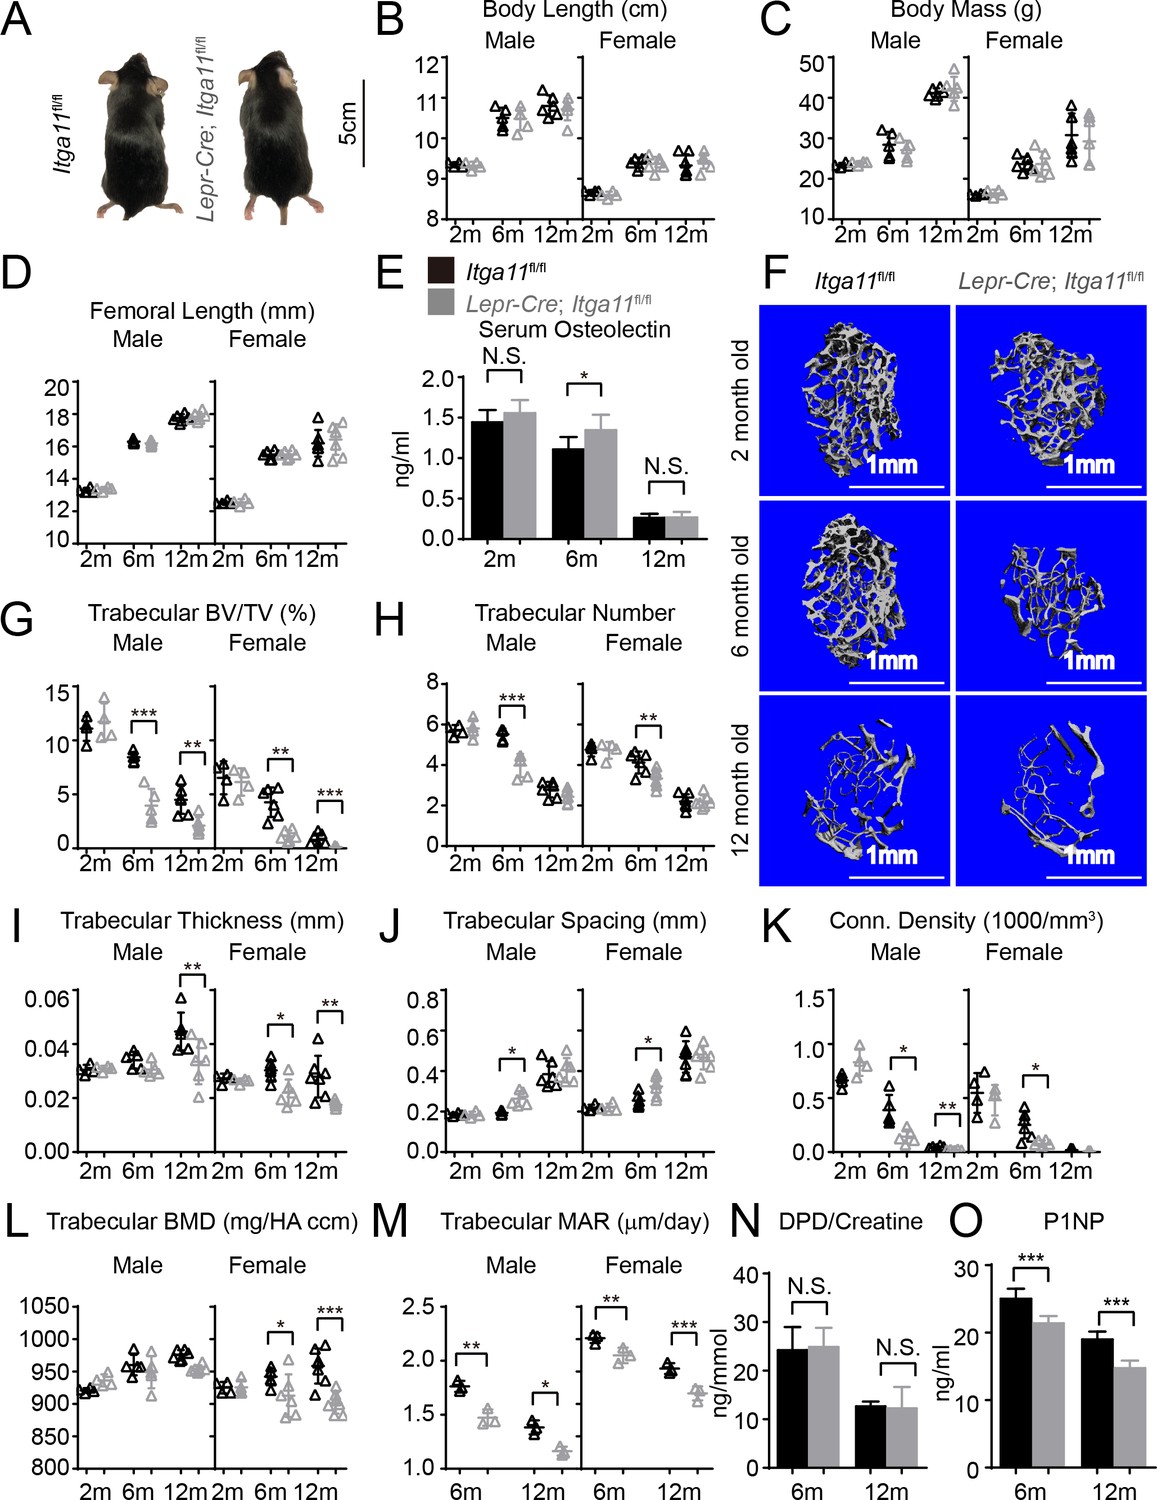
Conditional Itga11 deletion from LepR+cells accelerates the loss of trabecular bone during aging.
(A) Lepr-Cre; Itga11fl/fl mice were grossly normal and indistinguishable from littermate controls. (B – D) Body length (B), body mass (C) and femur length (D) did not significantly differ between Lepr-Cre; Itga11fl/fl mice and sex-matched littermate controls at 2, 6, or 12 months of age (n = 4–7 mice per genotype per sex per time point, from at least three independent experiments). (E) ELISA measurement of serum Osteolectin levels in Lepr-Cre; Itga11fl/fl mice and littermate controls at 2, 6, and 12 months of age (n = 8 mice per genotype per time point from four independent experiments). (F) Representative microCT images of trabecular bone in the distal femur metaphysis of male Lepr-Cre; Itga11fl/fl mice and littermate controls at 2, 6, and 12 months of age. (G–L) microCT analysis of trabecular bone volume/total volume (G), trabecular number (H), trabecular bone thickness (I), trabecular bone spacing (J), connectivity density (K), and bone mineral density (L) in the distal femur metaphysis of Lepr-Cre; Itga11fl/fl mice and sex-matched littermate controls at 2, 6, and 12 months of age (n = 4–7 mice per genotype per sex per time point from at least three independent experiments). (M) Trabecular bone mineral apposition rate based on calcein double labelling in the distal femur metaphysis (n = 3 mice per genotype per sex per time point). (N) Bone resorption rate analysis by measuring the deoxypyridinoline/creatinine ratio in the urine of LepR-Cre; Itga11fl/fl mice and littermate controls at 6 and 12 months of age (n = 4–5 mice per genotype per time point from three independent experiments). (O) Serum P1NP levels in LepR-Cre; Itga11fl/fl mice and sex-matched littermate controls at 6 and 12 months of age (n = 4 mice per genotype per time point from three independent experiments). All numerical data reflect mean ±standard deviation. The statistical significance of differences was determined with two-way ANOVAs with Sidak’s multiple comparisons tests.
-
Figure 5—source data 1
Data for Data for Figure 5.
- https://doi.org/10.7554/eLife.42274.012
Figure 5—figure supplement 1
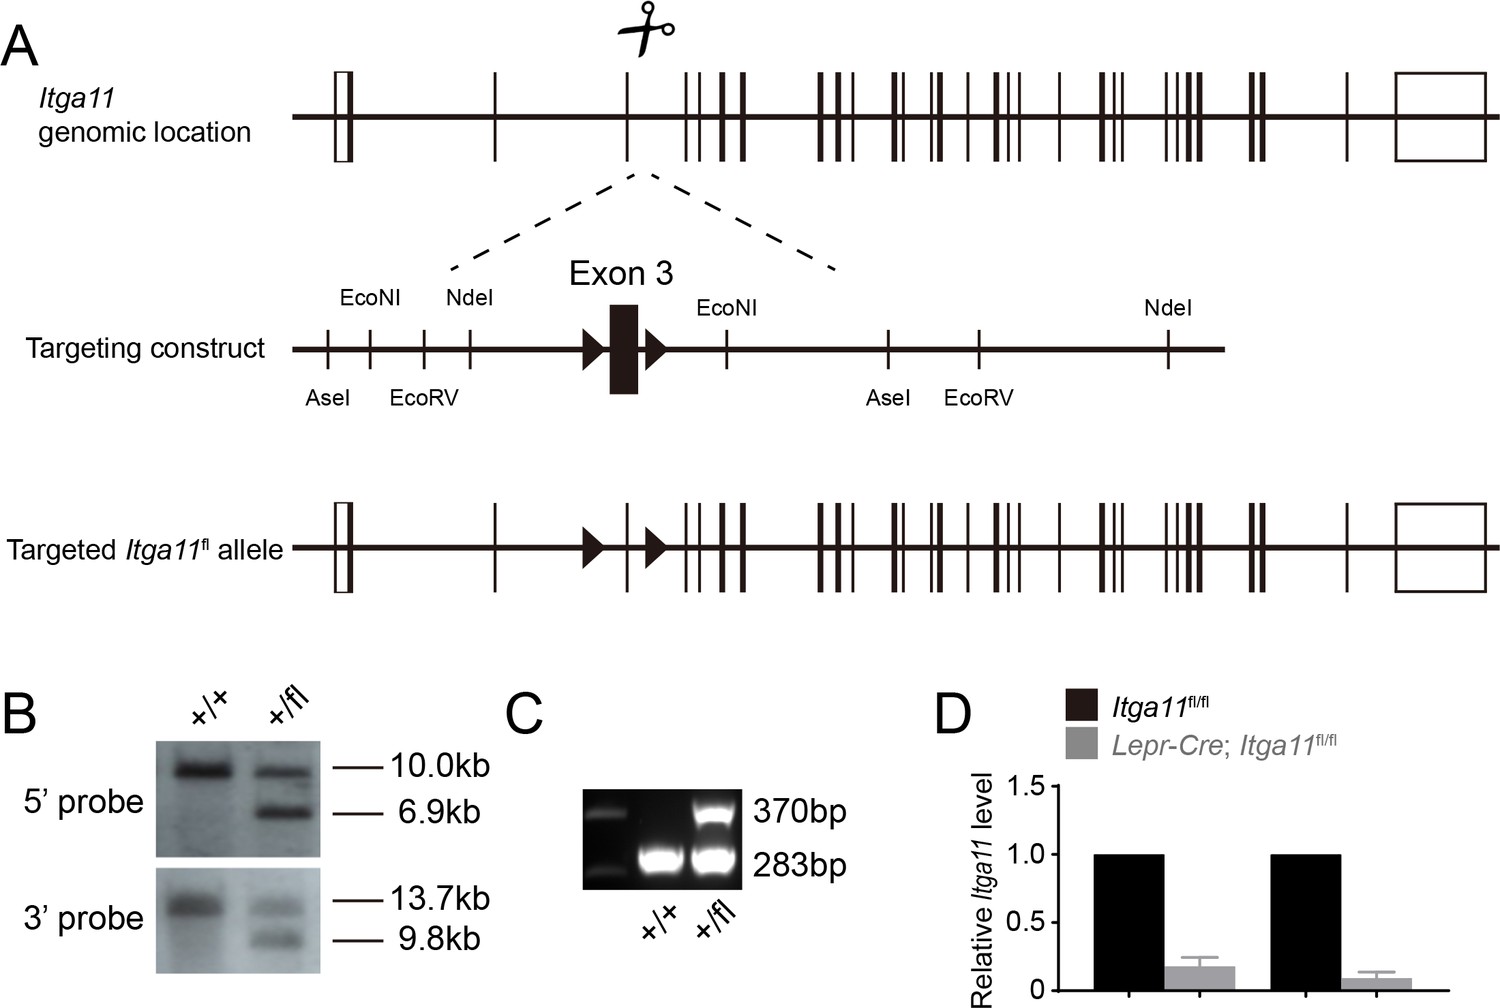
Generation of an Itga11 floxed mice.
(A) DNA surrounding Itga11 exon3 was used as homologous arms for recombineering. The recombineering plasmid was modified by inserting loxP sites flanking exon3. Deletion of exon three leads to a frame shift that would be expected to give a complete loss of α11 function (Popova et al., 2007). The loxP insertion sites were chosen so as not to disrupt sequences conserved among species. Cas9 mRNA, sgRNAs, and the recombineering plasmid were microinjected into C57BL/Ka zygotes. Correctly-targeted founder mice (F0) were identified by Southern blotting (B) using an internal (3’) probe and an external (5’) probe to ensure the recombineering vector was integrated in the correct genomic location, and not in other regions of the genome. Mice were backcrossed at least three times onto a C57BL/Ka background before analysis. (C) PCR genotyping demonstrated germline transmission of the Itga11flox allele. (D) qRT-PCR analysis of Itga11 transcript levels in LepR+ cells from the bone marrow of Lepr-Cre; Itga11fl/fl and sex-matched littermate controls (n = 4 mice per genotype per time point from two independent experiments). All numerical data reflect mean ±standard deviation.
-
Figure 5—figure supplement 1—source data 1
Data for Figure 5—figure supplement 1.
- https://doi.org/10.7554/eLife.42274.014
Figure 6
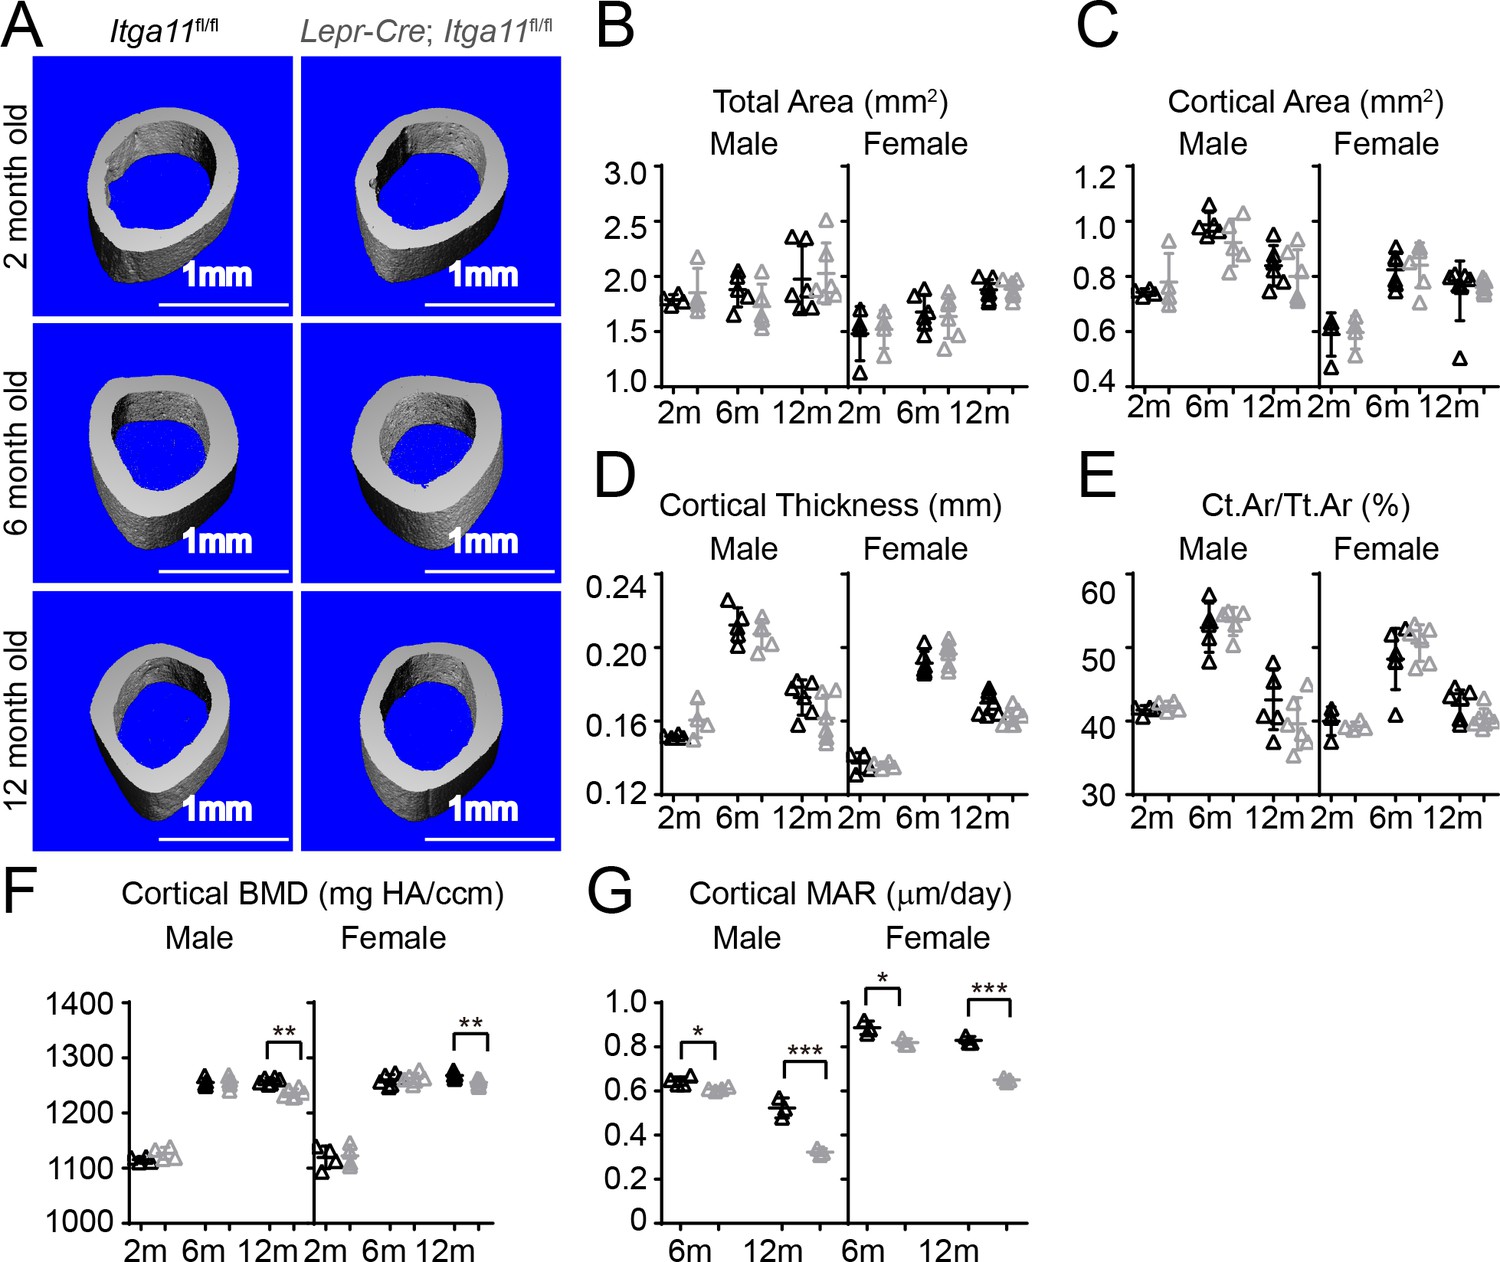
Conditional Itga11 deletion from LepR+cells reduces cortical bone formation in adult mice.
(A) Representative microCT images of cortical bone in the mid-femur diaphysis of male Lepr-Cre; Itga11fl/fl mice and littermate controls at 2, 6, and 12 months of age. (B–F) microCT analysis of the total area (B), cortical area (C), cortical thickness (D), cortical area/total area (E), and cortical bone mineral density (F) in the mid-femur diaphysis of Lepr-Cre; Itga11fl/fl mice and sex-matched littermate controls at 2, 6, and 12 months of age (n = 4–7 mice per genotype per sex per time point from at least three independent experiments). (G) Cortical bone mineral apposition rate based on calcein double labelling in the mid-femur diaphysis (n = 3–4 mice per genotype per sex per time point from three independent experiments). All numerical data reflect mean ±standard deviation. The statistical significance of differences was determined with two-way ANOVAs with Sidak’s multiple comparisons tests.
-
Figure 6—source data 1
Data for Figure 6.
- https://doi.org/10.7554/eLife.42274.016
Figure 7 with 1 supplement
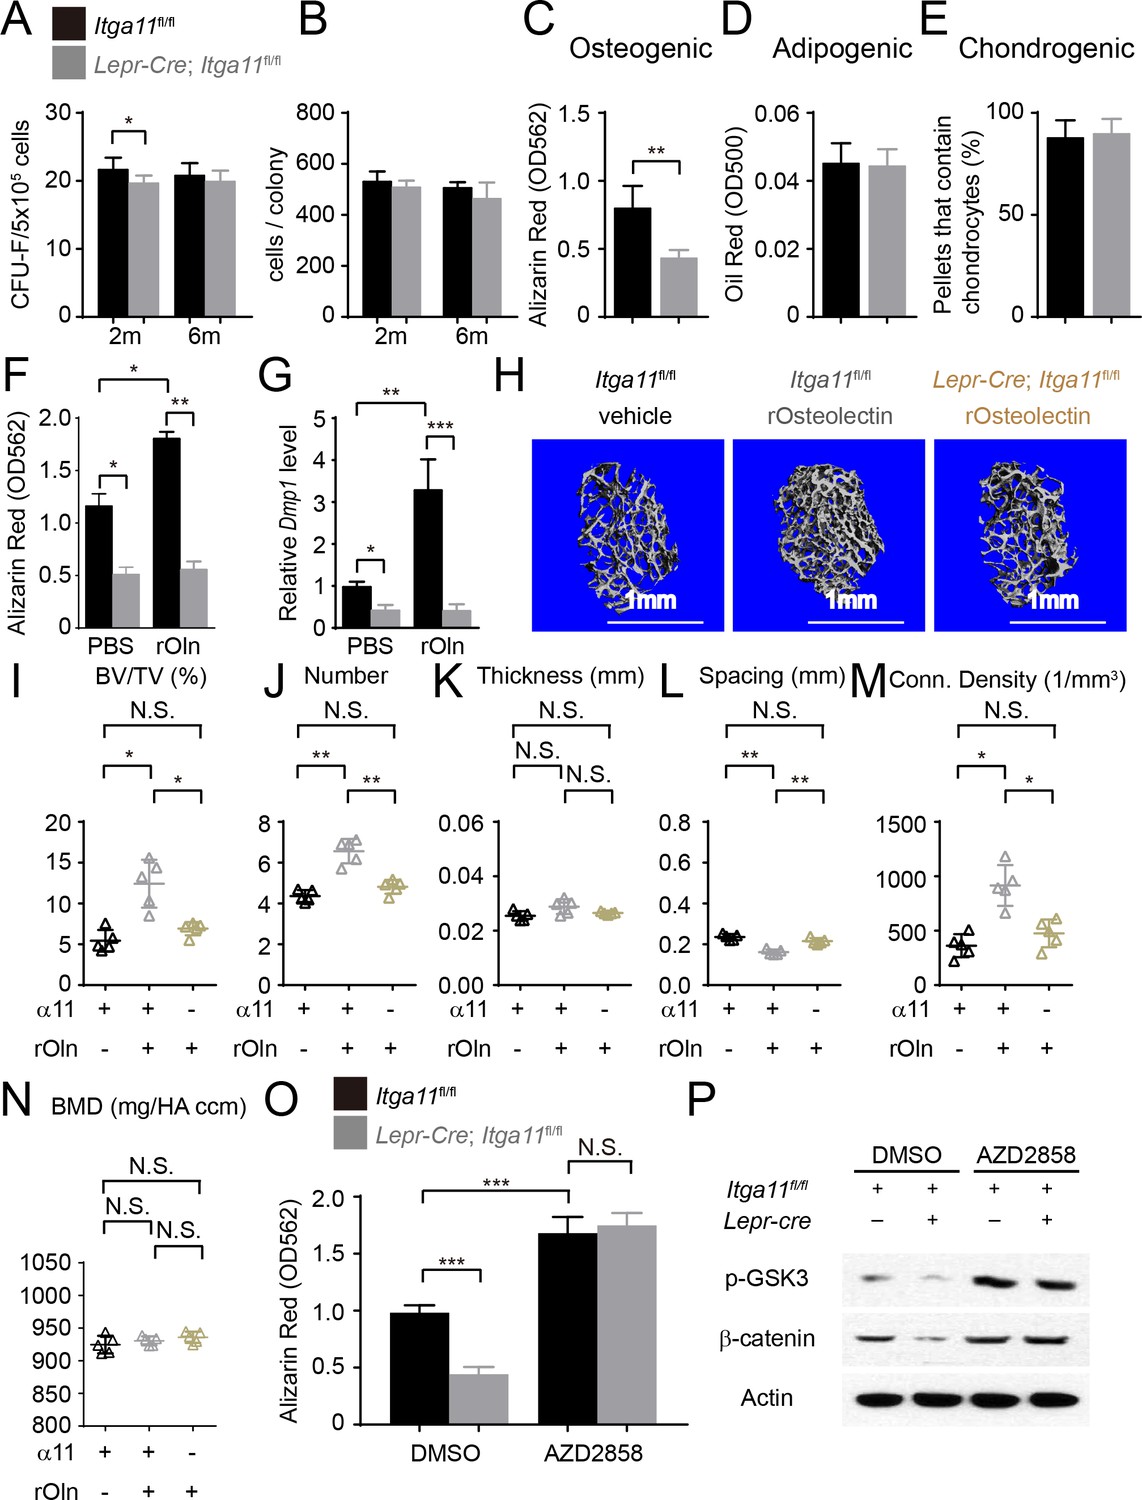
Integrin α11 is required by bone marrow stromal cells to undergo osteogenesis in response to Osteolectin.
(A) CFU-F frequency and (B) cells per CFU-F colony formed by bone marrow cells from Lepr-Cre; Itga11fl/fl mice and littermate controls at 2 and 6 months of age (n = 6–8 mice per genotype per time point from at least three independent experiments). (C–E) Osteogenic (C); n = 7 mice per genotype, total, from seven independent experiments), adipogenic (D); n = 6 mice per genotype, total, from six independent experiments), and chondrogenic (E); n = 5 mice per genotype, total, from five independent experiments) differentiation of bone marrow stromal cells cultured from the femurs of Lepr-Cre; Itga11fl/fl mice and sex-matched littermate controls at 2 months of age. (F) Recombinant mouse Osteolectin promoted osteogenic differentiation in culture by femur bone marrow stromal cells from control but not Lepr-Cre; Itga11fl/fl mice (n = 3 mice per genotype, total, from three independent experiments). (G) qRT-PCR analysis of Dmp1 transcript levels in cells from panel (F). (H–N) Subcutaneous injection of recombinant mouse Osteolectin daily for 28 days (50 μg/kg body mass/day) significantly increased trabecular bone volume and number in female control mice but not female Lepr-Cre; Itga11fl/fl mice. (H) Representative microCT images of trabecular bone in the distal femur metaphysis. (I–N) microCT analysis of trabecular bone volume/total volume (I), trabecular number (J), trabecular thickness (K), trabecular spacing (L), connectivity density (M), and bone mineral density (N) in the distal femur metaphysis (n = 5 mice per treatment, total, from three independent experiments). (O) The GSK3 inhibitor, AZD2858, rescued the osteogenic differentiation in culture of bone marrow stromal cells from the femurs of Lepr-Cre; Itga11fl/fl mice (n = 6 independent experiments in which cells from one mouse of each genotype were cultured in each experiment). (P) Western blotting of cultured cell lysates showed that AZD2858 promoted GSK3 phosphorylation and increased β-catenin levels in bone marrow stromal cells from Lepr-Cre; Itga11fl/fl mice and littermate controls. All numerical data reflect mean ±standard deviation. The statistical significance of differences was determined with Wilcoxon’s test followed by Holm-Sidak multiple comparisons adjustment (A and B), one-way (F), (G,) and O) ANOVAs with Sidak’s multiple comparisons tests, by paired t-tests (C–E), or by one-way ANOVAs with Tukey’s multiple comparisons tests (I–N).
-
Figure 7—source data 1
Data for Figure 7.
- https://doi.org/10.7554/eLife.42274.018
Figure 7—figure supplement 1
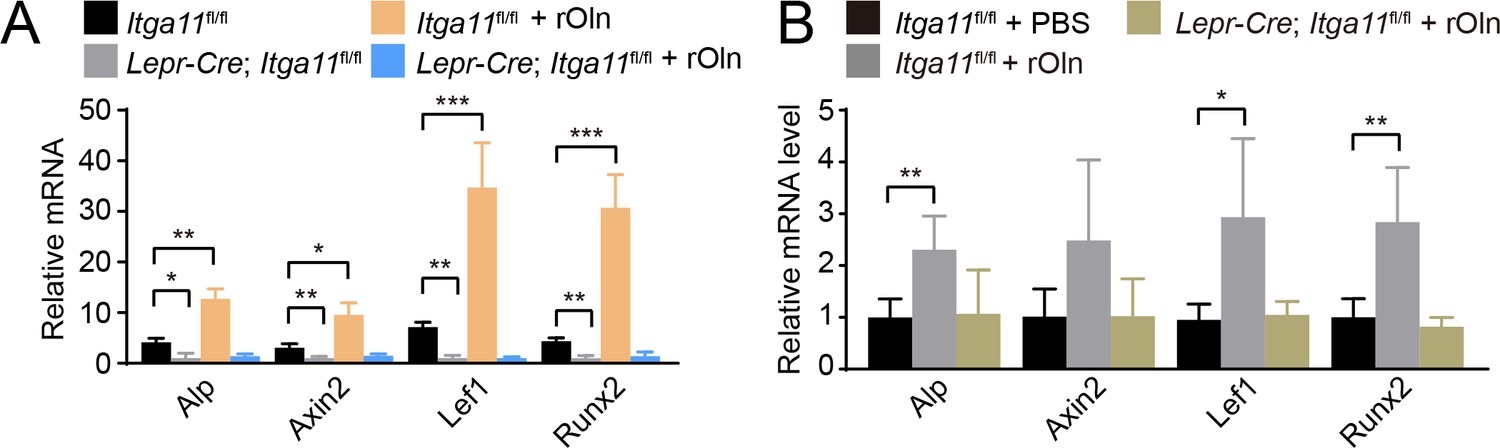
Osteolectin promotes Wnt target gene transcription in mouse bone marrow stromal cells in an integrin α11-dependent manner.
(A) Bone marrow stromal cells from Lepr-Cre; Itga11fl/fl mice and sex-matched littermates at 2 months of age were cultured in osteogenic differentiation medium supplemented with PBS (control) or 30 ng/ml Osteolectin and qRT-PCR analysis of Wnt target gene transcript levels was performed 24 hr later (n = 3 independent experiments). (B) Recombinant mouse Osteolectin subcutaneously injected daily for 28 days (50 μg/kg body mass/day) increased Wnt target gene transcript levels in LepR+ bone marrow cells from control, but not Lepr-Cre; Itga11fl/fl, mice (n = 4 mice per genotype per time point from two independent experiments). All numerical data reflect mean ±standard deviation. Statistical significance was assessed with two-way ANOVAs with Tukey’s multiple comparisons tests (A) or Dunnett’s multiple comparisons tests (B).
-
Figure 7—figure supplement 1—source data 1
Data for Figure 7—figure supplement 1.
- https://doi.org/10.7554/eLife.42274.020
Tables
Key resources table
| Reagent type (species) or resource | Designation | Source or reference | Identifiers | Additional information |
|---|---|---|---|---|
| Genetic reagent(M.musculus) | Osteolectin-/- | PMID: 27976999 | ||
| Genetic reagent (M.musculus) | Lepr-Cre | PMID: 11283374 | JAX Stock (008320) | |
| Antibody | rabbit polyclonal anti-phospho-PI3 Kinase | Cell Signaling | 4228S | (1:1000) |
| Antibody | rabbit polyclonal anti-phospho-Akt (Ser473) | Cell Signaling | 4060S | (1:1000) |
| Antibody | rabbit polyclonal anti-phospho-GSK-3α/β | Cell Signaling | 9331S | (1:1000) |
| Antibody | rabbit polyclonal anti-β-Catenin | Cell Signaling | 8480S | (1:1000) |
| Antibody | rabbit polyclonal anti-anti-β-Actin | Cell Signaling | 8457S | (1:10000) |
| Antibody | rabbit polyclonal anti-GSK-3b | Cell Signaling | 9315S | (1:1000) |
| Antibody | goat polyclonal anti-rabbit IgG, HRP-linked antibody | Cell Signaling | 7074S | (1:5000) |
| Antibody | horse polyclonal anti-mouse IgG, HRP-linked antibody | Cell Signaling | 7076S | (1:5000) |
| Antibody | donkey polyclonal anti-sheep IgG, HRP-linked antibody | R and D Systems | HAF016 | (1:5000) |
| Antibody | rabbit polyclonal anti-phospho-FAK (Y397) | Cell Signaling | 3283S | (1:1000) |
| Antibody | rabbit polyclonal anti-Histone H3 | Cell Signaling | 4499S | (1:5000) |
| Antibody | goat polyclonal anti-mouse Osteolectin | R and D Systems | AF3729 | (1:1000) |
| Antibody | sheep polyclonal anti-human Osteolectin | R and D Systems | AF1904 | (1:1000) |
| Antibody | rabbit polyclonal anti-Adiponectin | Abcam | ab181699 | (1:1000) |
| Antibody | rabbit polyclonal anti-Integrin α11 | Abcam | ab198826 | (1:1000) |
| Antibody | rabbit polyclonal anti-FAK | Cell Signaling | 3285P | (1:1000) |
| Antibody | mouse monoclonal anti-6x-His Tag antibody | Thermo Fisher Scientific | MA1-135 | (1:1000) |
| Antibody | rat polyclonal anti-CD45-APC | Tonbo | 20–0451 | (1:200) |
| Antibody | rat polyclonal anti-Ter119-APC | Tonbo | 20–5921 | (1:200) |
| Antibody | rat polyclonal anti-CD31-APC | Biolegend | 102410 | (1:200) |
| Antibody | goat polyclonal anti-Mouse Leptin R, Biotin | R and D Systems | AF497 | (1:200) |
| Antibody | mouse monoclonal anti-Streptavidin PE | Biolegend | 410504 | (1:500) |
| Peptide, recombinant protein | Bovine serum albumin | Sigma-Aldrich | A3156 | |
| Peptide, recombinant protein | recombinant human pro-Collagen I α1 | R and D Systems | 6220 CL | |
| Peptide, recombinant protein | recombinant human osteolectin | PMID: 27976999 | ||
| Peptide, recombinant protein | recombinant mouse osteolectin | PMID: 27976999 | ||
| Peptide, recombinant protein | recombiant Integrin α11β1 protein | R and D Systems | 6357-AB | |
| Peptide, recombinant protein | recombiant Integrin α10β1 protein | R and D Systems | 5895-AB | |
| Peptide, recombinant protein | recombiant Integrin αVβ3 protein | R and D Systems | 3050-AV | |
| Peptide, recombinant protein | recombiant Integrin αVβ1 Protein | R and D Systems | 6579-AV | |
| Peptide, recombinant protein | recombiant Integrin α4β1 protein | R and D Systems | 5668-A4 | |
| Peptide, recombinant protein | recombiant Integrin α9β1 protein | R and D Systems | 5438-A9 | |
| Peptide, recombinant protein | recombiant Integrin αIIbβ3 Protein | R and D Systems | 7148-A2 | |
| Peptide, recombinant protein | recombiant Integrin αMβ2 Protein | R and D Systems | 4047-AM | |
| Chemical compound,drug | DAPI | Life Technologies | D1306 | |
| Chemical compound, drug | TRIzol LS Reagent | Invitrogen | 10296028 | |
| Chemical cmpound,drug | Collagenase, Type 1 | Worthington | LS004196 | |
| Chemical compound, drug | Dispase II | Roche Diagnostic | D4693 | |
| Chemical compound, drug | DNase I | Sigma-Aldrich | 10 104 159 001 | |
| Chemical compound, drug | IWR-1-endo | Sigma-Aldrich | 681669 | |
| Chemical compound, drug | AZD2858 | Selleck | S7253 | |
| Chemical compound, drug | Y-27632 Rock inhibitor | Selleck | S1049 | |
| Chemical compound, drug | 4% paraformaldehyde in PBS | Thermo Fisher Scientific | J19943-K2 | |
| Cell lines (M.musculus) | MC3T3-E1, subclone 4 | ATCC | CRL-2593 | |
| Cell lines (H.sapiens) | hBMSC#1 | ATCC | PCS-500–012 | |
| Cell lines (H.sapiens) | hBMSC#2 | Lonza | PT-2501 | |
| Commercial assay or kit | Cell Culture Contamination Detection Kit | Molecular Probes | C-7028 | |
| Commercial assay or kit | TMB stop solution | KPL | 95059–198 | |
| Commercial assay or kit | SureBlue TMB Microwell Peroxidase Substrate | KPL | 95059–282 | |
| Commercial assay or kit | HBSS, without Calcium and Magnesium | Corning | 21022CV | |
| Commercial assay or kit | HBSS, with Calcium and Magnesium | Corning | 21023CV | |
| Commercial assay or kit | CleanCap Cas9 mRNA | TriLink | L-7206 | |
| Commercial assay or kit | MEGAshortscript T7 Transcription Kit | Ambion | AM1354 | |
| Commercial assay or kit | MEGAclear Transcription Clean-Up Kit | Ambion | AM1908 | |
| Commercial assay or kit | EDTA-free Protease Inhibitor Cocktail | Sigma-Aldrich | 11 836 170 001 | |
| Commercial assay or kit | ECL Western Blotting Substrate | Pierce | 32106 | |
| Commercial assay or kit | SuperScript III Reverse Transcriptase | Invitrogen | 18080044 | |
| Commercial assay or kit | StemPro Osteogenesis Differentiation Kit | Gibco | A1007201 | |
| Commercial assay or kit | StemPro Adipogenesis Differentiation Kit | Gibco | A1007001 | |
| Commercial assay or kit | StemPro Chondrogenesis Differentiation Kit | Gibco | A1007101 | |
| Commercial assay or kit | MicroVue DPD ELISA Kit | Quidel | 8007 | |
| Commercial assay or kit | MicroVue Creatinine Assay Kit | Quidel | 8009 | |
| Commercial assay or kit | Rat/Mouse PINP ELISA kit | Immunodiagnostic Systems | AC-33F1 | |
| Commercial assay or kit | Nuclear/Cytosol Fractionation Kit | Biovision | K266 | |
| Other | Fetal bovine serum | Sigma-Aldrich | F2442 | |
| Other | Penicillin Streptomycin 100x solution | HyClone | SV3001 | |
| Other | DMEM, low glucose | Gibco | 11885084 | |
| Other | DMEM, high glucose | Gibco | D5671 |
Author response table 1
RNA-seq analysis of LepR+ cells from non-irradiated bone marrow as well as hematopoietic cells and unfractionated cells from irradiated bone marrow (which are high in adipocytes).
Itga11 is poorly expressed in adipocyte-rich bone marrow cells after irradiation (all data represent average FPKM values from multiple replicates).
| Cell type | Adipoq | Fabp4 | Plin1 | Itga11 | Osteolectin |
| LepR+ cells from bone marrow | 835 | 23 | 1.2 | 34 | 37 |
| Hematopoietic cells from irradiated bone marrow | 1.8 | 13 | 0.3 | 0.1 | 0.2 |
| Whole bone marrow cells after irradiation (high in adipocytes) | 92 | 1016 | 68 | 2.2 | 2.8 |
Additional files
-
Supplementary file 1
Markers used for the flow cytometric isolation of bone marrow cell populations.
Stem and progenitor cell populations were isolated from mouse bone marrow by flow cytometry using the listed markers. Lineage (Lin) markers used to isolate Lineage negative cell populations were CD2, CD3, CD5, CD8, Ter119, Gr-1, and B220.
- https://doi.org/10.7554/eLife.42274.021
-
Transparent reporting form
- https://doi.org/10.7554/eLife.42274.022
Download links
A two-part list of links to download the article, or parts of the article, in various formats.
Downloads (link to download the article as PDF)
Open citations (links to open the citations from this article in various online reference manager services)
Cite this article (links to download the citations from this article in formats compatible with various reference manager tools)
Integrin alpha11 is an Osteolectin receptor and is required for the maintenance of adult skeletal bone mass
eLife 8:e42274.
https://doi.org/10.7554/eLife.42274


