A bipartite iron-dependent transcriptional regulation of the tryptophan salvage pathway in Chlamydia trachomatis
- Washington State University, United States
Figures
Figure 1 with 1 supplement
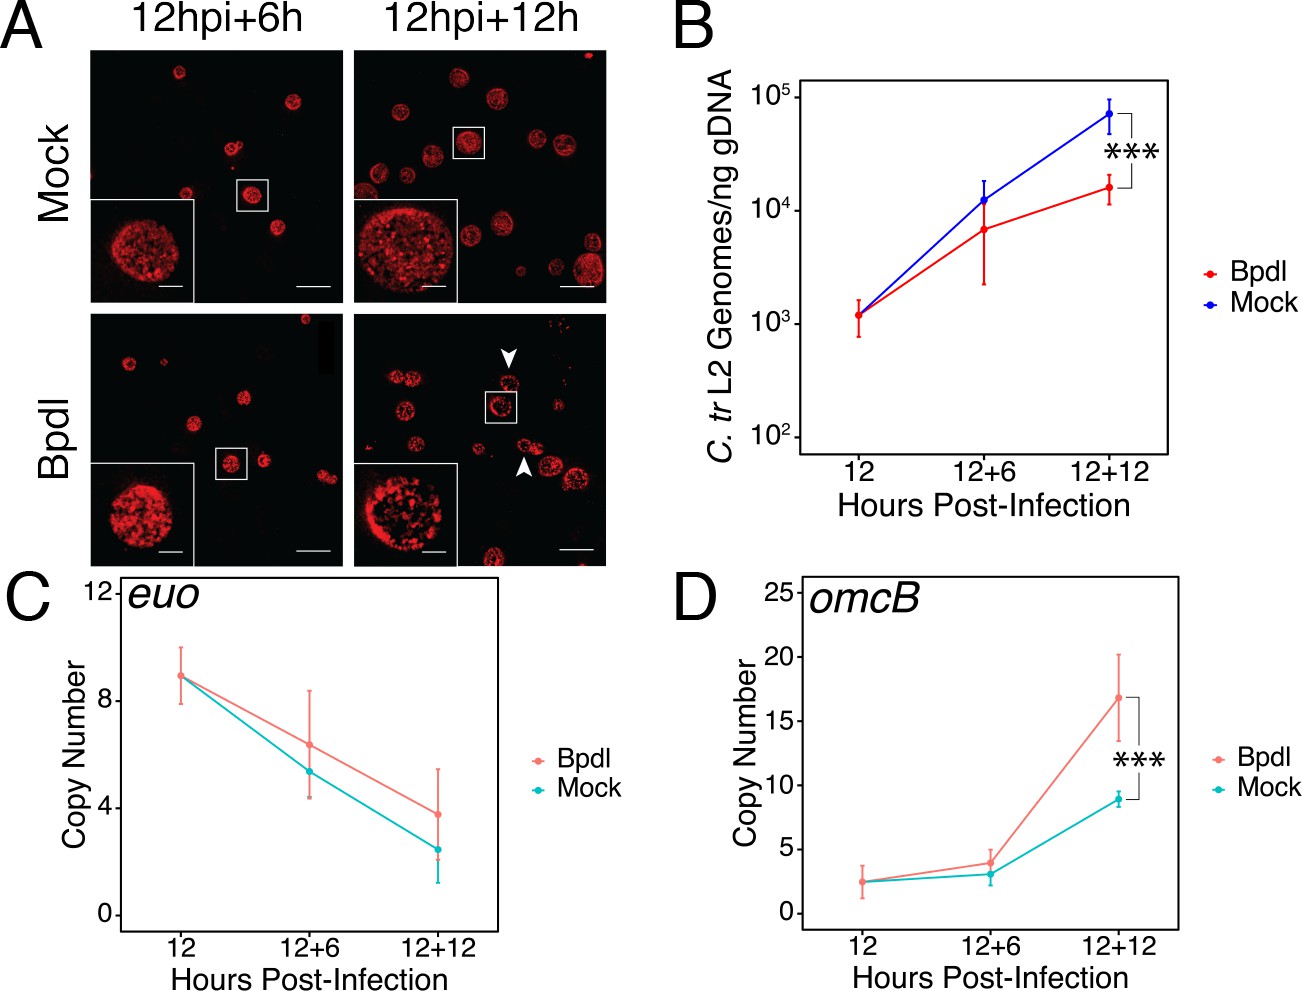
Brief iron limitation via 2,2-bipyridyl treatment precedes the onset of characteristic chlamydial persistence.
(A) C. trachomatis L2-infected HeLa cells were fixed and stained with convalescent human sera to image inclusion morphology by confocal microscopy following Bpdl treatment at the indicated times post-infection. Arrowheads indicate inclusions with visibly fewer organisms in the 12 hr Bpdl-treated condition. Figure shows representative experiment of three biological replicates. Scale bar = 25 μm, Inset scale bar = 5 μm. (B) Genomic DNA (gDNA) was harvested from infected HeLa cells at the indicated times post-infection under iron-replete (blue) and -depleted (red) conditions. Chlamydial genome copy number was quantified by qPCR. Chlamydial genome replication is stalled following 12 hr of Bpdl treatment, but not 6. N = 3. (C) Total RNA was harvested from infected HeLa cells at the indicated times post-infection under iron-replete (teal) and -depleted (orange) conditions. The transcript abundance of hallmark persistence genes euo and (D) omcB were quantified by RT-qPCR and normalized against genome copy number. Only at 12 hr of Bpdl treatment is omcB expression significantly affected. N = 3. Statistical significance was determined by One-Way ANOVA followed by post-hoc pairwise t-tests with Bonferroni’s correction for multiple comparisons. *=p < 0.05, **=p < 0.01, ***=p < 0.005.
-
Figure 1—source data 1
Source data for Figure 1A–D, Figure 1—figure supplement 1.
- https://doi.org/10.7554/eLife.42295.005
Figure 1—figure supplement 1
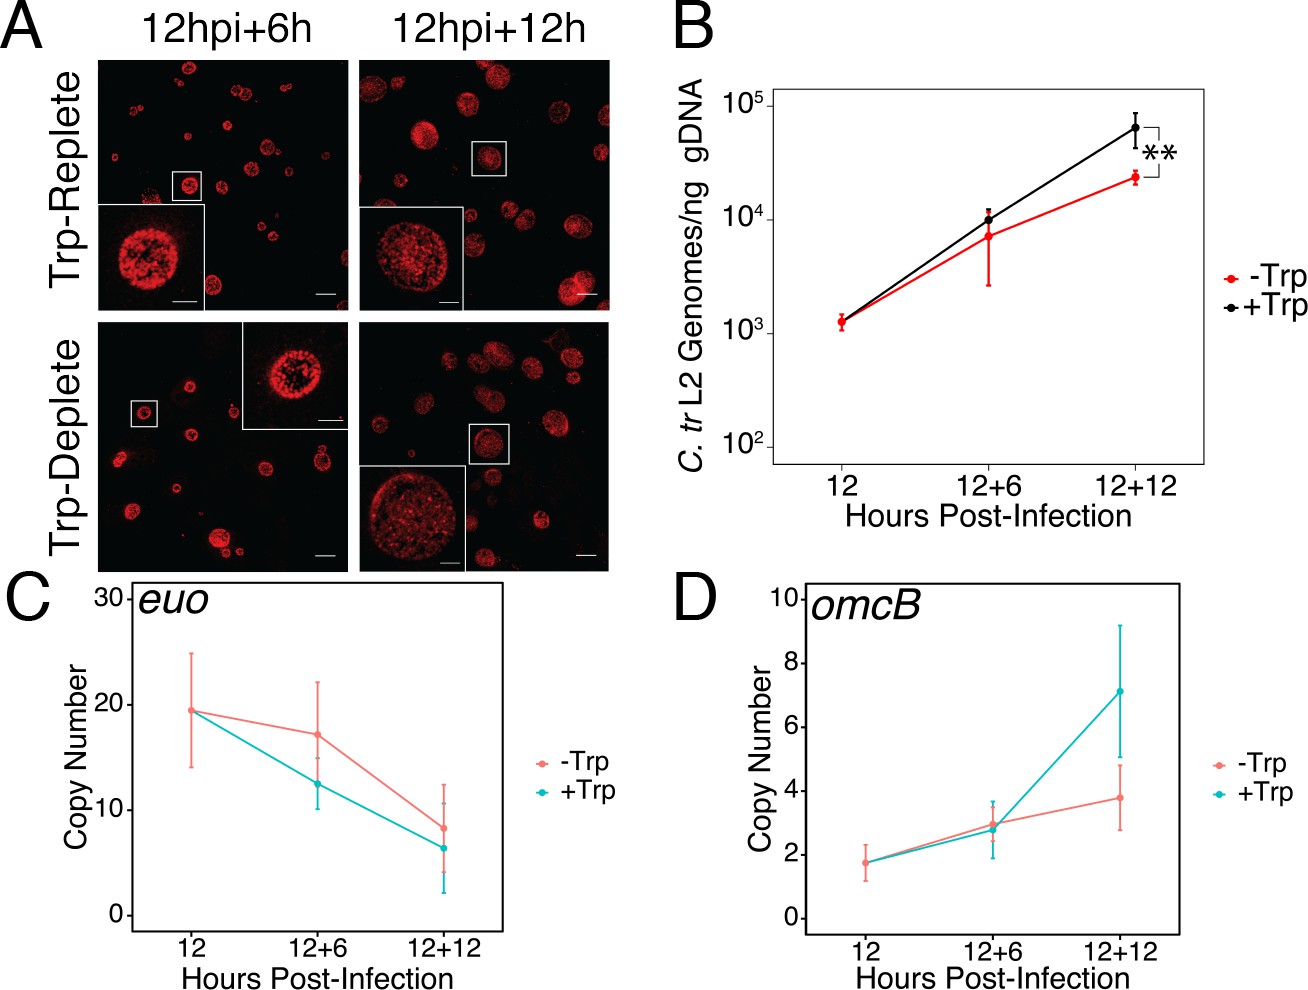
Brief media-defined tryptophan limitation does not produce characteristically persistent Chlamydia.
(A) C. trachomatis L2-infected HeLa cells were fixed and stained with convalescent human sera to image inclusion morphology by confocal microscopy following tryptophan limitation at the indicated times post-infection. Figure shows representative experiment of two biological replicates. Scale bar = 15 μm, Inset scale bar = 5 μm. (B) Genomic DNA (gDNA) was harvested from infected HeLa cells at the indicated times post-infection under tryptophan-replete (black) and -depleted (red) conditions. Chlamydial genome copy number was quantified by qPCR. Chlamydial genome replication is stalled following 12 hr of tryptophan limitation, but not 6. N = 3. (C) Total RNA was harvested from infected HeLa cells at the indicated times post-infection under tryptophan-replete (black) and -depleted (red) conditions. The transcript abundance of hallmark persistence genes euo and (D) omcB were quantified by RT-qPCR and normalized against genome copy number. No period of tryptophan limitation significantly impacted euo or omcB expression. N = 3. Statistical significance was determined by One-Way ANOVA followed by post-hoc pairwise t-tests with Bonferroni’s correction for multiple comparisons.
Figure 2
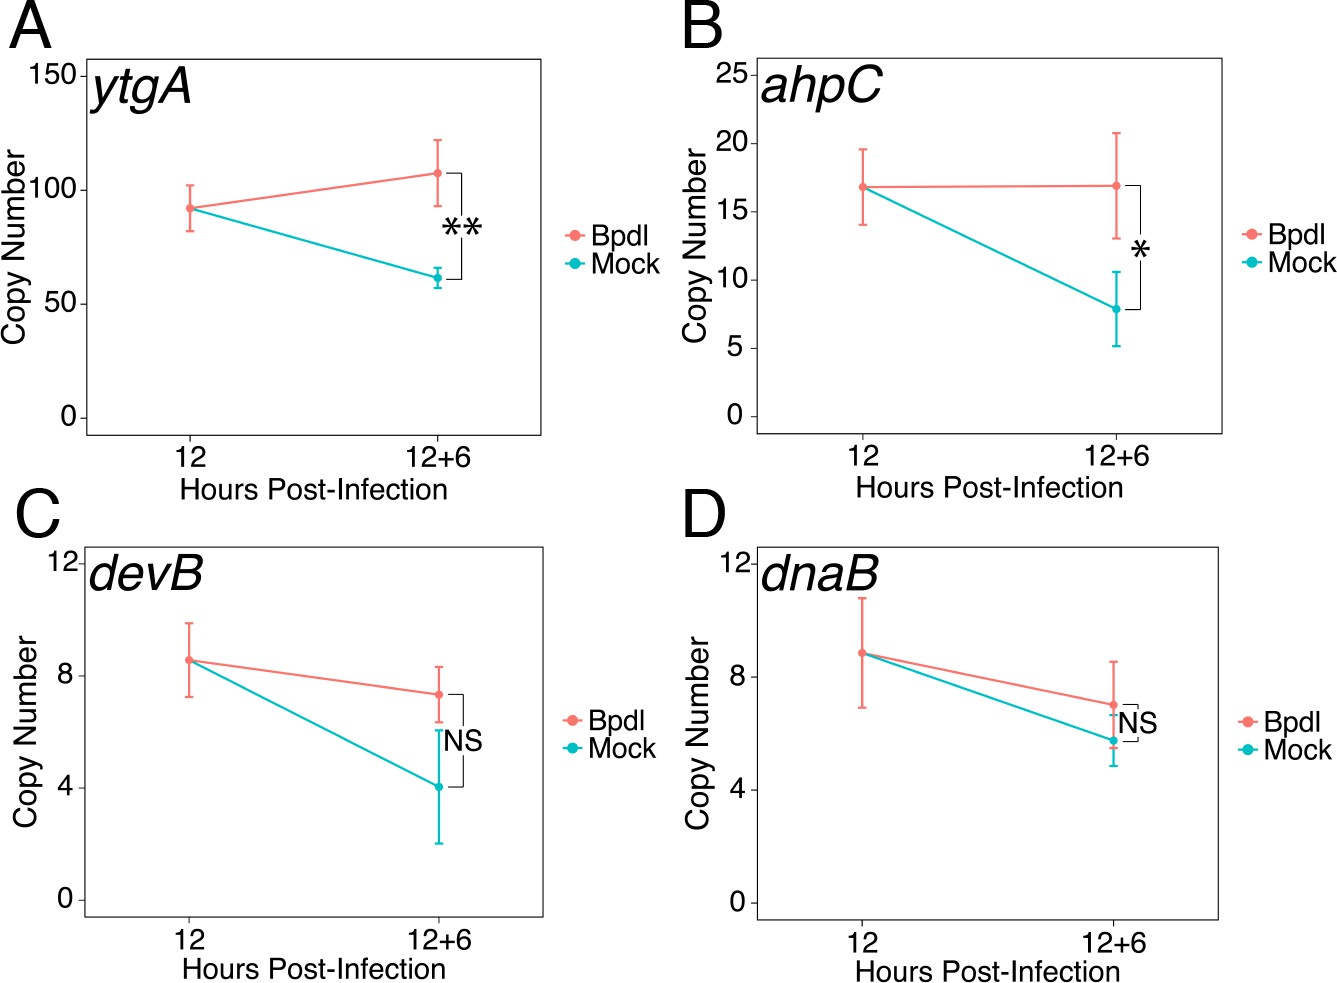
Brief iron limitation condition produces mild iron-starved transcriptional phenotype.
(A) Total RNA and gDNA was harvested from infected HeLa cells at the indicated times post-infection under iron-replete (teal) and -depleted (orange) conditions. The transcript abundance of iron-regulated ytgA, (B) ahpC, (C) devB and (D) non-iron regulated dnaB were quantified by RT-qPCR and normalized against genome copy number. The transcript expression of ytgA and ahpC were significantly elevated following 6 hr Bpdl treatment, indicative of iron starvation to C. trachomatis. N = 3. Statistical significance was determined by One-Way ANOVA followed by post-hoc pairwise t-tests with Bonferroni’s correction for multiple comparisons. *=p < 0.05, **=p < 0.01, ***=p < 0.005.
-
Figure 2—source data 1
Source data for Figure 2A–D.
- https://doi.org/10.7554/eLife.42295.007
Figure 3

Expression of the trpRBA operon in C.
trachomatis is differentially regulated by brief iron limitation. (A) Cartoon depiction of the trpRBA operon (drawn to scale) with the primary transcriptional start site upstream of trpR annotated. (B) Total RNA and gDNA were harvested from infected HeLa cells at the indicated times post-infection under Trp-replete (black) and -depleted (red) conditions. The transcript expression of trpRBA operon was quantified by RT-qPCR and normalized against genome copy number. All three ORFs are significantly induced relative to 12 hpi following Trp starvation. N = 3. (C) Total RNA and gDNA were harvested from infected HeLa cells at the indicated times post-infection under iron-replete (blue) and -depleted (red) conditions. The transcript expression of trpRBA operon was quantified by RT-qPCR and normalized against genome copy number. Only trpB and trpA expression was significantly induced relative to 12 hpi. N = 3. Statistical significance was determined by One-Way ANOVA followed by post-hoc pairwise t-tests with Bonferroni’s correction for multiple comparisons. *=p < 0.05, **=p < 0.01, ***=p < 0.005.
-
Figure 3—source data 1
Source data for Figure 3B–C.
- https://doi.org/10.7554/eLife.42295.009
Figure 4 with 2 supplements
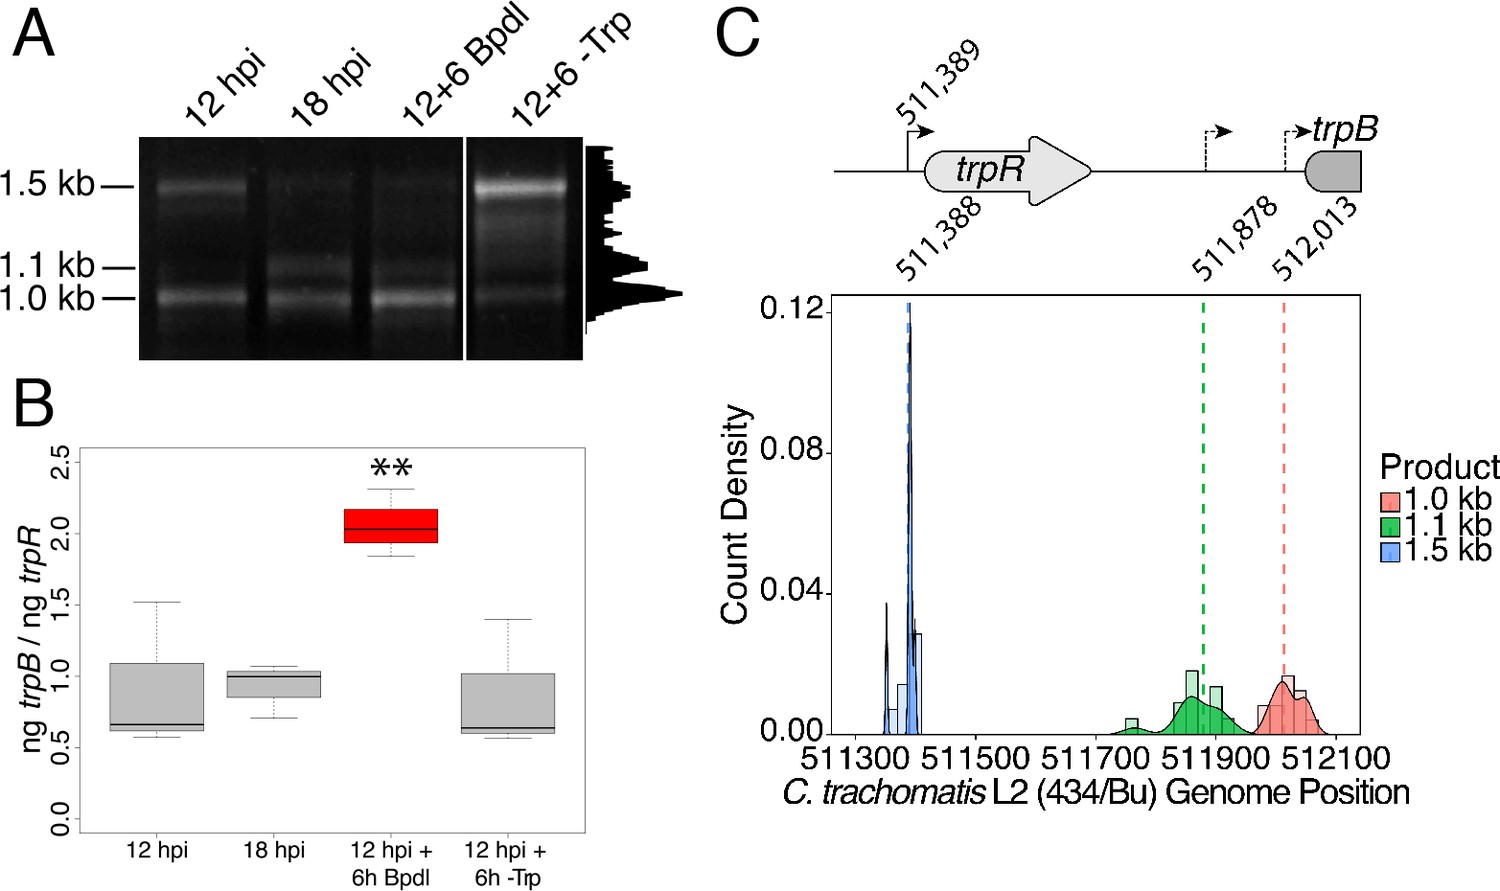
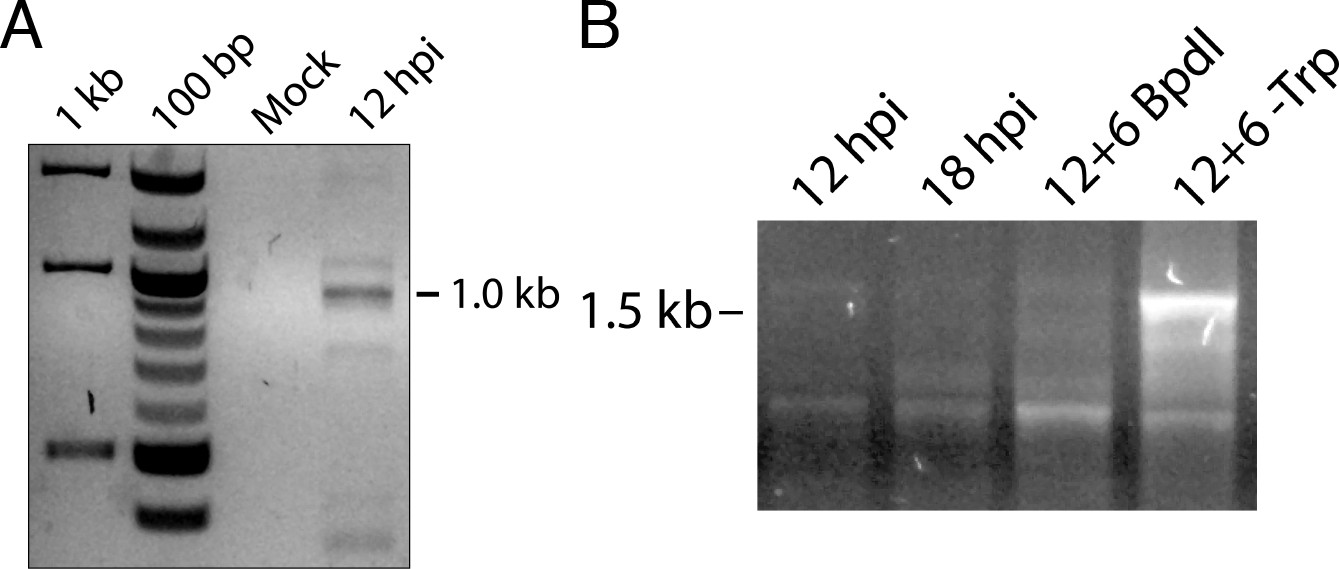
Iron-dependent induction of trpBA expression initiates within the trpRBA intergenic region from a novel alternative transcriptional start site.
(A) Total RNA was harvested from infected HeLa cells at the indicated times post-infection to examine iron-dependent and Trp-dependent changes in the 5’-cDNA profile of the trpRBA operon by Rapid Amplification of 5’ cDNA Ends (5’-RACE). RACE products were separated on an agarose gel, revealing three distinct and specific bands with apparent sizes of 1.5, 1.1 and 1.0 kb. Trp depletion led to the apparent enrichment of the 1.5 kb product, while Bpdl treatment produced a similarly enriched 1.0 kb RACE product. Intensity plot to the right of image was generated using the Fiji Dynamic ROI Profiler plugin to monitor intensity across the 18 hpi condition. Figure shows representative experiment of three biological replicates. (B) To confirm that iron-dependent induction of trpBA could originate from alternative transcription initiation, RT-qPCR was performed on 5’-RACE total RNA to quantify the abundance of trpB transcripts relative to trpR. Only under iron-limited conditions were trpB transcripts enriched relative to trpR. N = 3. Statistical significance determined by One-way ANOVA followed by post-hoc pairwise t-tests. *=p < 0.05, **=p < 0.01, ***=p < 0.005. (C) The nucleotide position of the 5’ cDNA ends generated from RACE were mapped to the C. trachomatis L2 434/Bu genome by nucleotide BLAST. Figure displays histogram (semi-continuous; bin width = 20) and overlaid density plot (continuous) distribution of 5’ nucleotide positions generated from each 5’-RACE product. The dotted line represents the weighted mean of the distribution, as indicated by the integer value above each line. The identified alt. TSSs are depicted on the trpRBA operon (drawn to scale) above the plot. At least four clones were sequenced for each RACE product per replicate. N = 3.
-
Figure 4—source data 1
Source data for Figure 4B.
- https://doi.org/10.7554/eLife.42295.013
Figure 4—figure supplement 1
5’-RACE conditions produce Chlamydia-specific products that are amplified in primary RACE.
(A) Total RNA harvested from mock-infected HeLa cells was processed for 5’-RACE in parallel with infected samples to determine specificity of amplified products to Chlamydia-infected cells. No RACE products were detected in the mock-infected sample. (B) Primary products amplified from 5’-RACE were electrophoresed on an agarose gel and visualized. Weak bands corresponding to those detected by nested 5’-RACE were observed, with the noted relative abundance of the 1.0 and 1.5 kb products in the Bpdl-treated and Trp-depleted conditions, respectively.
Figure 4—figure supplement 2

Mapping of 5’-RACE products at the individual nucleotide level.
(A) Mapping of the 1.5 kb 5’-RACE product. (B) Mapping of the 1.1 kb 5’-RACE product. (C) Mapping of the 1.0 kb 5’-RACE product.
Figure 5 with 2 supplements
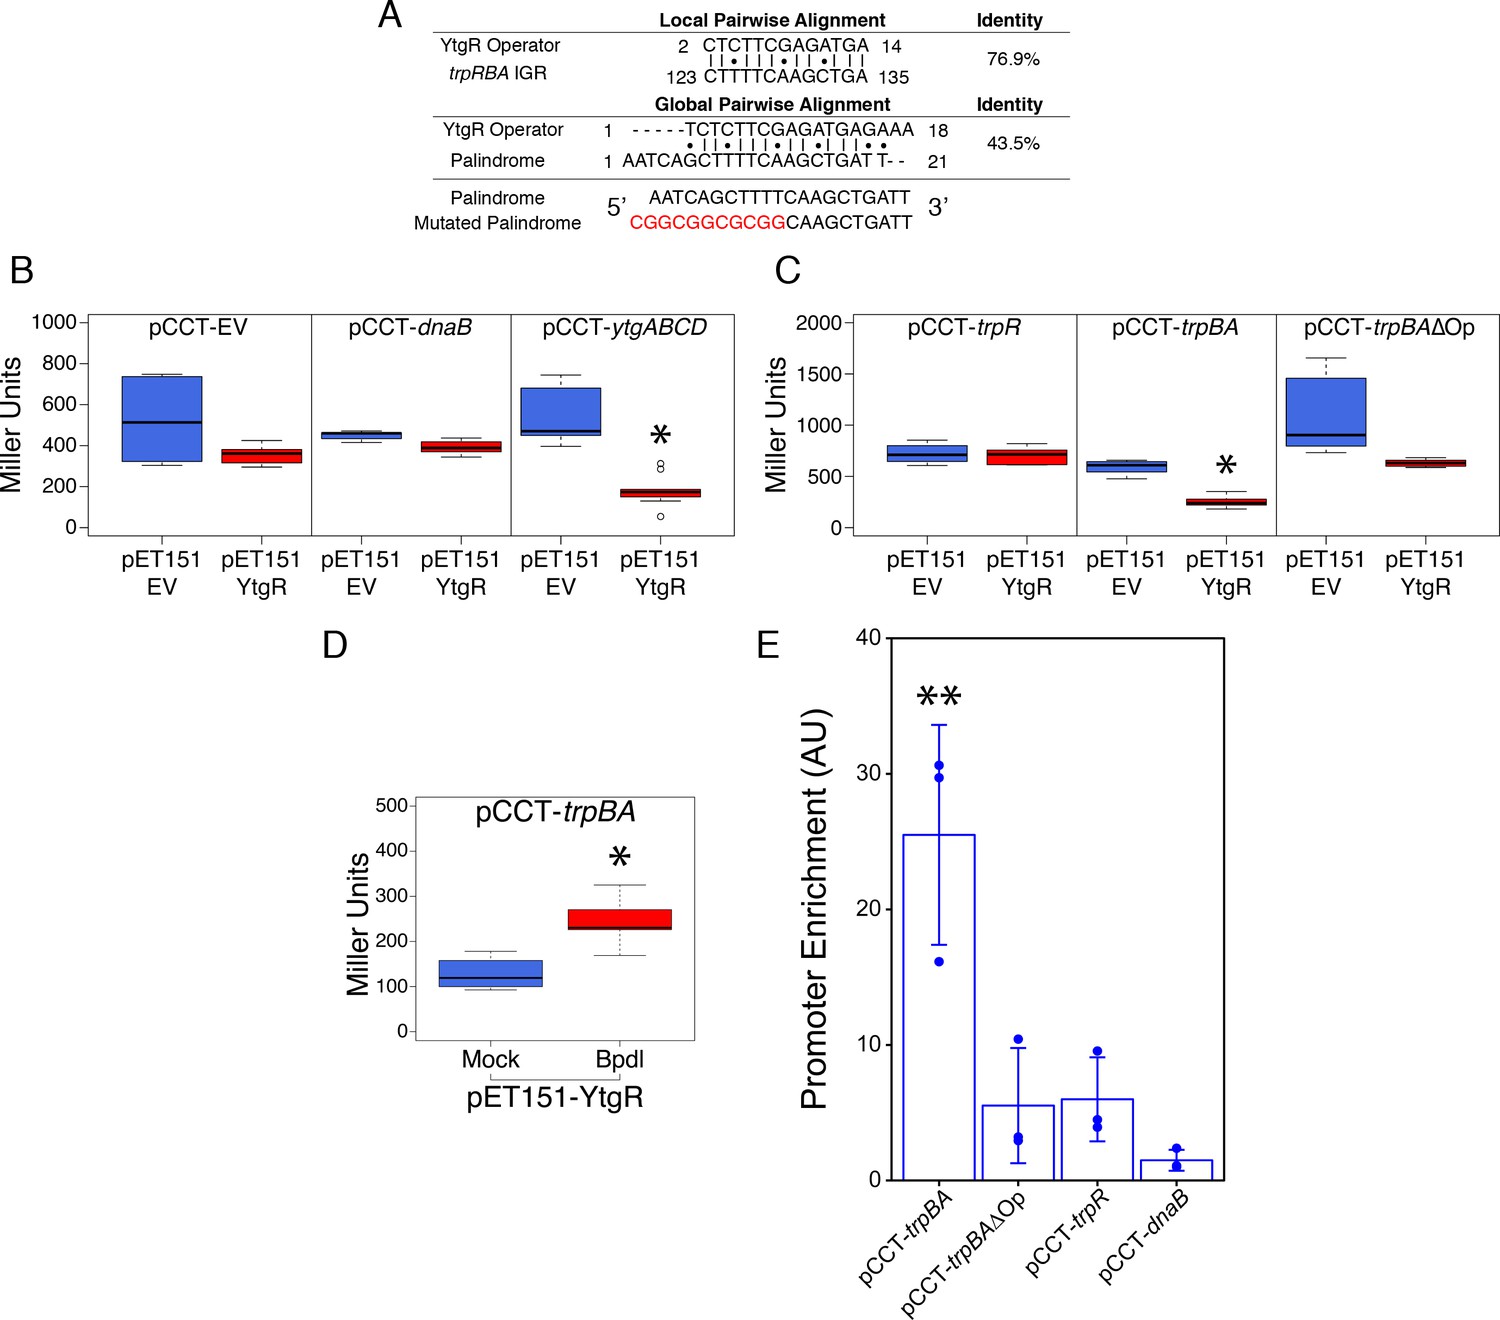
Ectopically expressed YtgR is binds the putative trpBA promoter element in an operator-specific manner to repress transcription in a heterologous in vivo system.
(A) Identification of putative YtgR operator sequence by local and global nucleotide sequence alignment using EMBOSS Water and Needle algorithms, respectively, to align the previously identified YtgR operator to both the trpRBA IGR and palindromic candidate sequence. The palindrome was then mutated in our YtgR repression assay as depicted to abolish palindromicity and AT-richness. (B) Ectopic expression of YtgR significantly represses β-galactosidase activity only from the promoter of its own operon, ytgABCD, and not from an empty vector or the non-iron-regulated promoter of dnaB. N = 3. (C) Expression of recombinant YtgR represses β-galactosidase activity from the putative trpBA promoter element, but not the trpR promoter, and this repression is dependent on the unaltered operator sequence identified in Figure 5A. (D) Bipyridyl-treatment reduces YtgR repressor activity at the trpBA promoter element, consistent with the iron-dependent DNA-binding of YtgR. (E) Immunoprecipitation of YtgR reveals specific and direct interaction with the trpBA promoter that is dependent upon the native operator sequence. N = 3. For the Miller assay, statistical significance was determined by two-sided unpaired Student’s t-test with Welch’s correction for unequal variance. For the ChIP assay, statistical significance was determined by One-Way ANOVA and post-hoc pairwise t-test with Bonferroni’s correction for multiple comparisons. *=p < 0.05, **=p < 0.01, ***=p < 0.005.
-
Figure 5—source data 1
Source data for Figure 5B–E.
- https://doi.org/10.7554/eLife.42295.017
Figure 5—figure supplement 1
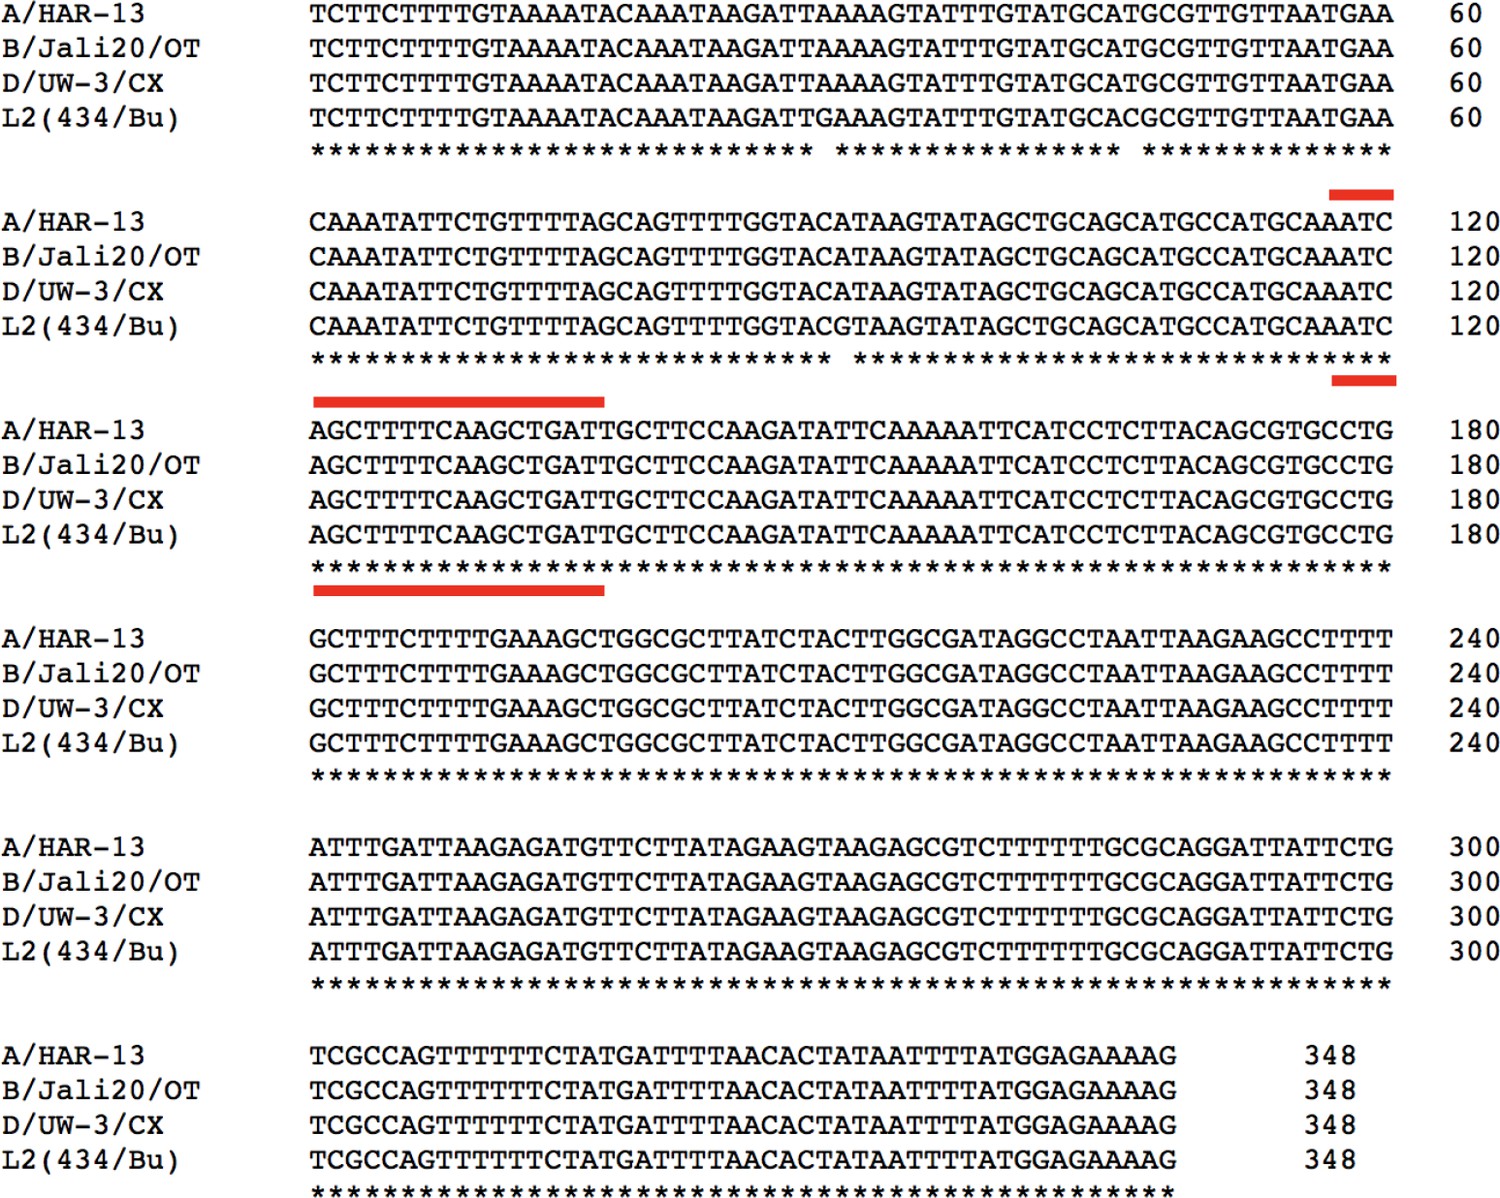
The trpRBA IGR is greater than 99% conserved across ocular, genital and LGV C.
trachomatis serovars at the nucleotide sequence level. Multiple sequence alignment of the trpRBA IGR from C. trachomatis ocular serovars A (A/HAR-13) and B (B/Jali20/OT), genital serovar D (D/UW-3/CX) and LGV serovar L2 (434/Bu) was performed using the CLUSTAL Omega algorithm with default settings. Red outlines indicate the putative YtgR operator sequence.
Figure 5—figure supplement 2
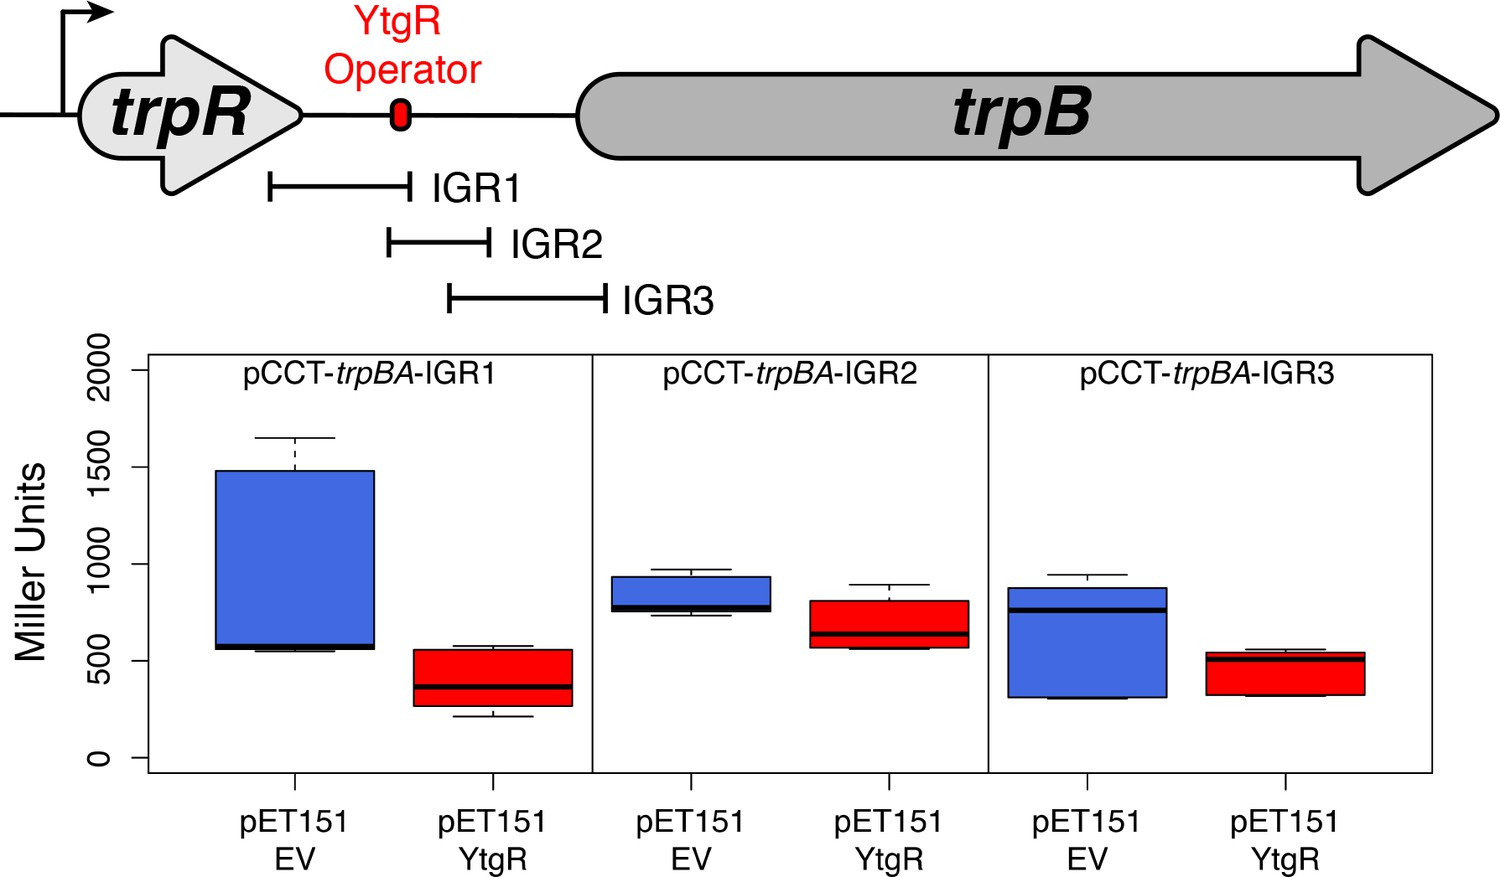
Truncated fragments of the trpRBA IGR are not sufficient to confer YtgR repression phenotype, regardless of the presence of the putative operator site.
The cartoon depiction of the trpRBA operon indicates the position of the IGR fragments cloned into each of the reporter vectors (i.e. pCCT-IGR1 through IGR3). No statistically meaningful differences were detected in the β-galactosidase activity in the presence of any of the IGR fragments.
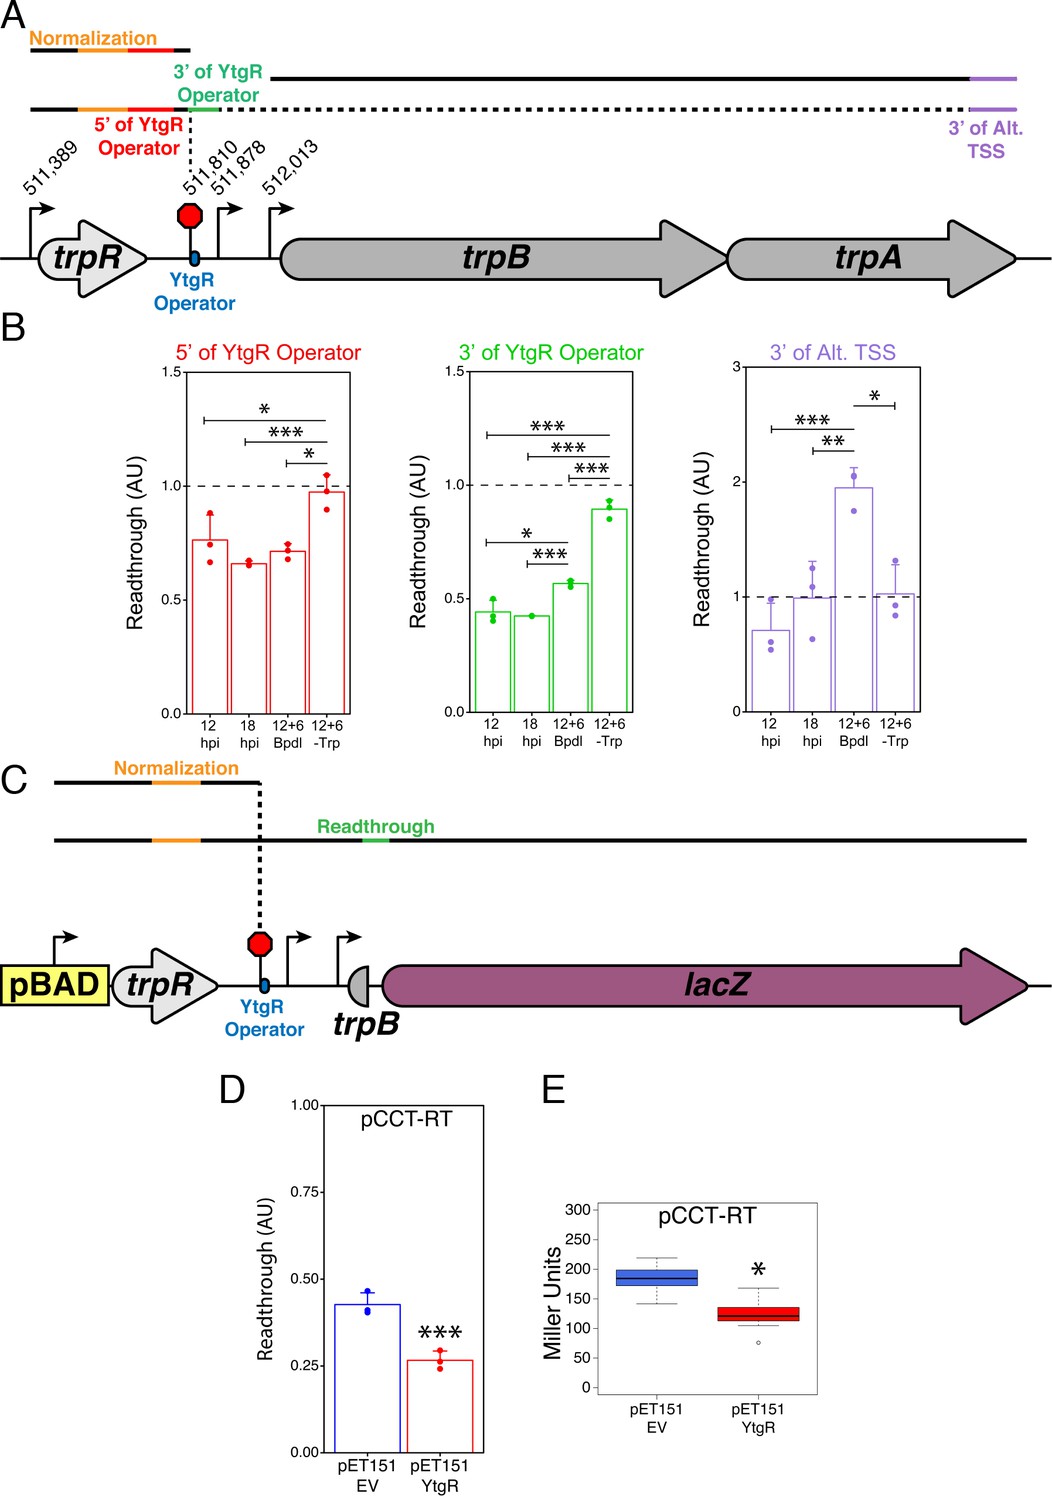
Figure 6 with 4 supplements

Transcription from the primary trpR promoter terminates in the trpRBA IGR at the YtgR operator site.
(A) Coverage map of RNA-Sequencing reads mapped to the C. trachomatis L2/434 Bu genome (NC_010287) edited to contain annotations for IGRs. Read coverage at the trpRBA IGR (IGR_trpB) is increased following Bpdl treatment, but trpR read coverage is not similarly increased. (B) Total RNA was harvested from C. trachomatis-infected HeLa cells to analyze transcript termination landscape downstream of the trpR promoter by 3’-RACE. The top panel displays representative RT-PCR of full-length trpRBA message across experimental conditions (NTC = No Template Control). Bottom panel depicts electrophoresed 3’-RACE products and estimated sizes. Intensity plot to the right of image was generated using the Fiji Dynamic ROI Profiler plugin to monitor intensity across the 18 hpi condition. Note the presence of four distinct peaks, corresponding to each 3’-RACE product. N = 3. (C) 3’-RACE products were sequenced and mapped to the C. trachomatis L2 434/Bu genome by nucleotide BLAST. The figure displays histogram (semi-continuous; bin width = 20) and overlaid density plot (continuous) distribution of 3’ nucleotide positions generated from each 3’-RACE product. The dotted line represents the weighted mean of the distribution, as indicated by the integer value above each line. The identified alt. TTSs are depicted on the trpRBA operon (drawn to scale) above the plot. At least four clones were sequenced for each RACE product per replicate. N = 3.
Figure 6—figure supplement 1
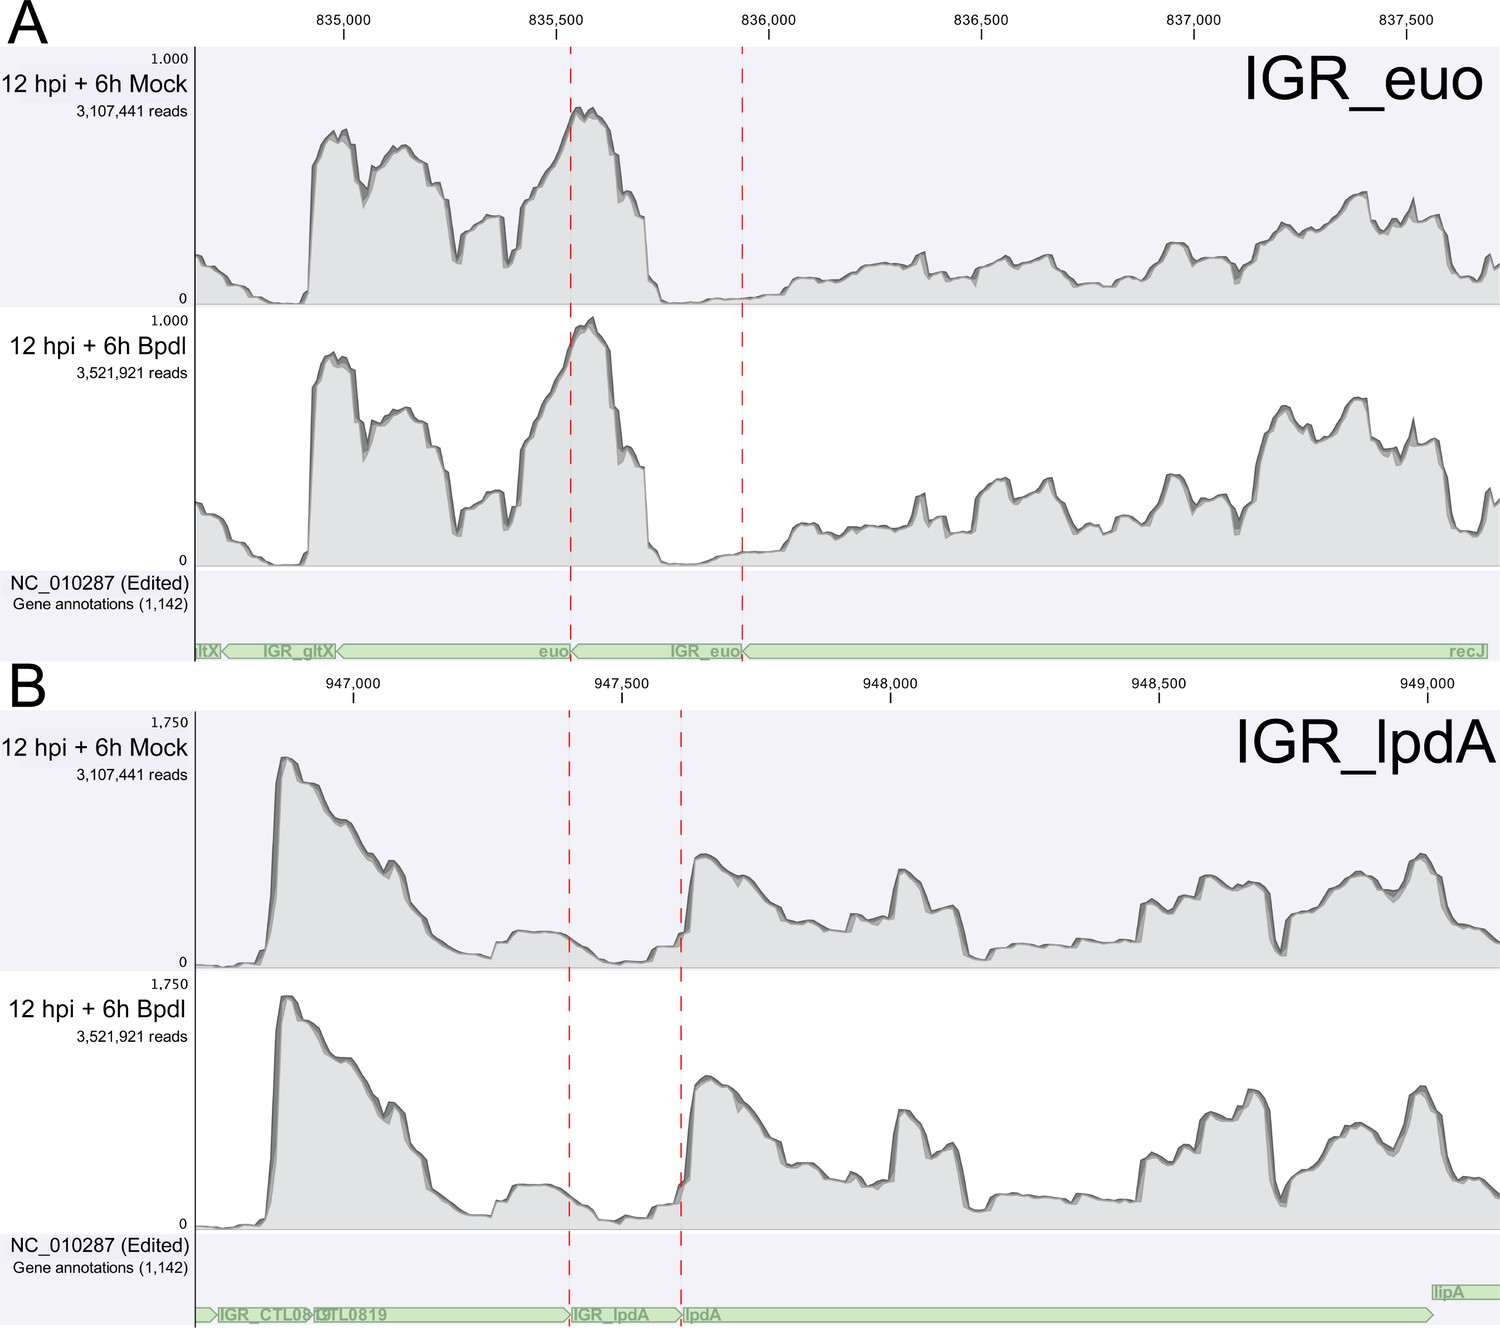
RNA-Sequencing coverage map of reads mapping to the intergenic regions upstream of euo and lpdA.
(A) Coverage map for the IGR upstream of euo, a gene that is neither iron-regulated nor YtgR-regulated. (B) Coverage map for the IGR upstream of lpdA, a gene that is iron-regulated but not YtgR-regulated. Neither coverage map indicates an increase in reads mapping to these intergenic regions, suggesting that the effect observed at the trpRBA IGR is specific.
Figure 6—figure supplement 2
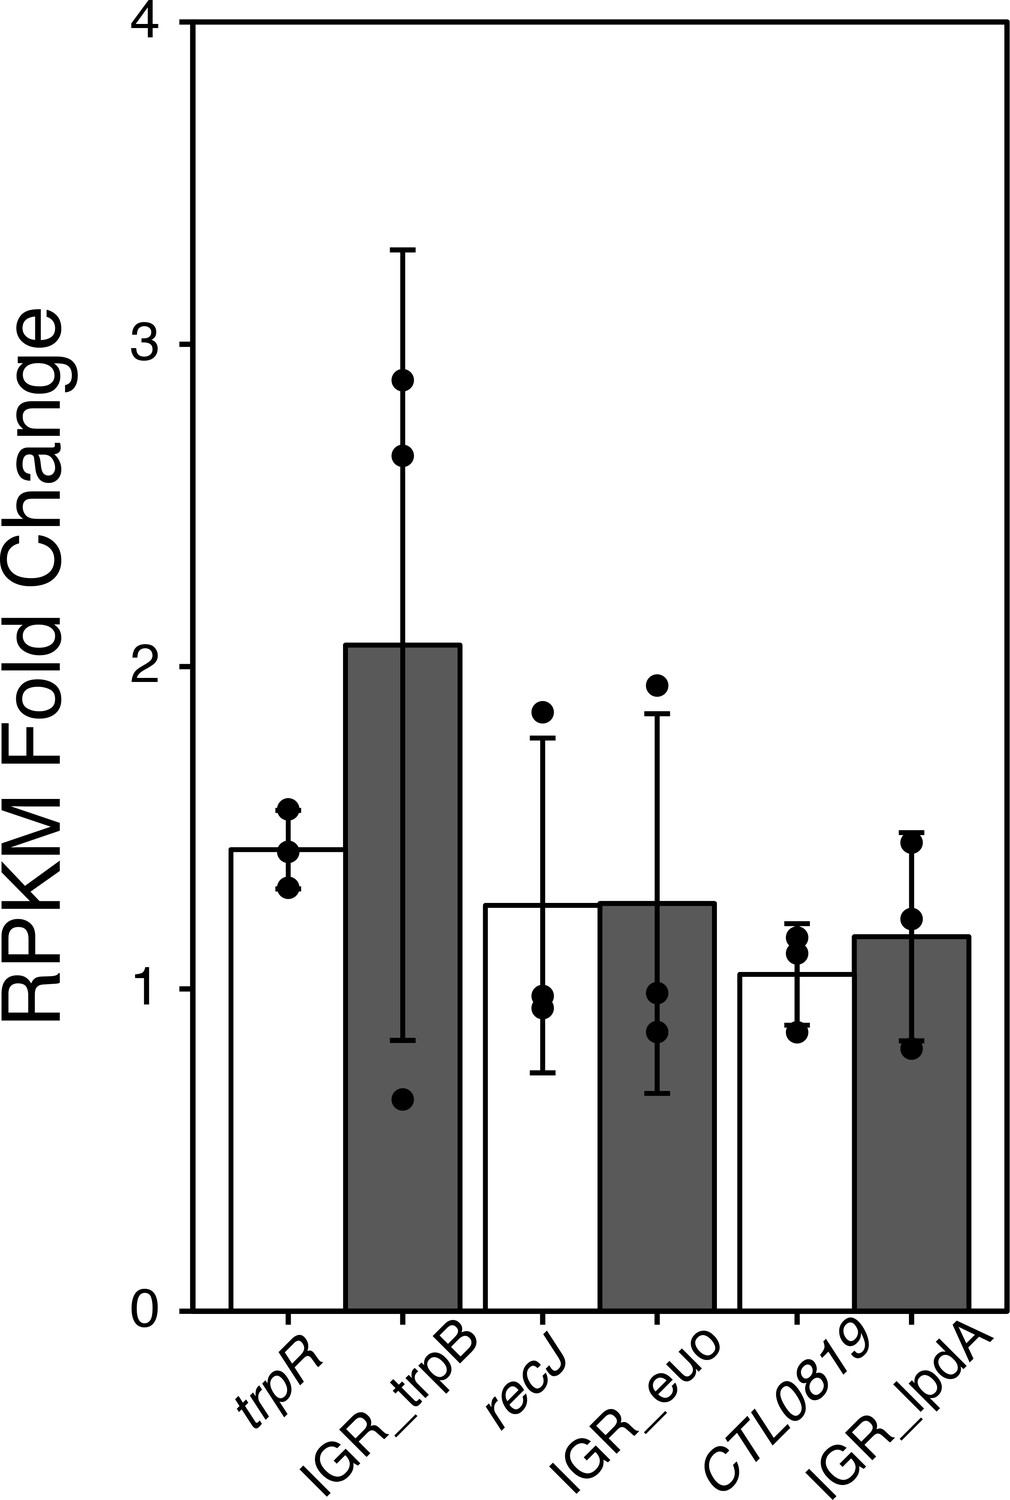
RPKM Fold change analysis from iron-starved RNA-Sequencing data.
Fold change in transcript expression of the trpB, lpdA and euo IGRs (grey bars) along with their corresponding upstream ORFs (white bars) following 6 hr of Bpdl treatment. RPKM values were derived from iron-limited RNA-Sequencing data set (Brinkworth et al., 2018) mapped to a reference genome including intergenic regions that fell between two ORFs in the same coding orientation.
Figure 6—figure supplement 3
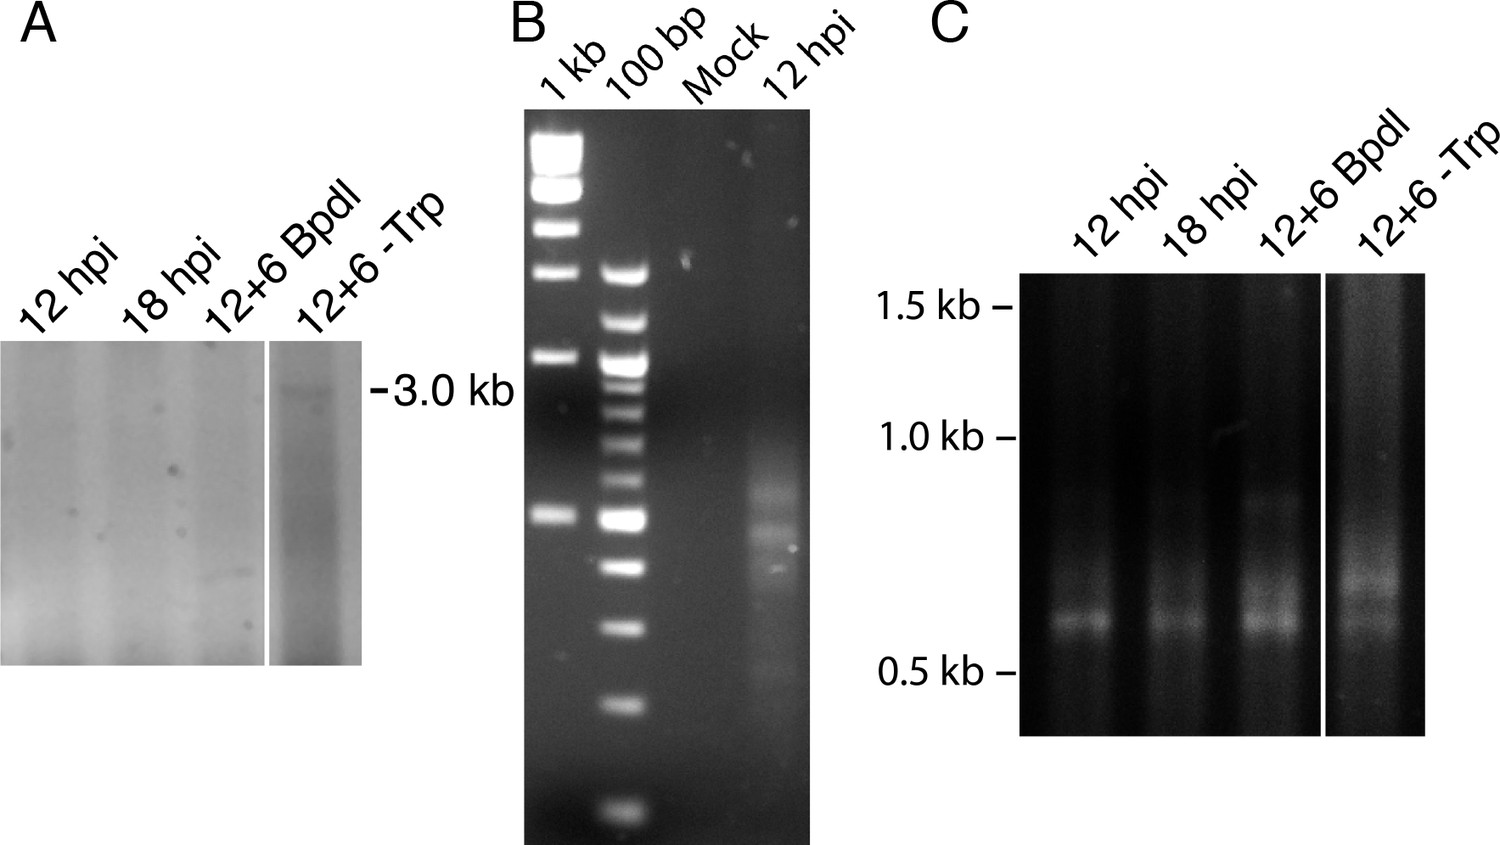
3’-RACE conditions produce Chlamydia-specific products that are amplified in primary RACE.
(A) Contrast-adjusted image to show weak amplification of ~3.0 kb full-length trpRBA transcript in nested 3’-RACE reaction. (B) Total RNA harvested from mock-infected HeLa cells was processed for 3’-RACE in parallel with infected samples to determine specificity of amplified products to Chlamydia-infected cells. No RACE products were detected in the mock-infected sample. (C) Primary products amplified from 3’-RACE were electrophoresed on an agarose gel and visualized. Weak bands that were relatively non-specific were detected in the 3’-RACE primary amplification, emphasizing the utility of producing enhanced specificity in the nested amplification.
Figure 6—figure supplement 4

Mapping of the 3’-RACE products at the individual nucleotide level.
(A) Mapping of the 0.20 kb 3’-RACE product. (B) Mapping of the 0.40 kb 3’-RACE product. (C) Mapping of the 0.45 kb 3’-RACE product. (D) Mapping of the 0.55 kb 3’-RACE product.
Figure 7 with 1 supplement
YtgR mediates iron-dependent transcriptional blockage at the putative operator site in the trpRBA IGR.
(A) Graphical schematic of RT-qPCR amplicons utilized to assess transcriptional readthrough in C. trachomatis-infected HeLa cells at the YtgR operator site. Black lines represent possible transcript species. Colored segments of line indicate unique amplicons. The dotted line indicates that the transcripts reading through the YtgR operator site may prematurely terminate at another site or readthrough the entire operon. (B) RT-qPCR analysis of transcription readthrough at the YtgR operator site in C. trachomatis-infected HeLa cells. Following Bpdl-treatment, readthrough is increased relative to mock-treated cultures 3’ of the YtgR operator site. (C) Graphical schematic of pCCT-RT vector and RT-qPCR amplicons utilized to assess transcriptional readthrough in co-transformed BL21(DE3) E. coli. Black lines represent possible transcript species. Colored segments of line indicate unique amplicons. Note that the lacZ ORF is not drawn to scale. (D) RT-qPCR analysis of transcription readthrough of the pCCT-RT insert in the presence (pET151-YtgR) or absence (pET151-EV) of ectopically expressed recombinant YtgR demonstrates that expression of YtgR significantly reduces transcriptional readthrough of the trpRBA IGR. (E) Ectopic expression of YtgR significantly represses β-galactosidase activity from the pCCT-RT vector as determined by the Miller Assay in co-transformed BL21(DE3) E. coli. For all experiments, N = 3. For single pairwise comparisons, statistical significance was determined by two-sided unpaired Student’s t-test with Welch’s correction for unequal variance. For multiple pairwise comparisons, statistical significance was determined by One-way ANOVA followed by post-hoc pairwise t-tests with Bonferroni’s correction for multiple comparisons. *=p < 0.05, **=p < 0.01, ***=p < 0.005.
-
Figure 7—source data 1
Source data for Figure 7B and D–E, Figure 7—figure supplement 1.
- https://doi.org/10.7554/eLife.42295.025
Figure 7—figure supplement 1

Alternative amplicon 3’ of the YtgR operator site indicates confirmatory increase in transcription readthrough.
(Top) Graphical schematic of RT-qPCR amplicons utilized to assess transcriptional readthrough in C. trachomatis-infected HeLa cells at the YtgR operator site. Black lines represent possible transcript species. Colored segments of line indicate unique amplicons. The dotted line indicates that the transcripts reading through the YtgR operator site may prematurely terminate at another site or readthrough the entire operon. (Bottom) RT-qPCR analysis of transcription readthrough at the YtgR operator site in C. trachomatis-infected HeLa cells. Following Bpdl-treatment, readthrough is increased relative to mock-treated cultures 3’ of the YtgR operator site. Statistical significance was determined by One-way ANOVA followed by post-hoc pairwise t-tests with Bonferroni’s correction for multiple comparisons. N = 3. *=p < 0.05, **=p < 0.01, ***=p < 0.005.
Figure 8 with 1 supplement
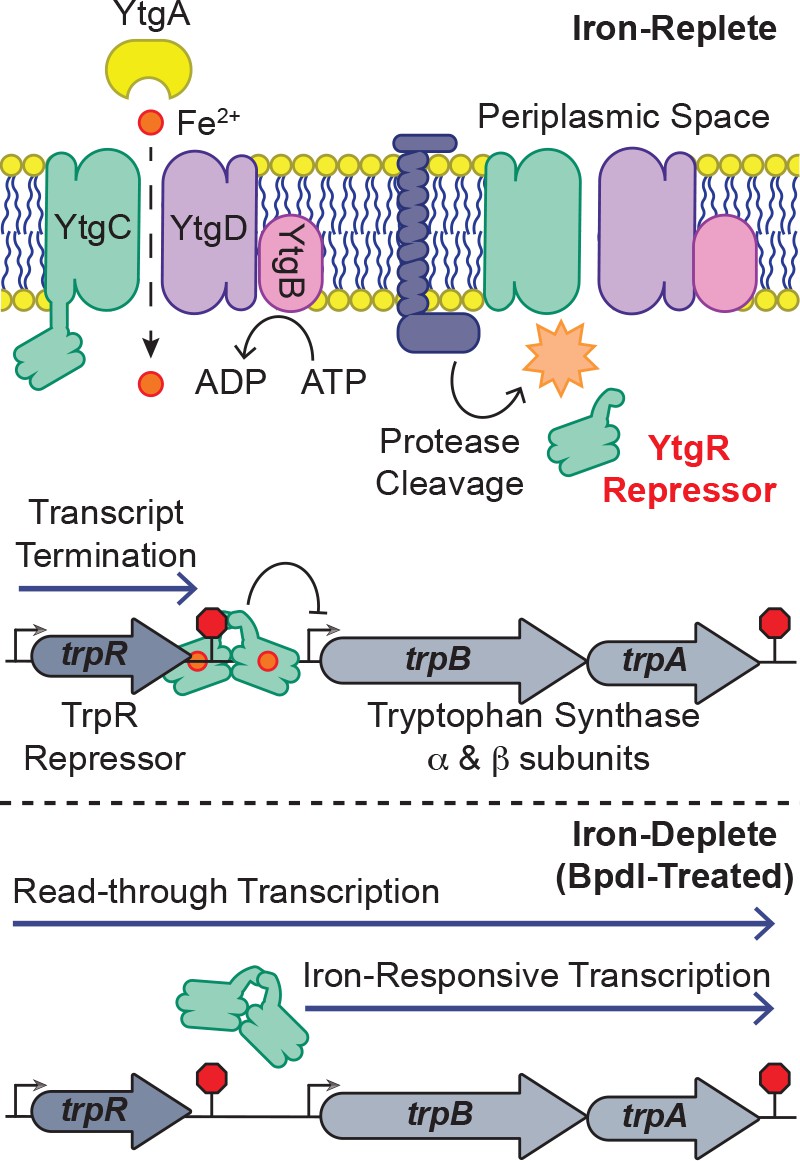
Model for proposed mechanism of iron-dependent YtgR-mediated regulation of trpRBA expression.
Iron is imported through the YtgABCD ABC-type metal permease complex. YtgR is cleaved from the YtgCR permease-repressor fusion protein. In the presence of sufficient iron, holo-YtgR can bind to the trpRBA IGR to both terminate basal transcription from the primary trpR promoter and repress transcription initiation at the alternative trpBA promoter. Iron depletion inactivates YtgR DNA-binding, thus promoting read-through of basal transcription from the trpR promoter while also inducing transcription at the downstream trpBA promoter.
Figure 8—figure supplement 1
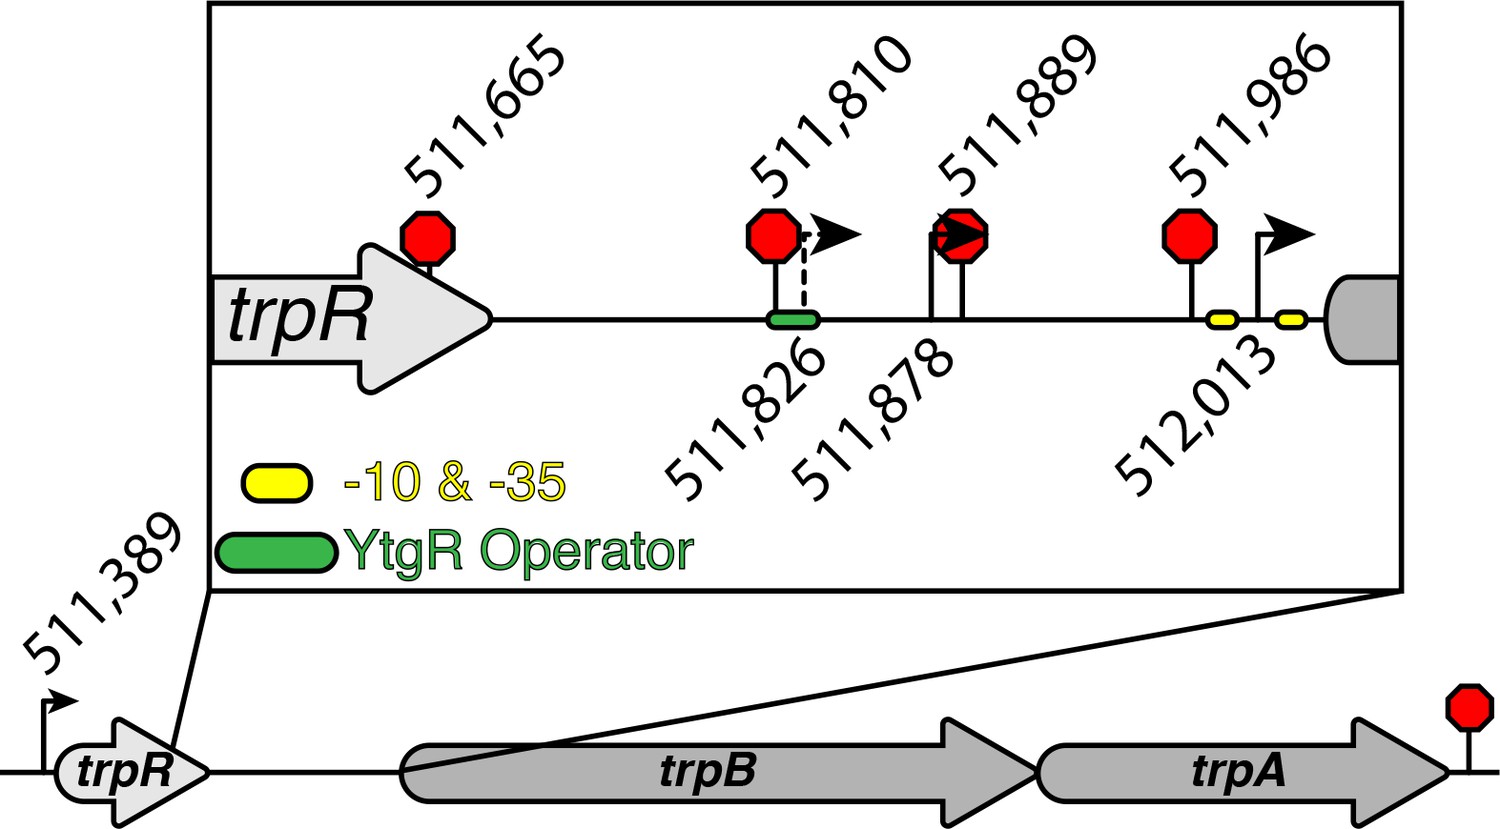
Comprehensive graphic of trpRBA T(S/T)S landscape.
The nucleotide position in the C. trachomatis L2 434/Bu genome of all T(S/T)Ss are represented by the weighted mean of the population of mapped sites. Those displayed below the operon are for the TSSs, while those displayed above the operon are for the TTSs. The previously identified alternative transcriptional start site (Carlson et al., 2006) is represented by a dotted line. The consensus σ66 -10 and −35 promoter elements are indicated by the yellow ovals flanking the alt. TSS immediately upstream of trpB (512,013). The putative YtgR operator sequence is denoted by the green oval. Note that the termination site downstream of trpA is not labeled with an exact nucleotide position as we were unable to clone and sequence the 3’-RACE products of that transcript species in this study.
Tables
Key resources table
| Reagent type (species) or resource | Designation | Source or reference | Identifiers | Additional information |
|---|---|---|---|---|
| Gene (Chlamydia trachomatis) | YtgR | Thompson et al., 2012 | CTL0325 | C-terminal 139 amino acids of YtgC |
| Strain, strain background (Chlamydia trachomatis) | L2 434/Bu | other | NC_010287 | No RRID |
| Strain, strain background (Escherichia coli) | BL21(DE3) | Sigma-Aldrich | CMC0016 | Electrocompetent cells |
| Cell line (Homo sapiens) | HeLa 229 | ATCC | RRID:CVCL_1276 | cervical adenocarcinoma epithelial cells |
| Antibody | His-Tag (D3I1O) XP | Cell Signaling Technology | RRID:AB_2744546 | Conditions used are described in Materials and methods |
| Recombinant DNA reagent | ||||
| Sequence-based reagent | pCCT101 | Thompson et al., 2012 | Reporter gene plasmid for lacZ two-plasmid assay | |
| Sequence-based reagent | pET151/D-TOPO | Invitrogen | K15101 | |
| Commercial assay or kit | RiboPure RNA Purification Kit, bacteria | Invitrogen | AM1925 | Modifications to manufacturer protocol described in Materials and methods |
| Commercial assay or kit | SMARTer RACE 5’/3’ Kit | Takara Bio | 634859 | Modifications to manufacturer protocol described in Materials and methods |
| Chemical compound, drug | 2,2-bipyridyl (Bpdl) | Sigma-Aldrich | D216305 | Prepared at100 mM in 100% Ethanol; used at 100 µM working concentration |
| Software, algorithm | R Studio | http://www.rstudio.com/ | RStudio Team (2016). RStudio: Integrated Development for R. RStudio, Inc, Boston, MA |
Additional files
-
Source code 1
Template R code for generation of histogram with overlaid density plot as depicted in Figures 4C and 6C.
- https://doi.org/10.7554/eLife.42295.028
-
Source code 2
Template R code for computation of One-Way ANOVA with post-hoc pairwise t-tests.
- https://doi.org/10.7554/eLife.42295.029
-
Source code 3
Template R code for computation of two-sample t-test with Welch’s correction for unequal variance.
- https://doi.org/10.7554/eLife.42295.030
-
Supplementary file 1
5’-RACE BLAST dataset.
- https://doi.org/10.7554/eLife.42295.031
-
Supplementary file 2
3’-RACE BLAST dataset.
- https://doi.org/10.7554/eLife.42295.032
-
Supplementary file 3
5’-RACE Sequence dataset.
- https://doi.org/10.7554/eLife.42295.033
-
Supplementary file 4
3’-RACE Sequence dataset.
- https://doi.org/10.7554/eLife.42295.034
-
Supplementary file 5
Primers used in this study.
- https://doi.org/10.7554/eLife.42295.035
-
Supplementary file 6
Plasmids used in this study.
- https://doi.org/10.7554/eLife.42295.036
-
Transparent reporting form
- https://doi.org/10.7554/eLife.42295.037
Download links
A two-part list of links to download the article, or parts of the article, in various formats.
Downloads (link to download the article as PDF)
Open citations (links to open the citations from this article in various online reference manager services)
Cite this article (links to download the citations from this article in formats compatible with various reference manager tools)
A bipartite iron-dependent transcriptional regulation of the tryptophan salvage pathway in Chlamydia trachomatis
eLife 8:e42295.
https://doi.org/10.7554/eLife.42295


